
 Open Access Article
 This Open Access Article is licensed under a Creative Commons Attribution-Non Commercial 3.0 Unported Licence
Growth inhibition of Microcystic aeruginosa by metal–organic frameworks: effect of variety, metal ion and organic ligand†
Gongduan Fan *ab,
Liang Honga,
Xiaomei Zhenga,
Jinjin Zhoua,
Jiajun Zhana,
Zhong Chena and
Siyuan Liua
*ab,
Liang Honga,
Xiaomei Zhenga,
Jinjin Zhoua,
Jiajun Zhana,
Zhong Chena and
Siyuan Liua
aCollege of Civil Engineering, Fuzhou University, 350116 Fujian, China. E-mail: fgdfz@fzu.edu.cn
bDepartment of Chemical & Environmental Engineering, University of Arizona, 1133 E James E Rogers Way, Harshbarger 108, Tucson, AZ 85721-0011, USA
First published on 15th October 2018
Abstract
Metal–organic frameworks (MOFs), as a new type of nanomaterial, have been rapidly developed and widely applied in the environmental area. However, the algae removal efficiency of MOFs, the effect of metal ions and organic ligands contained in MOFs and the stability of MOFs in water need further study. Based on the characteristics of algae, five types of MOFs, which were Cu-MOF-74, Zn-MOF-74, ZIF-8, Ag/AgCl@ZIF-8 and MIL-125(Ti) were synthesized and characterized by X-ray diffractometer (XRD), field emission scanning electron microscope (FESEM), and X-ray photoelectron spectroscopy (XPS). The effect of MOFs on the growth of Microcystis aeruginosa was comparatively studied, and the inhibition mechanism of MOFs on algae as well as the stability of MOFs was explored. Results showed that all of the as-synthetic MOFs had superior stability in water, and the order of stability of MOFs followed the order MIL-125(Ti) > Cu-MOF-74 > Ag/AgCl@ZIF-8 > ZIF-8 > Zn-MOF-74. The types of metal ions and organic ligands doped in MOFs have grade affected the inhibitory efficiency on the algae: containing Cu2+ and Ag+ ions, MOFs had more significant inhibitory capacity to algae than those containing Zn2+ ions; meanwhile, compared with MOFs which are assembled with 2,5-dihydroxyterephthalic acid (DHTA) organic ligands, MOFs containing 2-methylimidazole (GC) organic contributed to the removal of algae significantly. The order of inhibitory effects of algae by five MOFs follows the order Cu-MOF-74 > Ag/AgCl@ZIF-8 > ZIF-8 > Zn-MOF-74 > MIL-125(Ti). The physiological characteristics of algal cells were changed after being treated with different concentrations of Cu-MOF-74. Once the concentration of Cu-MOF-74 reached 1 mg L−1, the algal cells began to be inhibited, the relative inhibition rate of algal cells at 120 h was over 400%, and the inhibition process fitted pseudo-second-order kinetic model well. The Cu2+ released by Cu-MOF-74 that the concentration higher than 1 mg L−1 would lead to the destruction of algae cell morphology and the loss of cell integrity, causing cell contents to be partially released into the water, promoting the accumulation and precipitation of algal cells which were destabilizing already to achieve the purpose of inhibition of algae. In summary, MOFs can be used to inhibit the growth of cyanobacteria and have a promising application prospect.
1 Introduction
In recent decades, harmful cyanobacteria blooms have frequently occurred in the eutrophic waters throughout the world.1–3 Cyanobacteria blooms have serious impacts on the quality of water environment, causing imbalance of aquatic ecosystems4 and endangering the safety of aquatic organisms and humans.5,6 Therefore, we urgently need an effective technique to remove cyanobacteria and control cyanobacteria blooms. To control and eliminate harmful algal blooms, physical, chemical, and biological algae removal techniques, including ultrasonic method,7 reagent addition method,8 and biological interaction9 have been commonly applied. However, these conventional treatments suffer from drawbacks that limit their applicability such as relatively high cost, poor environmental acceptability, inefficiency of algae removal and so on. For example, the ultrasonic method has a high operating cost;10 direct addition of pesticides will cause adverse effects on organisms11 as a result of secondary pollution;12 and biological interaction has low algae removal efficiency.13 Therefore, it is still urgent to develop new remediation methods for the application of controlling cyanobacterial blooms, especially on the large-scale.Nanomaterials have been widely used in the field of environmental modification and remediation for their advantages of high activity, low cost, and strong adsorption capacity.14,15 Nanomaterials can effectively inhibit the growth of algae cells, and their inhibition mechanism may include effects of metal ions,16 oxidative damage of ROS17,18 etc. Park et al.19 found that the inhibition efficiency of Microcystis aeruginosa (M. aeruginosa) was up to 87% when it was treated by 1 mg L−1 nano-Ag. As a kind of porous nanocrystalline materials with periodic multidimensional network structure formed by self-assembly of metal ions and organic ligands such as aromatic polyacid through coordination, metal–organic frameworks (MOFs) have many advantages such as large surface area, high porosity, good thermal stability and easy to regulate physical and chemical properties.14,15 Their structure and properties give them great potential to be used in many fields such as catalysis, adsorption and environment.20,21 In the environmental area, MOFs have been proved to degrade organic dyes effectively in wastewater, Chandra et al.22 degraded rhodamine B and methylene blue in visible light using ZIF-8 loaded nano-TiO2, and the removal rates of rhodamine B and methylene blue were 64.8%, and 87.5% respectively. In the catalysis field, MOFs have ability to remove drug residues from water bodies, Cao Yang et al.23 used a MOF which was synthesized by MIL-68(In)–NH2 and graphene oxide (GrO) for the photodegradation of amoxicillin, with the removal rate of 93%.
MOFs based on varies metal ions such as Cu2+, Zn2+, Ag+ have different effects on the growth of algal cells.24,25 Furthermore, Keila Martin-Betancor et al.26 found that the TAZ ligand in Ag-TAZ (50 mg L−1) can cause 35% inhibition effect on Anabaena. The interactive affect between different ligands and metal ions, the effect on the morphology as well as the property of algae removal of MOFs due to the combination of different ligands with different metal ions were rarely studied, however, it is very important to select appropriate metal ions and ligands to synthesize corresponding MOFs according to the characteristics of algae to remove algae. In addition, Gu et al.27 used Zn–Fe-LDHs (250 mg L−1) as photocatalyst to inactivate the M. aeruginosa under visible light, the content of chlorophyll a decreased by 80.6%, which indicated the growth of M. aeruginosa was inhibited to some extent. However, this study only showed that the high concentration of MOFs material (Zn–Fe-LDHs) has inhibitory effect on algal cells, the impacts of MOFs material structure, metal ions and organic ligands on the inhibition of algae, the discipline between MOFs concentration and inhibition of algal, and the inhibition mechanism of algal cells by MOFs have not been further studied.
Therefore, according to the characteristics of algae, algae-sensitive metal ions such as Cu2+, Zn2+, Ag+ and organic ligands such as 2,5-dihydroxyterephthalic acid (DHTA), 2-methylimidazole (GC) and 1-4-dicarboxybenzene (PTA) were used to synthesize five MOFs materials including Cu-MOF-74, Zn-MOF-74, ZIF-8, Ag/AgCl@ZIF-8 and MIL-125(Ti). The physical properties of the five materials including composition and morphologies were characterized by x-radiation diffraction (XRD) and field emission scanning electron microscope (FESEM). The responses of the algae to prepared MOFs which were formed by the combination of different ions Cu2+, Zn2+, Ag+ and different organic ligands DHTA, GC and PTA were studied. The discipline between the concentration of Cu-MOF-74 and the growth inhibition of algal cells, the effect of Cu-MOF-74 on the physiological characteristics of algal cells and the relevant inhibitive mechanism of algal by Cu-MOF-74 were explored, in expect to provide a theoretical basis for the application of MOFs in controlling and removing cyanobacterial cells in water.
2 Experiment and methods
2.1 Cyanobacteria inhibition experiment
![[thin space (1/6-em)]](https://www.rsc.org/images/entities/char_2009.gif) :10 h light–dark cycle. During the culture, the conical flask was shaken 3 times a day to ensure the normal growth of M. aeruginosa to the experimentally required growth capacity and absorbance.
:10 h light–dark cycle. During the culture, the conical flask was shaken 3 times a day to ensure the normal growth of M. aeruginosa to the experimentally required growth capacity and absorbance.MOFs, ligand and metal ions stock solution (1000 mg L−1) was acquired by adding 0.01 g MOFs or ligand into 10 mL newly prepared BG-11 medium and underwent ultrasonic dispersion (40 kHz, 100 W) for 15 min.
:10 h light–dark cycle by the illumination of 2000 lx tubular fluorescent lamp. The concentration of algal cells was measured using an UV-visible spectrophotometer (UV-Vis 2450, Shimadzu, Japan) with a wavelength of 680 nm at 2, 24, 48, 72, 96, and 120 h, respectively, since the optical density at 680 nm (OD680) is linearly correlated with the algal cell concentration.The growth inhibition rate of algal cells at different concentrations of MOFs was calculated by the inhibition rate formula (1) and (2) based on the specific growth rate:30
 | (1) |
 | (2) |
:10 h light–dark cycle by the illumination of 2000 lx tubular fluorescent lamp. The Zeta potentials of algal cell solution in the control and different experimental groups were measured using a Zetasizer (Nano ZS90, Malvern, UK) at 2, 24, 48, 72, 96 and 120 h.:10 h light–dark cycle by the illumination of 2000 lx tubular fluorescent lamp. The concentration of algal cell was measured using an UV-visible spectrophotometer with a wavelength of 680 nm at 24, 48, 72, 96, and 120 h, respectively.:10 h light–dark cycle by the illumination of 2000 lx tubular fluorescent lamp. The concentration of algal cell was measured using an UV-visible spectrophotometer with a wavelength of 680 nm at 24, 48, 72, 96, and 120 h, respectively.2.2 Cyanobacteria physiological characteristics experiment
000 cells was collected by the FL3 channel.2.3 Cyanobacteria inhibition mechanism experiment
000 rpm for 20 min at room temperature. The collected supernatant was filtered through 0.22 μm filter, and then the concentration of Cu2+ released from Cu-MOF-74 (1 mg L−1) in supernatant was measured by inductively coupled plasma emission spectrometer (Optima 8000, PerkinElmer, US). Based on the measured Cu2+ concentration, used CuSO4·5H2O as an additional ion, and to control the concentration of CuSO4·5H2O solution slightly higher than the equilibrium concentration of Cu2+ released by Cu-MOF-74 as a control group, then added equal amounts of the two solutions to the equal volume of algal cells suspension respectively. After that, shaking meanwhile sampling every 24 h, and the OD680 values were analyzed by three-dimensional fluorescence spectrometer (EEMFS5, Edinburgh Instruments, UK).3 Result and discussion
3.1 Characterization of MOFs
From the survey scan spectrum in Fig. S3,† Ag/AgCl@ZIF-8 was composed by Zn, Ag, Cl, C, N and O elements. The binding energy sites of C 1s and N 1s in Ag/AgCl@ZIF-8 were at 284.55 eV and 398.65 eV respectively, and the bond energy sites of N 1s (398.65 eV) explain the existence of C–N bond and 2-methylimidazole.34 The specific peaks of Ag 3d could be attributed to the Ag 3d3/2 (373.9 eV) and Ag 3d5/2 (367.9 eV), which on behalf of the presence of Ag+ and Ag0; the specific peaks of Zn 2p could be attributed to the Zn 2p3/2 (1021.25 eV) and Zn 2p1/2 (1044.3 eV), which were consistent with the exist of Zn2+; and the characteristic peak of Cl 2p were consisted by characteristic peaks of Cl 2p1/2 (198 eV) and Cl 2p3/2 (199 eV).35 The above XPS results confirm the existed of ZIF-8 in Ag/AgCl@ZIF-8, which are accordant with XRD results.
From the survey scan spectrum in Fig. S4,† Zn-MOF-74 contains elements such as Zn, N, O, C, etc. The Zn 2p spectrum exhibits two contributions, Zn 2p3/2 and Zn 2p1/2, located at respectively 1021.3 and 1044.3 eV, which can be assigned to Zn2+.35 The characteristic peaks of N 1s (400.5 eV), O 1s (531.75 eV), C 1s (284.5 and 288.5 eV) of Zn-MOF-74 were basically the same as Cu-MOF-74. However, the skewing of the characteristic peak position of N 1s, O 1s and C 1s and the newly added characteristic peak of C 1s may due to the formation of C![[double bond, length as m-dash]](https://www.rsc.org/images/entities/char_e001.gif) O (288.5 eV), CC (284.6 eV), CN (400.6 eV).
O (288.5 eV), CC (284.6 eV), CN (400.6 eV).
From the survey scan spectrum in Fig. S5,† the elemental composition of Cu-MOF-74 included Cu, N, O, and C. The coexistence of Cu+ and Cu2+ in Cu-MOF-74 was evidenced by the main peak of Cu 2p1/2, which was assigned to Cu+. The other main peak of Cu 2p3/2 and its shakeup satellite were due to Cu2+.36 And the N 1s (399.75 eV), O 1s (531.25 eV), C 1s (285 eV) spectrum clearly evidences the presence of organic acid (2,5-dihydroxyterephthalic acid). The above XPS results confirm the existed of MOF-74 in Cu-MOF-74, which are accordant with XRD results.
From the survey scan spectrum in Fig. S6,† the main elements of ZIF-8 were composed of Zn O, C, N, etc. The specific peaks of Zn 2p could be attributed to the Zn 2p3/2 (1021.3 eV) and Zn 2p1/2 (1044.3 eV), which were consistent with the exist of Zn2+. The spectrum of C 1s, O 1s and N 1s demonstrated the existence of C–N, C–C, CO and 2-methylimidazole, which further confirmed the successful synthesis of ZIF-8.34,35
From the survey scan spectrum in Fig. S7,† the elemental composition of MIL-125(Ti) included Ti, O, and C.37 The Ti 2p spectrum of MIL-125(Ti) were observed at 458.8 eV and 464.5 eV, indicated that titanium combined with oxygen to remain in oxidation state IV.38 The O 1s spectrum exhibited two peaks, located at 530.4 and 532.1 eV, can be ascribed to oxygen in titanium; the specific peaks of C 1s could be attributed to C–C (284.1 eV)38 and CO (288.1 eV). The above XPS results confirm the successful synthesis of MIL-125(Ti).38
3.2 Inhibition characterization of cyanobacterial using MOFs
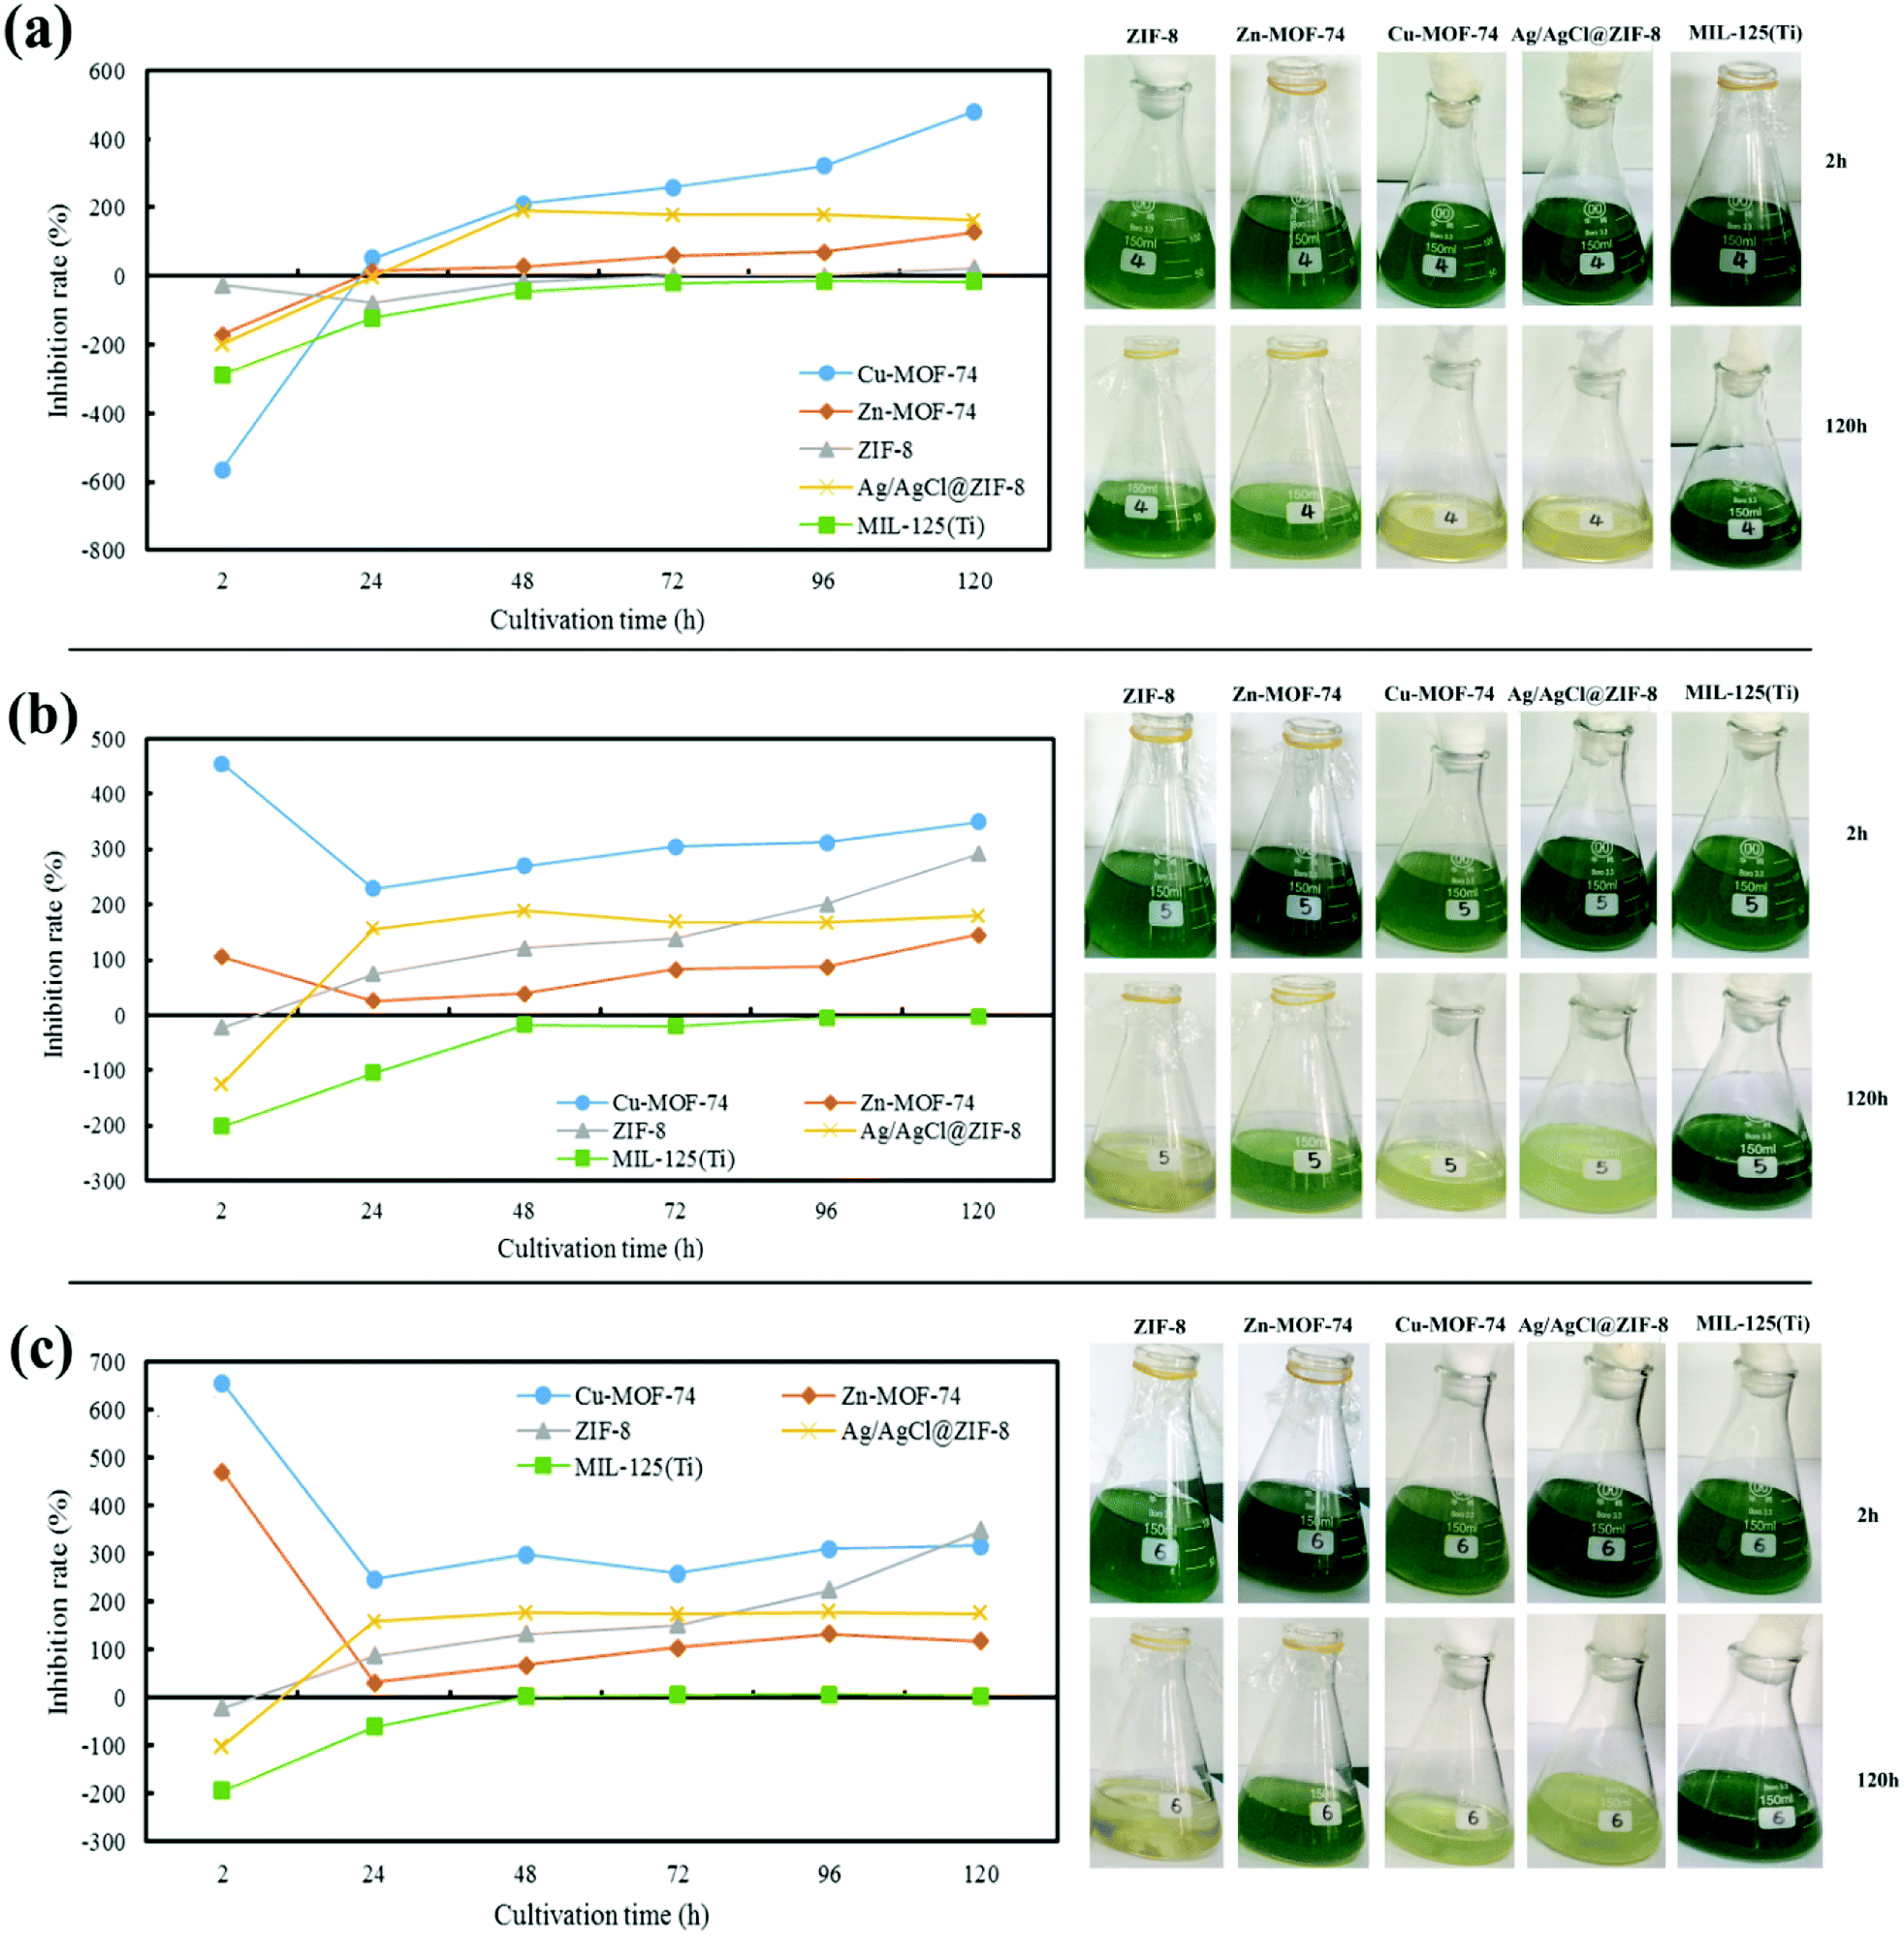 | ||
| Fig. 1 Effects of MOFs on algae under different concentrations: (a) 1 mg L−1, (b) 5 mg L−1, (c) 10 mg L−1. | ||
The above results showed that when algal cells were exposed to each MOFs, of which the concentration reached a certain threshold, the growth of algal cells will be inhibited in different degrees. It may because the distinct of interaction between different types of metal ions and ligands existed in MOFs caused the different dissolving quantity and releasing rate39 of metal ions from MOFs in aqueous solutions. In addition, the toxicity of these MOFs mainly depended on the dissolved metal ions, and the sensitivity of M. aeruginosa to different metal ions dissolved in water was different. Just as Cu-MOF-74 had the best algal inhibition ability, probably due to the presence of phycocyanin in M. aeruginosa which was extremely sensitive to Cu2+.
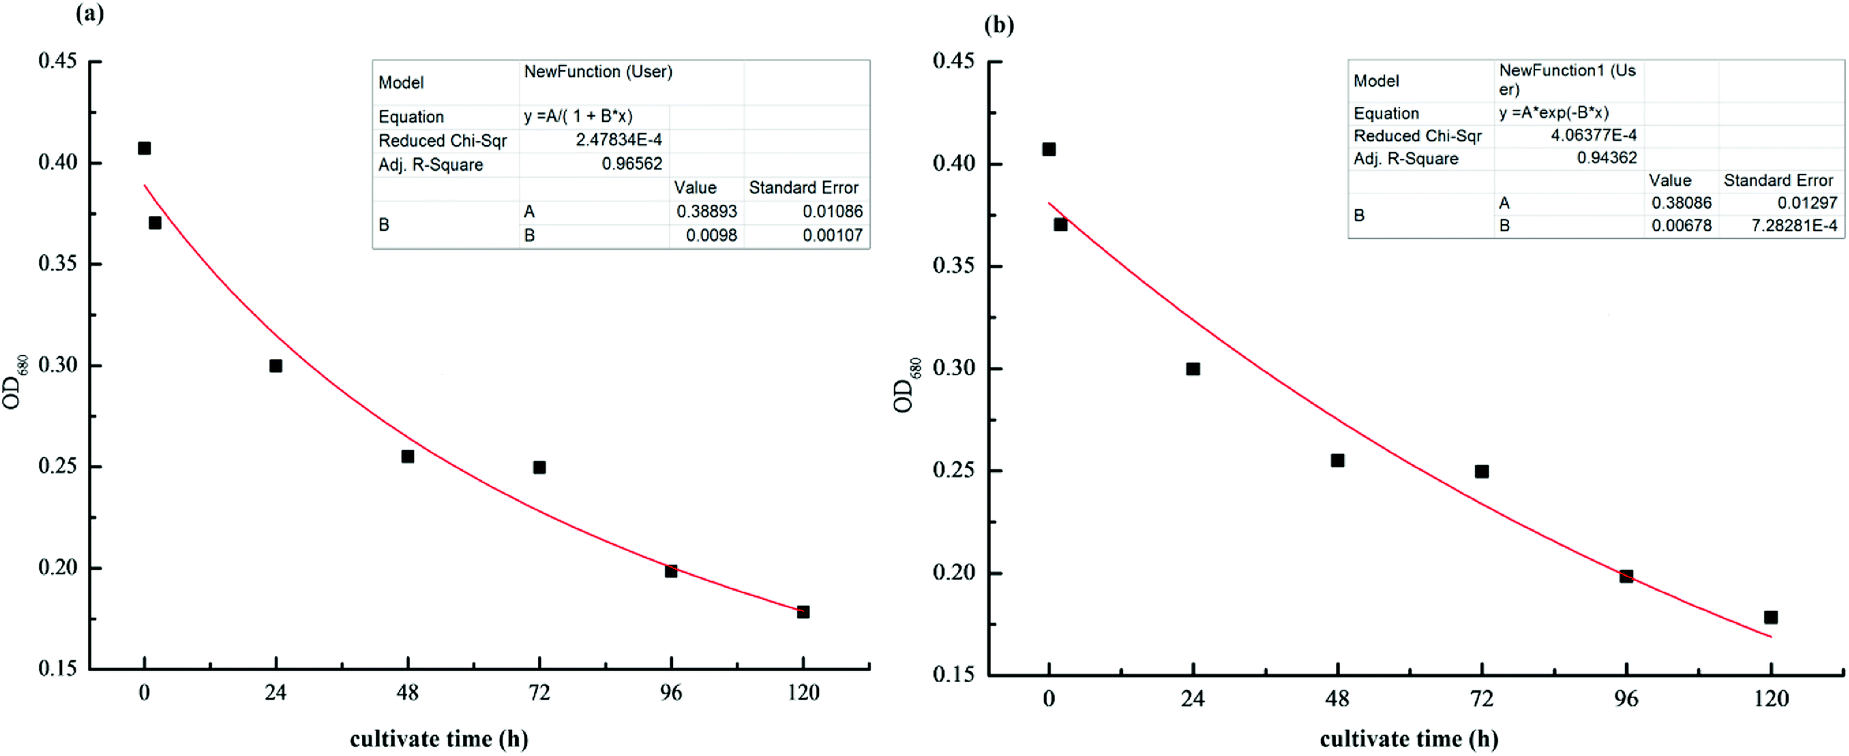 | ||
| Fig. 2 Growth kinetic model for the inhibition of M. aeruginosa at a concentration of 10 mg L−1 Cu-MOF-74: (a) quasi-secondary-order growth kinetic mode. (b) Quasi-first-order growth kinetic model. | ||
By comparing the pseudo-first-order kinetic model (S12 = 4.06 × 10⁻⁴, R12 = 0.944) and the pseudo-second-order kinetic model (S22 = 2.48 × 10⁻⁴, R22 = 0.966), it was found that inhibition of growth of M. aeruginosa by MOFs primely followed the pseudo-second-order kinetics fitting model and the reaction equation was 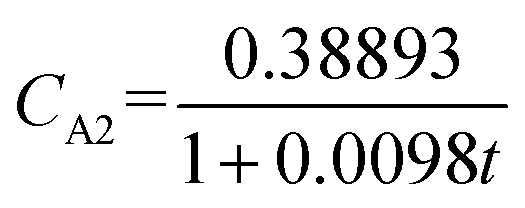 .
.
3.3 Inhibition characterization of cyanobacterial using ligands
The effect of ligand concentration on algal cells is shown in Fig. 3. The experimental results are consistent with the experimental results of Keila Martín-Betancor et al.26 Compared with the control group (0 mg L−1), the ligands (DHTA, PTA, GC) all have a no-significant inhibitory effect on algae, which is merely performed by a decrease in the proliferation rate of the algae cells. Low concentration of ligand (1 mg L−1) has indistinctively effect on algae cells, even at a concentration of 1 mg L−1, DHTA promoted the growth of algae cells, but as the dosage of ligands was further increased, the growth of algae cells was further inhibited.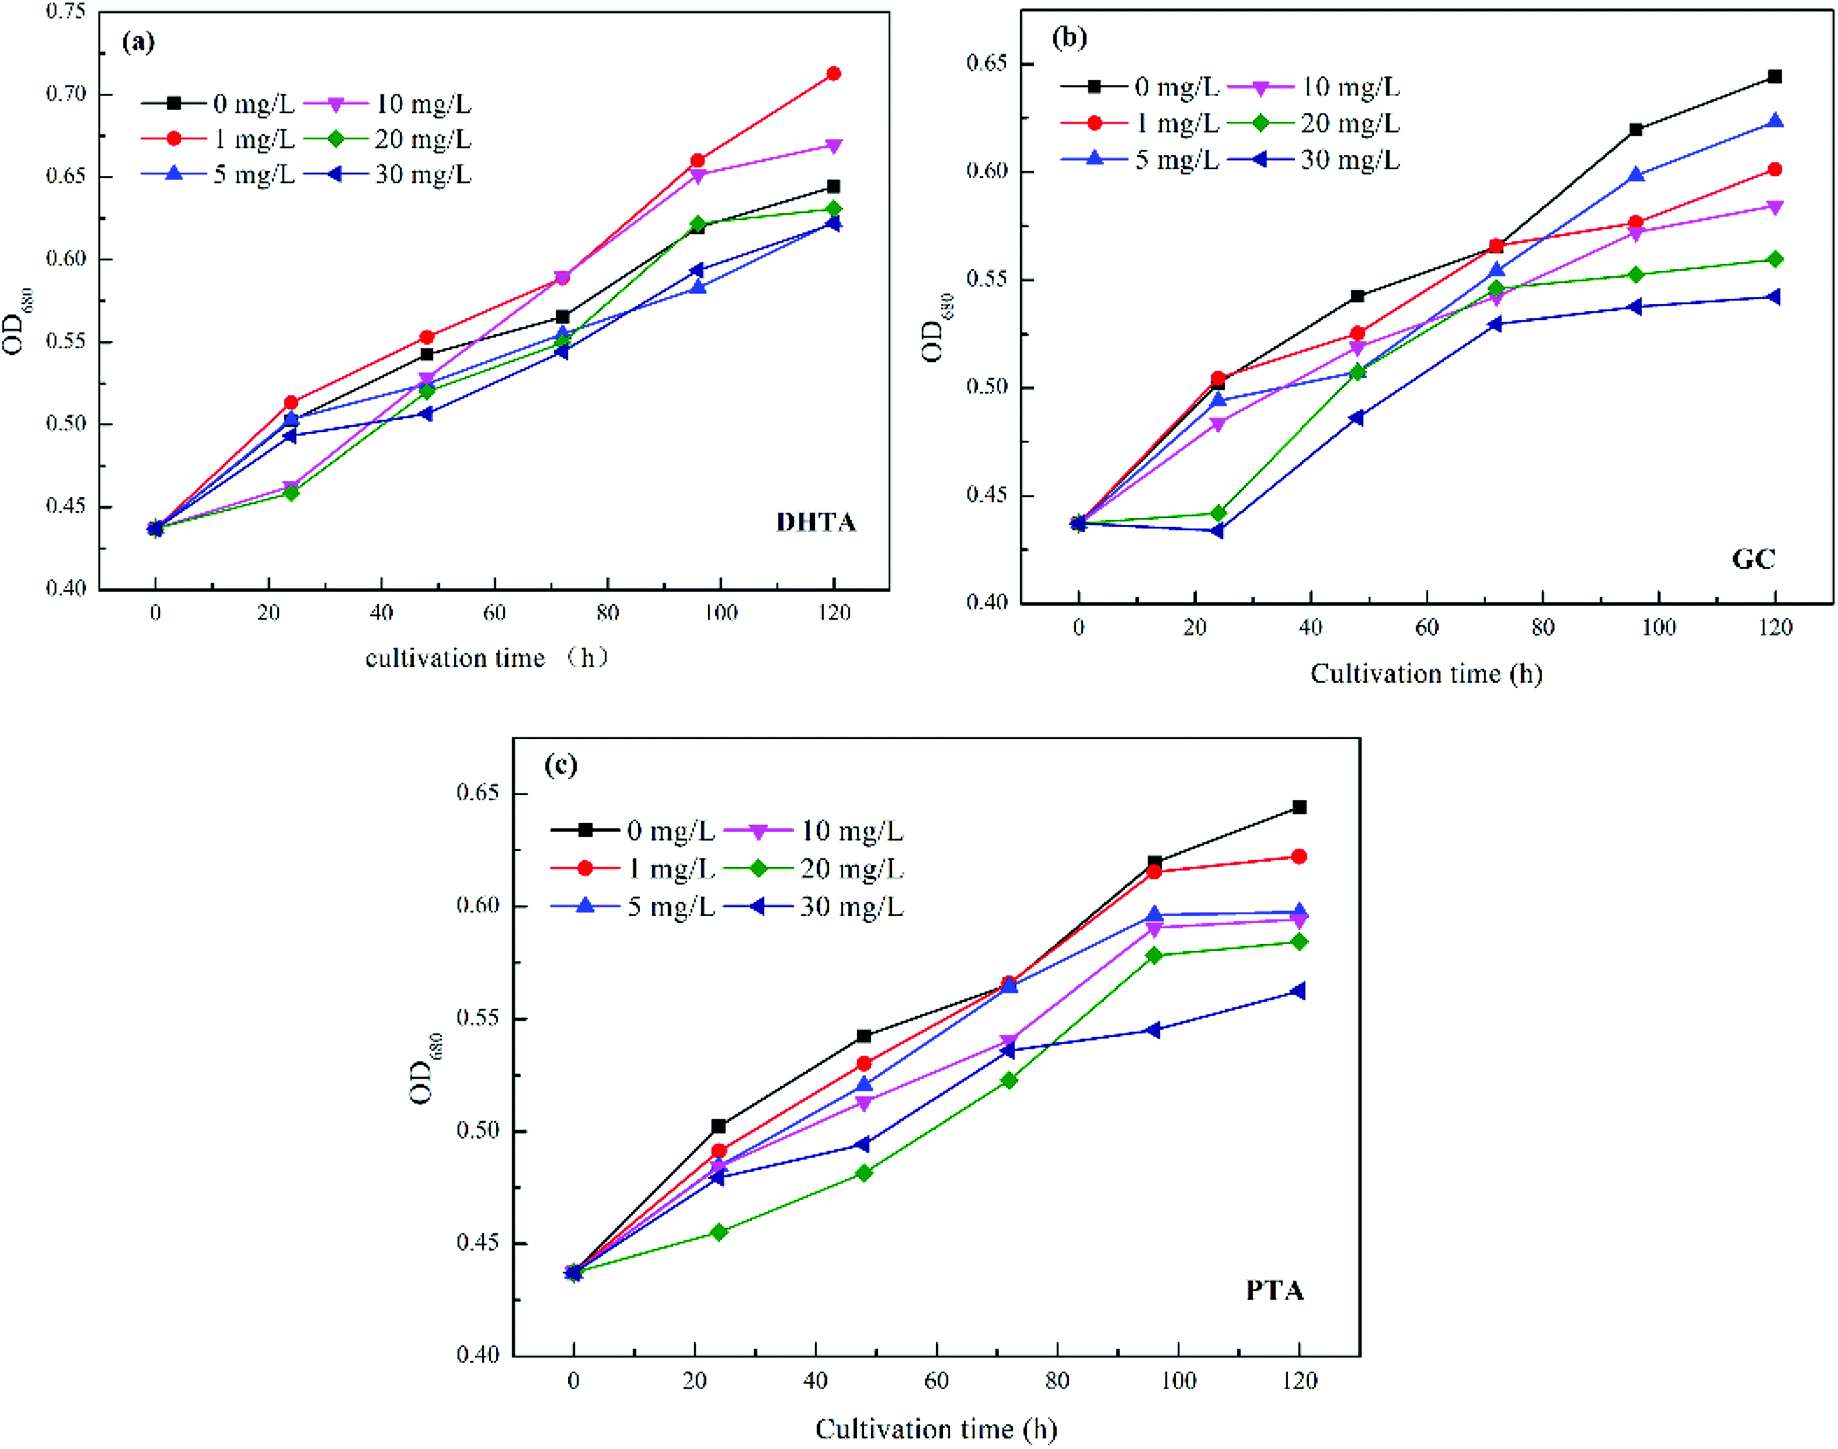 | ||
| Fig. 3 Effects of different concentrations of ligands on algae cells: (a) DHTA, (b) GC, (c) PTA. | ||
And the effect of ligand species on algal cells is shown in Fig. 4. It can be seen that the inhibitory rate of the three ligands on algae cells basically presented for DHTA < PTA < GC. The distinction in the effect of the ligand to inhibit algal cells may be caused by the different solubility of the ligand, which was exhibiting the rule of DHTA < PTA < GC.
 | ||
| Fig. 4 Effect of ligand species on algae under different ligand concentrations: (a) 1 mg L−1, (b) 5 mg L−1, (c) 10 mg L−1, (d) 20 mg L−1, (e) 30 mg L−1. | ||
3.4 Comparative experiment on the algae inhibition effect between Cu-MOF-74, P25 and metal ions
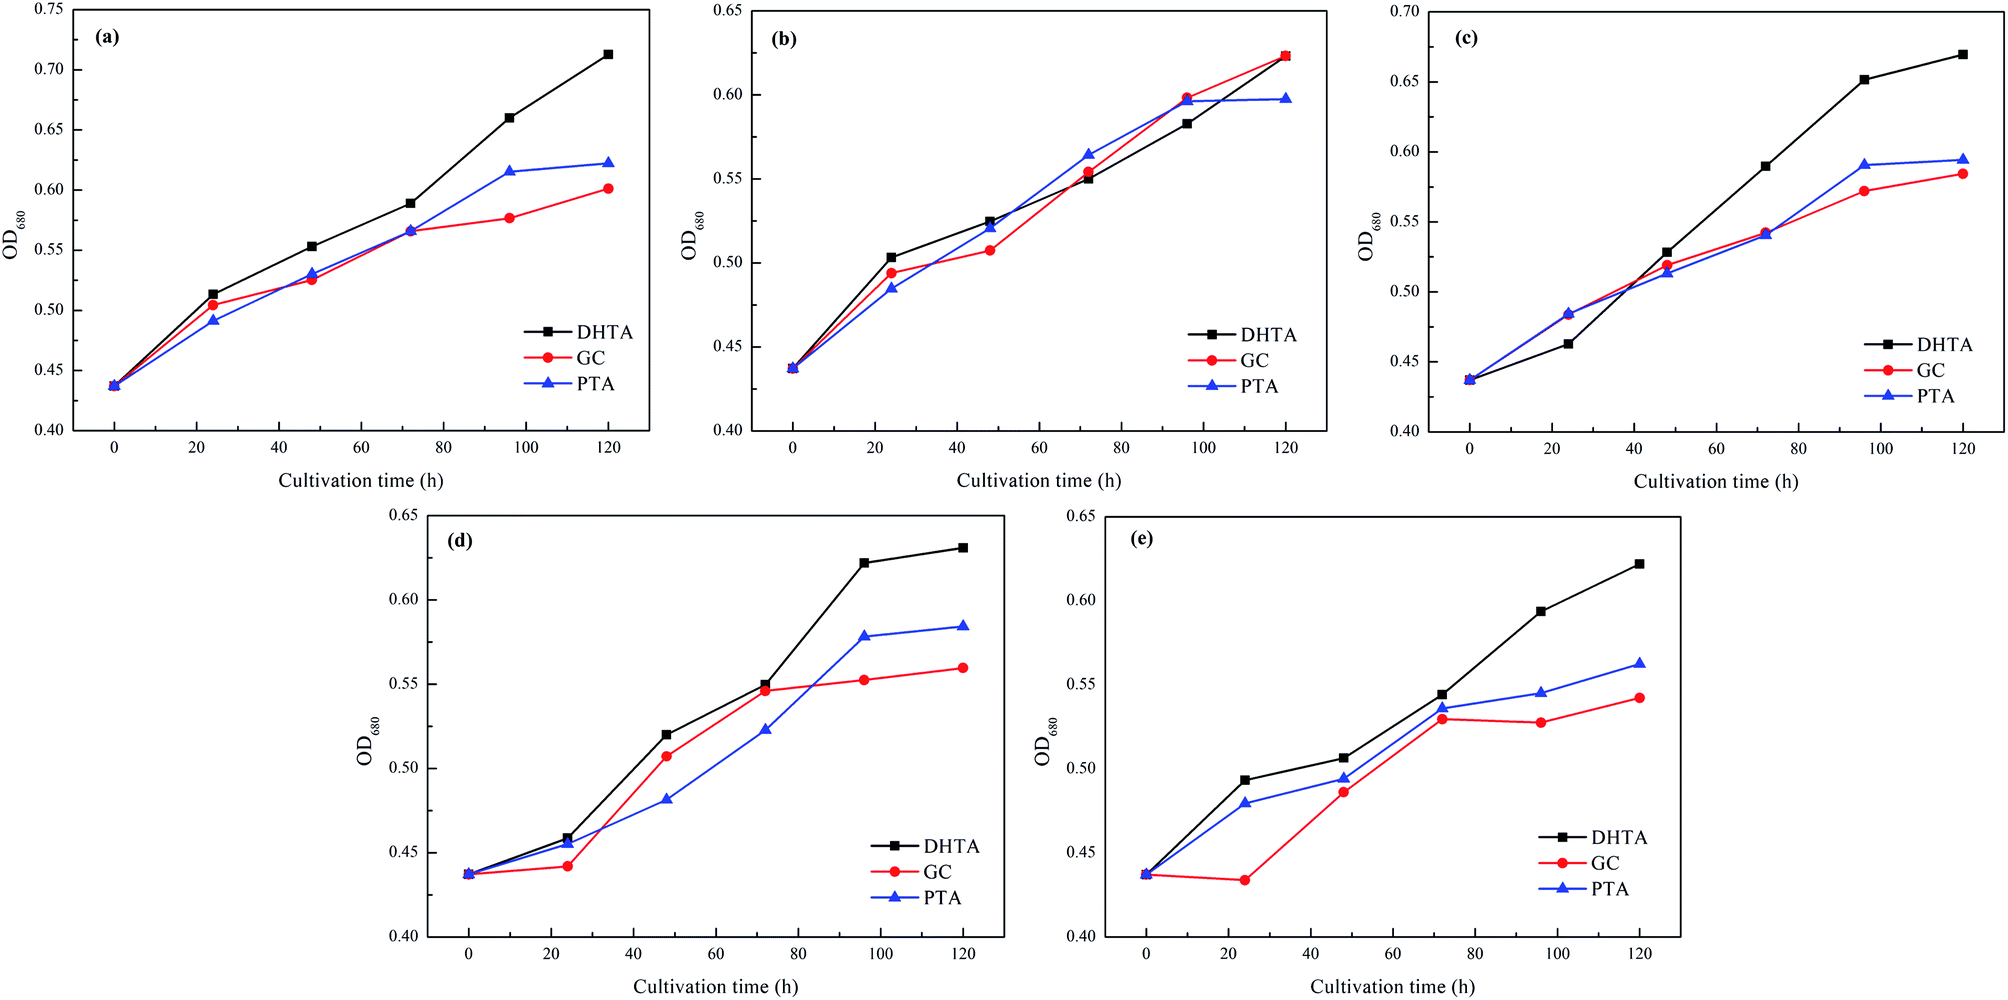
The effects of Cu-MOF-74, metal ions (Ag+, Cu2+, Zn2+) and P25 on inhibiting algal cells were shown in Fig. 5. It can be seen from Fig. 5 that under the same ion concentration (1 mg L−1), Zn2+ as well as P25 have almost no inhibition on algae cells, however, Ag+ and Cu2+ had significant inhibitory effects on algae cells. But comparing to Ag+, Zn2+, Cu2+ and P25, Cu-MOF-74 (1 mg L−1) still has superior algae-inhibiting effect, especially when treated with Cu-MOF-74 (1 mg L−1) for 120 h, the relative value of OD680 of algae cell suspension is reduced to 0.2 or so. | ||
| Fig. 5 Change of OD680 relative value of algal cell suspension treated by 1 mg L−1 P25; Zn(NO3)2; AgNO3; Cu-MOF-74; CuSO4. | ||
The above results showed that even in the absence of photocatalysis, the algae removal capacity of MOFs was more significant than that of ordinary nanomaterials, meanwhile, compared with the metal ions (Ag+ and Cu2+, Zn2+), MOFs still have higher algae removal efficiency.
3.5 Effect of Cu-MOF-74 concentration on M. aeruginosa
The OD680, Zeta potential and chroma of algal cells can reflect the inhibition of M. aeruginosa by Cu-MOF-74. After exposing to Cu-MOF-74 at concentrations of 0, 0.01, 0.05, 0.1, 1, 5, and 10 mg L−1, the change of chroma, OD680 values, and Zeta potentials of algal cell suspensions over time are shown in Fig. 6 respectively. The Fig. 6(c) shows that the Zeta potential of the algal cell solution in the control group remains unchanged from 0 to 120 h, and the OD680 value of the algal cell solution gradually increases as the color of algal cell solution became deeper, indicating that the algal cells in the control group grow well (Fig. 6(a) and (b)). The tests treated with the concentration of 0.01–0.1 mg L−1 Cu-MOF-74 show no significant change in the chroma, OD680 value and Zeta potential value of the algal cell solution compared to the control group. At 96 h, after being treated with 0.1 mg L−1 Cu-MOF-74, the OD680 value of algal cell for the experimental groups was even greater than that of the control group; meanwhile, at 96 and 120 h, Zeta potential value was also larger than that of the control group when contacted with Cu-MOF-74 of 0.05 and 0.1 mg L−1, and the results were consistent with the change of OD680 values. It is presumed that maybe the lower concentration of MOFs stimulates the activity of certain enzymes inside the algae cells, which made the growth of the algal cells more exuberant. The experimental results were consistent with other studies, Duong et al.40 through the experiment of nano-Ag to inhibit the growth of M. aeruginosa to find that the concentration of 0.001 mg L−1 nano-Ag can't inhibit the growth of algae cells; Mou et al.41 carried on experiment by using different types of carbon nanotubes to inhibit the M. aeruginosa to find that the growth of algal cells were also promoted when the concentration of carbon nanotubes was at a low dosage (0.1 to 1 mg L−1).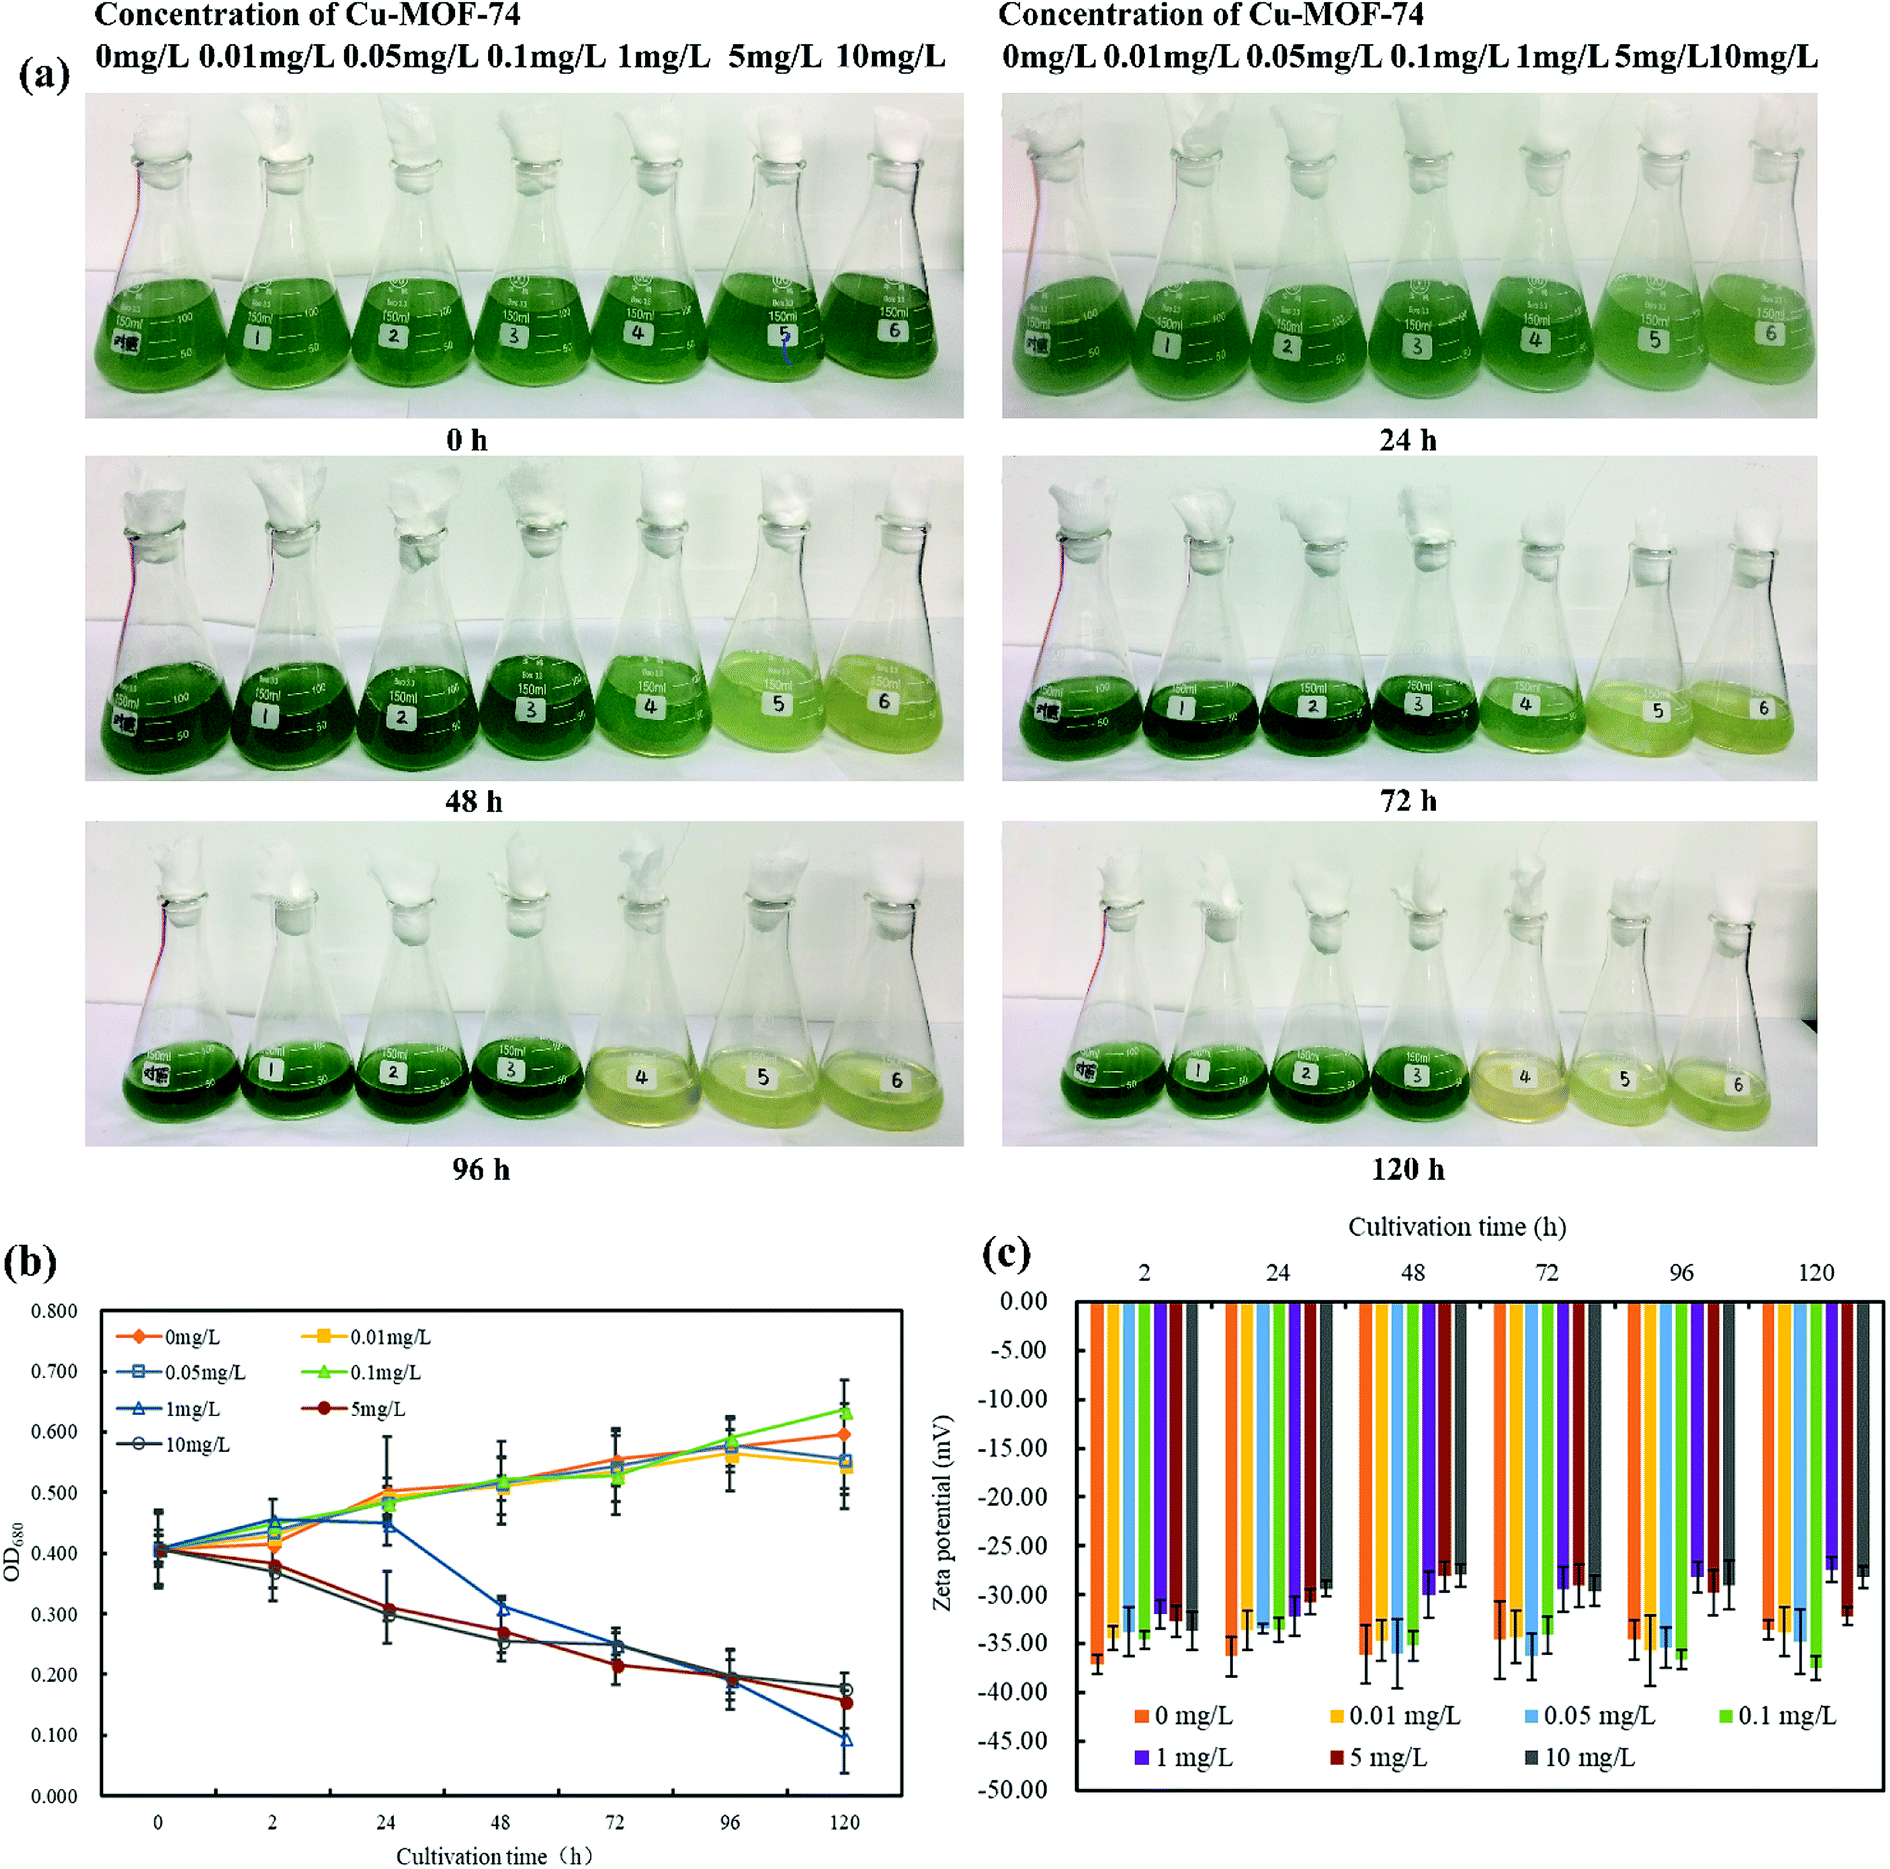 | ||
| Fig. 6 (a) The effect of Cu-MOF-74 concentration on the chroma change of algal cell suspension. (b) The effect of Cu-MOF-74 concentration on algal cell OD680. (c) The effect of Cu-MOF-74 concentration on Zeta potential of algal cell suspension. | ||
When exposed to the concentration of 1 mg L−1 Cu-MOF-74, the OD680 value of algae cells increased firstly and then decreased as culture time went by. It was presumed that maybe the enzymatic activity of the algal cells was stimulated when the Cu-MOF-74 was added, and the intracellular stress response promoted the increase of the density of the algal cells, but algal cells couldn't resist the stimulation brought by the Cu-MOF-74 continuously, as a result, the OD680 value of the algae cells gradually decreased at the end. Once the concentration of Cu-MOF-74 above 1 mg L−1, the absolute values of OD680 and Zeta potential of algal cells decreased significantly with the increase of treatment time, meanwhile, the chroma of algae solution was dimmed in different degrees, and there was no trend of recovery growth for algal cells during the incubation period of 5 d.
The above experimental results clearly demonstrated that the concentration of Cu-MOF-74 can affect the growth of algal cells. When the concentration reached a threshold (1 mg L−1), Cu-MOF-74 will start to suppress algal cells, and the inhibitory effect will become stronger as the concentration of Cu-MOF-74 increased, presented for the significantly dimmed of chroma of the algal cell solution, the decrease of OD680 and Zeta potential value of the algal cell solution.
3.6 Physiological characterization of cyanobacterial using Cu-MOF-74
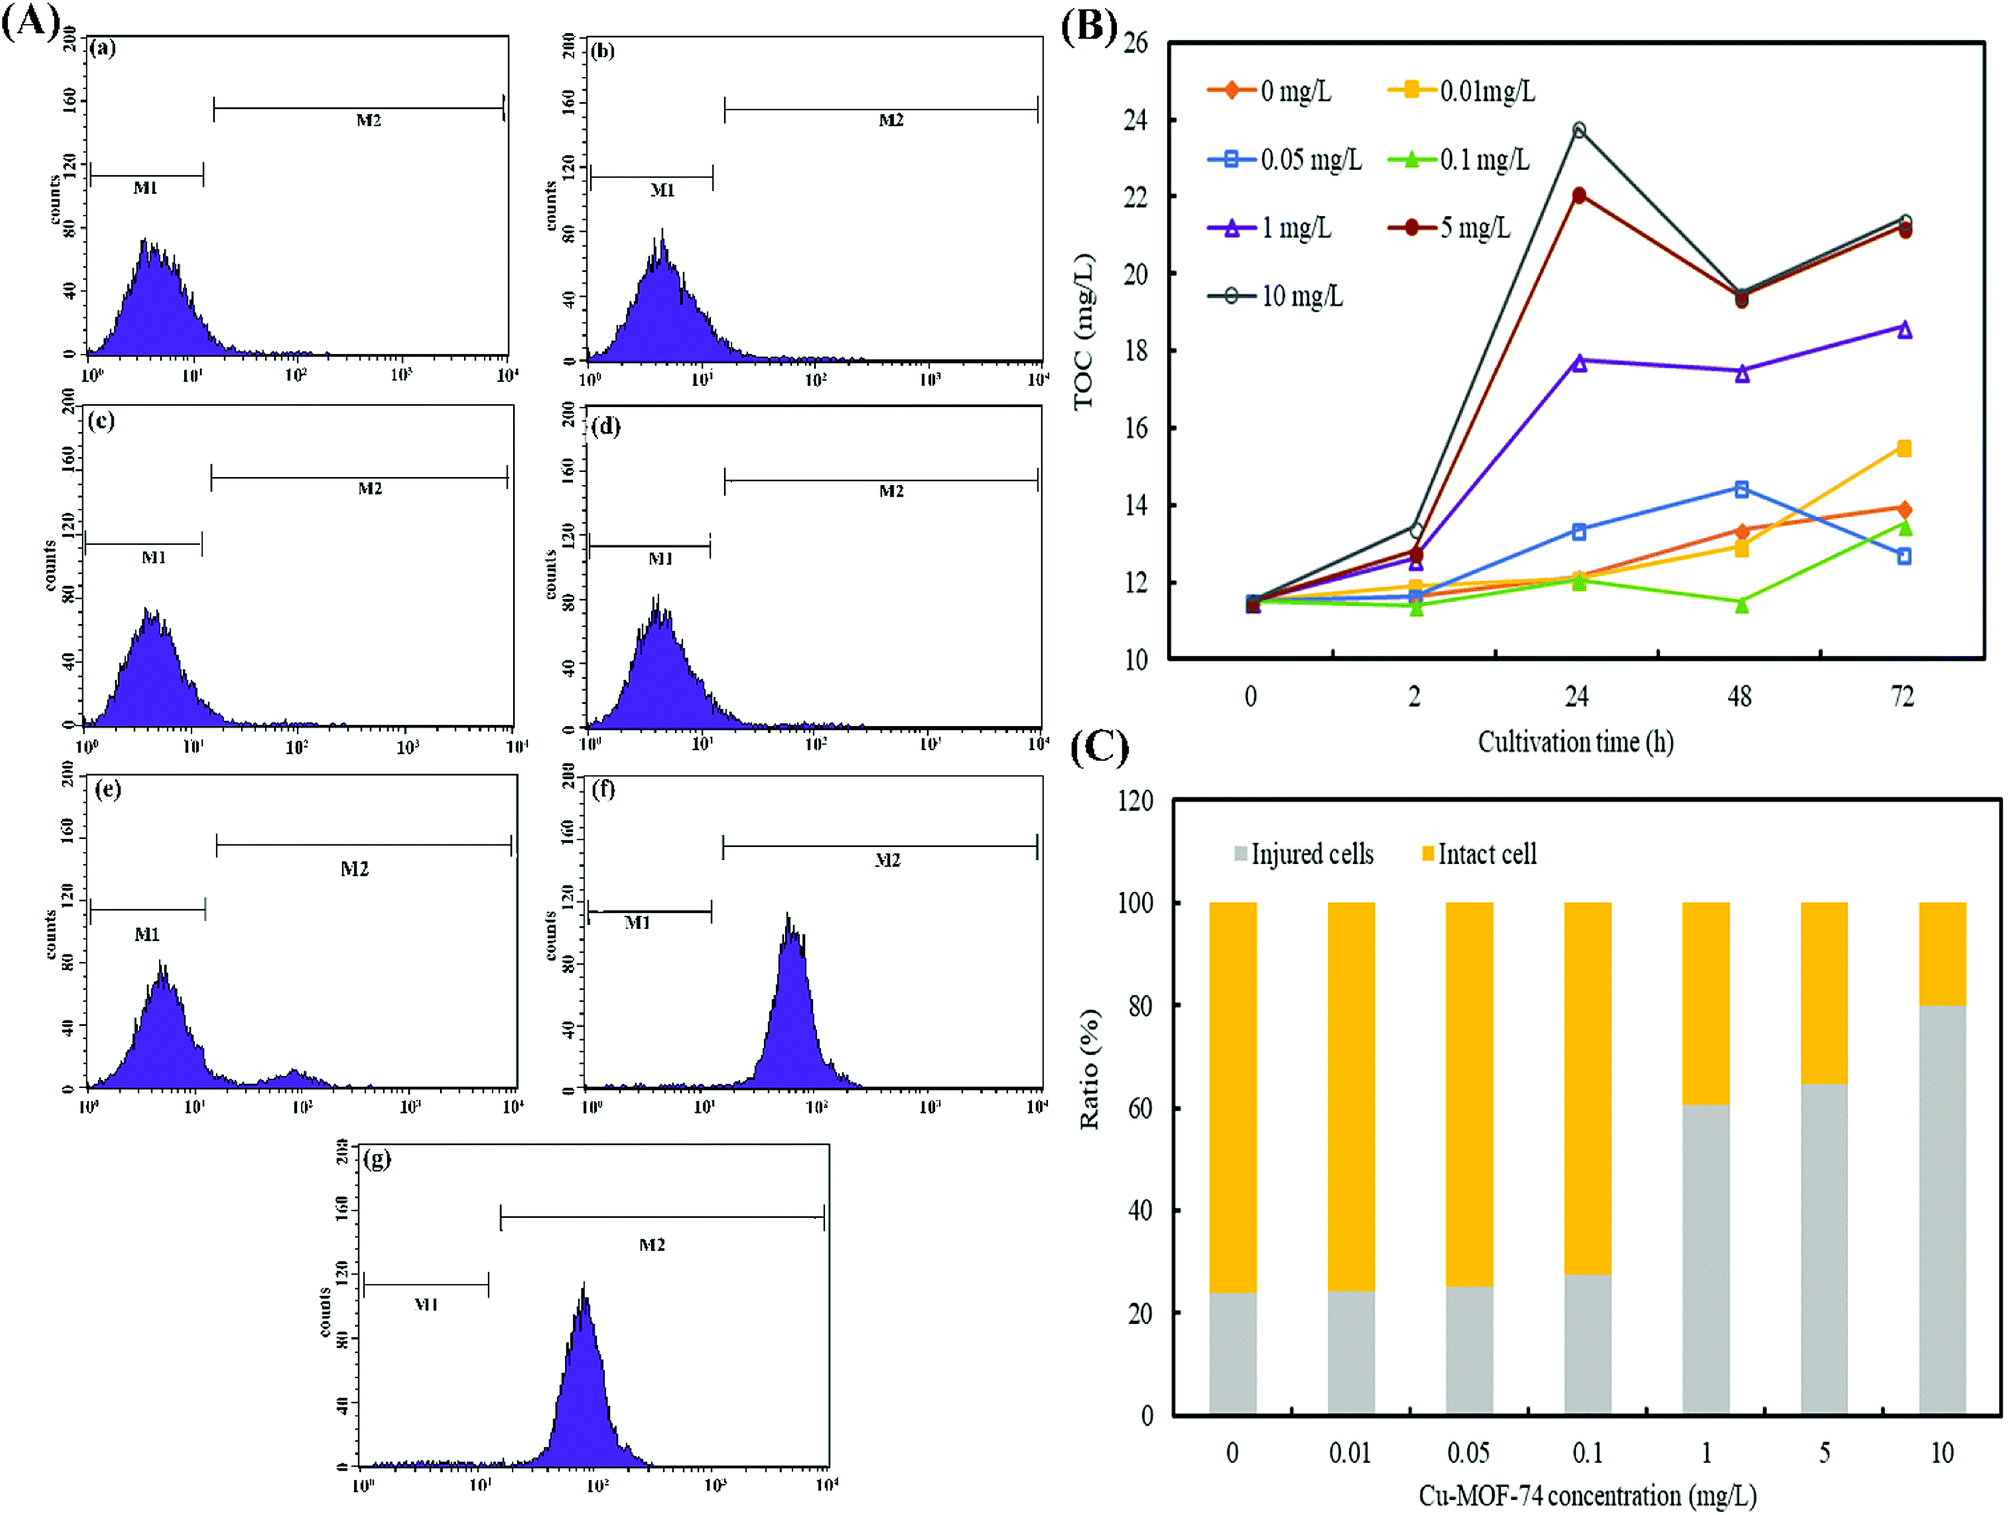 | ||
| Fig. 7 (A) Flow cytometry spectra of algae cells treated with different concentrations of Cu-MOF-74 for 24 h: (a) 0 mg L−1, (b) 0.01 mg L−1, (c) 0.05 mg L−1, (d) 0.1 mg L−1, (e) 1 mg L−1, (f) 5 mg L−1, (g) 10 mg L−1. (B) Effect of Cu-MOF-74 concentration on extracellular TOC content of algal cells. (C) Changes of cell membrane integrity of algae treated with Cu-MOF-74 at different concentrations for 24 h. | ||
M1 region was defined as a living cell region and M2 as a damaged cell region. When algal cells in experimental group were treated with Cu-MOF-74 (0.01–0.1 mg L−1), the PI fluorescence intensity of them was mainly concentrated in the M1 region, which was not significantly different from the control group. The results obviously demonstrated that Cu- MOF-74 with the low concentration (<0.1 mg L−1) did not cause significant damage to the algal cells. However, once the concentration of Cu-MOF-74 increased to 1 mg L−1, the PI fluorescence in the M2 region began to increase, which manifested the severe cell structure damaged of algal cells. And the PI fluorescence intensity in the M2 region showed a further increase trend which goes with the increase of the concentration of Cu-MOF-74.
The Fig. 7(C) showed that the algal cells without any treatment in the control group produced 24.03% of the naturally-damaged cells. Treated with Cu-MOF-74 (0.01, 0.05, and 0.1 mg L−1) for 24 h, the proportion of damaged M. aeruginosa cells was not significantly different from that of the control group, but the proportion of damaged cells increased dramatically when treated with Cu-MOF-74 (1, 5, and 10 mg L−1), and the damaged cells reached to 60.65%, 64.56%, and 79.84%, respectively. The phenomenon reflected that once the concentration of Cu-MOF-74 reached the threshold, the integrity of algal cells would be destructed, which damaged the algal cells.
3.7 Proposed cyanobacterial inhibition mechanisms of Cu-MOF-74
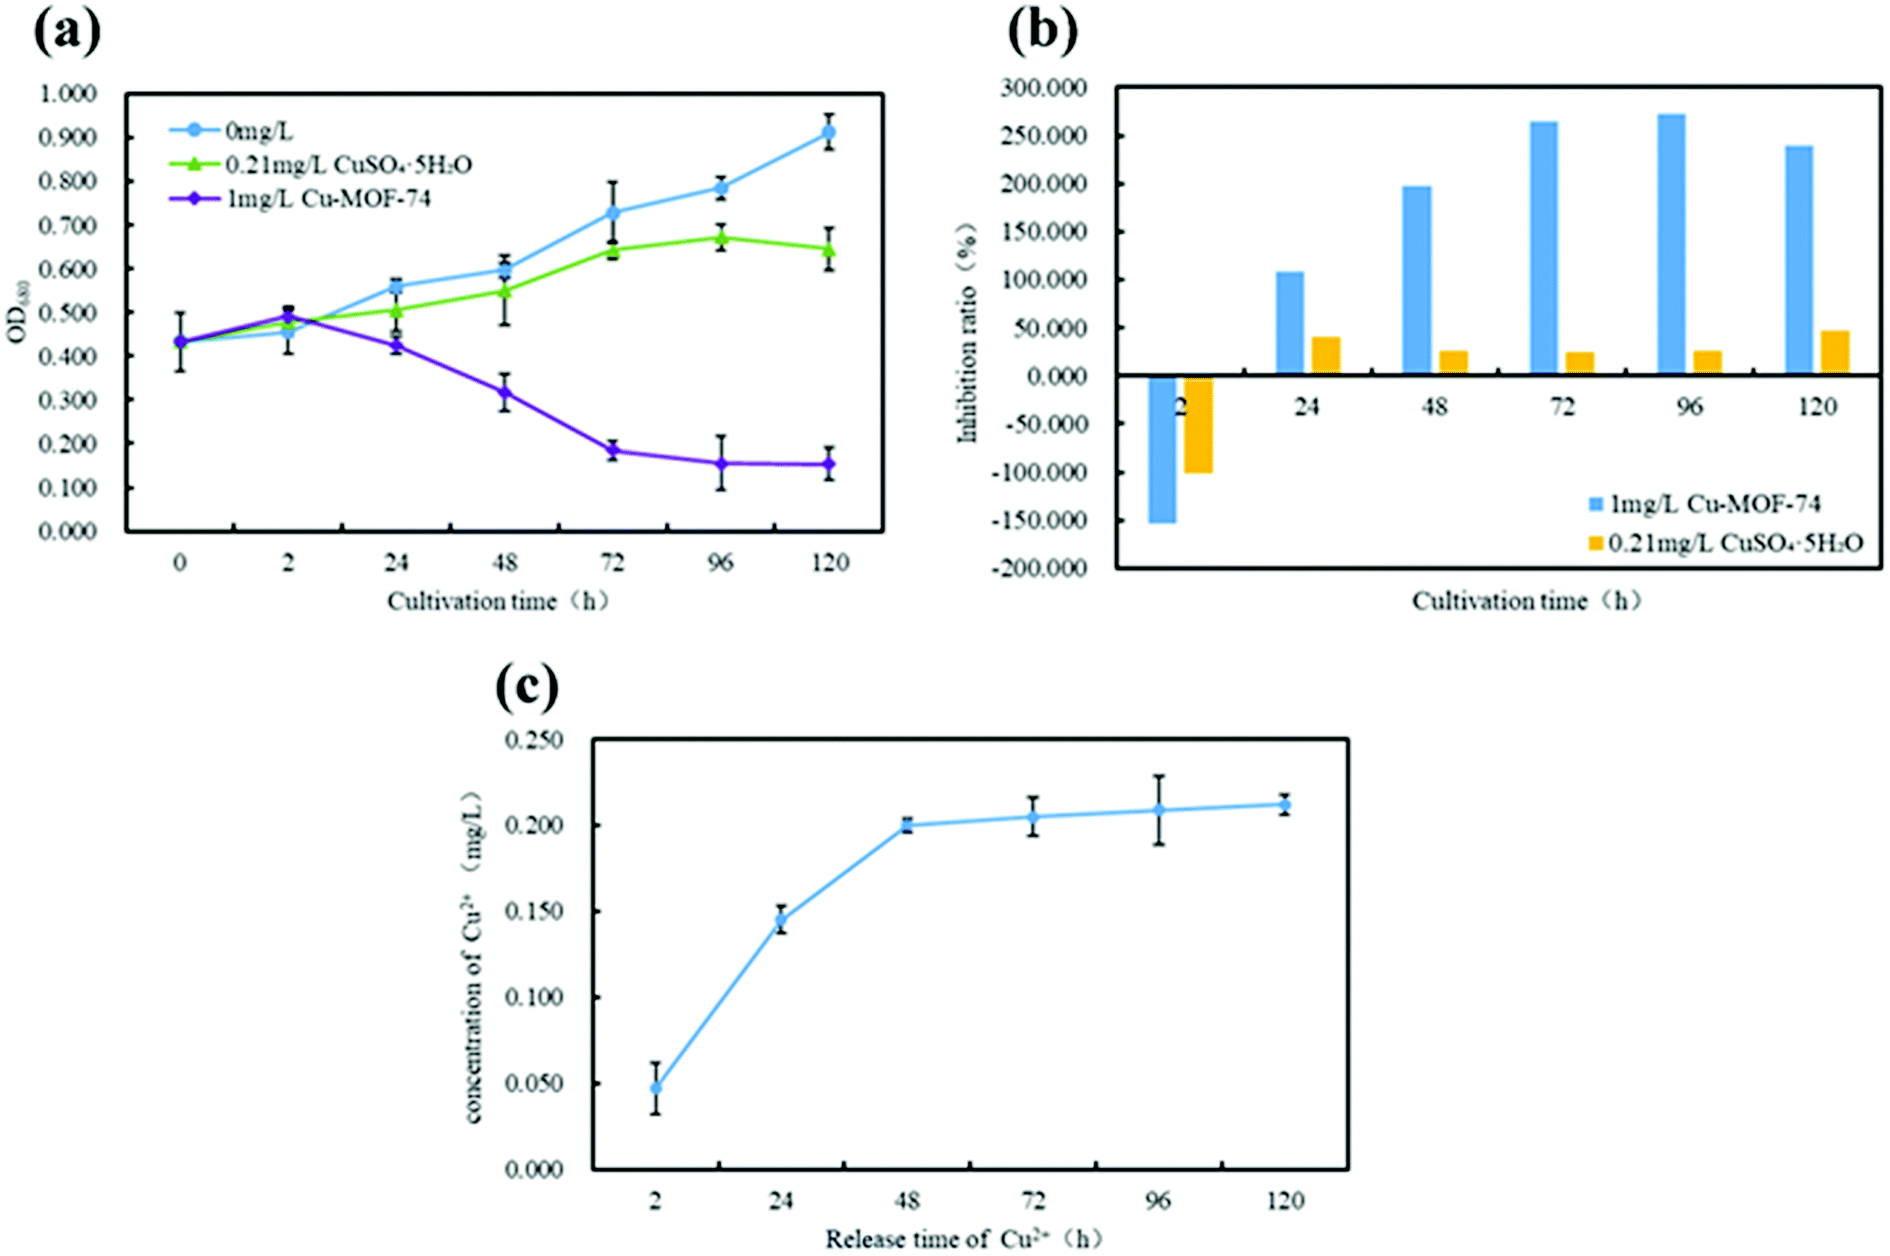 | ||
| Fig. 8 (a) Change of OD680 values of algal cell suspension treated by 0.21 mg L−1 CuSO4·5H2O and 1 mg L−1 Cu-MOF-7. (b) Comparison of inhibition rates of algal cell by 1 mg L−1 Cu-MOF-74 and 0.21 mg L−1 CuSO4·5H2O. (c) Change of Cu2+ concentration released by 1 mg L−1 Cu-MOF-74. | ||
From Fig. 8(a) and (c), Cu2+ released from 1 mg L−1 Cu-MOF-74 increased continuously from 2 to 48 h, and the amount of Cu2+ released reaches equilibrium (0.21 mg L−1) after 48 h. According to the concentration of Cu2+ released from 1 mg L−1 Cu-MOF-74 dissolved in water, 0.21 mg L−1 CuSO4·5H2O was selected as the Cu2+ external additive. Through comparative analysis, it could be seen that the OD680 value of the algal cell suspension added with Cu-MOF-74 was always lower than that added with CuSO4·5H2O.
From Fig. 8(b), compared with CuSO4·5H2O (0.21 mg L−1), the Cu-MOF-74 (1 mg L−1) had exhibited excellent performances for killing algal cells. At 96 h, the Cu-MOF-74 had achieved the maximum relative inhibition rate of algal cells (272.74%), but the maximum relative inhibition rate of CuSO4·5H2O to algae cells was only 39.98% during 0–120 h. It was obviously shown that the suppression ability of Cu-MOF-74 to algae was better than CuSO4·5H2O, suggesting that Cu-MOF-74 released Cu2+ was only a part of factor that inhibited the growth of algal cell. Related document has got similar conclusions, Zhang et al.44 found that the inhibition rate of nano-CuO for Chlorella was consistently higher than that of Cu2+ during experimental culture; Ji et al.45 found that both nano-TiO2 and nano-ZnO have an impact on the growth of Chlorella, and the inhibition mechanism of nano-ZnO on Chlorella was mainly based on the effect of Zn2+ and the oxidative damage of algae by ROS etc. Based on the experimental results, it was presumed that the inhibition mechanism of Cu-MOF-74 may have other causes besides the effect of Cu2+.
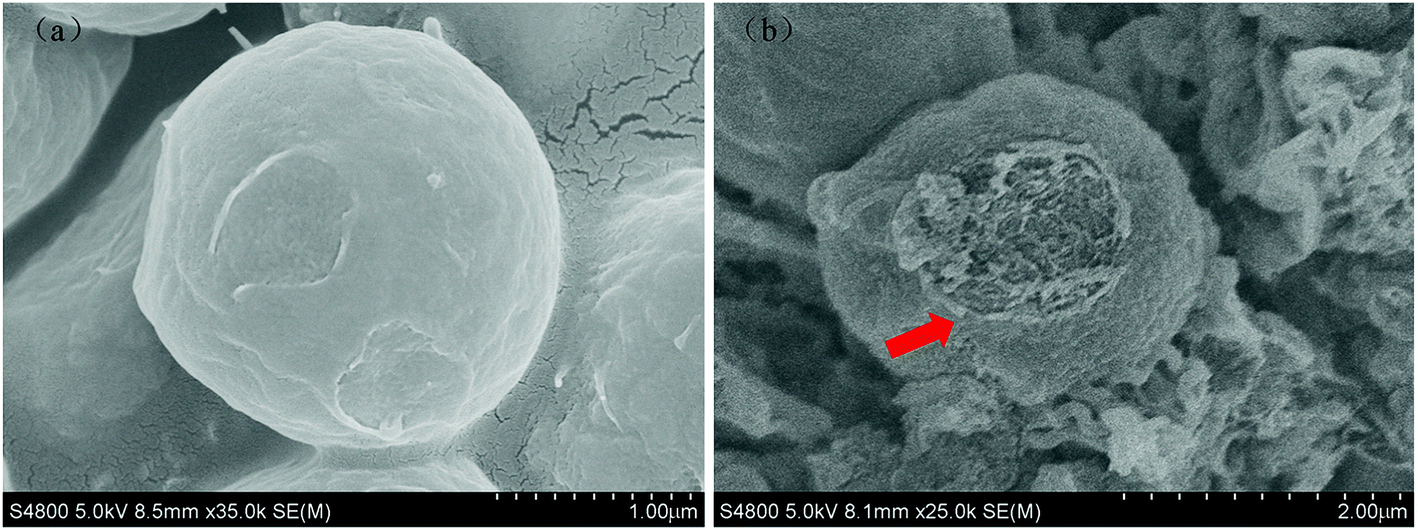 | ||
| Fig. 9 SEM images of algal cells in control and experimental groups (1 mg L−1 Cu-MOF-74) after 48 h treatment: (a) control group, (b) experimental groups. | ||
In Fig. 9(a), the algal cells in the control group were intact and the cell wall surface, presented for a complete elliptical shape, was smooth which indicated their healthy status. Fig. 9(b) showed the SEM image of algal cells after being treated with 1 mg L−1 Cu-MOF-74 for 48 h. Due to the cell wall support, the cells still kept their basic shape, but the morphology of the algal cells was changed: the cell wall edges were not smooth and began to shrink accompanied with pits appeared on the surface of algal cell, indicating the damage of algal cells in the experimental group. It was presumed that the damage of algal cells may be caused by the Cu-MOF-74 or its released Cu2+ adsorbed on its surface. For example, Lin46 et al. observed that TiO2 was adsorbed on the surface of Chlorella; Chen47 et al. found that when the effect concentration of TiO2 reached 100 mg L−1, a large amount of TiO2 would adsorbed on the cell wall surface of Reinhardtii. sp.
4 Conclusion
The five MOFs in this study all had good stability in water and the order of stability of MOFs in water basically display as MIL-125(Ti) > Cu-MOF-74 > Ag/AgCl@ZIF-8 > ZIF-8 > Zn-MOF-74. When the concentration of MOFs such as Cu-MOF-74, Ag/AgCl@ZIF-8, Zn-MOF-74, ZIF-8 and MIL-125(Ti) reached the threshold, all of them were demonstrated to be effective for the removal of algal cells in different degrees. Both the species of metal ions and organic ligands will affect the inhibitory effect of MOFs, however, the activity presented by MOFs is mainly depended on the metal ions released from them. The inhibitory effect of MOFs containing Cu2+ and Ag+ on algal cells is better than that of MOFs containing Zn2+; the inhibitory effect of MOFs containing organic ligand GC on algal cells is better than that of organic ligands DHTA. The order of the inhibitory effects of five MOFs on M. aeruginosa from stronger to weaker is Cu-MOF-74 > Ag/AgCl@ZIF-8 > ZIF-8 > Zn-MOF-74 > MIL-125(Ti). In addition, the concentration of Cu-MOF-74 is proved to be one of the mainly factors affecting the growth of algal cells since the concentration of Cu-MOF-74 reached the threshold (1 mg L−1), the growth of algal cells will be inhibited. With the increase of the concentration of Cu-MOF-74, the OD680 value, Zeta potential and chroma of the algal cell suspension continued to decrease as the culture time increased, indicating that the growth inhibition of algal cells, and the growth inhibition reaction of M. aeruginosa by Cu-MOF-74 followed the pseudo-second-order kinetics fitting mode. The metal ions released by the MOFs would damage the algal cell membranes, causing the destruction of cell integrity of the algal cells in different degrees. As a result, the contents of the algal cells would flow out and the TOC content of the extracellular cells would increase to varying degrees. Meanwhile, it would also lead to the gradual decrease of the Zeta potential of the algal cell suspension. Then the algal cells would cause aggregation and precipitation due to poor stability which achieved the purpose of suppressing algae.Conflicts of interest
There are no conflicts to declare.Acknowledgements
The authors would like to gratefully acknowledge the financially support from the National Natural Science Foundation of China (No. 51778146), the Outstanding Youth Fund of Fujian Province in China (No. 2018J06013), the China Postdoctoral Science Foundation (No. 2014M561856), and the Open test fund for valuable instruments and equipment of Fuzhou University (No. 2018T033).References
- B. E. Lapointe, L. W. Herren, D. D. Debortoli and M. A. Vogel, Harmful Algae, 2015, 43, 82–102 CrossRef CAS.
- J. D. Isaacs, W. K. Strangman, A. E. Barbera, M. A. Mallin, M. R. Mciver and J. L. C. Wright, Harmful Algae, 2014, 31, 82–86 CrossRef CAS PubMed.
- M. A. Burford, S. A. Johnson, A. J. Cook, T. V. Packer, B. M. Taylor and E. R. Townsley, Water Res., 2007, 41, 4105–4114 CrossRef CAS PubMed.
- G. M. Hallegraeff, Phycologia, 1993, 32, 79–99 CrossRef.
- W. W. Carmichael, W. R. Evans, Q. Q. Yin, P. Bell and E. Moczydlowski, Appl. Environ. Microbiol., 1997, 63, 3104–3110 CAS.
- E. M. Jochimsen, W. W. Carmichael, J. S. An, D. M. Cardo, S. T. Cookson, C. E. Holmes, M. B. Antunes, D. M. F. Da, T. M. Lyra and V. S. Barreto, N. Engl. J. Med., 1998, 338, 873–878 CrossRef CAS PubMed.
- G. Fan, W. Chen, Z. Su, R. Lin, R. Xu, X. Lin and Q. Zhong, Desalin. Water Treat., 2017, 68, 70–79 CrossRef CAS.
- J. Plummer, J. Water Supply: Res. Technol.--AQUA, 2002, 51, 307–318 CrossRef CAS.
- J. Nimptsch, C. Wiegand and S. Pflugmacher, Environ. Sci. Technol., 2008, 42, 8552 CrossRef CAS PubMed.
- G. Zhang, P. Zhang and M. Fan, Ultrason. Sonochem., 2009, 16, 334–338 CrossRef CAS PubMed.
- L. Garcã A-Villada, M. Rico, M. M. Altamirano, N. N. L. Sã, V. Lã Pez-Rodas and E. Costas, Water Res., 2004, 38, 2207–2213 CrossRef PubMed.
- S. Zhou, Y. Shao, N. Gao, L. Li, J. Deng, M. Zhu and S. Zhu, Sci. Total Environ., 2014, 482–483, 208–213 CrossRef CAS PubMed.
- F. D. Hulot, G. Lacroix, F. Lescher-Moutoué and M. Loreau, Nature, 2000, 405, 340 CrossRef CAS PubMed.
- A. G. Slater and A. I. Cooper, Science, 2015, 348 Search PubMed.
- Q. L. Zhu and Q. Xu, Chem. Soc. Rev., 2014, 43, 5468–5512 RSC.
- N. M. Franklin, N. J. Rogers, S. C. Apte, G. E. Batley, G. E. Gadd and P. S. Casey, Environ. Sci. Technol., 2007, 41, 8484–8490 CrossRef CAS PubMed.
- C. Yang, X. You, J. Cheng, H. Zheng and Y. Chen, Appl. Catal., B, 2017, 200, 673–680 CrossRef CAS.
- C. Saison, F. Perreault, J. C. Daigle, C. Fortin, J. Claverie, M. Morin and R. Popovic, Aquat. Toxicol., 2010, 96, 109–114 CrossRef CAS PubMed.
- M. H. Park, K. H. Kim, H. H. Lee, J. S. Kim and S. J. Hwang, Biotechnol. Lett., 2010, 32, 423–428 CrossRef CAS PubMed.
- A. Kubacka, N. A. M. Fernã and G. Colã N, Chem. Rev., 2012, 112, 1555–1614 CrossRef CAS PubMed.
- M. Zhao, K. Yuan, Y. Wang, G. Li, J. Guo, L. Gu, W. Hu, H. Zhao and Z. Tang, Nature, 2016, 539, 76 CrossRef CAS PubMed.
- R. Chandra, S. Mukhopadhyay and M. Nath, Mater. Lett., 2016, 164, 571–574 CrossRef CAS.
- C. Yang, X. You, J. Cheng, H. Zheng and Y. Chen, Appl. Catal., B, 2017, 200, 673–680 CrossRef CAS.
- Y. Liu, J. Zhan and Y. Hong, Environ. Sci. Pollut. Res., 2017, 24, 26594–26604 CrossRef CAS PubMed.
- A. Miao, K. A. Schwehr, C. Xu, S. Zhang, Z. Luo, A. Quigg and P. H. Santschi, Environ. Pollut., 2009, 157, 3034–3041 CrossRef CAS PubMed.
- K. Martín-Betancor, S. Aguado, I. Rodea-Palomares, M. Tamayo-Belda, F. Leganés, R. Rosal and F. Fernández-Piñas, Sci. Total Environ., 2017, 595, 547–555 CrossRef PubMed.
- N. Gu, J. Gao, K. Wang, B. Li, W. Dong and Y. Ma, J. Taiwan Inst. Chem. Eng., 2016, 64, 189–195 CrossRef CAS.
- R. Sanz, F. Martínez, G. Orcajo, L. Wojtas and D. Briones, Dalton Trans., 2013, 42, 2392–2398 RSC.
- Y. Tang, J. Tian, S. Li, C. Xue, Z. Xue, D. Yin and S. Yu, Sci. Total Environ., 2015, 532, 154–161 CrossRef CAS PubMed.
- G. Fan, W. Chen, Z. Su, R. Lin, R. Xu, X. Lin and Q. Zhong, Desalin. Water Treat., 2017, 68, 70–79 CrossRef CAS.
- X. Wu, E. M. Joyce and T. J. Mason, Water Res., 2012, 46, 2851–2858 CrossRef CAS PubMed.
- S. Tanaka, K. Kida, M. Okita, Y. Ito and Y. Miyake, Chem. Lett., 2012, 41, 1337–1339 CrossRef CAS.
- S. T. Gao, W. H. Liu, N. Z. Shang, C. Feng, Q. H. Wu, Z. Wang and C. Wang, RSC Adv., 2014, 4, 61736–61742 RSC.
- J. Liu, R. Li, Y. Hu, T. Li, Z. Jia, Y. Wang, Y. Wang, X. Zhang and C. Fan, Appl. Catal., B, 2017, 202, 64–71 CrossRef CAS.
- G. Fan, X. Zheng, J. Luo, H. Peng, H. Lin, M. Bao, L. Hong and J. Zhou, Chem. Eng. J., 2018, 351, 782–790 CrossRef CAS.
- R. Sanz, F. Martínez, G. Orcajo, L. Wojtas and D. Briones, Dalton Trans., 2013, 42, 2392–2398 RSC.
- H. Wang, X. Yuan, Y. Wu, G. Zeng, X. Chen, L. Leng and H. Li, Appl. Catal., B, 2015, 174–175, 445–454 CrossRef CAS.
- H. Wang, X. Yuan, Y. Wu, G. Zeng, X. Chen, L. Leng, Z. Wu, L. Jiang and H. Li, J. Hazard. Mater., 2015, 286, 187–194 CrossRef CAS PubMed.
- K. Martín-Betancor, S. Aguado, I. Rodea-Palomares, M. Tamayo-Belda, F. Leganés, R. Rosal and F. Fernández-Piñas, Sci. Total Environ., 2017, 595, 547–555 CrossRef PubMed.
- T. Thuy Duong, T. Son Le, T. H. T. Thi, T. Kien Nguyen, C. T. Ho, T. Hien Dao, P. Q. L. Thi, H. Chau Nguyen, D. K. Dang and T. H. L. Thi, Adv. Nat. Sci.: Nanosci. Nanotechnol., 2016, 7, 35018 Search PubMed.
- F. Mou, P. Wang, H. Li and Z. Zhou, Journal of Convergence Information Technology, 2013, 8, 176–182 Search PubMed.
- X. Wang, X. Wang, J. Zhao, J. Song, J. Wang, R. Ma and J. Ma, Chem. Eng. J., 2017, 320, 253–263 CrossRef CAS.
- V. Aruoja, H. Dubourguier, K. Kasemets and A. Kahru, Sci. Total Environ., 2009, 407, 1461–1468 CrossRef CAS PubMed.
- C. C. Zhang, X. Y. Liu and Z. Y. Wang, Appl. Mech. Mater., 2013, 328, 758–762 Search PubMed.
- J. Ji, Z. Long and D. Lin, Chem. Eng. J., 2011, 170, 525–530 CrossRef CAS.
- D. Lin, J. Ji, Z. Long, K. Yang and F. Wu, Water Res., 2012, 46, 4477–4487 CrossRef CAS PubMed.
- L. Chen, L. Zhou, Y. Liu, S. Deng, H. Wu and G. Wang, Ecotoxicol. Environ. Saf., 2012, 84, 155–162 CrossRef CAS PubMed.
Footnote |
| † Electronic supplementary information (ESI) available. See DOI: 10.1039/c8ra05608k |
| This journal is © The Royal Society of Chemistry 2018 |