DOI:
10.1039/C8RA05607B
(Paper)
RSC Adv., 2018,
8, 26998-27007
Conversion of dilute nitrous oxide (N2O) in N2 and N2–O2 mixtures by plasma and plasma-catalytic processes†
Received
1st July 2018
, Accepted 21st July 2018
First published on 30th July 2018
Abstract
A coaxial dielectric barrier discharge (DBD) reactor has been developed for plasma and plasma-catalytic conversion of dilute N2O in N2 and N2–O2 mixtures at both room and high temperature (300 °C). The effects of catalyst introduction, O2 content and inlet N2O concentration on N2O conversion and the mechanism involved in the conversion of N2O have been investigated. The results show that N2O in N2 could be effectively decomposed to N2 and O2 by plasma and plasma-catalytic processes at both room and high temperature, with much higher decomposition efficiency at 300 °C than at room temperature for the same discharge power. Under an N2–O2 atmosphere, however, N2O could be removed only at high temperature, producing not only N2 and O2 but also NO and NO2. Production and conversion of N2O occur simultaneously during the plasma and plasma-catalytic processing of N2O in a N2–O2 mixture, with production and conversion being the dominant processes at room and high temperature, respectively. N2O conversion increases with the increase of discharge power and decreases with the increase of O2 content. Increasing the inlet N2O concentration from 100 to 400 ppm decreases the conversion of N2O under an N2 atmosphere but increases that under an N2–O2 atmosphere. Concentrating N2O in the N2–O2 mixture could alleviate the negative influence of O2 by increasing the involvement of plasma reactive species (e.g., N2(A3Σu+) and O(1D)) in N2O conversion. Packing the discharge zone with a RuO2/Al2O3 catalyst significantly enhances the conversion of N2O and improves the selectivity of N2O decomposition under an N2–O2 atmosphere, revealing the synergy of plasma and catalyst in promoting N2O conversion, especially its decomposition to N2 and O2.
1. Introduction
Nitrous oxide (N2O) emitted from various human activities including agriculture (soil cultivation and the use of nitrogen-fertilizers), biomass burning, fossil fuel combustion, industrial processes (production of adipic and nitric acids), and wastewater treatment is the third most significant anthropogenic greenhouse gas and the largest stratospheric-ozone-depleting substance.1–3 Limiting the formation of N2O is the best solution to reduce N2O emissions from the agricultural sector and uncontrolled biomass burning taking into account the diffuse character of these emissions, while employment of after-treatment technologies is important for control of N2O emissions from combustion and industrial sources.3
Technologies developed and adopted so far for abatement of N2O are mainly based on catalysis, including non-selective catalytic reduction (NSCR), selective catalytic reduction (SCR), and direct catalytic decomposition.1,3–8 Among these technologies, the direct catalytic decomposition of N2O to N2 and O2 has received great attention due to simplicity and high efficiency and significant research efforts have been focused on development of novel catalytic materials with satisfactory activity at relatively low temperatures.1,3,5–8 As a promising alternative to develop new catalysts, combination of catalysts with non-thermal plasma has been widely investigated in recent years for treatment of a variety of air contaminants such as volatile organic compounds (VOCs) and nitrogen oxides (NOx).9–16 The synergetic effects between plasma and catalysis include initiating chemical reactions at low temperature and improving products selectivity.9–16 In fact, plasma and plasma-catalysis systems have also been investigated for decomposition of N2O, with nitrogen or argon as the background gas in most cases.17–22 These oxygen-free systems proved to be effective in decomposing N2O even at room temperature.17–22 In real exhaust gases, however, O2 always coexists with N2O and N2 and it is therefore of great significance to investigate the N2O conversion behavior under N2–O2 atmosphere.3
In a recent study by Jo et al.,23 O2 in N2–O2–N2O mixture was verified to have obviously adverse effects on the plasma-catalytic decomposition of N2O. Besides the negative influence of O2 on the catalytic decomposition of N2O, the intrinsic formation of N2O by discharge in N2–O2 should have also contributed to the decreasing N2O conversion with increasing O2 content, which however was not taken into account in that study.23 From our perspective, a better understanding of both N2O production and conversion processes in the presence of O2 is essential for optimizing the plasma-catalytic decomposition of N2O. On the other hand, Jo et al.23 inferred from the thermodynamic calculations that N2O was mainly decomposed into N2 and O2 in the presence of O2. However, Krawczyk et al.24,25 found that N2O in mixtures with O2 or air was both oxidized to NO and decomposed to N2 and O2 by gliding arc discharge, combined with or without a catalytic bed. Oxidation of N2O into NO and reusing NO for production of nitric acid is a profitable method for reducing concentrated N2O emissions, e.g., in adipic acid plants.24 For removal of dilute N2O from sources such as nitric acid production and fluidized bed combustion, however, decomposition of N2O into N2 and O2 would be more desired.3
The aim of this study is to investigate the conversion behavior and mechanism of dilute N2O in plasma and plasma-catalytic processes, in both the presence and absence of O2 and at both room and high temperature (300 °C). For this purpose, a coaxial dielectric barrier discharge (DBD) reactor was constructed, to generate plasma and to combine plasma with catalysts. RuO2/Al2O3 was chosen as the catalyst besides Al2O3 for plasma-catalytic conversion of N2O due to its reported good performance for catalytic N2O decomposition.26 The effects of catalyst (Al2O3 or RuO2/Al2O3) introduction, O2 content (0–20%, volumetric) and inlet N2O concentration (100–400 ppm, volumetric) on the conversion of N2O were systematically examined. In order to elucidate the mechanism of N2O conversion, the production of N2O by discharge in N2–O2 mixture with and without catalyst was also investigated and products/byproducts generated in these processes were analyzed in detail.
2. Experimental
2.1 Experimental set-up
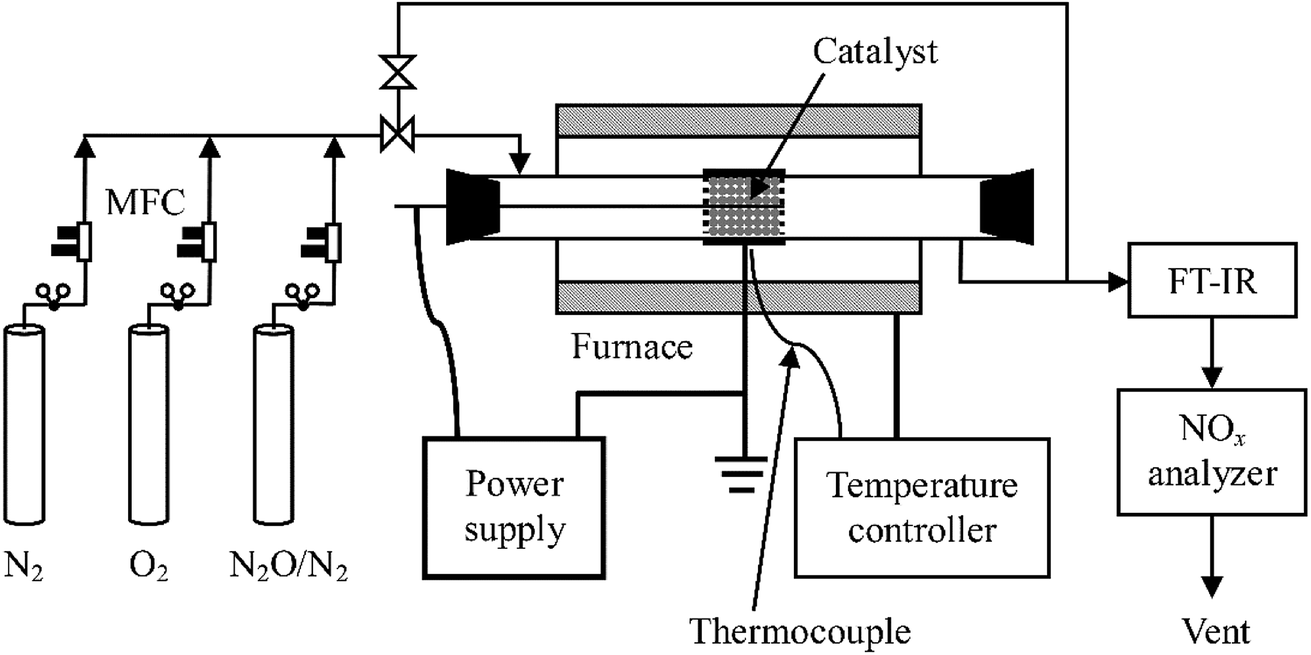
A schematic diagram of the experimental system is shown in Fig. 1. It consists of reaction gas supply, a DBD reactor with an alternating current (AC) high voltage power supply (0–100 kV, 50–500 Hz, sinusoidal wave), and analytical instrumentation. The reaction gas which was fed into the reactor at a total flow rate of 1 L min−1 at ambient temperature and pressure (around 20 °C, 100 kPa) throughout this work was prepared by mixing pure N2, O2, and N2O in N2 (Beijing HaiRui Tongda Gas Technology Co., Ltd., China) whose flow rates were controlled by a set of mass flow controllers (MFC, D07-7, Beijing Sevenstar Electronics Co., Ltd., China). O2 content in the feed gas was adjusted to 0%, 5%, 10% or 20% while inlet concentration of N2O ranged from 0 to 400 ppm.
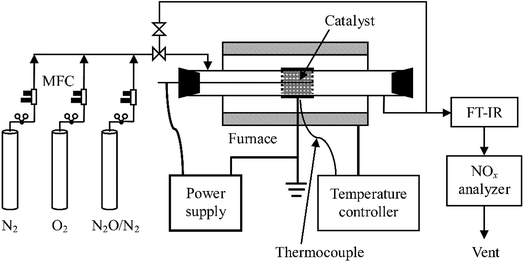 |
| | Fig. 1 Schematic diagram of the experimental set-up. | |
A quartz glass tube reactor (length: 600 mm; inner diameter: 29 mm; thickness: 1.5 mm) was used with a concentric tungsten wire (diameter: 1.4 mm) acting as the discharge electrode and an aluminum foil (50 mm in length) wrapping around the glass tube as the ground electrode. For the plasma-catalytic process, Al2O3 or RuO2/Al2O3 catalyst pellets (20 g, 3–5 mm in diameter) were packed in the space between the discharge electrode and the tube at near maximum packing density, with an apparent volume of ca. 27 mL. The plasma/plasma-catalytic reactor was installed in normal indoor environments or in a temperature-controlled tube furnace to obtain room temperature and high temperature (300 °C) reaction conditions, respectively.
2.2 Experimental methods
2.2.1 Preparation and characterization of catalyst. Commercial γ-Al2O3 pellets (Brunauer–Emmett–Teller (BET) specific surface area 226 m2 g−1, specific pore capacity 0.48 mL g−1, Tianjin Fuchen Chemical Reagents Factory, China) were used as the catalyst as well as the support of RuO2/Al2O3 catalyst. For the preparation of RuO2/Al2O3, a given amount of γ-Al2O3 pellets were impregnated with an aqueous solution of RuCl3 (99% purity, J&K Scientific). After the impregnation, drying overnight at 110 °C and calcining at 550 °C for 6 h in air atmosphere were performed. The nominal loading amount of Ru over Al2O3 was 2.4 wt% and the BET specific surface area of the prepared RuO2/Al2O3 catalyst was 194 m2 g−1, measured by N2 adsorption at −196 °C on a surface area and pore size analyzer (Micromeritics Gemini V, USA).In addition, X-ray diffraction (XRD) patterns of Al2O3 and RuO2/Al2O3 catalysts before and after use in plasma-catalytic conversion of N2O were obtained using a Bruker D8 Discover diffractometer (Co Kα radiation, 35 kV, 30 mA).
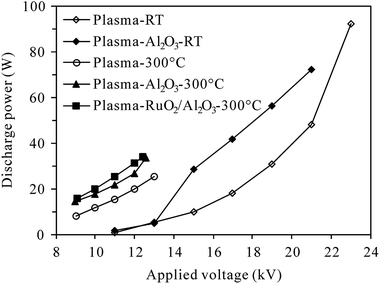
2.2.2 Measurement of discharge characteristics. The DBD reactor was energized at 200 Hz in the range of 9–23 kV (root-mean-square (RMS) value) in this study. The applied voltage and discharge current was measured using a 1000:1 high voltage probe (P6015A, Tektronix, USA) and a current monitor (UT61D, UNI-T, China), respectively. The discharge power delivered to the reactor was calculated by multiplying the time-dependent voltage and current. Fig. 2 presents typical discharge power values of plasma and plasma-catalytic reactors at room temperature and 300 °C as functions of applied voltage. It is worth pointing out that although higher discharge power could be delivered to the reactors under higher reaction temperature (300 °C) for a given applied voltage, the breakdown voltage and maximum applicable discharge power were much lower at 300 °C than those at room temperature.
 |
| | Fig. 2 Dependence of discharge power on the applied voltage at room temperature (RT) and 300 °C (inlet N2O: 0 ppm; O2 content: 5%). | |
2.2.3 Analysis of gas components and calculation of N2O conversion. The reactor outlet gas stream was analyzed using an on-line Fourier transform infrared (FT-IR) spectrometer (Nicolet iS10, Thermo-Scientific, USA) equipped with a heated gas cell (optical path length: 2.4 m; volume: 300 mL; temperature: 100 °C) and a deuterated triglicine sulfate (DTGS) KBr detector. Spectra were recorded automatically every 35 s (average of 16 scans from 4000 to 650 cm−1 with a resolution of 4 cm−1) from the start to the end of each experiment, with the background spectra being recorded under dry N2 before the experiment. For quantification of N2O, NO and NO2, the FT-IR spectrometer was calibrated using standard gases of these components, with measurement uncertainty of ±1 ppm. Besides, NO and NO2 concentrations were also measured by a NOx analyzer (42i-HL, Thermo-Scientific, USA, uncertainty ±1%). Considering the relative low infrared absorption of NO and potential interference by H2O, concentration of NO was mainly determined by the NOx analyzer in this work while that of NO2 by the FT-IR spectrometer.The conversion of N2O is calculated based on its inlet (CN2O,in, ppm) and outlet concentrations (CN2O,out, ppm), as shown in eqn (1).
| |
 | (1) |
The selectivity of NO, NO2 and NOx (NO + NO2) produced from N2O conversion is calculated based on the N-balance as follows:
| |
 | (2) |
| |
 | (3) |
| | |
Selectivity of NOx = selectivity of NO + selectivity of NO2
| (4) |
where
CNO,with N2O,
CNO,w/o N2O and
CNO2,with N2O,
CNO2,w/o N2O indicate the outlet concentrations of NO and NO
2 (ppm) detected with and without N
2O in the inlet gas, respectively; 2 is the number ratio of nitrogen atoms of N
2O and NO/NO
2.
3. Results and discussion
3.1 Conversion of N2O at room temperature
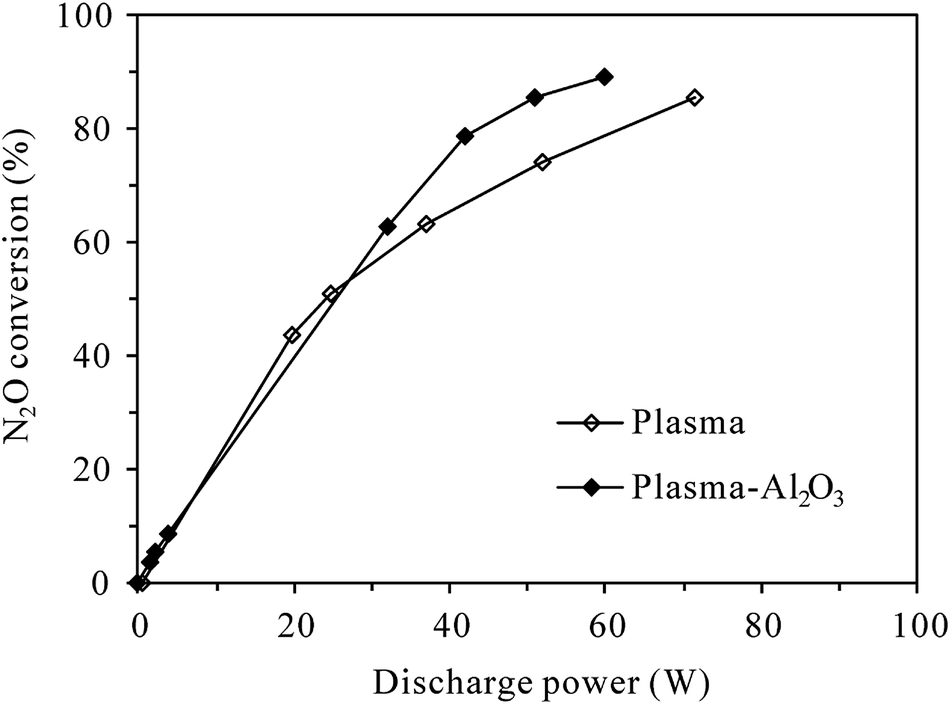
3.1.1 Conversion of N2O under N2 atmosphere. Fig. 3 shows the conversion of 100 ppm-N2O in N2 as functions of discharge power in plasma and plasma-Al2O3 reactors at room temperature. It can be seen that without O2 in the reaction gas, N2O can be effectively decomposed by both plasma and plasma-Al2O3 processes. The N2O conversion increased with the increase of discharge power, which can be easily ascribed to the increment of active species for N2O decomposition at higher discharge power. In an intensive study of N2O conversion by pulsed corona discharge in N2, Zhao et al.18 confirmed that among the active species, the first excited state of molecular nitrogen, i.e., N2(A3Σu+) produced by electron impact excitation of nitrogen molecules (reaction (R1)27), appeared to be mainly involved in the decomposition of N2O through reaction (R2). Reaction (R2) was also concluded to be responsible for the conversion of N2O in N2 DBD plasma by Trinh et al.20 With the increase of discharge power, more N2(A3Σu+) would be produced for N2O decomposition due to the increase of energetic electrons. As shown in Fig. 3, the highest N2O conversion was 85.7% and 89.4% observed at the highest discharge power of 71.6 W and 59.8 W tested for plasma and plasma-Al2O3 process, respectively. Packing with Al2O3 catalyst slightly facilitated the decomposition of N2O in N2, probably by enhancing the electric fields around the contact points of dielectric Al2O3 pellets.19| | |
N2 + e → N2(A3Σu+) + e
| (R1) |
| | |
N2(A3Σu+) + N2O → 2N2 + O
| (R2) |
 |
| | Fig. 3 Dependence of N2O conversion on the discharge power in plasma and plasma-Al2O3 reactors at room temperature (inlet N2O: 100 ppm; O2 content: 0%). | |
3.1.2 Conversion and production of N2O under N2–O2 atmosphere. Once O2 (5%, 10% or 20%) was added into the reaction gas, N2O could not be decomposed anymore at room temperature, no matter in the presence or absence of Al2O3 catalyst. In fact, N2O concentration increased due to additional production of N2O, which was widely accepted to proceed mainly by the reaction of N2(A3Σu+) with oxygen, as shown in (R3).27–29 Obviously, N2(A3Σu+) plays an important role in both production and decomposition of N2O via (R3) and (R2), respectively.| | |
N2(A3Σu+) + O2 → N2O + O
| (R3) |
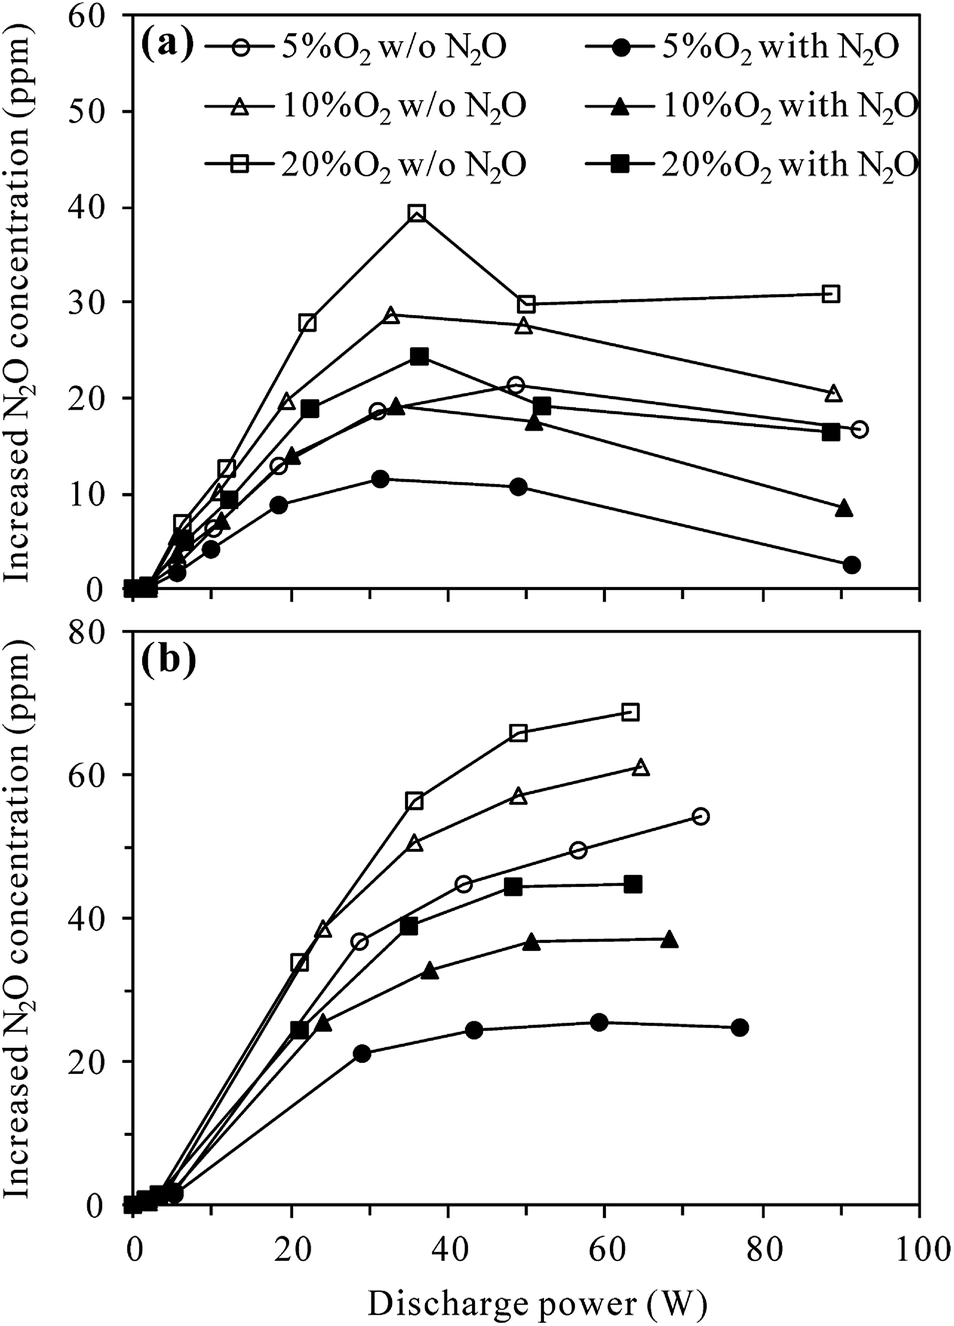
Fig. 4 compares the increased concentration of N2O (CN2O,out − CN2O,in) under different O2 contents with and without 100 ppm-N2O in the N2–O2 mixture. As can be seen from Fig. 4(a), no matter with or without N2O in the inlet gas, the increased concentration of N2O in the plasma reactor first increased and then decreased with the increase of discharge power, attaining a maximum at ca. 35 W. The reason for this may be that the increase of discharge power promotes not only the formation of N2O via (R3), but also N2O loss by (R2) and/or (R4)–(R6).27,29–31 Higher discharge power means that more energy could be used to excite/dissociate N2 and O2 molecules, producing more reactive species such as N2(A3Σu+) and O(1D). At relatively low discharge power, the concentration of N2O increased with increasing discharge power due to the enhanced production of N2(A3Σu+) species for N2O formation (R3). With the increase of N2O concentration and increasing production of reactive species (N2(A3Σu+) and O(1D)), the probability of N2O loss reactions ((R2), (R5) and (R6)) raised, explaining the observed decrease of N2O concentration at higher discharge power. In the whole discharge power range tested, however, the production of N2O surpassed the loss since the increased concentration of N2O was always positive.
| | |
O2 + e → O(3P) + O(1D) + e
| (R4) |
| | |
O(1D) + N2O → NO + NO
| (R5) |
| | |
O(1D) + N2O → N2 + O2
| (R6) |
 |
| | Fig. 4 Effects of N2O presence in N2–O2 mixture on the production of N2O by discharge in (a) plasma and (b) plasma-Al2O3 reactors at room temperature (inlet N2O: 0 or 100 ppm; O2 content: 5%, 10% or 20%). | |
Fig. 4(a) also shows that in both the presence and absence of N2O in the inlet gas, more N2O was produced in the plasma reactor under higher O2 contents for a given discharge power, indicating the important role of O2 in N2O production.27,29 Compared with the case without N2O in the inlet gas, introduction of 100 ppm-N2O significantly reduced the production of N2O under all O2 contents. In the presence of initial N2O, more N2(A3Σu+) species would be consumed in N2O decomposition (reaction (R2)), reducing the amount of N2(A3Σu+) species for N2O production (reaction (R3)) as a result.
Compared to plasma alone, more N2O was produced in the plasma-Al2O3 reactor (Fig. 4(b)) under otherwise similar conditions, indicating the promotion effects of Al2O3 catalyst on N2O formation by discharge. In a study focusing on N2O formation by DBD in N2–O2 mixtures, Tang et al. also reported similar increase of N2O production by packing Al2O3 in the discharge zone and surface oxygen species (Al2O3–O*) brought by Al2O3 into the plasma chemical process (reaction (R7)) was considered as the main reason.29
| | |
N2(A3Σu+) + Al2O3–O* → N2O + Al2O3
| (R7) |
where * represents an active site on the catalyst and O* represents atomic oxygen bound to the site.
29
In the presence of Al2O3 catalyst (Fig. 4(b)), the increased concentration of N2O first increased and then tended to reach equilibrium values with the increase of discharge power, demonstrating that N2O production was counterbalanced by N2O loss at high discharge power, especially when N2O was introduced into the inlet gas. As in the plasma case, introduction of 100 ppm-N2O into the N2–O2 mixture also resulted in less production of N2O in the plasma-Al2O3 reactor (Fig. 4(b)).
In addition, it is worth mentioning that although the presence of 100 ppm-N2O in the N2–O2 mixture significantly affected the production of N2O by discharge, it did not induce significant changes to the formation behavior of NO and NO2 in both plasma (Fig. S1†) and plasma-Al2O3 reactors (Fig. S2†) at room temperature.
3.2 Conversion of N2O at high temperature
In order to decompose N2O in the O2-containing atmosphere, the reaction temperature was raised to 300 °C in this section and RuO2/Al2O3 was also investigated besides Al2O3 for plasma-catalytic decomposition of N2O.
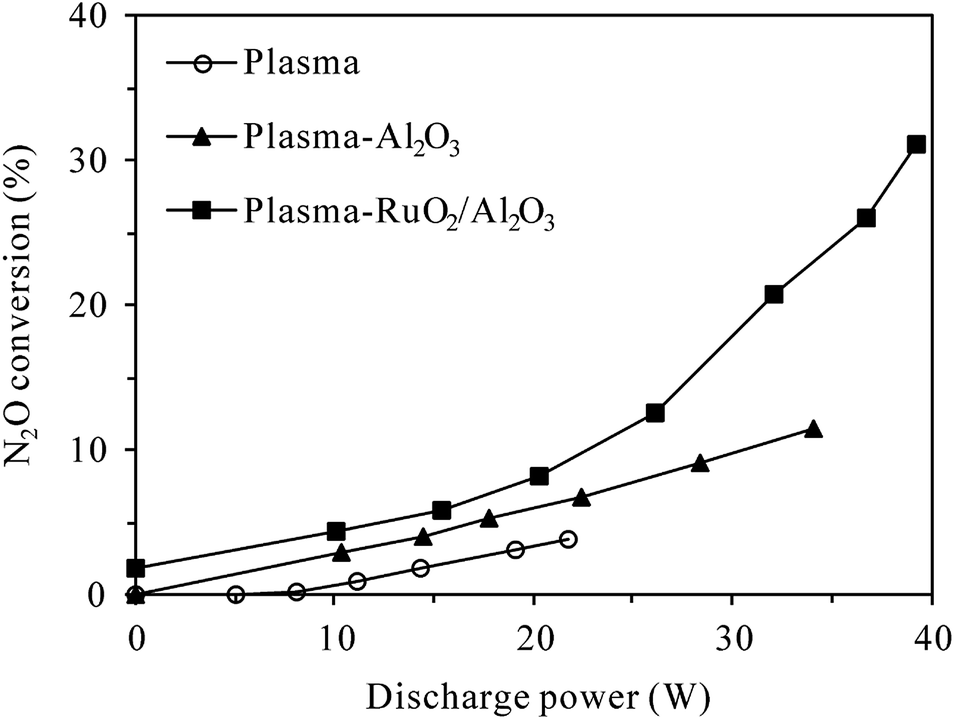
3.2.1 Effects of catalyst introduction. Fig. 5 presents the conversion of N2O in plasma and plasma-catalytic reactors as functions of discharge power at 300 °C. The concentrations of N2O and O2 in the inlet gas were 400 ppm and 5%, respectively. In the absence of plasma (at discharge power of 0 W), a small conversion of N2O (1.8%) was observed in the plasma-RuO2/Al2O3 reactor while no N2O was converted in the plasma or plasma-Al2O3 reactors. This indicated that N2O was stable in the gas phase and over the Al2O3 catalyst at as high as 300 °C, but RuO2/Al2O3 catalyst did show low activity for N2O decomposition. The conversion of N2O increased with the increase of discharge power no matter the catalyst was introduced or not, demonstrating that N2O in N2–O2 mixture could indeed be removed by plasma and plasma-catalytic processes at high temperature. When no catalyst was packed in the discharge zone, however, the N2O conversion was very low, reaching only 3.8% at the highest discharge power tested (21.8 W). Introducing catalyst, especially RuO2/Al2O3 into the discharge zone greatly improved the conversion of N2O. Considering that Al2O3 and RuO2/Al2O3 catalysts alone showed no or very low activity for N2O decomposition at 300 °C, the enhanced conversion of N2O in the plasma-catalytic process could only be attributed to the synergy of plasma and catalyst in N2O conversion.23,24 The highest conversion of N2O, however, was only 31.2% observed in the plasma-RuO2/Al2O3 reactor. As stated in Section 2.2.2, the maximum applicable discharge power was limited at 300 °C due to easy breakdown of the reactor wall material (quartz glass). Further increase of the discharge power and N2O conversion may be achieved by using reactors with higher resistance to breakdown, such as alumina ceramic tube reactor.23
 |
| | Fig. 5 Dependence of N2O conversion on the discharge power in plasma and plasma-catalytic reactors at 300 °C (inlet N2O: 400 ppm; O2 content: 5%). | |
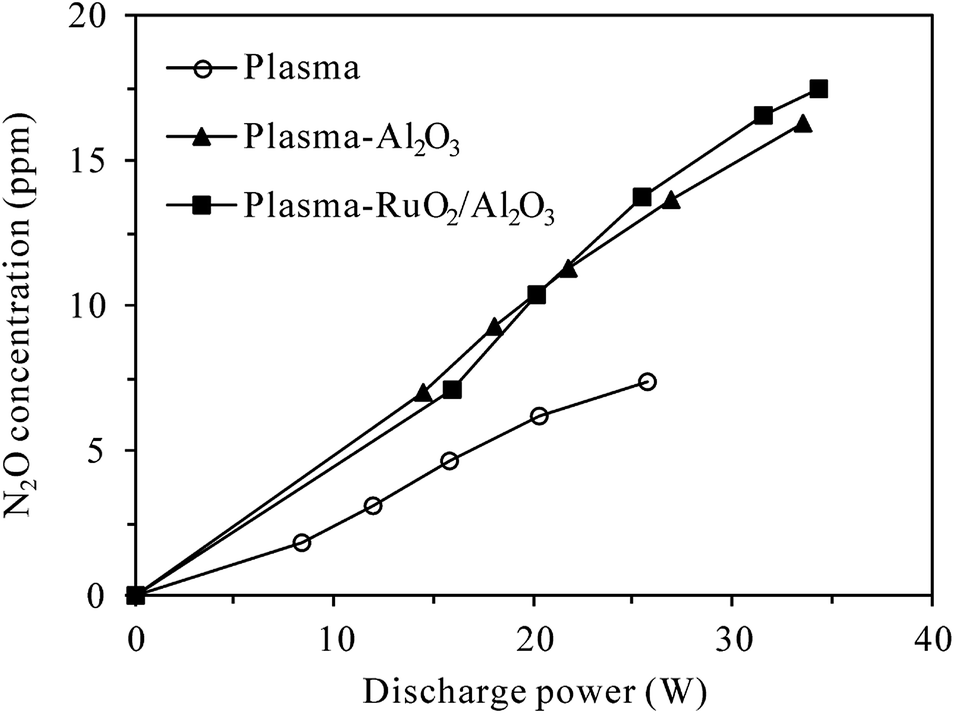
On the other hand, Fig. 6 shows the production of N2O in the plasma and plasma-catalytic processes at 300 °C without N2O in the inlet gas (inlet gas composition: 5% O2 + N2). It can be seen that for both plasma and plasma-catalytic processes, N2O concentration increased almost linearly with discharge power in the range tested. Packing catalyst in the discharge zone greatly enhanced the production of N2O, but no significant difference was observed in N2O production between the plasma-Al2O3 and plasma-RuO2/Al2O3 systems. Compared to the room-temperature case (Fig. 4), much less N2O was produced at 300 °C for the same O2 content (5%) and discharge power. Considering the low conversion of N2O obtained, especially in the plasma and plasma-Al2O3 processes (Fig. 5), the observed less production of N2O (Fig. 6) should be mainly due to the low effectiveness of N2O formation reactions (e.g., (R3)) at high temperature. In other words, high reaction temperature is favorable not only for conversion of N2O but also for reduction of N2O formation by discharge in N2–O2 mixture. At high temperature (300 °C), introducing catalyst, especially RuO2/Al2O3 into the discharge zone significantly enhances the conversion of N2O, overbalancing its promoting effects on N2O production, which finally results in effective removal of N2O from the N2–O2 mixture (Fig. 5).
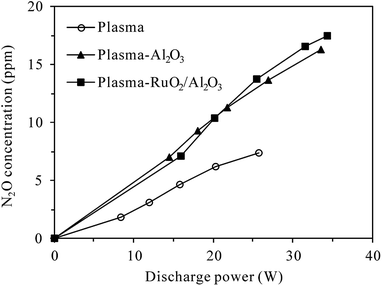 |
| | Fig. 6 Dependence of N2O production on the discharge power in plasma and plasma-catalytic reactors at 300 °C (inlet N2O: 0 ppm; O2 content: 5%). | |
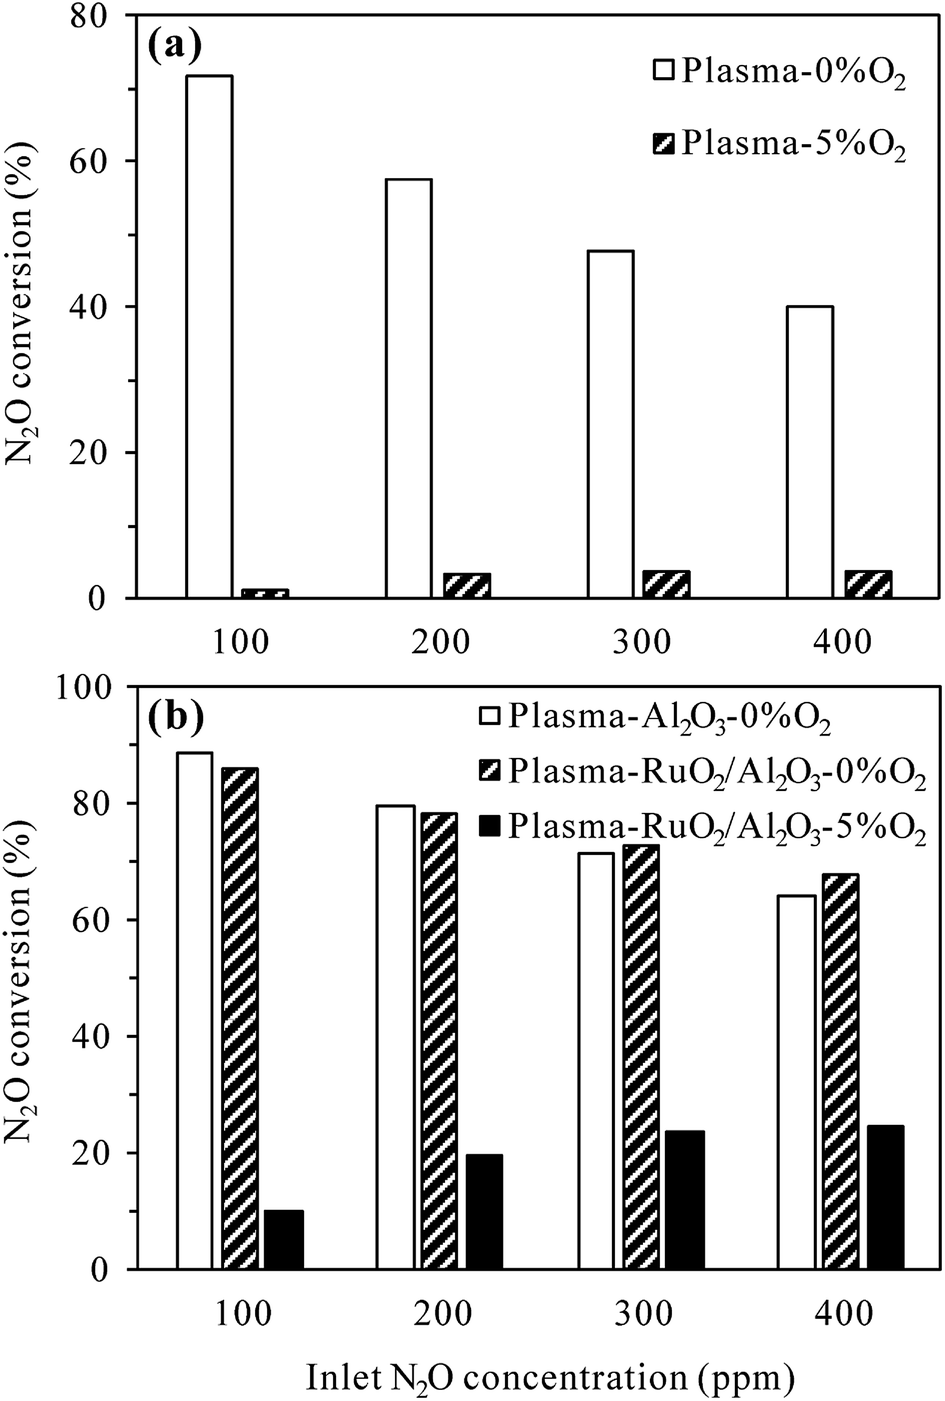
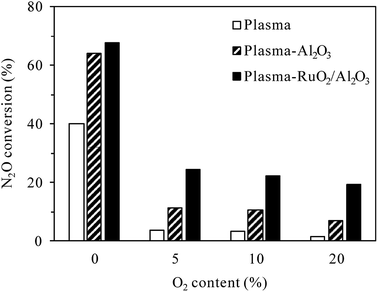
3.2.2 Effects of O2 content. O2 content can largely influence the plasma/plasma-catalytic conversion of N2O due to the intrinsic formation of N2O in N2–O2 plasma. Fig. 7 shows the effects of O2 content on N2O conversion (inlet N2O 400 ppm) in plasma and plasma-catalytic processes at 300 °C. In both the presence and absence of catalyst, the conversion of N2O drastically decreased when the O2 content was changed from 0 to 5%, revealing that O2 inhibited the plasma and plasma-catalytic decomposition of N2O significantly. Jo et al.23 attributed the negative influence of O2 on catalytic and plasma-catalytic decomposition of N2O to the competitive adsorption of O2 onto the active sites over RuO2/Al2O3 catalyst. Besides this, O2 could significantly decrease the electron density and the formation rate of N2(A3Σu+) species in plasma due to its electronegative characteristics.32–35 In addition to directly react with N2(A3Σu+) species to produce additional N2O (reaction (R3)), O2 could also reduce the amount of N2(A3Σu+) species by dissociative quenching (reaction (R8)) due to its low dissociation energy (5.2 eV per molecule).32,36 The decrease of N2(A3Σu+) species for N2O decomposition, additional production of N2O as well as the competitive adsorption of O2 over the catalyst sites should all contribute to the dramatic decrease of N2O conversion in the presence of O2.| | |
N2(A3Σu+) + O2 → N2 + O + O
| (R8) |
 |
| | Fig. 7 Effects of O2 content on N2O conversion in plasma and plasma-catalytic reactors at 300 °C (inlet N2O: 400 ppm; discharge power: 22 W for the plasma process and 34 W for the plasma-catalytic process). | |
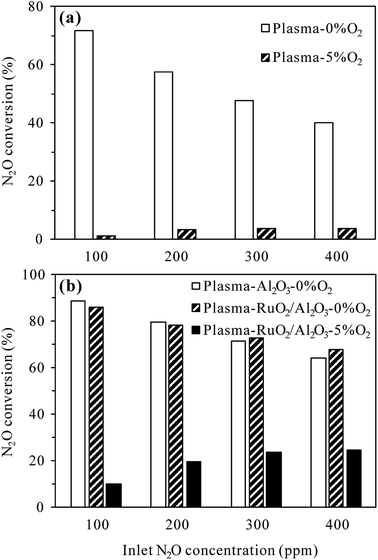
As also shown in Fig. 7, for the same discharge power of 34 W, N2O conversion in the plasma-Al2O3 process decreased from 64.3% for 0% O2 content to 11.4% for 5% O2 content, while that in the plasma-RuO2/Al2O3 process decreased from 67.9% to 24.4%. The superiority of RuO2/Al2O3 over Al2O3 was more pronounced in the O2-containing cases. Further increase of the O2 content from 5% to 10% and 20% caused further decrease of the N2O conversion, but the extent of decrease was less prominent.
3.2.3 Effects of inlet N2O concentration. The inlet concentration of N2O can also be an important factor influencing the plasma and plasma-catalytic decomposition processes. The effects of inlet N2O concentration on N2O conversion at 300 °C with 0% and 5% O2 in the reaction gas are presented in Fig. 8. For the plasma process (Fig. 8(a)), at a given discharge power of 22 W, the conversion of N2O without O2 significantly decreased from 71.6% to 40.0% while that with 5% O2 slightly increased from 1.2% to 3.8% when the inlet N2O concentration was increased from 100 to 400 ppm. It is obvious that higher inlet concentration leads to lower conversion of N2O in N2 plasma due to the competitive consumption of reactive species for N2O decomposition (N2(A3Σu+)) by increasing N2O molecules. In the presence of 5% O2, however, the conversion of N2O was enhanced by injecting more N2O into the reaction gas. The reason for this may be that more N2(A3Σu+) species would be consumed in the decomposition of higher-concentration N2O (reaction (R2)), reducing the amount of N2(A3Σu+) species for N2O formation (reaction (R3)).
 |
| | Fig. 8 Effects of inlet N2O concentration on N2O conversion in (a) plasma and (b) plasma-catalytic reactors at 300 °C (O2 content: 0% or 5%; discharge power: 22 W for the plasma process and 34 W for the plasma-catalytic process). | |
For the plasma-catalytic process (Fig. 8(b)), at a given discharge power of 34 W, the conversion of N2O without O2 also decreased with increasing inlet N2O concentration, but the decrease was less significant compared to that in the plasma process, proving the higher capacity of plasma-catalytic process in decomposing N2O. Besides, it was noticed that the difference in the N2O conversion between the plasma-Al2O3 and plasma-RuO2/Al2O3 processes was insignificant in the absence of O2, indicating the minor role of RuO2 in promoting N2O decomposition under N2 atmosphere although RuO2 greatly improved the N2O conversion under N2–O2 atmosphere (Fig. 5 and 7).
As in the plasma process (Fig. 8(a)), the conversion of N2O in the plasma-RuO2/Al2O3 process also increased with the increase of inlet N2O concentration in the presence of 5% O2, especially from 100 to 200 and 300 ppm (Fig. 8(b)). Further increasing the inlet N2O concentration, e.g., to 400 ppm, showed limited effects in enhancing the N2O conversion, probably due to the limited amount of reactive species (N2(A3Σu+) and O(1D)) produced under a given discharge power for N2O conversion. From the point of fully utilizing the generated reactive species and reducing the negative influence of O2 on N2O conversion, dilute N2O in N2–O2 mixture should be concentrated, e.g., by adsorption–desorption process before being converted by the plasma-catalytic process.20
In addition, it is noteworthy that for the same inlet N2O concentration of 100 ppm and background gas of N2, N2O conversion in the plasma process increased from 47.1% at room temperature (Fig. 3) to 71.6% at 300 °C (Fig. 8(a)) for the same discharge power of 22 W. Similarly, N2O conversion in the plasma-Al2O3 process increased from 66.2% at room temperature (Fig. 3) to 88.7% at 300 °C (Fig. 8(b)) for the same discharge power of 34 W. These results suggest that N2O in N2 could be decomposed more efficiently by plasma and plasma-catalytic processes at higher reaction temperature.
3.3 Mechanism of N2O conversion
3.3.1 N2O conversion pathways. On-line FT-IR (Fig. S3†) and NOx measurement results show that under N2 atmosphere, no other nitrogen oxide species were produced during the plasma and plasma-catalytic decomposition of N2O regardless of the reaction temperature. O radicals generated in (R2) should have recombined and/or reacted with N2O ((R6)) to give out O2 as the final product instead of being consumed for NO/NO2 production. In other words, N2O was degraded to N2 and O2 by discharge in N2 in both the presence and absence of catalyst and at both room and high temperature. Trinh et al.20 proposed similar mechanism for direct decomposition of N2O in N2 DBD plasma.On the other hand, as stated in Section 3.2, N2O in N2–O2 mixture could be removed by plasma and plasma-catalytic processes only at high temperature. Fig. S4† shows typical FT-IR spectra of the effluents of plasma and plasma-catalytic reactors with and without 400 ppm-N2O in the inlet gas (O2 content 5%) and before and after discharge at 300 °C. Clearly, discharge in N2–O2 mixture at 300 °C produced N2O, NO and NO2 as byproducts no matter the catalyst was present or not. When N2O was introduced into the N2–O2 mixture, NO and NO2 were also detected besides the residual N2O. In order to clarify whether N2O was converted to NO and NO2 under N2–O2 atmosphere, the outlet concentrations of NO and NO2 detected with and without 400 ppm-N2O in the inlet gas were compared in Fig. 9.
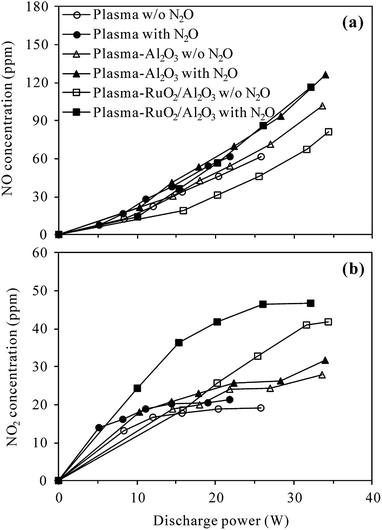 |
| | Fig. 9 Concentrations of (a) NO and (b) NO2 formed with and without 400 ppm N2O in the inlet gas of plasma and plasma-catalytic reactors at 300 °C (O2 content: 5%). | |
Overall, NO and NO2 concentrations increased with the increase of discharge power and the presence of 400 ppm-N2O in the N2–O2 mixture did not obviously change the variation trends of NO or NO2 concentrations. For a given discharge power, however, higher concentrations of NO and NO2 were always detected when N2O was introduced, especially in the plasma-RuO2/Al2O3 process. This result revealed that N2O was partially transformed into NO and NO2 during the O2-containing conversion processes, being in agreement with the observations of Krawczyk et al.24,25 Table 1 lists the selectivity of NO, NO2 and NOx (NO + NO2) at typical discharge power in the plasma and plasma-catalytic processes. As seen, the selectivity of NOx ranged from 28.7% of the plasma-Al2O3 process at 34.0 W to 79.5% of the plasma process at 14.4 W. Other removed N2O should have been degraded to benign N2 and O2 since no N-containing byproducts other than NO and NO2 were observed.
Table 1 Selectivity of NO, NO2 and NOx (NO + NO2) at typical discharge power in plasma and plasma-catalytic processes (inlet N2O: 400 ppm; O2 content: 5%; reaction temperature: 300 °C)
| Process |
Discharge power (W) |
Selectivity of NO (%) |
Selectivity of NO2 (%) |
Selectivity of NOx (%) |
| Plasma |
14.4 |
59.2 |
20.3 |
79.5 |
| 21.8 |
37.1 |
7.6 |
44.7 |
| Plasma-Al2O3 |
14.4 |
34.0 |
6.5 |
40.5 |
| 34.0 |
24.7 |
4.0 |
28.7 |
| Plasma-RuO2/Al2O3 |
15.4 |
36.9 |
38.7 |
75.6 |
| 32.1 |
28.4 |
3.4 |
31.8 |
Table 1 also shows that compared to the plasma process, the selectivity of NOx was relatively low in the plasma-catalytic process, indicating that catalyst packed in the discharge zone promoted N2O decomposition to N2 and O2 to a larger extent than oxidation to NO and NO2. For all processes, the selectivity of NO and NO2 decreased with the increase of discharge power, probably due to the substantial increase of NO and NO2 formation from plasma-induced reactions between N2 and O2 which competitively consumed oxidative species, as shown in reactions (R9)–(R12).27,29,32,37 Besides, the selectivity of NO was much higher than that of NO2 except at low discharge power of the plasma-RuO2/Al2O3 process. This can be easily ascribed to the step-wise oxidation of N2O (first (R5) and then (R11) and (R12)) under oxidative plasma atmosphere.27,32,37
| | |
N2(A3Σu+) + O → NO + N(2D)
| (R9) |
| | |
NO + O + M → NO2 + M (M = N2, O2, NO, NO2, N2O)
| (R11) |
Compared to Al2O3 catalyst, RuO2/Al2O3 catalyst significantly enhanced the selectivity of NO2 at low discharge power. At higher discharge power, however, the difference in the selectivity of NO and NO2 between the two plasma-catalytic processes became insignificant. At the relatively high discharge power tested, more than 40% and ca. 30% of the removed nitrogen in N2O was transformed into NOx in the plasma and plasma-catalytic process, respectively.
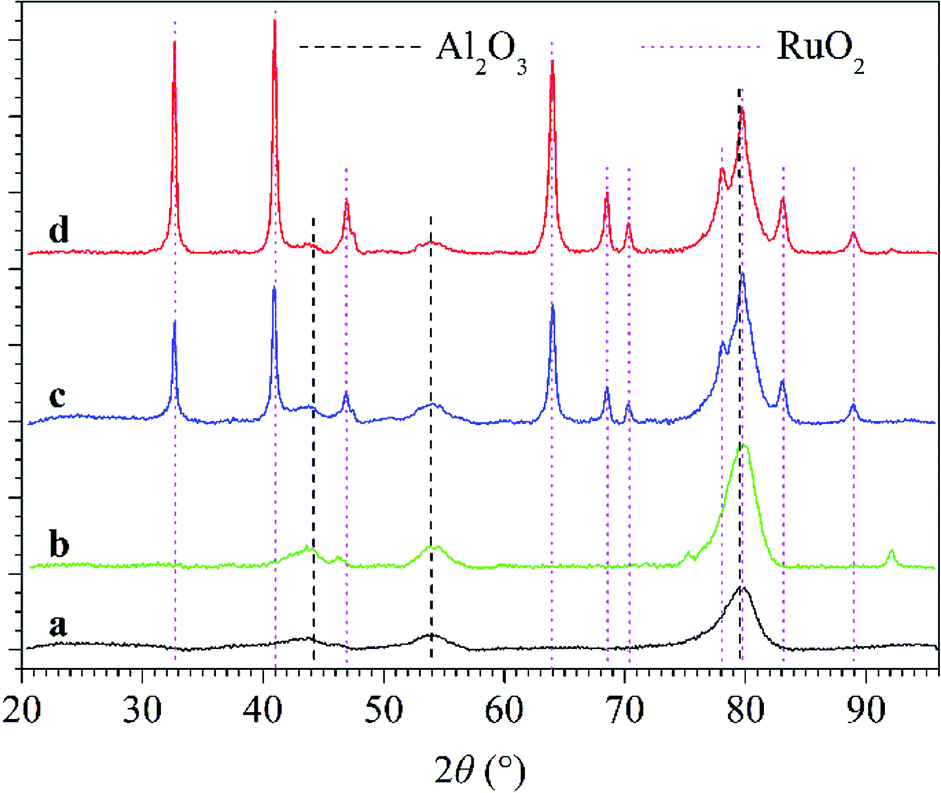
3.3.2 Synergy mechanism of plasma and catalyst for N2O conversion under N2–O2 atmosphere. From the above-mentioned analysis, it can be concluded that introducing catalyst, especially RuO2/Al2O3 into the discharge zone significantly enhanced the conversion of N2O and promoted N2O decomposition to N2 and O2 under N2–O2 atmosphere. Fig. 10 shows the XRD patterns of Al2O3 and RuO2/Al2O3 catalysts before and after use in plasma-catalytic conversion of N2O at 300 °C. From the XRD analysis, cubic Al2O3 was observed for all catalyst samples and tetragonal RuO2 was formed over the RuO2/Al2O3 catalyst. For both Al2O3 and RuO2/Al2O3 catalysts, the XRD patterns were almost unchanged after use, indicating that neither plasma nor the N2O conversion reactions changed the phase composition of the catalysts.
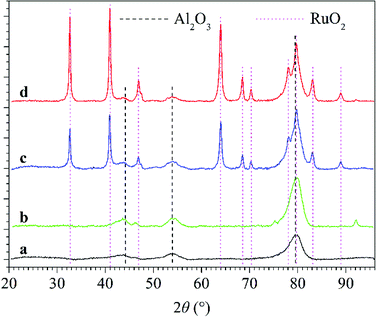 |
| | Fig. 10 XRD patterns of Al2O3 and RuO2/Al2O3 catalysts: (line a) fresh Al2O3 catalyst; (line b) Al2O3 catalyst after use in plasma-catalytic conversion of N2O at 300 °C; (line c) fresh RuO2/Al2O3 catalyst; (line d) RuO2/Al2O3 catalyst after use in plasma-catalytic conversion of N2O at 300 °C. | |
According to literatures, the decomposition of N2O over metal oxide catalysts can be expressed as a Langmuir–Hinshelwood mechanism:
where * stands for an active site of the catalyst.
3,23 In this mechanism, the adsorbed surface oxygen (O*) migrates from one active site to another to form O
2 by recombination, which is known to be the rate-determining step.
3,23 Applying DBD plasma in the RuO
2/Al
2O
3 catalyst bed could not only initiate gas-phase conversion of N
2O (
(R2),
(R5) and
(R6)), but also accelerate the catalytic conversion of N
2O by speeding up the consumption of adsorbed surface oxygen (O*),
e.g.,
via reaction
(R15) to regenerate the active sites.
23 In fact, the scavenging of O* by O radicals (reaction
(R15)) also explained the decreased selectivity of NO
x (increased selectivity of N
2 and O
2) in the presence of catalyst (
Table 1), revealing the synergy of plasma and catalyst in promoting N
2O decomposition.
4. Conclusions
In the present work, conversion of dilute N2O in N2 and N2–O2 mixtures by plasma and plasma-catalytic processes was investigated at both room and high temperature (300 °C). It is found that N2O in N2 can be effectively decomposed to N2 and O2 by plasma and plasma-catalytic processes at both room and high temperature, with much higher decomposition efficiency at 300 °C than at room temperature for the same discharge power. However, N2O in N2–O2 mixture can be removed only at high temperature, producing not only N2 and O2 but also NO and NO2. Production and conversion of N2O occur simultaneously during the plasma and plasma-catalytic processing of N2O in N2–O2 mixture, with production and conversion being the dominant process at room and high temperature, respectively.
N2O conversion increases with the increase of discharge power and decreases with the increase of O2 content. The negative influence of O2 on N2O conversion could be suppressed to some extent by concentrating N2O in N2–O2 mixture which increases the involvement of plasma reactive species (e.g., N2(A3Σu+) and O(1D)) in N2O conversion. Introducing catalyst, especially RuO2/Al2O3 into the discharge zone significantly enhances the conversion of N2O and improves the selectivity of N2O decomposition under N2–O2 atmosphere, revealing the synergy of plasma and catalyst in promoting N2O conversion, especially its decomposition to N2 and O2. The combined plasma-catalytic processing may be an efficient way for reducing N2O emissions from combustion and industrial sources.
Conflicts of interest
There are no conflicts to declare.
Acknowledgements
This work was supported by the National Natural Science Foundation of China (grant numbers 21707004, 51638001) and the Natural Science Foundation of Beijing Municipality (grant number 8152011).
References
- J. Pérez-RamíRez, F. Kapteijn, K. Schöffel and J. A. Moulijn, Appl. Catal., B, 2003, 44, 117–151 CrossRef.
- K. R. Sistani, M. Jn-Baptiste, N. Lovanh and K. L. Cook, J. Environ. Qual., 2011, 40, 1797–1805 CrossRef PubMed.
- M. Konsolakis, ACS Catal., 2015, 5, 6397–6421 CrossRef.
- A. Ates, A. Reitzmann, C. Hardacre and H. Yalcin, Appl. Catal., A, 2011, 407, 67–75 CrossRef.
- F. Zhang, X. Wang, X. Zhang, M. Turxun, H. Yu and J. Zhao, Chem. Eng. J., 2014, 256, 365–371 CrossRef.
- M. Konsolakis, F. Aligizou, G. Goula and I. V. Yentekakis, Chem. Eng. J., 2013, 230, 286–295 CrossRef.
- S. S. Kim, S. J. Lee and S. C. Hong, Chem. Eng. J., 2011, 169, 173–179 CrossRef.
- Z. Liu, C. He, B. Chen and H. Liu, Catal. Today, 2017, 297, 78–83 CrossRef.
- H. L. Chen, H. M. Lee, S. H. Chen, M. B. Chang, S. J. Yu and S. N. Li, Environ. Sci. Technol., 2009, 43, 2216–2227 CrossRef PubMed.
- J. V. Durme, J. Dewulf, C. Leys and H. V. Langenhove, Appl. Catal., B, 2008, 78, 324–333 CrossRef.
- X. Fan, T. L. Zhu, Y. F. Sun and X. Yan, J. Hazard. Mater., 2011, 196, 380–385 CrossRef PubMed.
- Y. J. Wan, X. Fan and T. L. Zhu, Chem. Eng. J., 2011, 171, 314–319 CrossRef.
- X. Fan, T. L. Zhu, Y. J. Wan and X. Yan, J. Hazard. Mater., 2010, 180, 616–621 CrossRef PubMed.
- X. Fan, T. L. Zhu, M. Y. Wang and X. M. Li, Chemosphere, 2009, 75, 1301–1306 CrossRef PubMed.
- Q. Yu, Y. Gao, X. Tang, H. Yi, R. Zhang, S. Zhao, F. Gao and Y. Zhou, Catal. Commun., 2018, 110, 18–22 CrossRef.
- A. Mizuno, Catal. Today, 2013, 211, 2–8 CrossRef.
- X. Hu, J. Nicholas, J. Zhang, T. M. Linjewile, P. D. Filippis and P. K. Agarwal, Fuel, 2002, 81, 1259–1268 CrossRef.
- G. B. Zhao, X. D. Hu, M. D. Argyle and M. Radosz, Ind. Eng. Chem. Res., 2004, 43, 5077–5088 CrossRef.
- S. Mahammadunnisa, E. L. Reddy, P. R. M. K. Reddy and C. Subrahmanyam, Plasma Processes Polym., 2013, 10, 444–450 CrossRef.
- Q. Trinh, S. H. Kim and Y. S. Mok, Chem. Eng. J., 2016, 302, 12–22 CrossRef.
- D. H. Lee and T. Kim, N2O decomposition by catalyst-assisted cold plasma, 20th Int. Symp. Plasma Chem., Philadelphia, USA, 2012 Search PubMed.
- H. Hu, H. Huang, J. Xu, Q. Yang and G. Tao, Plasma Sci. Technol., 2015, 17, 1043–1047 CrossRef.
- J. Jo, Q. H. Trinh, S. H. Kim and Y. S. Mok, Catal. Today, 2018, 310, 42–48 CrossRef.
- K. Krawczyk and M. Młotek, Appl. Catal., B, 2001, 30, 233–245 CrossRef.
- K. Schmidt-Szałowski, K. Krawczyk and M. Młotek, J. Adv. Oxid. Technol., 2007, 10, 330–336 Search PubMed.
- G. Pekridis, C. Athanasiou, M. Konsolakis, I. V. Yentekakis and G. E. Marnellos, Top. Catal., 2009, 52, 1880–1887 CrossRef.
- I. A. Kossyi, A. Y. Kostinsky, A. A. Matveyev and V. P. Silakov, Plasma Sources Sci. Technol., 1992, 1, 207–220 CrossRef.
- M. P. Iannuzzi, J. B. Jeffries and F. Kaufman, Chem. Phys. Lett., 1982, 87, 570–574 CrossRef.
- X. Tang, J. Wang, H. Yi, S. Zhao, F. Gao, Y. Huang, R. Zhang and Z. Yang, Energy Fuels, 2017, 31, 13901–13908 CrossRef.
- J. T. Herron and D. S. Green, Plasma Chem. Plasma Process., 2001, 21, 459–481 CrossRef.
- K. Krawczyk, IEEE Trans. Plasma Sci., 2009, 37, 884–889 Search PubMed.
- G. B. Zhao, S. Garikipati, X. D. Hu, M. D. Argyle and M. Radosz, AIChE J., 2005, 51, 1800–1812 CrossRef.
- G. Sathiamoorthy, S. Kalyana, W. C. Finney, R. J. Clark and B. R. Locke, Ind. Eng. Chem. Res., 1999, 38, 1844–1855 CrossRef.
- S. Kanazawa, J. S. Chang, G. F. Round, G. Sheng, T. Ohkubo, Y. Nomoto and T. Adachi, J. Electrost., 1997, 40–41, 651–656 CrossRef.
- Y. S. Mok, J. H. Kim, I. S. Nam and S. W. Ham, Ind. Eng. Chem. Res., 2000, 39, 3938–3944 CrossRef.
- M. S. Bak, W. Kim and M. A. Cappelli, Appl. Phys. Lett., 2011, 98, 011502 CrossRef.
- Y. Zhang, X. Tang, H. Yi, Q. Yu, J. Wang, F. Gao, Y. Gao, D. Li and Y. Cao, RSC Adv., 2016, 6, 63946–63953 RSC.
Footnote |
| † Electronic supplementary information (ESI) available. See DOI: 10.1039/c8ra05607b |
|
| This journal is © The Royal Society of Chemistry 2018 |
Click here to see how this site uses Cookies. View our privacy policy here. 
 Open Access Article
 This Open Access Article is licensed under a Creative Commons Attribution-Non Commercial 3.0 Unported Licence
 *a,
Sijing Kanga,
Jian Lia and
Tianle Zhub
*a,
Sijing Kanga,
Jian Lia and
Tianle Zhub