DOI:
10.1039/C8RA05330H
(Paper)
RSC Adv., 2018,
8, 31555-31563
Interaction mechanism of olaparib binding to human serum albumin investigated with NMR relaxation data and computational methods
Received
21st June 2018
, Accepted 2nd September 2018
First published on 10th September 2018
Abstract
The interaction mechanism between olaparib (OLA) and human serum albumin (HSA) has been investigated using experimental and computational techniques. An NMR relaxation approach based on the analysis of proton selective and non-selective spin–lattice relaxation rates at different temperatures can provide quantitative information about the affinity index and the thermodynamic equilibrium constant of the OLA–HSA system. The affinity index and the thermodynamic equilibrium constant decreased as temperature increased, indicating that the interactions between OLA and HSA could be weakened as temperature increased. Molecular docking and dynamics simulations revealed that OLA stably bound to subdomain II (site 1), and OLA could induce the conformational and micro-environmental changes in HSA. CD results suggested that α-helix content decreased after OLA was added, demonstrating that OLA affected the secondary structure of HSA.
1. Introduction
The interaction mechanism between drugs and biological macromolecules, especially drug–serum albumin related to human life and health, has been explored.1–4 Among serum albumins, human serum albumin (HSA) has been intensively investigated because of its high concentration in human blood plasma.5,6 The spatial structure of HSA consists of three homologous α-helical domains (domains I, II, and III), and each domain can be further divided into two subdomains (A and B) as illustrated by X-ray crystallography.5,7 The primary drug-binding regions on HSA are Sudlow's site I and site II, which are located in the hydrophobic cavities of subdomains II-A and III-A, respectively.8,9
Olaparib (OLA), a potent oral poly(ADP-ribose) polymerase (PARP) enzyme inhibitor, which plays essential roles in controlling DNA repair and eventually killing cancer cells, can be used as a targeted therapy for certain types of cancer, such as breast and ovarian cancer, in people with hereditary BRCA mutations.10–12 Ovarian cancer is the seventh-most common malignant tumor among gynecologic systems.13 To treat BRCA-mutated ovarian cancer and to overcome frequent recurrence and chemotherapeutic resistance of ovarian cancer, medical scholars prefer OLA as a PARP inhibitor because it has achieved satisfactory therapeutic outcomes.14–16 However, the binding of OLA with HSA during drug transport through blood circulation has yet to be fully elucidated. Consequently, the interaction mechanism between OLA and HSA should be comprehensively understood to elucidate the pharmacokinetic and pharmacodynamic behaviors of OLA.
Various characterization methods, including isothermal titration calorimetry, equilibrium dialysis, capillary electrophoresis, ultrafiltration, circular dichroism spectroscopy (CD), fluorescence spectroscopy, Fourier transform infrared spectroscopy, Raman spectroscopy, and nuclear magnetic resonance (NMR), have been utilized to reveal the interaction mechanism between drugs and proteins.17–23 Among these reasonable and reliable methods, NMR is an efficient technique to probe ligand–receptor interactions at the molecular level.1–3,24 Hence, the applications of some advanced NMR approaches, such as saturation transfer difference and proton spin–lattice selective relaxation rates, provide in-depth atomistic insights into structural affinity and site-selective interactions between drugs and proteins. In particular, the spin–lattice relaxation rates of the ligand active proton nuclei are highly sensitive to describe the structural transformations of the ligand–macromolecules complex, because the motional behaviors will be affected when the fast moving small drug molecules interact with the slowly moving macromolecules.
In the present study, the proton selective and nonselective spin–lattice relaxation rates measured via NMR were utilized to quantitatively analyze the affinity index ([ANl]TL) and the thermodynamic equilibrium constant (K) of an OLA–HSA system. Fluorescence methods, CD spectroscopy and time-resolved fluorescence spectroscopy were performed to evaluate the NMR data and conformational changes induced by OLA. Molecular docking and dynamics simulation were applied to visualize the dynamic binding of the OLA–HSA system.
2. Experiments and methods
2.1 NMR experiments
All NMR measurements were performed using a Bruker Avance II 600 MHz (14.1 T) spectrometer operating at 600.13 MHz for protons at 298, 304, and 310 K, respectively. An inversion recovery pulse sequence was used to measure the spin–lattice relaxation rates, and a 180° pulse of a Gaussian shape with a pulse duration of 30 ms was set for the selective experiments. The selective and nonselective experiments involved the following τ: 0.005, 0.01, 0.02, 0.06, 0.1, 0.2, 0.4, 0.6, 0.8, 1, 1.5, 2, 3, 4, 5, 8, 12, and 20 s. The delay time in this case was 5 s. All the recoveries of the proton longitudinal magnetization after 180° pulse in spin-relaxation measurements were found to be single exponential, and the maximum error was less than 5%. NMR data processing and analysis were performed using Topspin 3.5 (Bruker Corporation).
2.2 Time-resolved fluorescence spectra
Time-resolved fluorescence spectra at room temperature in a singlet state were obtained using a time-correlated single-photon counting technique with a Horiba Jobin Yvon FluoroLog-TCSPC spectrofluorometer (Horiba, Les Ulis, France). HSA (2 μM) in the absence and presence of OLA (4 or 8 μM) was investigated at excitation and emission wavelengths of 280 and 345 nm, respectively.
2.3 CD spectra
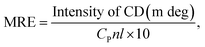
CD spectra were obtained with an automatic recording spectrophotometer (Model 400, AVIV, USA) equipped with a Peltier temperature control unit in a cell with a path length of 10 mm at room temperature. The spectra of 2 μM HSA in the presence of 0, 4, and 8 μM OLA were obtained in the scan range of 190 nm to 250 nm with a step size of 1 nm, a band width of 1 nm, and a response time of 0.5 s. The mean residue ellipticity (MRE, deg cm2 d mol−1) was used to express the CD results in accordance with the following equation:25| |
 | (1) |
where CP is the HSA concentration, n is the number of amino acid residues of HSA, and l represents the path length (0.1 dm).
2.4 Molecular docking
All molecular docking studies of ligand–proteins in a simulated physiological environment were performed using YASARA v16.7.22 (ref. 26 and 27) and AutoDock VINA at pH 7.4 and 298 K. The 3D structure of OLA was obtained from PubChem (PubChem CID: 23725625), and the available crystal structure of HSA was downloaded from the RCSB protein data bank (PDB ID: 1H9Z).28 Before molecular docking was carried out, the 3D structure of OLA was energetically optimized using ChemBioOffice, and all the water molecules were removed from the free HSA. During docking, all the binding sites in HSA were recognized by setting the grid box covering the whole protein. Docking with 25 independent runs was conducted to determine the optimum binding conformations. The conformation with the highest binding energy was used for further analysis.
2.5 Molecular dynamics simulations
Molecular dynamics simulations were performed using YASARA v16.7.22 with an AMBER14 (ref. 29) molecular dynamics force field at pH 7.4 and 298 K in the simulated physiological environment. Subsequently, the simulation grid box was designed with a 90 Å × 90 Å × 90 Å spatial volume, and the optimum binding conformation of OLA–HSA during docking was located at the grid center. Periodic boundary conditions were applied to the above system. Multiple integration steps were employed during simulation (1.25 fs and 2.5 fs for intramolecular and intermolecular forces, respectively), and data were collected every 10 ps for a molecular orbital file. The relevant parameters of the molecular orbital file were investigated through molecular dynamics, and the simulation results of the OLA–HSA system and the free HSA were comparatively analyzed.
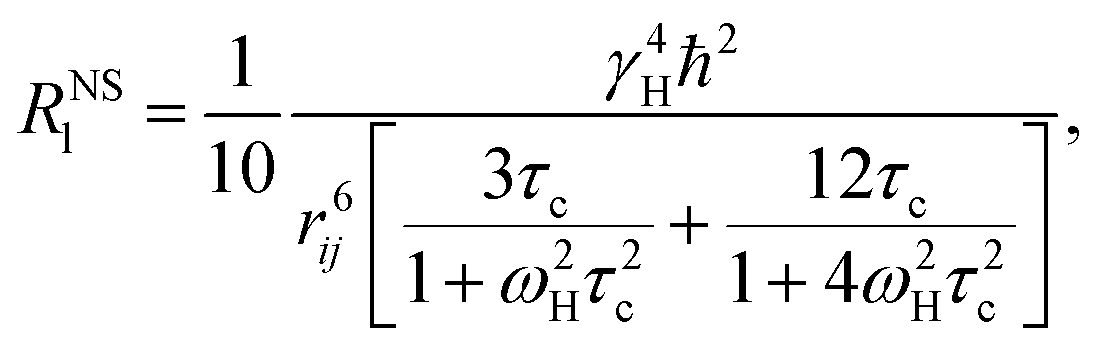
2.6 Theoretical methods for NMR
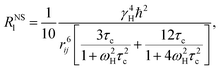
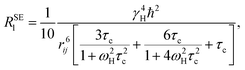
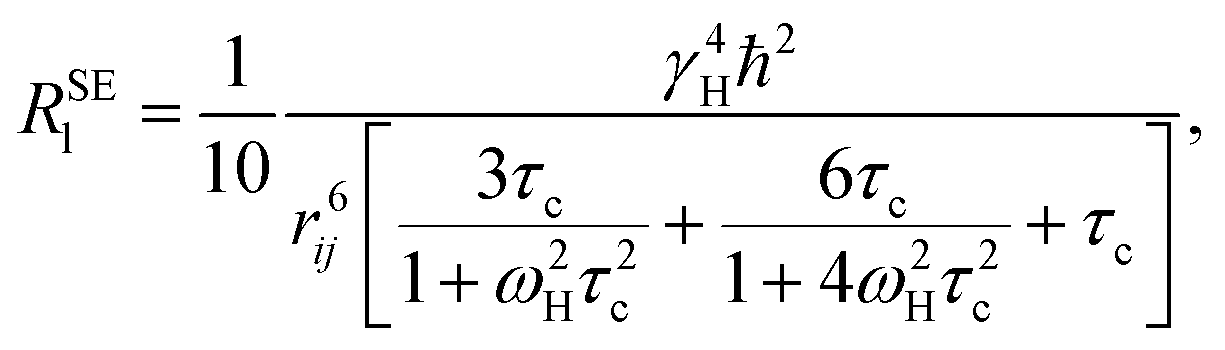
The nonselective RNSl and selective RSEl proton spin–lattice relaxation rates are defined by the following equations:30–33| |
 | (2) |
| |
 | (3) |
where, ℏ, γH, and ωH, are Planck's constant, proton magnetogyric ratio, and Larmor frequency, respectively; rij is the internuclear distance; and τc is the molecular rotational correlation time, which dominates the i − j dipolar interactions. On the basis of eqn (2) and (3), we easily deduce that RNSl and RSEl can be affected by the dynamic parameter τc to different extents, that is, when the free ligand is in a fast molecular reorientation time regime (ω0τc ≪ 1), RNSl > RSEl. Conversely, when the ligand is bound to a macromolecule (ω0τc ≫ 1), RSEl > RNSl.
RSEl can be affected by drastic changes in molecular dynamics. Consequently, RSEl has been widely used to investigate ligand–macromolecule interactions. With the fast chemical exchange between free and bound states, RSEl of a ligand can be described by the following equation:
| | |
RSElobs = χfRSElf + χbRSElb,
| (4) |
where
RSElobs is the experimentally observed selective relaxation rate.
RSElf,
χf,
RSElb, and
χb are the selective spin–lattice relaxation rates and the molar fractions of the ligand under free and bound conditions, respectively.
Considering the ligand–receptor system at equilibrium, we derive:
| |
 | (5) |
with a thermodynamic equilibrium constant

Assuming [L] ≫ [M
0], we obtain the following equation:
| |
 | (6) |
where Δ
RSEl =
RSElobs −
RSElf, and [M
0] is the initial macromolecule concentration. Plotting Δ
RSEl versus [M
0], we can acquire a straight line with its slope:
| |
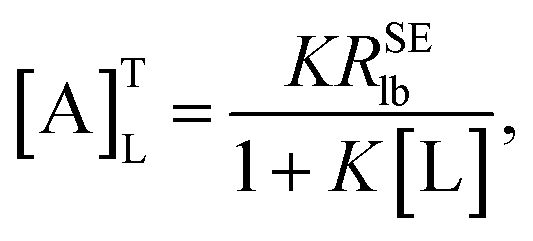
 | (7) |
which was defined as the “affinity index” (mol
−1 L s
−1). When temperature and ligand concentration are specified, [A]
TL is a constant that can be used to quantitatively evaluate the ligand–receptor interaction strength.
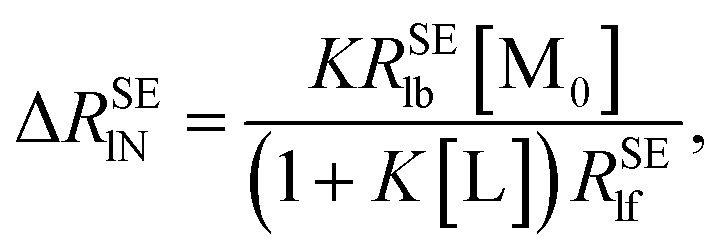
The normalization of ΔRSEl = RSElobs − RSElf to RSElf is employed to investigate the effects of restricted motions induced by the ligand–macromolecule interaction individually and to remove the effects caused by varied correlation times and proton densities originated at different positions of the ligand molecule, leading to a normalized affinity index:34,35
| |
 | (8) |
Similarly, a straight line passing through the origin of the axes can be obtained by plotting Δ
RSElN versus [M
0] with the slope:
| |
 | (9) |
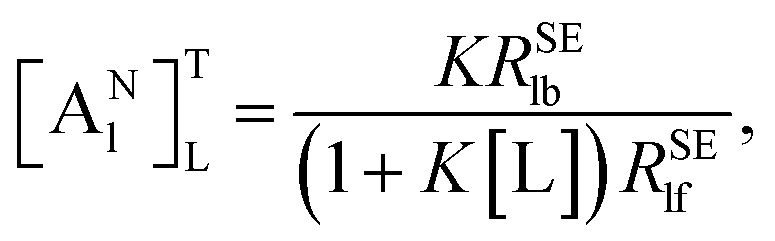
[A
Nl]
TL is defined as the “normalized affinity index” (mol
−1 L), which is constant at the specified temperature and ligand concentration.
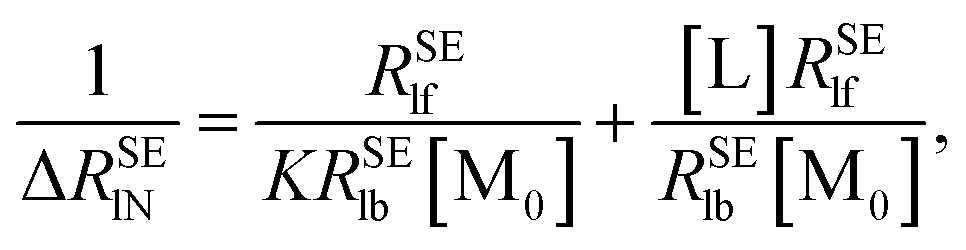
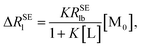
In order to calculate the K and ΔRSElb, eqn (8) can be rewritten as follows:
| |
 | (10) |
| |
 | (11) |
Plotting 1/Δ
RSElN with the ligand concentration [L], we can obtain a straight line with the slope (
S) and the intercept (
I):
34,36| |
 | (12) |
| |
 | (13) |
Finally,
K can be obtained using
eqn (12) and
(13).
3. Results and discussions
3.1 NMR data of the OLA–HSA system
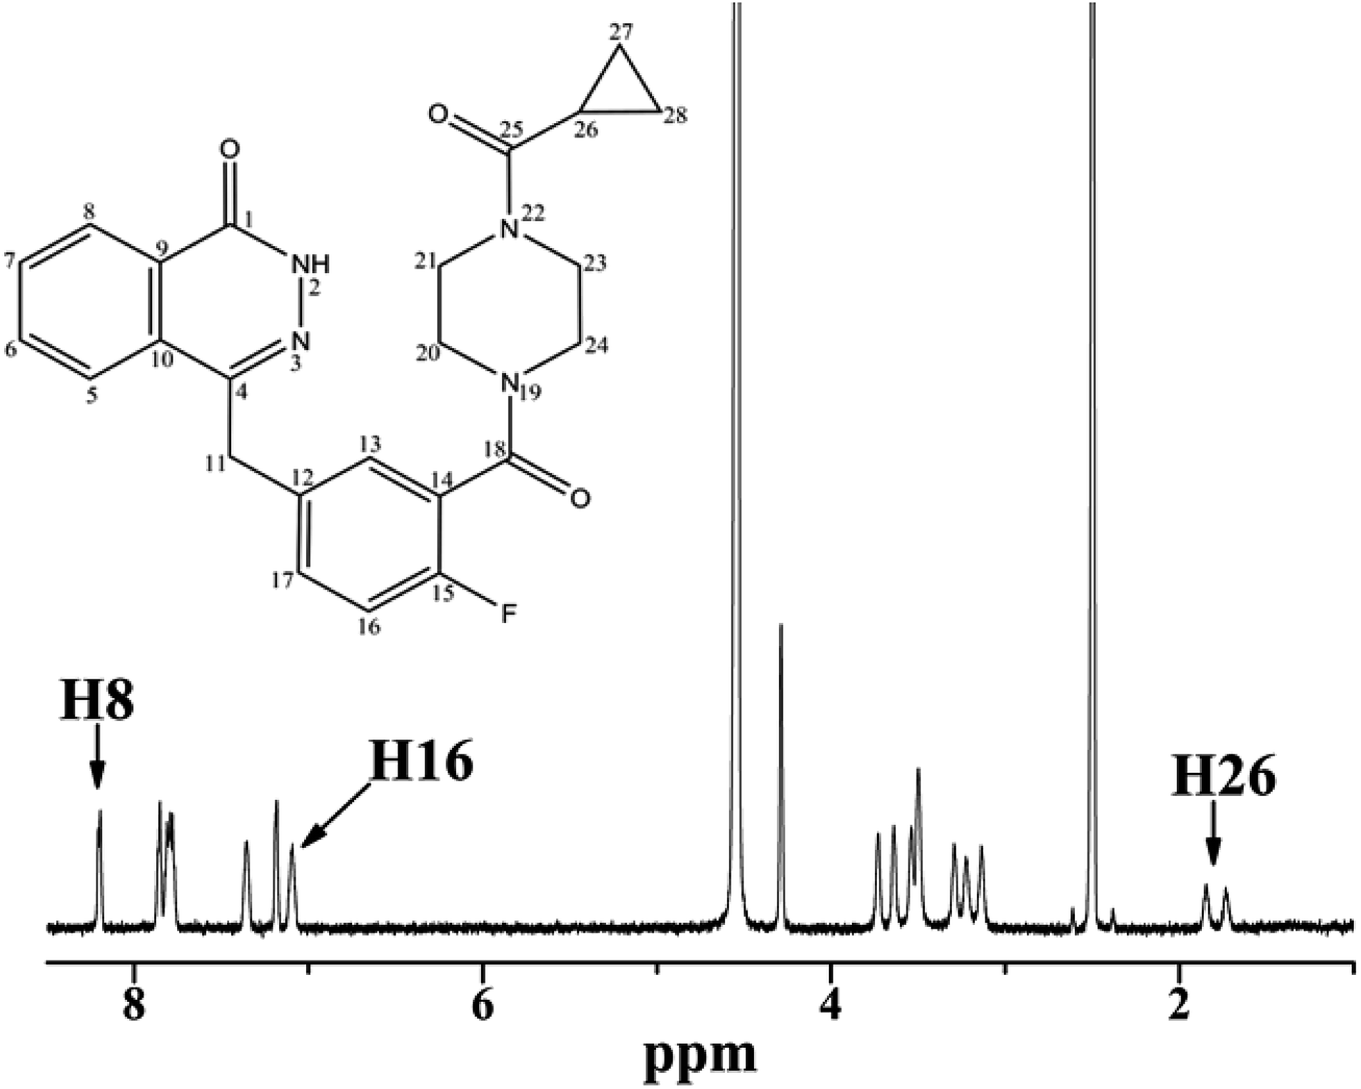
3.1.1 1H analysis of OLA in the presence of HSA. NMR spectroscopy has been widely used to explore the mode of the interaction between small molecules and proteins. Fig. 1 illustrates the proton NMR spectrum of OLA and the resonance assignments. To comprehensively analyze the interaction between OLA and HSA, we selected the well-resolved proton peaks H8 and H16 in the aromatic region and the aliphatic hydrogen H26 doublet for selective and nonselective measurements.
 |
| | Fig. 1 Chemical structure and 1H NMR spectrum of OLA at 298 K. | |
The experimental RNSl and RSEl of H8, H16, and H26 protons of OLA in relation to HSA concentrations at different temperatures are listed in Tables 1, 2, and 3. In all the observed protons, RNSl > RSEl in the absence of HSA, indicating that OLA exhibited fast re-orientational motions in the solution. RSEl was greater than RNSl as protein concentrations increased. The enhancement of RSEl elucidated that the observed relaxation rates were remarkably influenced by the bound ligand fraction, implying the occurrence of an interaction between OLA and HSA. The interactions between the ligand and the protein could be reasonably investigated on the basis of the analysis of RSEl and RNSl measured in the absence and presence of the macromolecules.
Table 1 RNSl and RSEl of H8, H16, and H26 protons for OLA (3 mM) in the presence of various HSA concentrations at 298 K
| HSA (μM) |
H8 |
H16 |
H26 |
| RNSl (s−1) |
RSEl (s−1) |
RNSl (s−1) |
RSEl (s−1) |
RNSl (s−1) |
RSEl (s−1) |
| 0 |
0.33 |
0.32 |
0.50 |
0.49 |
1.06 |
1.04 |
| 7.58 |
0.37 |
0.37 |
0.51 |
0.52 |
1.07 |
1.02 |
| 15.15 |
0.40 |
0.39 |
0.52 |
0.55 |
1.06 |
1.05 |
| 22.73 |
0.41 |
0.42 |
0.57 |
0.58 |
1.07 |
1.08 |
| 33.30 |
0.44 |
0.47 |
0.60 |
0.60 |
1.06 |
1.09 |
| 37.88 |
0.46 |
0.48 |
0.61 |
0.63 |
1.08 |
1.08 |
| 45.45 |
0.49 |
0.52 |
0.63 |
0.65 |
1.09 |
1.09 |
Table 2 RNSl and RSEl of H8, H16, and H26 protons for OLA (3 mM) in the presence of various HSA concentrations at 304 K
| HSA (μM) |
H8 |
H16 |
H26 |
| RNSl (s−1) |
RSEl (s−1) |
RNSl (s−1) |
RSEl (s−1) |
RNSl (s−1) |
RSEl (s−1) |
| 0 |
0.32 |
0.31 |
0.48 |
0.47 |
1.06 |
1.04 |
| 7.58 |
0.33 |
0.35 |
0.49 |
0.50 |
1.05 |
1.05 |
| 15.15 |
0.34 |
0.37 |
0.52 |
0.53 |
1.06 |
1.06 |
| 22.73 |
0.38 |
0.39 |
0.55 |
0.55 |
1.05 |
1.06 |
| 33.30 |
0.42 |
0.43 |
0.56 |
0.58 |
1.06 |
1.08 |
| 37.88 |
0.44 |
0.44 |
0.58 |
0.59 |
1.07 |
1.07 |
| 45.45 |
0.45 |
0.46 |
0.61 |
0.62 |
1.09 |
1.07 |
Table 3 RNSl and RSEl of H8, H16, and H26 protons for OLA (3 mM) in the presence of various HSA concentrations at 310 K
| HSA (μM) |
H8 |
H16 |
H26 |
| RNSl (s−1) |
RSEl (s−1) |
RNSl (s−1) |
RSEl (s−1) |
RNSl (s−1) |
RSEl (s−1) |
| 0 |
0.31 |
0.30 |
0.49 |
0.47 |
0.99 |
0.97 |
| 7.58 |
0.31 |
0.32 |
0.50 |
0.50 |
0.98 |
0.98 |
| 15.15 |
0.33 |
0.34 |
0.51 |
0.51 |
0.97 |
0.98 |
| 22.73 |
0.34 |
0.35 |
0.52 |
0.53 |
0.97 |
0.98 |
| 33.30 |
0.36 |
0.38 |
0.54 |
0.56 |
0.98 |
0.97 |
| 37.88 |
0.37 |
0.39 |
0.57 |
0.57 |
0.99 |
0.98 |
| 45.45 |
0.40 |
0.41 |
0.58 |
0.59 |
1.01 |
0.97 |
[ANl]TL of the OLA–HSA system was calculated from the slope of the straight line obtained by plotting ΔRSElN against protein concentrations to evaluate the strength of interaction between different regions of OLA and HSA. The effects of motional anisotropies along the ligand molecule and in different magnetic environments for the observed proton spin–lattice relaxation rates could be removed through normalization.
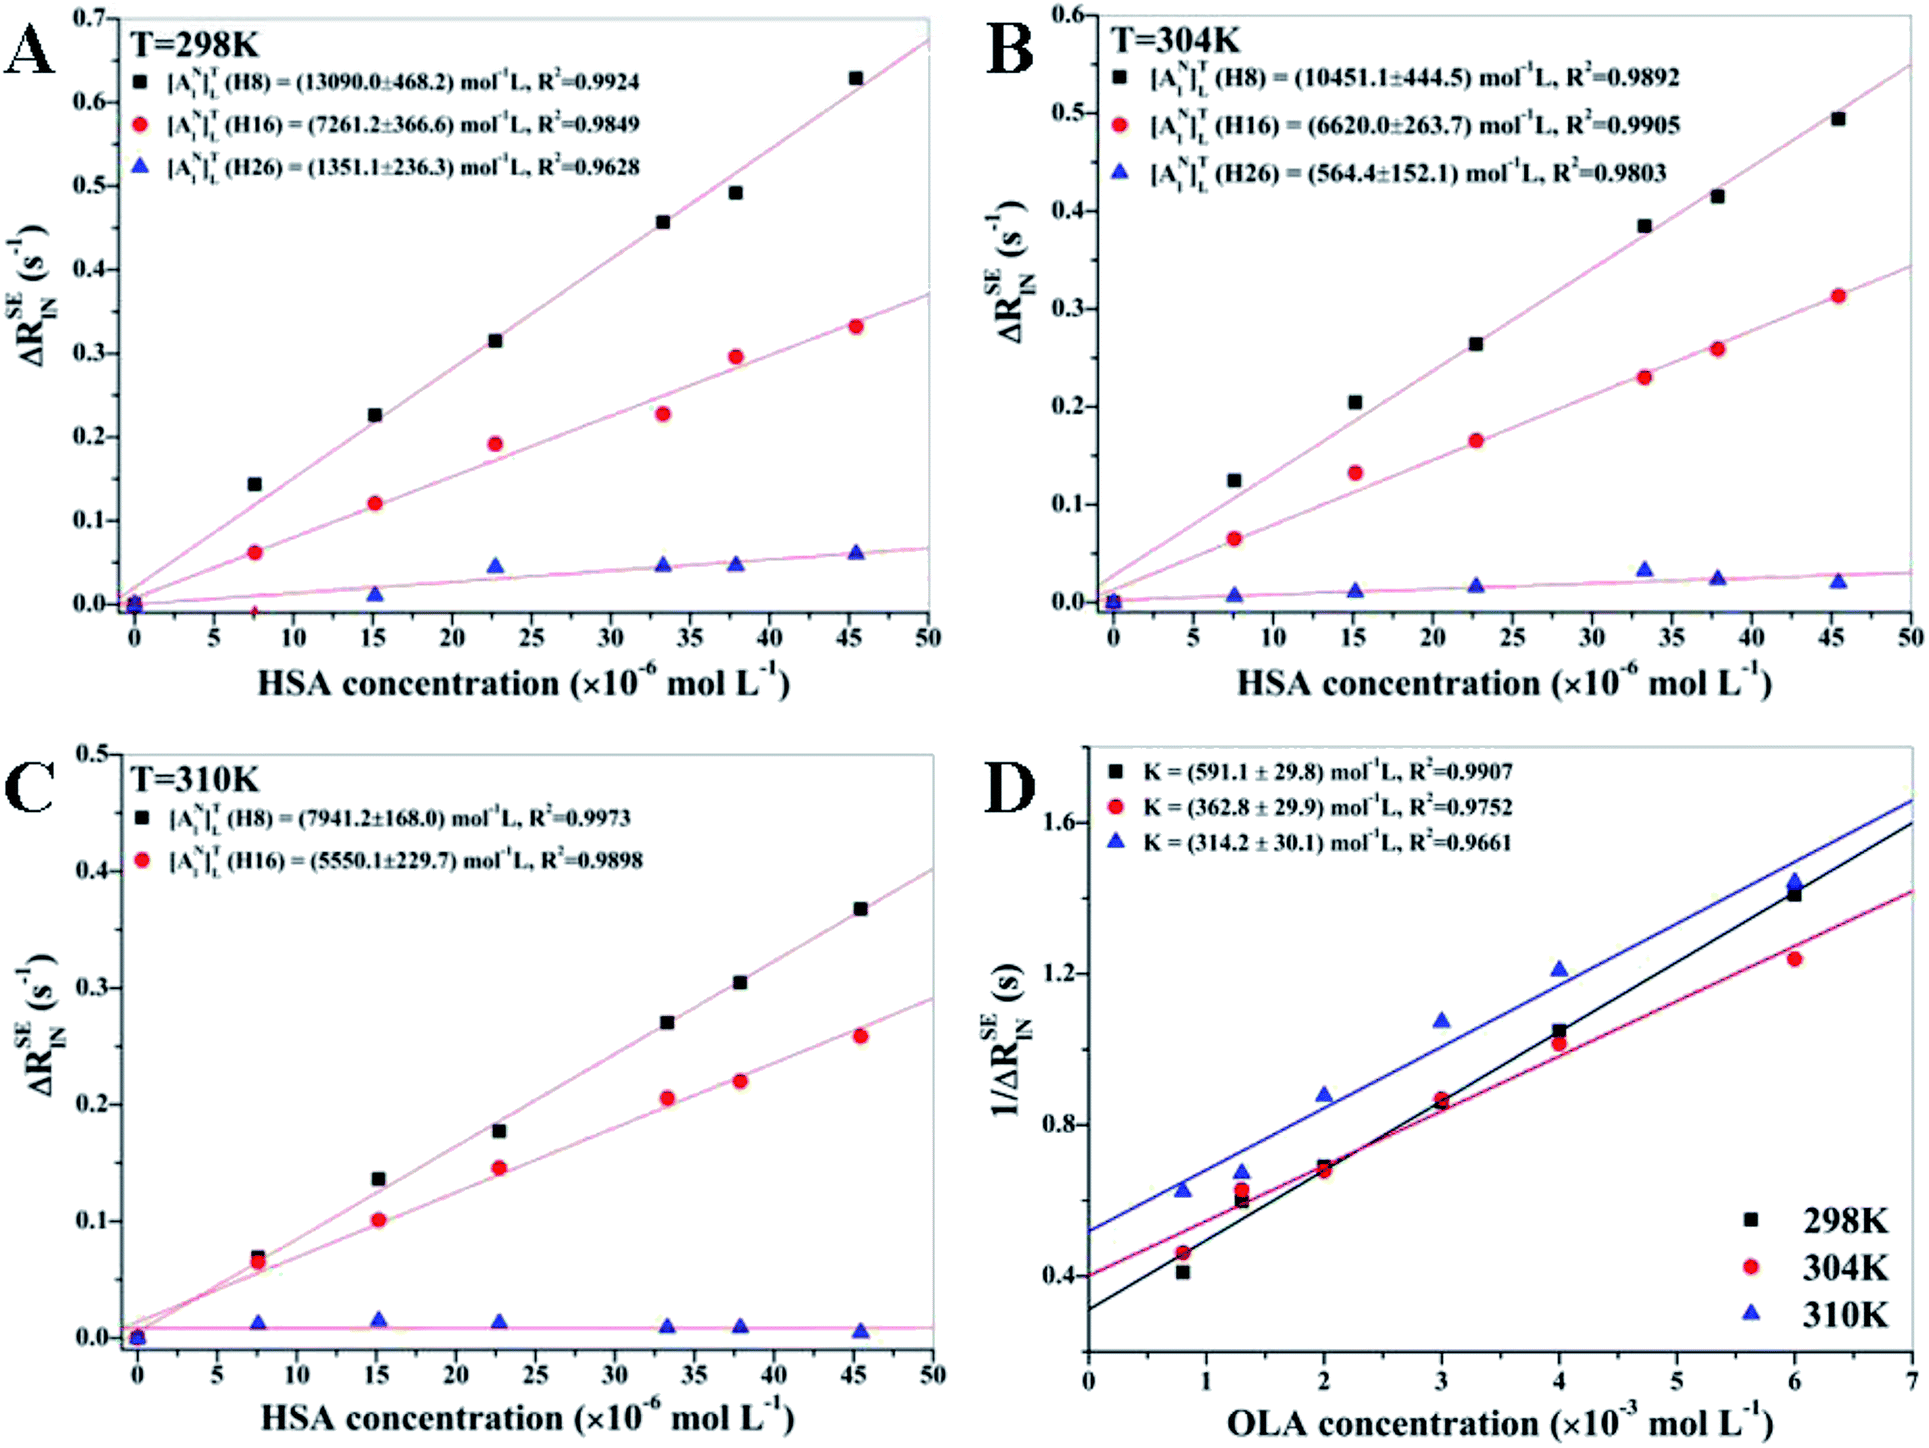
Fig. 2 displays the results of the linear regression analysis of ΔRSElN versus HSA concentrations at different temperatures for H8, H16, and H26 protons of OLA. [ANl]TL of H8 proton was higher than that of H16 at different temperatures, indicating that H8 proton was closely contacted with the HSA binding site, whereas H16 proton formed a secondary contact with the protein binding pocket. Among the protons, H26 had the lowest [ANl]TL, indicating that this proton was isolated from the HSA binding pocket and even highly exposed to the solvent. All NMR analyses were validated through the following docking simulation. [ANl]TL of all the protons decreased as the temperature increased because of the attenuation of the ligand–receptor interaction caused by the enhanced OLA molecular mobility. The drastic decrement of the affinity index revealed that H8 proton was also in close contact with the HSA binding pocket, whereas the H26 proton was far from the protein binding site because of the negligible effect of the enhancement of OLA molecular mobility when temperature increased.
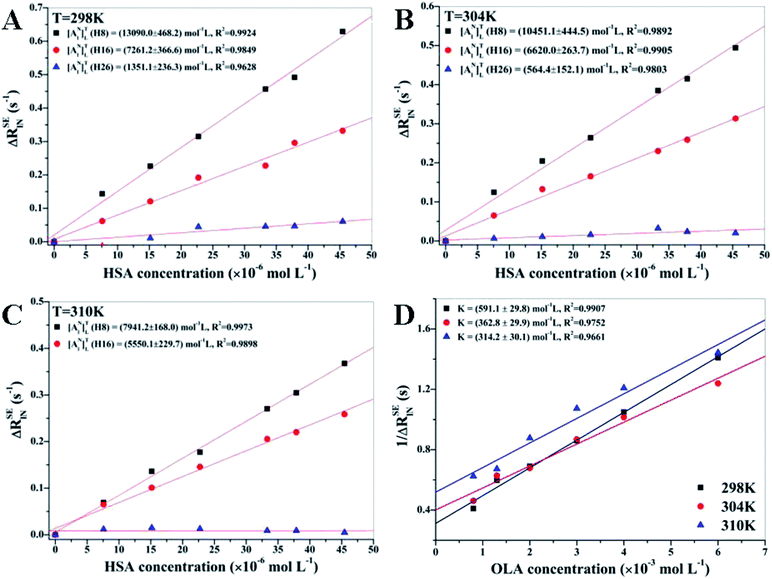 |
| | Fig. 2 (A, B and C) Linear regression analysis of H8, H16, and H26 protons at different temperatures with the corresponding errors. H26 at 310 K is not presented because of poor linear fitting. [OLA] = 8 mM, [HSA] = 0, 10, 20, 30, 40, 50, 60 μM. (D) K of H8 at different temperatures was calculated on the basis of the slope and the intercept obtained via linear regression analysis [HSA] = 60 μM, [OLA] = 0.8, 1.3, 2, 3, 4, 6 mM. | |
3.1.2 Calculations of K at different temperatures. RSEl of OLA was measured at different concentrations to calculate K. Fig. 2(D) shows the calculated 1/ΔRSElN of H8 against varying concentrations of OLA at different temperatures. According to eqn (12) and (13), the K values were found to be 591.1 ± 29.8 mol−1 L at 298 K, 362.8 ± 29.9 mol−1 L at 304 K, and 314.2 ± 30.1 mol−1 L at 310 K. Therefore, the OLA–HSA system was more stable at 298 K than at the two other temperature settings, and this observation was consistent with the decrease in the affinity index of H8 proton with HSA as temperature increased.
3.2 Lifetime measurements
Fluorescence lifetime measurement is an efficient method to explore information about the conformational heterogeneity of proteins. Fig. 3(A) shows that the addition of OLA significantly influenced the fluorescence lifetime the tryptophan (Trp) of HSA, and the degree of influence was positively correlated with the OLA concentration. The specific average fluorescence lifetime was determined via tail-fitting method:37| | |
〈τ〉 = α1τ1 + α2τ2 + α3τ3
| (14) |
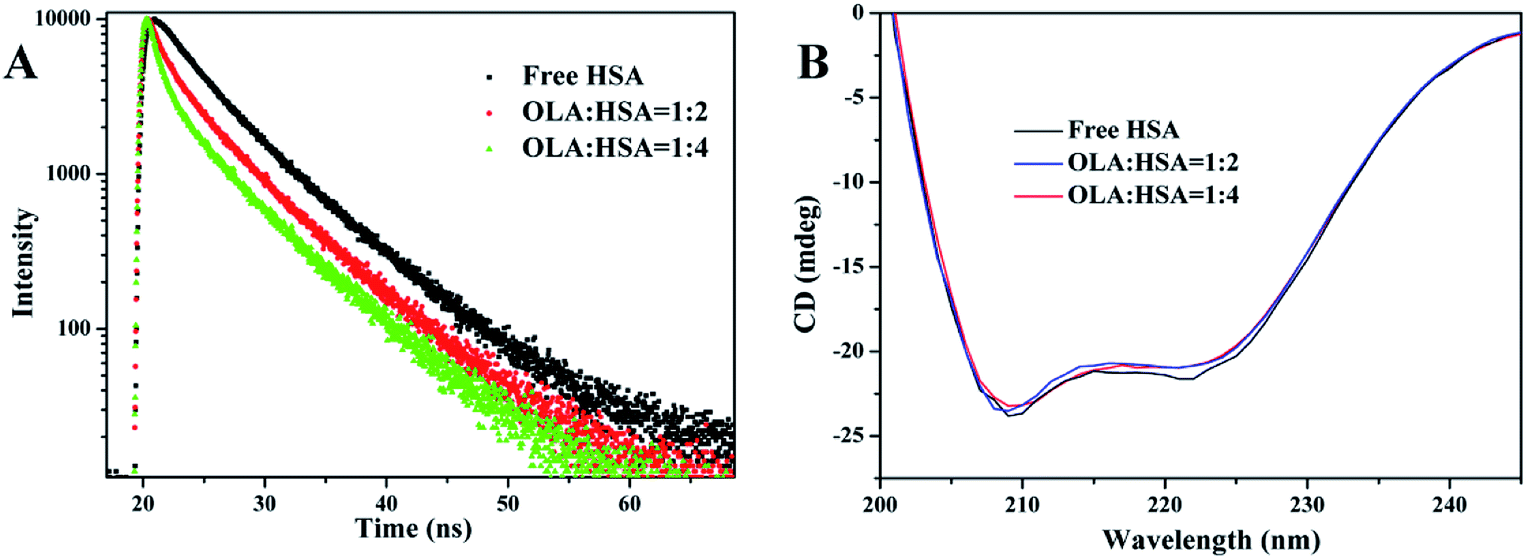
〈τ〉 of Trp of free HSA was 5.147 ns, and this parameter decreased to 4.199 and 3.604 ns in the presence of 4 and 8 μM OLA, respectively (Table 4). The average lifetime of HSA shortened after OLA was added. The observed decreases in the average lifetime of the Trp of HSA as the concentration of OLA was increased were further confirmed the binding of OLA to HSA, and the binding results in the more hydrophobic environment of Trp residue of HSA. The changes in τ suggested that the interaction between OLA and HSA could have induced small conformational changes in the local structure of HSA. Thus, providing further evidence for confirming the conformational change was necessary.
 |
| | Fig. 3 (A) Time-resolved fluorescence lifetime of HSA in the presence of 0, 4, and 8 μM OLA. (B) CD spectra of 2 μM HSA in the presence of 0, 4, and 8 μM OLA. | |
Table 4 Fluorescence decay fitting parameters of the OLA–HSA system at different OLA concentrations
| System |
C(ligand) (μM) |
τ1 (ns) |
τ2 (ns) |
τ3 (ns) |
α1 |
α2 |
α3 |
〈τ〉 (ns) |
χ2 |
| HSA |
0 |
3.313 |
0.652 |
7.067 |
0.414 |
0.057 |
0.529 |
5.147 |
1.107 |
| HSA–OLA |
4 |
2.865 |
6.609 |
0.273 |
0.295 |
0.499 |
0.206 |
4.199 |
1.125 |
| 8 |
2.927 |
6.742 |
0.262 |
0.262 |
0.408 |
0.330 |
3.604 |
1.081 |
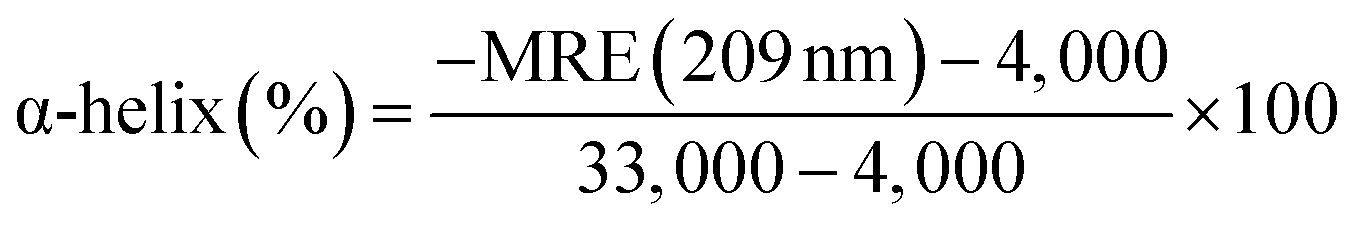
3.3 CD spectra
The effects of OLA on the secondary and tertiary structures of HSA were further analyzed using CD spectra. In Fig. 3(B), two negative peaks, which are attributed to the α-helix structures in protein,38 appeared at 209 and 220 nm in the spectra of HSA and OLA–HSA. The overall trend of the curve before and after the addition of OLA did not change, indicating that the α-helix remained dominant. The α-helix content can be calculated using the following equation:25| |
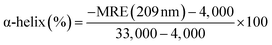 | (15) |
where 4,000 and 33,000 are the MRE values of the β-form with random coil conformation and the pure α-helix conformation at 209 nm, respectively. The α-helix content of free HSA was 56.43%. After HSA interacted with OLA, the α-helix content decreased to 55.51% (molar ratio: 1![[thin space (1/6-em)]](https://www.rsc.org/images/entities/char_2009.gif) :2) and 54.67% (molar ratio: 1:4). These slight changes in the α-helix structure of HSA were caused by OLA, indicating that OLA affected the conformation of HSA, which was agreement with the results of time-resolved fluorescence studies.
:2) and 54.67% (molar ratio: 1:4). These slight changes in the α-helix structure of HSA were caused by OLA, indicating that OLA affected the conformation of HSA, which was agreement with the results of time-resolved fluorescence studies.
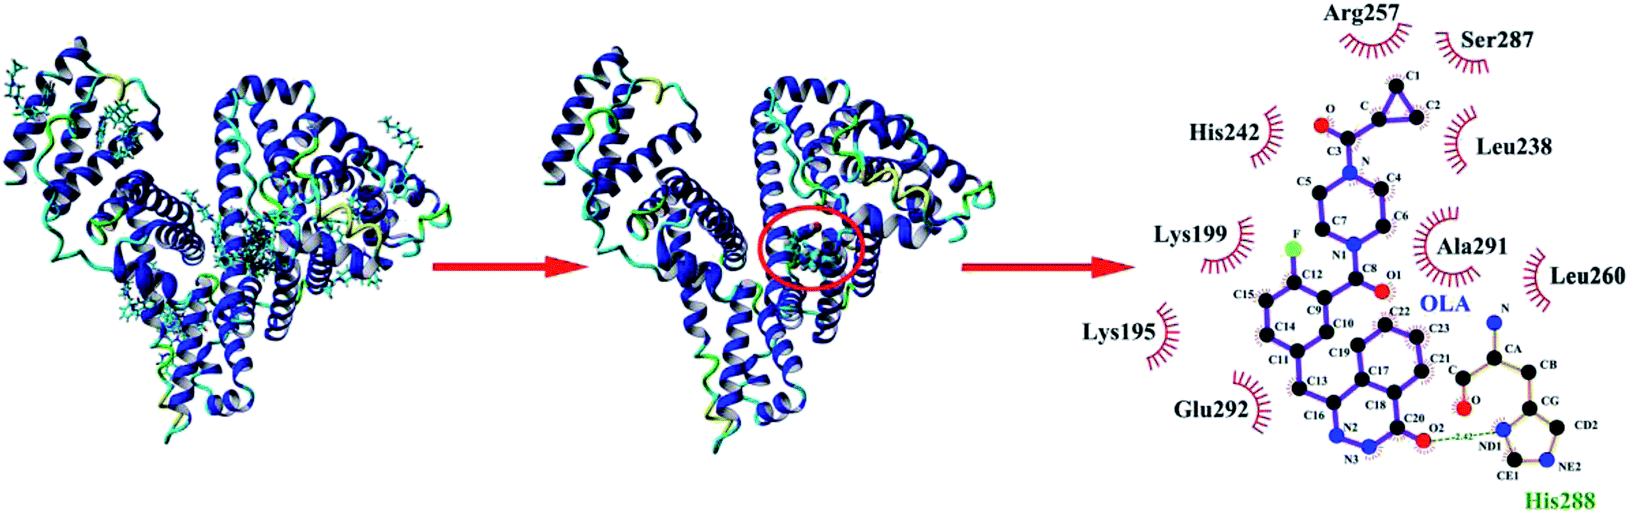
3.4 Molecular docking
Molecular docking was performed with YASARA to provide detailed information about the interactions between OLA and HSA (Fig. 4), to corroborate the experimental results, and to further gain insights into the interactions between drug molecules and biomacromolecules. Seventeen multimember conformational clusters were obtained from 25 docking runs. The OLA molecule might preferentially bind to the hydrophobic cavity of subdomain IIA of HSA (site 1), and the optimal binding conformation had the highest binding energy of 39.56 kJ mol−1 (Fig. 4). OLA in the binding site was surrounded by the residues LYS-195, LYS-199, LEU-238, HIS-242, ARG-257, LEU-260, SER-287, ALA-291, and GLU-292. Moreover, a hydrogen bond with a bond distance of 2.42 Å and a bond energy of 6.28 kJ mol−1 existed between OLA and HIS-288. These results indicated that H-bonds and hydrophobic interactions played a major role in stabilizing the OLA–HSA system.
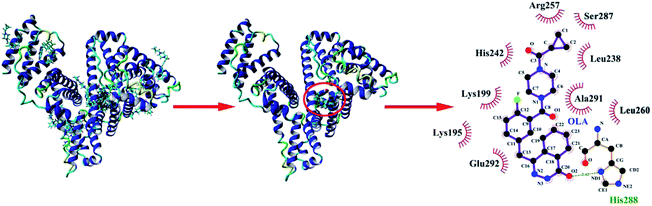 |
| | Fig. 4 (Left) Molecular docking of OLA with HSA. (Middle) Locations of OLA molecule on HSA subdomain IIA. (Right) The site of drug interaction and the label of the HSA residues near the drug are magnified on the right panel. H-bond is displayed using a red dotted line, and the hydrophobic interaction is shown using a green solid line. | |
3.5 Molecular dynamics simulations
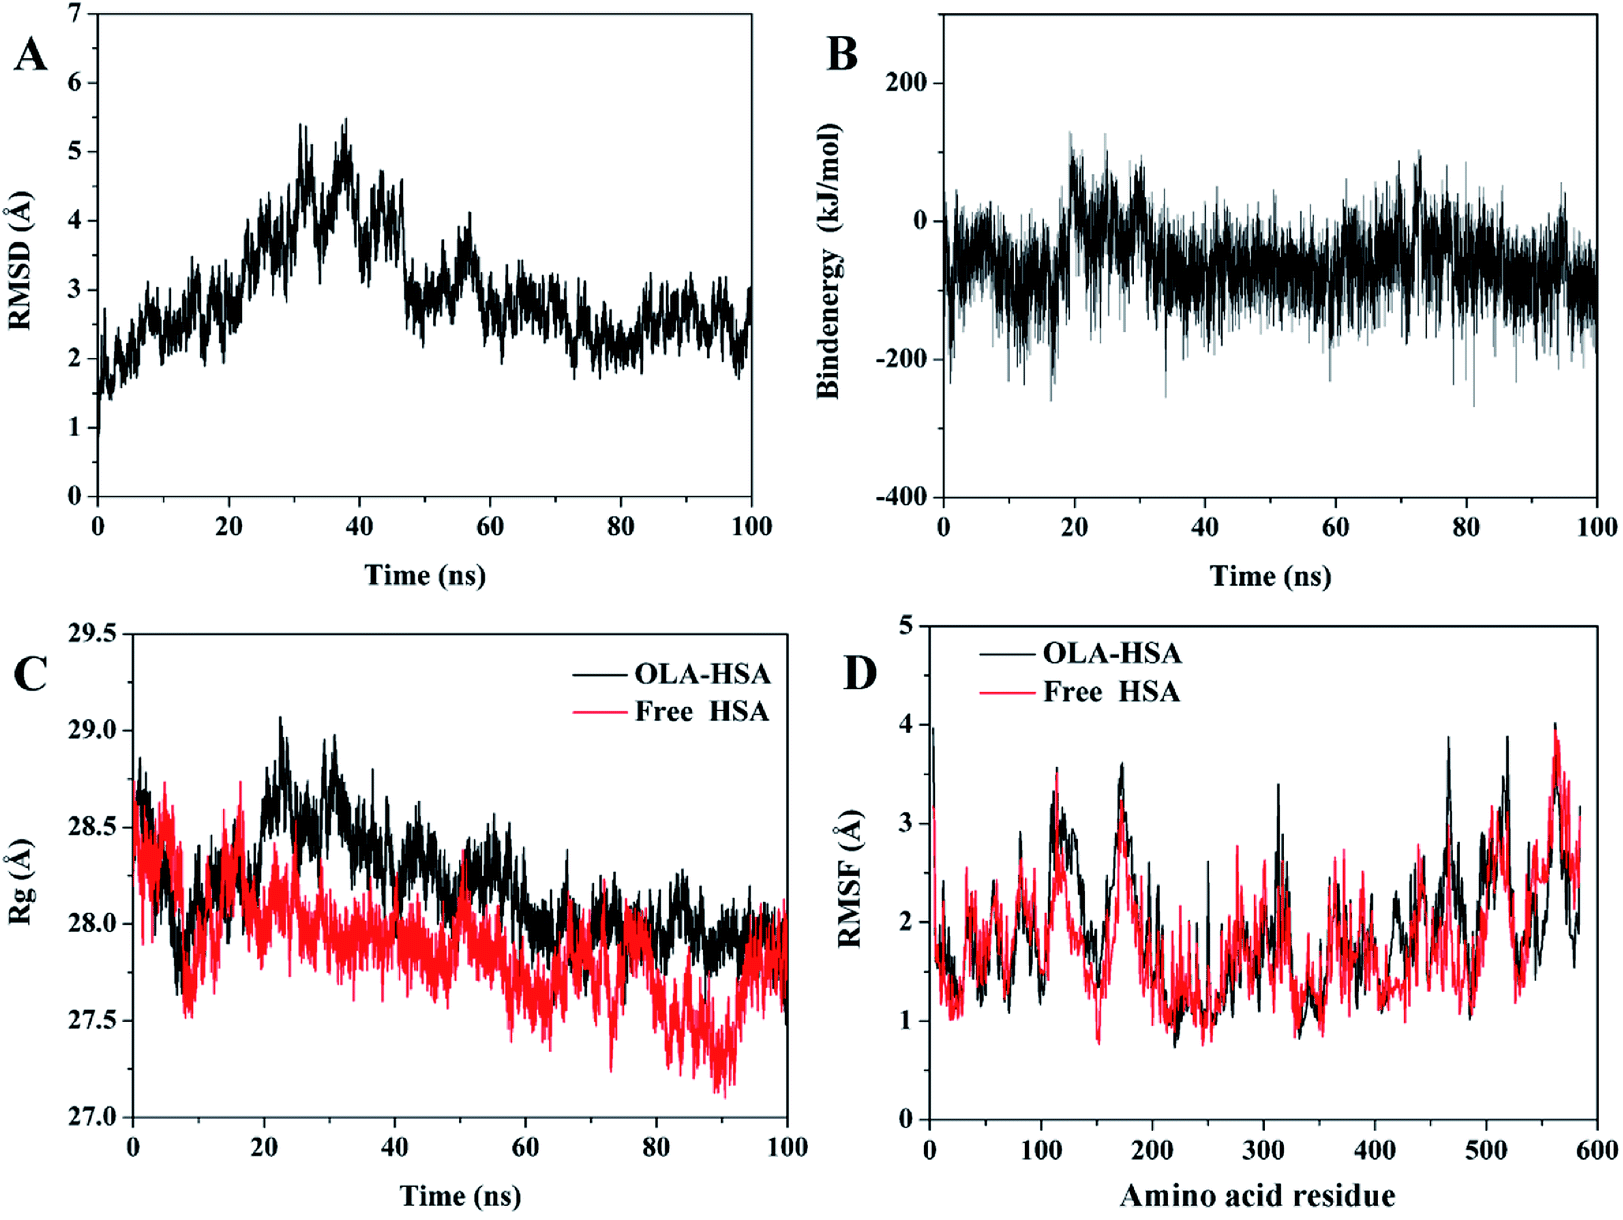
Molecular dynamics simulations were performed on the optimum binding conformation of the OLA–HSA system during docking. Root mean square deviation (RMSD) could be used to evaluate the stability of the OLA–HSA system. The variation in the RMSD of Cα atoms in the OLA–HSA system versus the simulation time of 100 ns is illustrated in Fig. 5(A). The RMSD slightly changed during the entire molecular dynamics simulation and became steady in 60–100 ns, suggesting that the OLA molecule steadily bound to subdomain IIA of HSA (site 1) and formed a stable OLA–HSA system.
 |
| | Fig. 5 (A) RMSDs of Cα atoms in the OLA–HSA system versus simulation times. (B) Binding energy of the OLA–HSA system versus simulation times. (C) Rg of the OLA–HSA system and the free HSA versus simulation times. (D) RMSFs of the Cα atoms in the OLA–HSA system and free HSA versus simulation times. | |
The binding conformation of the OLA–HSA system obtained through molecular dynamics simulation at 100 ns was investigated (Fig. 6). In Fig. 6, the OLA molecule maintained a hydrophobic interaction with HSA and bound to its site 1. OLA in the binding site was surrounded by the residues LYS-195, GLN-196, PHE-211, TRP-241, ALA-261, and ILE-264. Moreover, a hydrogen bond with a bond energy of 22.88 kJ mol−1 existed between OLA and ARG-218. The binding conformations before and after molecular dynamics simulations were compared, and the results revealed that H-bonds were formed between OLA and ARG-218 rather than between OLA and HIS-288 because of the changes in the position of OLA in subdomain IIA of HSA (site 1). The H-bond energy and hydrophobic interaction forces increased after the molecular dynamics simulations, implying that the stability of the OLA–HSA system increased.
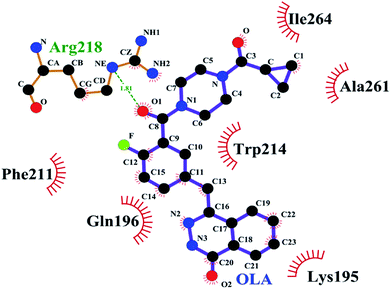 |
| | Fig. 6 Interactions of OLA on HSA subdomain IIA at 100 ns. The site of drug interaction and the label of HSA residues near the drug are magnified. The H-bond is displayed as red dotted lines, and the hydrophobic interaction is shown as a green solid line. | |
Binding energy can be used to evaluate the binding ability of the ligand–receptor system. In Fig. 5(B), the result of trajectory analysis showed that the changes in binding energy were not significant during the entire molecular dynamics simulations (−65 kJ mol−1), which could be interpreted by the insensitivity of the system, because the OLA molecule firmly bound to the hydrophobic cavity of subdomain IIA of HSA (site 1).
The radius of gyration (Rg) can be employed to evaluate the compact degree of protein macromolecules during molecular dynamics simulations. A small Rg indicates that proteins are highly compact. Fig. 5(C) illustrates Rg of the OLA–HSA system and the free HSA versus the simulation time. Rg slightly changed during the entire molecular dynamics simulation and tended to be steady at 60 ns, which agreed with the results of the RMSD. Beyond equilibrium, Rg of the OLA–HSA system was approximately 28 Å, which was higher than that of the free HSA, indicating that the binding of OLA to HSA influenced the secondary and tertiary structures of the proteins; consequently, the structure of HSA loosened.
The root mean square fluctuation (RMSF) can be used to evaluate the degree of fluctuations in protein residues compared with their average positions. The variations in RMSF of the Cα atoms in the OLA–HSA system and the free HSA versus simulation time are illustrated in Fig. 5(D). The fluctuations in RMSF of the OLA–HSA system and the free HSA were almost similar during the entire molecular dynamics simulation, indicating that no significant changes in the position of the protein residues occurred. The RMSFs of the OLA–HSA system were slightly higher than those of the free HSA, suggesting that the binding between OLA and HSA affected the environment around the protein residues and influenced their conformations.
4. Conclusions
In this study, interactions between OLA and HSA in a simulated physiological environment were investigated using various spectroscopic techniques and theoretical simulations. [ANl]TL and K of the OLA–HSA system at different temperatures based on RSEl indicated that OLA weakly interacted with HSA. The time-resolved fluorescence spectroscopy combined with CD measurements showed that the binding of OLA to HSA induced changes in conformation of the protein and decreased the α-helical content. Computational methods showed that OLA bound to site 1. Experimental results were consistent with molecular docking and MD simulations, and these conclusions might enhance our understanding of the pharmacodynamics of this drug.
Conflicts of interest
There are no conflicts to declare.
Acknowledgements
This work was supported by the National Natural Science Foundation of China (NNSFC Grant 21704069).
References
- D. Wu, Y. Zhai, J. Yan, K. Xu, Q. Wang, Y. Lia and H. Li, RSC Adv., 2015, 5, 11036–11042 RSC.
- X. Ma, J. He, J. Yan, Q. Wang and H. Li, Chem.-Biol. Interact., 2016, 248, 52–59 CrossRef PubMed.
- H. Yang, Y. Huang, J. He, S. Li, B. Tang and H. Li, Arch. Biochem. Biophys., 2016, 606, 81–89 CrossRef PubMed.
- P. Das, S. K. Chaudhari, A. Das, S. Kundu and C. Saha, J. Biomol. Struct. Dyn., 2018, 1–13 CrossRef PubMed.
- X. Li and S. Wang, New J. Chem., 2015, 39, 386–395 RSC.
- B. Rizzuti, R. Bartucci, L. Sportelli and R. Guzzi, Arch. Biochem. Biophys., 2015, 579, 18–25 CrossRef PubMed.
- N. V. Rakotoarivelo, P. Perio, E. Najahi and F. Nepveu, J. Phys. Chem. B, 2014, 118, 13477–13485 CrossRef PubMed.
- G. Sudlow, D. J. Birkett and D. N. Wade, Mol. Pharmacol., 1975, 11, 824–832 Search PubMed.
- G. Sudlow, D. J. Birkett and D. N. Wade, Mol. Pharmacol., 1976, 12, 1052–1061 Search PubMed.
- A. Zhong, H. Zhang, S. Xie, M. Deng, H. Zheng, Y. Wang, M. Chen, R. Lu and L. Guo, Oncol. Rep., 2018, 39, 1747–1756 Search PubMed.
- K. N. Moore and M. J. Birrer, Oncologist., 2018, 23, 697–703 CrossRef PubMed.
- G. E. Feiersinger, K. Trattnig, P. D. Leitner, F. Guggenberger, A. Oberhuber, S. Peer, M. Hermann, I. Skvortsova, J. Vrbkova, J. Bouchal, Z. Culig and F. R. Santer, Mol. Oncol., 2018, 12, 561–576 CrossRef PubMed.
- G. Griguolo, M. V. Dieci, V. Guarneri and P. Conte, Expert Rev. Anticancer Ther., 2018, 18, 519–530 CrossRef PubMed.
- E. L. Gornstein, S. Sandefur, J. H. Chung, L. M. Gay, O. Holmes, R. L. Erlich, S. Soman, L. K. Martin, A. V. Rose, P. J. Stephens, J. S. Ross, V. A. Miller, S. M. Ali and S. Blau, Clin. Breast Cancer, 2018, 18, 184–188 CrossRef PubMed.
- I. Faraoni, F. Aloisio, A. De Gabrieli, M. I. Consalvo, S. Lavorgna, M. T. Voso, F. Lo-Coco and G. Graziani, Cancer Lett., 2018, 423, 127–138 CrossRef PubMed.
- A. Curtis, J. Rueter, S. Rajan, R. Zhang and L. Shopland, J. Cell. Biochem., 2018, 119, 5843–5851 CrossRef PubMed.
- S. Bi, Y. Sun, C. Qiao, H. Zhang and C. Liu, J. Lumin., 2009, 129, 541–547 CrossRef.
- S. Baroni, M. Mattu, A. Vannini, R. Cipollone, S. Aime, P. Ascenzi and M. Fasano, Eur. J. Biochem., 2001, 268, 6214–6220 CrossRef PubMed.
- W. Y. He, Y. Li, J. N. Tian, H. X. Liu, Z. D. Hu and X. G. Chen, J. Photochem. Photobiol., A, 2005, 174, 53–61 CrossRef.
- I. Girard and S. Ferry, J. Pharm. Biomed. Anal., 1996, 14, 583–591 CrossRef PubMed.
- J. H. Tang, F. Luan and X. G. Chen, Bioorg. Med. Chem., 2006, 14, 3210–3217 CrossRef PubMed.
- X. C. Shen, H. Liang, J. H. Guo, C. Song, X. W. He and Y. Z. Yuan, J. Inorg. Biochem., 2003, 95, 124–130 CrossRef PubMed.
- A. Sulkowska, B. Bojko, J. Rownicka, P. Rezner and W. W. Sulkowski, J. Mol. Struct., 2005, 744, 781–787 CrossRef.
- J. He, D. Wu, Y. Zhai, Q. Wang, X. Ma, H. Yang and H. Li, J. Mol. Liq., 2016, 219, 547–553 CrossRef.
- T. Hu and Y. Liu, J. Pharm. Biomed. Anal., 2015, 107, 325–332 CrossRef PubMed.
- S. Samaei-Daryan, B. Goliaei and A. Ebrahim-Habibi, J. Mol. Recognit., 2017, 30, 1–12 CrossRef PubMed.
- E. Krieger, T. Darden, S. B. Nabuurs, A. Finkelstein and G. Vriend, Proteins, 2004, 57, 678–683 CrossRef PubMed.
- X. Xiong, J. He, H. Yang, P. Tang, B. Tang, Q. Sun and H. Li, RSC Adv., 2017, 7, 48942–48951 RSC.
- C. W. Y. Duan, S. Chowdhury, M. C. Lee, G. Xiong, W. Zhang, R. Yang, P. Clieplak, R. Luo, T. Lee, J. Caldwell, J. Wang and P. Kollman, J. Comput. Chem., 2003, 24, 1999–2012 CrossRef PubMed.
- F. Bloch, Phys. Rev., 1957, 105, 1206–1222 CrossRef.
- I. D. Campbell and R. Freeman, J. Magn. Reson., 1973, 11, 143–162 Search PubMed.
- I. D. Campbell and R. Freeman, J. Chem. Phys., 1973, 58, 2666–2667 CrossRef.
- R. Freeman, H. D. W. Hill, B. L. Tomlinson and L. D. Hall, J. Chem. Phys., 1974, 61, 4466–4473 CrossRef.
- S. Martini, C. Bonechi, G. Corbini and C. Rossi, Chem. Phys. Lett., 2007, 447, 147–153 CrossRef.
- S. Martini, M. Consumi, C. Bonechi, C. Rossi and A. Magnani, Biomacromolecules, 2007, 8, 2689–2696 CrossRef PubMed.
- C. Bonechi, S. Martini and C. Rossi, J. Mater. Sci., 2011, 46, 2541–2547 CrossRef.
- L. Zhao, J. Liu, R. Guo, Q. Sun, H. Yang and H. Li, RSC Adv., 2017, 7, 27796–27806 RSC.
- S. K. Pawar, R. S. Naik and J. Seetharamappa, Anal. Bioanal. Chem., 2017, 409, 6325–6335 CrossRef PubMed.
|
| This journal is © The Royal Society of Chemistry 2018 |
Click here to see how this site uses Cookies. View our privacy policy here. 
 Open Access Article
 This Open Access Article is licensed under a Creative Commons Attribution-Non Commercial 3.0 Unported Licence
 *a,
Pengchi Denga,
Xiaoyan Wanga,
Chunchun Zhanga,
Ruixue Ganb,
Na Ganb,
Qiaomei Sunb and
Hui Li
*a,
Pengchi Denga,
Xiaoyan Wanga,
Chunchun Zhanga,
Ruixue Ganb,
Na Ganb,
Qiaomei Sunb and
Hui Li

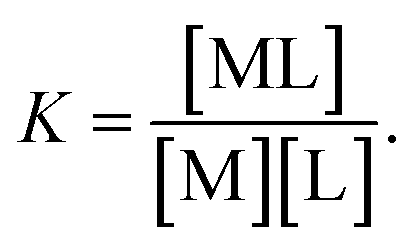 Assuming [L] ≫ [M0], we obtain the following equation: