 Open Access Article
Creative Commons Attribution 3.0 Unported Licence
Room-temperature synthesis of near-ultraviolet light-excited Tb3+-doped NaBiF4 green-emitting nanoparticles for solid-state lighting
Peng Du ,
Yongbin Hua and
Jae Su Yu
 *
*
Department of Electronic Engineering, Kyung Hee University, Yongin-si, Gyeonggi-do 17104, Republic of Korea. E-mail: jsyu@khu.ac.kr; Fax: +82 31 201 3820; Tel: +82 31 206 2820
First published on 25th July 2018
Abstract
We reported a facile reaction technique to prepare Tb3+-doped NaBiF4 green-emitting nanoparticles at room temperature. Under 378 nm excitation, the prepared samples exhibited the featured emissions of Tb3+ ions and the green emission located at 543 nm corresponding to the 5D0 → 7F4 transition was observed in the photoluminescence (PL) emission spectra. The PL emission intensity relied on the dopant concentration and its optimum value was determined to be 50 mol%. The involved concentration quenching mechanism was dominated by the electric dipole–dipole interaction and the critical distance was evaluated to be around 10.4 Å. Meanwhile, the color coordinate and color purity of the obtained emission were revealed to be (0.328, 0.580) and 62.4%, respectively. The thermal quenching performance of the synthesized nanoparticles was analyzed using the temperature-dependent PL emission spectra and the activation energy was calculated to be 0.39 eV. By integrating a near-ultraviolet chip with the prepared nanoparticles, a dazzling green light-emitting diode was fabricated to explore the feasibility of the Tb3+-doped NaBiF4 nanoparticles for solid-state lighting applications.
1. Introduction
With the increased awareness of environmental protection and energy saving, the phosphor-converted white light-emitting diodes (WLEDs), which are considered as the next generation solid-state lighting and a promising candidate to replace incandescent and fluorescent lamps, have received considerable interest since they can save 50% electricity for illumination.1–4 Unfortunately, the commercial strategy of generating white light by utilizing a blue chip to pump the Y3Al5O12:Ce3+ yellow-emitting phosphors shows a poor color rendering index and high correlated color temperature due to the lack of a red emission component in the luminescence spectrum.5,6 To modify the performance of the WLED device, an alternative technique using a near-ultraviolet (NUV) chip to excite the hybrid (blue-green-red) phosphors was proposed.7,8 Herein, developing a highly-efficient single-color phosphor for NUV light excitation is urgent to improve the optical performance of the WLED device.Currently, the trivalent rare-earth ions doped luminescent materials have been widely developed and employed in various fields including plasma display planes, solid-state lighting, solar cells, biomedicine and temperature detection.9–13 Among these trivalent rare-earth ions, the Tb3+ ion is being studied extensively as a green-emitting activator because of its dominant green emission arising from the 5D4 → 7F5 transition.14,15 As is known, the photoluminescence (PL) behaviors of the trivalent rare-earth ions are distinctly affected by the luminescent host material, especially, low phonon energy material since it can improve the possibility of the radiative transition.16,17 To date, many inorganics, such as molybdates, silicates, ceramic, fluorides and oxides, were developed as the luminescent host materials for the trivalent rare-earth ions.18–22 Compared with other materials, the fluorides, which exhibit a low phonon energy (<350 cm−1), are thought of a splendid luminescent host material for trivalent rare-earth ions.22,23 Hao et al. stated that the NaLnF4:Er3+/Mg2+ nanoparticles did not only exhibit excellent luminescent behaviors but also were potential candidates for tumor diagnosis as a fluorescence probe.24 Furthermore, Marciniak et al. also revealed that the Nd3+-activated NaYF4 nanoparticles with strong luminescent performance can be used to detect the temperature.25 Note that, to synthesize these rare-earth ions-based fluoride materials, it usually requires lots of expensive rare-earth ions which result in high investment. As a consequence, a new fluoride material should be developed to fix this shortage. Nowadays, the interest in NaBiF4 is increasing since the Bi3+ ion has some advantages, such as non-toxicity, low cost and intrinsic luminescent properties (i.e. absorption band around 300 nm and emission band in the range of 400–500 nm).26,27 Zhang et al. reported that the NaBiF4:Ln3+/Yb3+ (Ln = Er, Tm, Ho) nanocrystals can emit dazzling upconversion emissions under near-infrared light excitation.28 Additionally, we also found that the Eu3+-doped NaBiF4 nanoparticles were a potential candidate for WLEDs as red-emitting components.29 These previous reports confirmed that the NaBiF4 is a promising luminescent host material for simultaneous upconversion and down-conversion emissions. Herein, it would be very interesting to investigate the luminescent properties of the trivalent rare-earth ions doped NaBiF4 compounds as well as their potential applications. Nevertheless, to the best of our knowledge, the synthesis and photoluminescence (PL) properties of Tb3+-doped NaBiF4 nanoparticles have not been reported yet. In this work, a series of Tb3+-doped NaBiF4 nanoparticles were prepared by a simple reaction technique at room temperature, and their phase structure, microstructure and thermal stability as well as PL behaviors were investigated. Ultimately, a green-emitting LED device was package to explore the feasibility of the obtained nanoparticles for solid-state lighting applications.
2. Experimental
2.1 Synthesis of Tb3+-doped NaBiF4 nanoparticles
The NaBi1−xF4:xTb3+ (NaBiF4:xTb3+, where x = 0.1, 0.2, 0.3, 0.4, 0.5, 0.6 and 0.7) nanoparticles were prepared by a facile room-temperature chemical precipitation method.28,29 The powders including NaNO3 (99%), Bi(NO3)3·5H2O (99.99%), Tb(NO3)3·5H2O (99.9%) and NH4F (99.99%) were used as the raw materials. Briefly, 2 mmol NaNO3, (1−x) mmol Bi(NO3)3·5H2O and x mmol Tb(NO3)3·5H2O were dissolved into 10 ml ethylene glycol (EG) to form solution I. After that, 14 mmol NH4F was added into 20 ml EG to prepare solution II. Then, a mixture was achieved by pouring the solution I to the solution II under strong stirring. After 1 min stirring at room temperature, a transparent colloid was formed. Finally, the nanoparticles were obtained through centrifugation, washed with ethanol and de-ionized water several times and then dried at a temperature of 80 °C in air.2.2 Characterization
The prepared samples were characterized by using a Bruker D8 Advance diffractometer, field-emission scanning electron microscope (FE-SEM; LEO SUPRA 5), Thermo Nicolet-5700 Fourier transform infrared (FT-IR) spectrophotometer and fluorescence spectrometer (Scinco FluroMate FS5). The temperature-dependent PL emission spectra of the resultant powders were detected by the fluorescence spectrometer (Scinco FluroMate FS5) and the temperature surrounding the powders was controlled by using a thermocouple (NOVA ST540). The electroluminescence (EL) spectrum of the fabricated LED device was recorded by using a multi-channel spectroradiometer (OL 770).3. Results and discussion
3.1 Phase composition and morphology properties
The X-ray diffraction (XRD) was employed to clarify the phase structure and phase compositions of the studied compounds. The XRD patterns of Tb3+-doped NaBiF4 nanoparticles prepared at room temperature as a function of dopant concentration are shown in Fig. 1(a) and (b). As presented, the diffraction peaks depicted in Fig. 1(a) matched well with standard NaBiF4 (JCPDS#41-0796), implying that all the synthesized compounds consisted of pure hexagonal phase and Tb3+ ions were totally entered into the NaBiF4 host lattices without changing the host phase structure. Generally, for forming a new solid solution, the radius percentage difference (Dr) between the dopants and potential substituted cations cannot be over 30% and its value can be evaluated by means of the following expression:3,14
 | (1) |
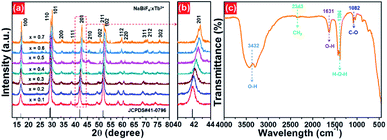 | ||
| Fig. 1 (a) XRD and (b) zoomed XRD patterns of NaBiF4:xTb3+ nanoparticles as a function of dopant concentration. (c) FT-IR spectrum of the NaBiF4:0.5Tb3+ nanoparticles. | ||
To verify the surface functional groups of the final products, the FT-IR spectrum of the representative NaBiF4:0.5Tb3+ nanoparticles was detected, as shown in Fig. 1(c). In the FT-IR spectrum, the bands at 3432 and 1631 cm−1 are related to the O–H stretching vibration, while the sharp peak at 1384 cm−1 corresponds to the H–O–H stretching vibration.30 Besides, the existence of EG on the surface of the samples is confirmed by the peaks at 2343 cm−1 (asymmetric stretching vibration of CH2 group) and 1084 cm−1 (C–O stretching mode).31
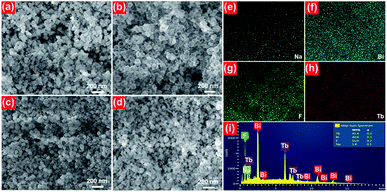
The microstructure behaviors of the final compounds were clarified by the FE-SEM. The FE-SEM images of the NaBiF4:xTb3+ nanoparticles with various Tb3+ ion concentrations are described in Fig. 2. From the FE-SEM images (see Fig. 2(a)–(d)), it is observable that all the synthesized compounds consisted of relatively uniform particles with average size of approximately 100 nm. Moreover, the particle size and shape were hardly varied with increasing the Tb3+ ion concentration from 10 to 70 mol%, suggesting that the microstructure of the studied samples is independent of the Tb3+ ion concentration. The elemental mapping results revealed that the elements including Na, Bi, F and Tb were evenly distributed over the particles, as presented in Fig. 2(e)–(h). Ultimately, the detection of the Na, Bi, F and Tb peaks in the EDX spectrum, as demonstrated in Fig. 2(i), further verifies that the synthesized samples were made up of Na, Bi, F and Tb.
3.2 Room-temperature photoluminescence and energy level diagram
The room-temperature luminescent performance of the studied samples was characterized by the PL excitation (PLE) and PL emission spectra. The PLE and PL emission spectra of the NaBiF4:0.5Tb3+ nanoparticles are demonstrated in Fig. 3(a) and (b), respectively. As described in Fig. 3(a), the PLE spectrum monitoring at 543 nm consisted of a weak broad band and several sharp peaks. Particularly, the broad emission band with a central wavelength of at around 250 nm is ascribed to the 4f8–5f7d1 (f–d) transition of Tb3+ ions, whereas the other narrow bands at round 302 nm (7F6 → 5H6), 317 nm (7F6 → 5H7), 340 nm (7F6 → 5L6), 352 nm (7F6 → 5L9) and 378 nm (7F6 → 5G6) are attributed to the intra 4f-4f transitions of Tb3+ ions.32,33 From the PLE spectrum, one knows that the resultant samples had a strong absorption in the NUV region. This suggests that the NUV light is the proper excitation lighting source for NaBiF4:xTb3+ nanoparticles. Under the excitation of 378 nm, the typical PL emission spectrum of the NaBiF4:0.5Tb3+ nanoparticles was recorded and it was composed of several peaks at around 488, 543, 583, 620, 647, 667 and 679 nm corresponding to the intra-4f transitions of Tb3+ ions from the 5D1 ground state to the excited levels of 7F6, 7F5, 7F4, 7F3, 7F2, 7F1 and 7F0, respectively, as described in Fig. 3(b).32,33 For the aim of describing the NUV light-induced visible emission mechanism in NaBiF4:xTb3+ material system, the simplified energy level diagram of Tb3+ ions was molded and shown in Fig. 3(c). As presented, when the Tb3+ ions were excited by the NUV light, electrons located at the ground state would be excited to 5G6 excited level. Then, electrons in the 5G6 decay to the 5D3 level and finally to the 5D4 level by means of the nonradiative (NR) transition processes, as shown in Fig. 3(c). Ultimately, the radiative transitions of 5D4 → 7FJ (J = 0, 1, 3, 4, 5, 6) occurred and the featured emissions of Tb3+ ions were detected in the studied nanoparticles.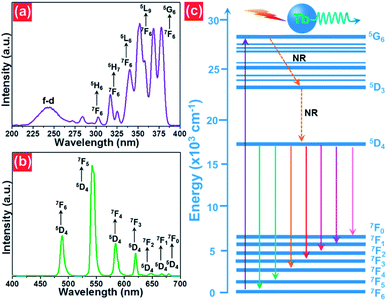 | ||
| Fig. 3 (a) PLE and (b) PL emission spectra of the NaBiF4:0.5Tb3+ nanoparticles. (c) Simplified energy level diagram of Tb3+ ions in the NaBiF4:xTb3+ compounds. | ||
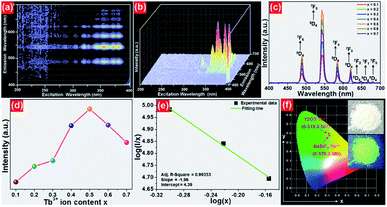
In order to further prove that the resultant nanoparticles can be efficiently pumped by the NUV light, the contour lines and 3D PL emission spectra of the NaBiF4:0.5Tb3+ nanoparticles, which were detected in the excitation wavelength range of 200–400 nm, were measured and the corresponding results are displayed in Fig. 4(a) and (b), respectively. Obviously, both the contour lines and 3D PL emission spectra exhibited the emissions of Tb3+ ions and the intense PL emission intensities were observed in the excitation wavelength range of 350–390 nm, implying that the prepared phosphors can be excited by the NUV light. It is widely accepted that the PL emission intensity of the rare-earth ions is strongly dependent on the dopant concentration. To find out the optimal doping concentration in the studied samples, the Tb3+-doped NaBiF4 nanoparticles with different dopant concentrations were prepared and their room-temperature luminescent behaviors were characterized by the PL emission spectra. The PL emission spectra of the NaBiF4:xTb3+ nanoparticles excited at 378 nm as a function of Tb3+ ion concentration are depicted in Fig. 4(c). As can be seen in Fig. 4(c), all the compounds showed the characteristic emissions of Tb3+ ions and the peak positions were barely affected by the dopant concentration except the emission intensity. It is evident that the PL emission intensity was enhanced with increasing the dopant concentration and maximized at x = 0.5. Nevertheless, the concentration quenching, which is caused by the NR energy transfer among the dopants, happened and the PL emission intensity started to decline with further introducing the Tb3+ ions into the host lattices, as demonstrated in Fig. 4(d). As is known, to realize the NR energy transfer among the dopants, two different interaction mechanisms of exchange interaction and electric multipole interaction are involved. Besides, the critical distance among the dopants can be used to verify the possible interaction mechanism. In particular, when the critical distance is less than 5 Å, the concentration quenching mechanism among the dopants is dominated by the exchange interaction, whereas the electric multipole interaction contributes to the concentration quenching mechanism when the critical distance is larger than 5 Å.3,34 To examine the potential concentration quenching mechanism among the Tb3+ ions in the NaBiF4 host lattices, the critical distance was calculated using the following equation, given by Blasse:35
 | (2) |
To further investigate the above concentration quenching mechanism, the relation between the dopant concentration (x) and PL emission intensity (I) was discussed using the following expression, given by Dexter:36
 | (3) |
 | (4) |
3.3 Thermal stability and electroluminescent property
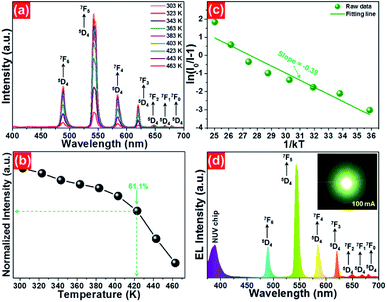
To evaluate the applicability of phosphors for indoor illumination, their thermal quenching performance should be analyzed since it can directly influence the performance of the packaged LED device. The representative temperature-dependent PL emission spectra of the NaBiF4:0.5Tb3+ nanoparticles in the temperature range of 303–463 K were detected to examine the thermal stability of the synthesized samples, as illustrated in Fig. 5(a). It is obvious that the emission peaks did not shift with the increment of temperature, whereas the PL emission intensity quenched gradually caused by the thermal quenching effect. Nevertheless, when the surrounding temperature was 423 K, the PL emission intensity of the studied samples still maintained 61.1% of its initial value at 303 K (Fig. 5(b)), indicating that the NaBiF4:xTb3+ nanoparticles had good thermal stability and were suitable for solid-sate lighting applications. Furthermore, with the aid of following expression, the activation energy (ΔE) for the thermal quenching in the NaBiF4:xTb3+ material system was estimated:38,39
 | (5) |
 | (6) |
As a proof of the potential application of the prepared samples for solid-state lighting, a LED device was fabricated using the NaBiF4:0.5Tb3+ nanoparticles and an NUV chip. In brief, the prepared NaBiF4:0.5Tb3+ powders were firstly mixed with a silicone epoxy, and then the obtained mixture was coated onto the surface of the NUV chip to package the LED device. After heating at 100 °C for 1 h, the EL emission property of the achieved LED device was examined. Under a basis forward current of 100 mA, the EL spectrum of the developed LED device was measured, as displayed in Fig. 5(d). It can be seen from Fig. 5(d) that the recorded EL spectrum was made up of two parts, that is, a weak band located in the NUV region and series of sharp peaks in the range of 475–700 nm. Especially, the emission band located in the NUV region with a central wavelength of ~385 nm is attributed to the emission of NUV chip and the other sharp peaks 488 nm (5D4 → 7F6), 543 nm (5D4 → 7F5), 583 nm (5D4 → 7F4), 620 nm (5D4 → 7F3), 647 nm (5D4 → 7F2), 667 nm (5D4 → 7F1) and 679 nm (5D4 → 7F0) are assigned to the characteristic emissions of Tb3+ ions. Ultimately, the fabricated LED device can emit glaring green emission when the injection current was 100 mA (see inset of Fig. 5(d)). These results revealed that the NaBiF4:xTb3+ nanoparticles can be efficiently excited by the NUV chip and were good green-emitting component candidates for WLEDs.
4. Conclusions
In summary, the Tb3+-doped NaBiF4 green-remitting nanoparticles were synthesized via a room-temperature chemical precipitation method. Both the contour lines and 3D PL emission spectra indicated that the NUV light was the proper excitation lighting source for the studied samples. Under 378 nm light irradiation, the synthesized nanoparticles can emit visible green emission. The PL emission intensity was revealed to be dependent on the dopant concentration and the optimal doping concentration for Tb3+ ions in the NaBiF4 host lattices was 50 mol%. By theoretical calculation, one finds that the electric dipole–dipole interaction can contribute to the concentration quenching mechanism and the critical distance was 10.4 Å. Furthermore, the temperature-dependent PL emission spectra confirmed that the NaBiF4:xTb3+ nanoparticles also possessed excellent thermal stability. Ultimately, the fabricated LED device, which consisted of a NUV chip and the resultant nanoparticles, revealed that the NaBiF4:xTb3+ nanoparticles were suitable for solid-state lighting applications as the green-emitting component.Conflicts of interest
There are no conflicts to declare.Acknowledgements
This work was supported by the National Research Foundation of Korea (NRF) Grant funded by the Korea government (MSIP) (No. 2017R1A2B4011998 and 2018R1A6A1A03025708).Notes and references
- X. N. Zhang, C. Guo and H. Jing, RSC Adv., 2013, 3, 7495–7502 RSC.
- H. L. K. Bharat, S. Jeon, K. G. Krishna and J. S. Yu, Sci. Rep., 2017, 7, 42348 CrossRef PubMed.
- B. Wang, Y. Liu, Z. Huang and M. Fang, RSC Adv., 2018, 8, 15587–15594 RSC.
- X. Huang and H. Guo, Dyes Pigm., 2018, 154, 82–86 CrossRef.
- Z. Xia and A. Meijerink, Chem. Soc. Rev., 2017, 46, 275–299 RSC.
- X. Huang and H. Guo, RSC Adv., 2018, 8, 17132–17138 RSC.
- X. Huang, B. Li, H. Guo and D. Chen, Dyes Pigm., 2017, 143, 86–94 CrossRef.
- J. Zhong, D. Chen, Y. Yuan, L. Chen, H. Yu and Z. Ji, Chem. Eng. J., 2017, 309, 795–801 CrossRef.
- P. Du, Y. Hua and J. S. Yu, Chem. Eng. J., 2018, 352, 352–359 CrossRef.
- B. Li, X. Huang, H. Guo and Y. Zeng, Dyes Pigm., 2018, 150, 67–72 CrossRef.
- X. Huang, J. Alloys Compd., 2017, 390, 356–359 CrossRef.
- X. Wang, Y. Wang, Y. Bu, X. Yan, J. Wang, P. Cai, T. Vu and H. J. Seo, Sci. Rep., 2017, 7, 43383 CrossRef PubMed.
- P. Du, P. Zhang, S. H. Kang and J. S. Yu, Sens. Actuators, B, 2017, 252, 584–591 CrossRef.
- X. Huang, B. Li and H. Guo, J. Alloys Compd., 2017, 695, 2773–2778 CrossRef.
- X. Li, X. Chen, X. Yuan, S. Liu, C. Wang and D. Chen, J. Mater. Chem. C, 2017, 5, 10201–10210 RSC.
- S. Liu, S. Liu, M. Zhou, X. Ye, D. Hou and W. You, RSC Adv., 2017, 7, 36935–36948 RSC.
- K. Pavani, J. S. Kumar, K. Srikanth, M. J. Soares, E. Pereira, A. J. Neves and M. P. F. Graça, Sci. Rep., 2017, 7, 17646 CrossRef PubMed.
- P. Du and J. S. Yu, Chem. Eng. J., 2017, 327, 109–119 CrossRef.
- J. J. Rogers, K. J. D. MacKenzie, G. Rees and J. V. Hanna, Ceram. Int., 2018, 44, 1110–1119 CrossRef.
- T. Zheng, L. Luo, P. Du, A. Deng and W. Li, J. Eur. Ceram. Soc., 2018, 38, 575–583 CrossRef.
- X. Zhao, H. Suo, Z. Zhang, L. Zhang and C. Guo, Dyes Pigm., 2017, 146, 119–126 CrossRef.
- P. Du, A. M. Deng, L. Luo and J. S. Yu, New J. Chem., 2017, 41, 13855–13861 RSC.
- H. Suo, X. Zhao, Z. Zhang, T. Li, E. M. Goldys and C. Guo, Chem. Eng. J., 2017, 313, 64–73 CrossRef.
- Y. Li, X. Li, Z. Xue, M. Jiang, S. Zeng and J. Hao, Adv. Healthcare Mater., 2017, 6, 1601231 CrossRef PubMed.
- L. Marciniak, A. Pilch, S. Arabasz, D. Jin and A. Bednarkiewicz, Nanoscale, 2017, 9, 8288–8297 RSC.
- J. Xue, X. Wang, J. H. Jeong and X. Yan, Phys. Chem. Chem. Phys., 2018, 20, 11516–11541 RSC.
- J. Fu, R. Pang, Y. Jia, W. Sun, L. Jiang, S. Zhang and G. Li, J. Lumin., 2017, 181, 240–245 CrossRef.
- P. Lei, R. An, S. Yao, Q. Wang, L. Dong, X. Xu, K. Du, J. Feng and H. Zhang, Adv. Mater., 2017, 29, 1700505 CrossRef PubMed.
- P. Du, X. Huang and J. S. Yu, Chem. Eng. J., 2018, 337, 91–100 CrossRef.
- A. Jain, C. A. E. González, E. M. Tejeda, A. Durán, O. E. Contreras and G. A. Hirata, Ceram. Int., 2018, 44, 1886–1893 CrossRef.
- A. Escudero, E. Moretti and M. Ocaña, CrystEngComm, 2014, 16, 3274–3283 RSC.
- G. S. R. Raju, E. Pavitra, G. i. Nagaraju, X. Guan and J. S. Yu, RSC Adv., 2015, 5, 22217–22223 RSC.
- X. Huang, B. Li, P. Du, H. Guo, R. Cao, J. S. Yu, K. Wang and X. W. Sun, Dyes Pigm., 2018, 151, 202–210 CrossRef.
- S. Liu, J. He, Z. Wu, J. H. Jeong, B. Deng and R. Yu, J. Lumin., 2018, 200, 164–168 CrossRef.
- G. Blasse, Phys. Lett. A, 1969, 24, 131–144 Search PubMed.
- D. L. Dexter, J. Chem. Phys., 1953, 21, 836–850 CrossRef.
- X. Huang, S. Wang, B. Li, Q. Sun and H. Guo, Opt. Lett., 2018, 43, 1307–1310 CrossRef PubMed.
- J. Zhong, D. Chen, H. Xu, W. Zhao, J. Sun and Z. Ji, J. Alloys Compd., 2017, 695, 311–318 CrossRef.
- H. Deng, Z. Gao, N. Xue, J. H. Jeong and R. Yu, J. Lumin., 2017, 192, 684–689 CrossRef.
- P. Du and J. S. Yu, J. Lumin., 2016, 179, 451–456 CrossRef.
- S. K. Hussain, G. M. Rao, G. S. R. Raju, L. K. Bharat, P. S. V. S. Rao and J. S. Yu, J. Lumin., 2016, 178, 183–191 CrossRef.
| This journal is © The Royal Society of Chemistry 2018 |

