 Open Access Article
Creative Commons Attribution 3.0 Unported Licence
Effect of solvophobicity on the phase behavior of linear ABC triblock copolymers in selective solvents: a Monte Carlo study
Zhihua Gao abc,
Jie Cui
 a,
Yuanyuan Han
 *a and
Wei Jiang
 *a
*a
aState Key Laboratory of Polymer Physics and Chemistry, Changchun Institute of Applied Chemistry, Chinese Academy of Sciences, Changchun 130022, China. E-mail: yyhan@ciac.ac.cn; wjiang@ciac.ac.cn; Tel: +86-431-85262642
bUniversity of Chinese Academy of Sciences, Beijing 100049, China
cNortheast Normal University, School of Physics, Changchun 130024, China
First published on 30th July 2018
Abstract
The microphase separation behavior of linear ABC triblock copolymers in A-selective solvents are studied using Monte Carlo simulation. The ABC triblock copolymer used in this study has a short solvophilic block A and two long solvophobic blocks B and C. The effects of the solvophobicity difference and the incompatibility between solvophobic blocks B and C on the micelle morphologies formed by linear ABC triblock copolymers are investigated, and phase diagrams as a function of the solvophobicity of blocks B and C are given at different repulsions between blocks B and C, respectively. A series of multicompartment micelles with distinct solvophobic parts is obtained, such as pupa-like multi-layered micelles, hamburger-like micelles and bumpy disks. Remarkably, when the solvophobicity of blocks B is much stronger than that of blocks C, a novel reverse core–shell–corona micelle with solvophilic blocks A located in the center of the micelle is obtained. Moreover, the results indicate that the competition between the effects of the incompatibility and solvophobicity difference between blocks B and C determines the microphase separation structures in the multicompartment micelles. These simulation results elucidate the mechanism of the formation of ABC triblock copolymer nanostructures and provide theoretical guidance for experimental studies.
1. Introduction
The self-assembly of multiblock copolymers in selective solvents has received great attention due to the formation of micelles with complex nanostructures.1 Micelles formed by multiblock copolymers with more than one solvophobic blocks have been found to own multiple subdivided compartments in their solvophobic cores.2–4 Micelles with multiple compartments are similar to some biological structures such as eukaryotic cells whose subdivided domains have various physical and chemical properties.4 Hence, multicompartment micelles are assumed to be suited for mimicking biological structures and features.5–7 Furthermore, more than two incompatible payloads such as gene therapy agents and drug molecules can be encapsulated in their discrete compartments concurrently in a prescribed manner;8 therefore, multicompartment micelles also possess potential applications in biomedicine and drug delivery.8–12The design and preparation of multicompartment micelles with precisely controlled microstructures are crucial for the realization of their potential applications. Triblock terpolymers with one soluble block and two different insoluble blocks are thought to be suitable for the preparation of multicompartment micelles because the repulsions between different insoluble blocks can force them to segregate into distinct nanodomains.13 The most investigated triblock terpolymer is the ABC miktoarm star terpolymer.13–19 For a miktoarm star terpolymer, the length of its solvophilic arm is the key factor to determine its overall micelle morphology, while the length ratio between its two solvophobic arms determines the compartmented structures in the micelles.19 By adjusting these two parameters, various multicompartment micelles with delicate microstructures can be obtained.13–15,19
In addition to the well-investigated miktoarm star terpolymers, linear ABC triblock copolymers have also attracted significant attention due to their potential in the preparation of multicompartment micelles.20–30 For linear ABC triblock copolymers with a solvophilic block A and two sequential solvophobic blocks B and C, core–shell–corona (CSC) spheres are the most commonly formed multicompartment micelles in experiments when the end block C has the strongest solvophobicity.20–23 Raspberry-like spheres are another type of multicompartment micelle usually formed by linear ABC triblock copolymers.21,22,24,25 Different from the CSC spheres, in the raspberry-like spheres, the middle blocks with a relatively small volume fraction generally aggregate into small bumps rather than a shell on the core. Jiang et al. investigated the morphological transition between CSC spheres and raspberry-like spheres using dissipative particle dynamics (DPD) simulation.26 They found that the solvophobicity and chain length of the middle block are two key factors in determining the type of spheres. In addition to spherical multicompartment micelles, a variety of cylinders with complex multicompartment structures have also been observed in experiments.27–30 For example, the experimental work reported by Cui et al. illustrated that the CSC spheres formed by linear ABC triblock copolymers can transform into CSC disks, and even into long cylinders with multiple segmented layers by adjusting the solvent quality.30 From these works, we can find that besides the chain length ratio, the solvophobicity of the solvophobic blocks also has significant influence on the micelle structures formed by linear ABC triblock copolymers.
It is evident that the parameter space affecting the self-assembly behaviors of linear ABC triblock copolymers is very large; therefore, simulation methods have become powerful tools for predicting new structures and illustrating the effects of various parameters, such as block solvophobicity,31–33 polymer concentration,34–36 block length ratio,32–35 block sequence36 and molecular architecture.35–37 Our group has also carried out some simulations on the self-assembly of linear ABC triblock copolymers in selective solvents, i.e., Ma et al.32 and Zhu et al.33 illustrated the formation conditions of micelles with bump surfaces using the self-consistent field theory (SCFT) and Monte Carlo (MC) simulation, respectively. In their works, the solvophobicities of the different solvophobic blocks were either quite close or equal. For better understanding the effect of the solvophobicity difference on micelle structures, a wider range of solvophobicities needs to be investigated. Additionally, compared with other factors, investigations on the effect of incompatibility between different solvophobic blocks are still insufficient. Therefore, in this study, the cooperative effect of the solvophobicity difference and incompatibility between different solvophobic blocks on the microphase separation behaviors of linear ABC triblock copolymers is illustrated using the MC method, and phase diagrams as a function of the solvophobicity of blocks B and C with different incompatibility between blocks B and C are obtained.
2. Model and method
Lattice Monte Carlo simulations were carried out in a simple cubic box of volume V = 50 × 50 × 50. Periodic boundary conditions were employed in three directions of the simulation box. Each lattice site in the simulation box was occupied by either a polymer monomer or a solvent molecule, and the volume fraction of polymers was set as Cp = 0.08. It should be noted that two monomers cannot occupy one site simultaneously. According to the single-site bond fluctuation model proposed by Carmesin and Kremer38 and by Larson,39,40 the permitted bond length value adopted by polymer chains is 1 or √2. The microrelaxation model, which has been proven to be highly efficient in relaxing the local chain conformation in the lattice model,41–43 was adopted in this study to realize the attempted movements of the monomers in the polymer chains. The microrelaxation model works as follows: a monomer is randomly chosen and we try to exchange it with one of its 18 nearest neighbors. If the chosen neighbor is a solvent molecule, the exchange is accepted if does not violate the bond length restriction. If a single break is created in the chain, the solvent molecule continues to exchange with subsequent monomers along the broken chain until the links reconnect. The exchange is disallowed if it breaks more than two chain connections. The acceptance or rejection of the attempted move is further governed by the Metropolis rule:44 if the energy change, ΔE, is negative, the exchange is accepted. Otherwise, the exchange is accepted with a probability of P = exp[−ΔE/(kBT)], where, ΔE = ΣijΔNijεij is the energy change caused by the attempted move; ΔNij is the number difference of the nearest neighbor pairs between components i and j before and after the movement, where, i, j = A, B, C, and S (solvent); εij is the interaction energy between components i and j; kB is the Boltzmann constant and T is the temperature. 1/kBT was set as 0.07 in the whole simulation to represent a relatively low temperature.The linear triblock copolymer studied herein consisted of one short solvophilic block A and two solvophobic blocks B and C, which was denoted as A2B5C5. The chain length (N) of the triblock copolymer was unchanged throughout the simulation, i.e., N = 12. To mimic the incompatibilities among the different blocks, the repulsive interactions between blocks A and B (or C) were set as εAB = εAC = 0.1, while the repulsive interaction between blocks B and C was set as εBC > 0. Also, to mimic the amphiphilic nature of the ABC triblock copolymers in A-selective solvents, the interaction energy between solvophilic blocks A and the solvents was set as εAS = −0.4, while the interaction energies between the solvophobic blocks B (or C) and solvents were set as εBS (or εCS) > 0. To simulate the experimental process when selective solvents are gradually added to a solution, the value of εBS (or εCS) gradually increased from 0 to a positive value through 350 steps. At each step, 7000 MC steps (MCS) were carried out (in one MCS, each monomer has to take an attempted exchange move on average). After the value of εBS (or εCS) increased to the preset positive value, 200 extra steps with εBS (or εCS) unchanged were carried out to confirm the final structures to be in equilibrium state. Besides, all the self-interaction parameters between the same components (i.e., εAA, εBB, εCC, and εSS) in this study were set as 0. The aforementioned parameter settings ensure that the solvent is good for block A and poor for blocks B and C, and the three blocks were mutually incompatible.
3. Results and discussion
In this section, the effect of the solvophobicity difference between blocks B and C on the self-assembly behaviors of linear A2B5C5 triblock copolymers in A-selective solvents were investigated in detail. The values of the interaction parameters εBS and εCS reflect the solvophobicity of blocks B and C, respectively. Different values of εBS and εCS (both ranging from 1.0 to 10.0) were employed for constructing the conditions with various solvophobicity differences. The parameter kBC = εBS/εCS was introduced to measure the solvophobicity difference between blocks B and C. Since the incompatibility between blocks B and C is another important parameter affecting the micelle morphologies formed by ABC triblock copolymers, two values of the repulsive interactions, i.e., εBC = 2.0 and 4.0, were employed to reflect the weak and strong incompatibilities between block B and C, respectively. It is noteworthy that the two repulsive interactions chosen in this study can lead to either weak (εBC = 2.0) or strong (εBC = 4.0) phase separation between blocks B and C.3.1. Effect of the solvophobicity difference between blocks B and C on the micelle morphologies
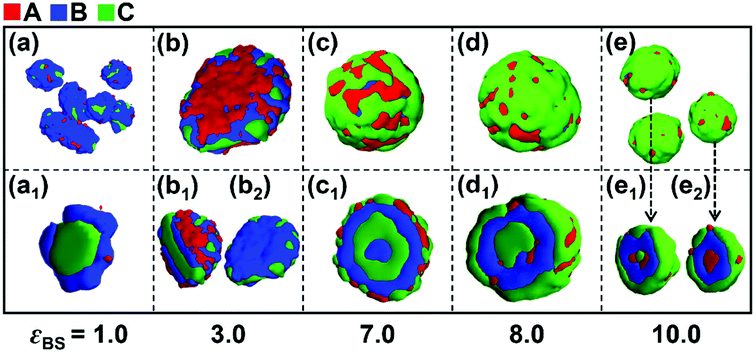
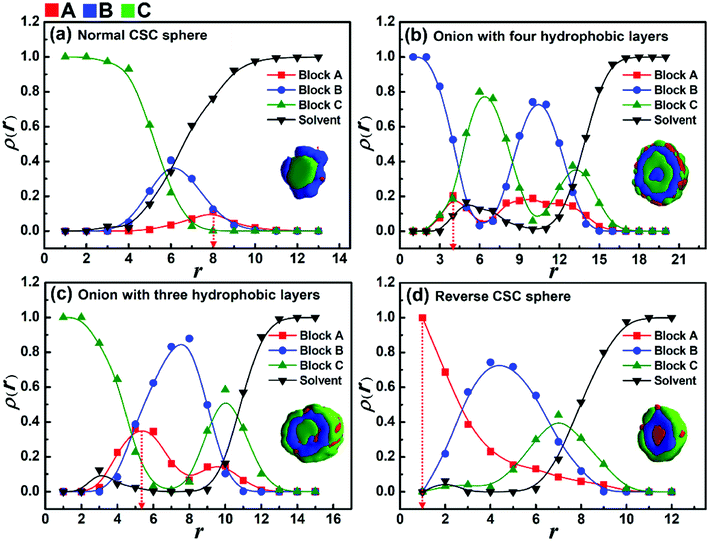
Firstly, the effect of the solvophobicity difference between blocks B and C on the micelle morphologies were investigated in the case of weak incompatibility between blocks B and C (i.e., εBC = 2.0). Fig. 1 shows the morphological transition of the micelles with different solvophobicities of blocks B (εBS) when the solvophobicity of blocks C is εCS = 2.0. As shown in Fig. 1a, when the solvophobicity of blocks B is weaker than that of blocks C (kBC = 0.5), typical core–shell–corona (CSC) spheres are observed. The distribution of blocks in these spheres is CBA from the inside to the outside of the micelles (Fig. 1a1), which is consistent with the sequence that the most solvophobic blocks C locate in the innermost layer, while the solvophilic blocks A locate in the outermost layer of the micelles. When εBS is increased to 3.0 (kBC = 1.5), a disk-like micelle with bumps on its edge is formed (Fig. 1b). In this disk-like micelle, blocks C form bumps on the edge of the disk (Fig. 1b2) to reduce the contact between blocks B and solvents, which is mainly because εCS is slightly smaller than εBS. When εBS is further increased to 7.0 (kBC = 3.5) and 8.0 (kBC = 4.0), onion-like spheres with four (Fig. 1c1) or three (Fig. 1c2) solvophobic layers are formed, respectively. It can be seen from Fig. 1c1 and c2, blocks B locate in the inner layer, while blocks C and blocks A locate on the surface of the onion-like spheres due to the strong solvophobicity. When the solvophobicity between blocks B and C is extremely large (εBS = 10.0 and kBC = 5.0), novel reverse CSC spheres are observed (Fig. 1e2). Compared with the normal CSC spheres (Fig. 1a1), in the reverse spheres (Fig. 1e2), the solvophilic blocks A locate in the innermost layer instead of the surface of the sphere. Xu and coworkers45 reported similar reverse micelles formed by amphiphilic ABC triblock copolymers in mixed solvents in experiments. With the change in the solvent polarity, the intramolecular hydrogen bonding among blocks A caused the solvophilic blocks A distributed in the center of the spherical micelles to form reverse micelles. Different from their experimental work, our simulation results indicate that when the solvophobicity of middle blocks B is much stronger than that of the end blocks C, the extremely large solvophobicity difference makes blocks C locate on the surface of the micelles to protect blocks B from contacting with the solvent, and due to the block sequence and the short block length of blocks A, the solvophilic blocks A have to distribute in the center of the micelles.As shown in Fig. 1, when the solvophobicity difference between blocks B and C is increased from kBC = 0.5 to 5 in the case of εCS = 2.0, a morphological transition from normal CSC spheres to reverse CSC spheres is observed. During this morphological transition, the translocation of solvophilic blocks A in the micelles apparently plays an important role. Therefore, to better observe the locations of blocks A in each spherical micelle shown in Fig. 1, the variations of the density of block A as well as the other two components with the radii around the mass center (r) of the spherical micelles were calculated and shown in Fig. 2. It is noteworthy that for the distribution curve of each block, the position (r value) of the highest density value (or peak value) corresponds to the location area of each block. It can be seen from Fig. 2a that blocks C, B and A successively locate from the center (r < 4) to the surface (r ≈ 8), which is consistent with the morphology of the normal CSC sphere. When the solvophobicity difference is increased to kBC = 3.5 (Fig. 2b), two peaks are observed in the density curve of block A, and one of the peak positions (r ≈ 4) is quite close to the center of the micelles, indicating that some of the solvophilic blocks A translocated from the surface to the center of the micelle. This phenomenon can also be observed in Fig. 2c. When kBC is increased to 5.0 (Fig. 2d), the density curve of block A clearly shows that all of the solvophilic blocks translocated into the center of the micelle, and then reverse CSC spheres are formed. In addition, the density curve of the solvents in the reverse CSC sphere indicates that almost none of the solvents locate in the center of the micelle, which proves that the reverse micelle is a solid sphere rather than a vesicle. The simulation results shown in Fig. 2 indicate that in the case of a small εCS, the solvophobicity difference between solvophobic blocks B and C is a key factor in determining the distribution of solvophilic blocks A in the micelles.
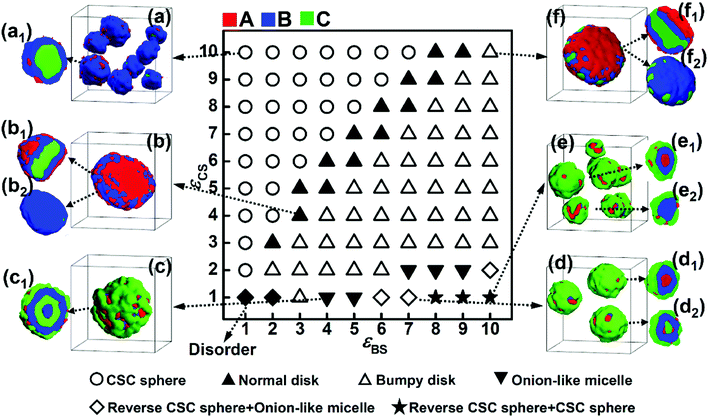
According to the simulation results shown in Fig. 1 and 2, increasing the solvophobicity difference between blocks B and C not only affects the overall micelle morphology (Fig. 1), but also the distribution of the solvophilic blocks in the micelles (Fig. 2). Thus, to further understand the effect of the solvophobicity difference on the phase behaviors of ABC triblock copolymers in A-selective solvents, a phase diagram as a function of the solvophobicity of blocks B and C was drawn and shown in Fig. 3. As shown in Fig. 3, when the solvophobicity of blocks B is much weaker than that of blocks C (εBS < εCS), normal CSC spheres (Fig. 3a, which are denoted by the circle in the phase diagram) are generally formed. In the normal CSC sphere, the end blocks C form the core of the sphere due to their stronger solvophobicity (Fig. 3a1). The formation condition of normal CSC spheres is quite consistent with the experimental reports in the literature.20–23 When εBS is increased but still smaller than εCS, the disk-like micelles (Fig. 3b, which are denoted by the solid upper triangle in the phase diagram) tend to be formed. Different from the bumpy disk shown in Fig. 1b, in this disk-like micelle, the innermost layer formed by the end blocks C is fully covered by the mid layer formed by blocks B (Fig. 3b2). To differentiate this disk-like micelle from the bumpy disk, this type of disk-like micelle is named normal disk in the following discussion. From the relationship between εBS and εCS, i.e., εBS < εCS, it can be found that the formation of the normal disk is mainly because the solvophobicity of blocks C is stronger than that of blocks B. Therefore, the fully covered middle layer formed by blocks B prevents blocks C from contacting with solvents, which then reduces the free energy of the system. Whereas, when εBS is further increased to meet the condition of εBS ≥ εCS, the bumpy disk (Fig. 3f, which is denoted by the open upper triangle) becomes the dominant type of micelle. This is quite reasonable because the bumps formed by blocks C on the edge can increase the contact area between blocks C and the solvents, and also decrease the contact area between blocks B and solvents, which reduces the free energy of the system. In addition to the bumpy disk, in the case of εBS ≥ εCS, once the solvophobicity of blocks C is rather weak, i.e., εCS ≤ 2, onion-like micelles (Fig. 3c1 and d2) and reverse CSC spheres (Fig. 3d1 and e1) can be found in the phase diagram. In these two micelles, a mixture of solvophobic blocks C and solvophilic blocks A generally forms the outer layers of the micelles, and the solvophobic blocks B are always distributed in the micelles due to their stronger solvophobicity. It should be note that the formation conditions for the onion-like micelles, and especially the reverse CSC spheres, are relatively harsh, i.e., only when the value of εCS is rather small and the solvophobicity difference between εCS and εBS is relatively large, these two kinds of micelles can be formed.
3.2. Effect of the incompatibility between blocks B and C on the micelle morphology
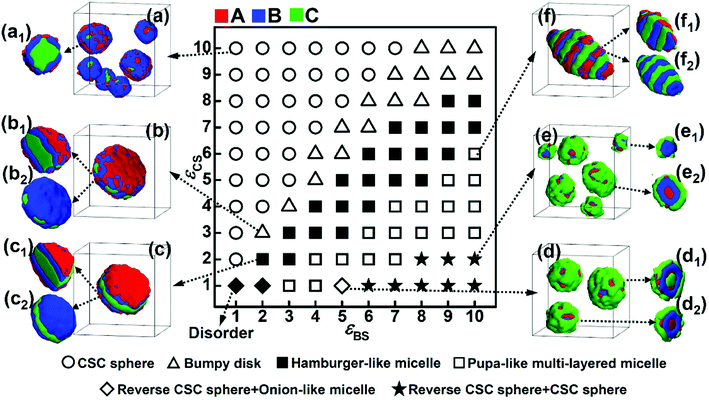
The repulsive interaction, εBC, reflects the incompatibility between blocks B and C, which is assumed to be an important factor affecting the microphase structures self-assembled by ABC terpolymers.13 In this subsection, the repulsive interaction between blocks B and C was increased to εBC = 4.0, and the phase diagram as a function of εBS and εCS was obtained (Fig. 4). The comparison between the two phase diagrams with either weak (Fig. 3) or strong (Fig. 4) repulsive interactions between blocks B and C was done to illustrate the effect of the incompatibility between these two blocks on the self-assembly behaviors of ABC triblock copolymers.As shown in Fig. 4, when the solvophobicity of blocks C is much larger than that of blocks B, the normal CSC sphere (Fig. 4a), which is denoted by the circle in the top left corner of the phase diagram, is the dominant type of micelle. In contrast, when the solvophobicity of blocks C is much smaller than that of blocks B, the onion like micelle (Fig. 4d1) and reverse CSC sphere (Fig. 4d2 and e2), which are denoted by the diamond and star in the bottom right corner of the phase diagram, respectively, can generally be observed. By comparing Fig. 4 with 3, it can be found that the formation conditions of the aforementioned three micelles in the case of εBC = 4.0 are quite similar with that in the case of εBC = 2.0. This indicates that when the solvophobicity difference between blocks B and C is large, the micelle morphology is independent of the incompatibility between blocks B and C and mainly dependent of the relationship between εBS and εCS. Specifically, when εBS is much smaller than εCS, the normal CSC sphere is formed, whereas, when εBS is much larger than εCS, the onion-like micelle and reverse CSC sphere are formed. However, when the solvophobicity difference between blocks B and C is relatively small (i.e., the values of εBS and εCS are close), the influence of the incompatibility between blocks B and C becomes stronger. It can be seen from Fig. 4 that when the values of εBS and εCS are close, the bumpy disk (Fig. 4b, denoted by the open upper triangle in the phase diagram) generally forms in the case of εBS < εCS, while the hamburger-like micelle (Fig. 4c, denoted by the solid square in the phase diagram) generally forms in the case of εBS ≈ εCS, and the pupa-like multi-layered micelle (Fig. 4f, denoted by the open solid square in the phase diagram) generally forms in the case of εBS > εCS. In other words, morphological transitions from bumpy disk to hamburger-like micelle, and then to pupa-like multi-layered micelle can be observed with an increase εBS. This is different from the phase diagram shown in Fig. 3, in which only the normal disk (Fig. 3b) and bumpy disk (Fig. 3f) can be observed when the values of εBS and εCS are close. Therefore, it can be found that when the solvophobicity difference between blocks B and C is relatively small, an increase in the incompatibility between blocks B and C makes the micelle morphology more variable. It is noteworthy that similar pupa-like multi-layered micelles formed by ABC star terpolymers have been observed in the case of an extremely strong incompatibility between components B and C by Kong et al. using MC simulation.19 Our simulation results show that the pupa-like multi-layered micelle can also be obtained by adjusting the solvophobicities of blocks B and C. In our previous study, we investigated the phase behaviors of poly(2-vinylpyridine)-b-polybutadiene-b-polystyrene (P2VP-b-PBd-b-PS) in selective solvents,32 where a mixture of toluene and methanol was used as the selective solvent. By adjusting the volume ratio of toluene to methanol, the solvent quality can be easily changed, and the solvophobicity of PS can either be stronger or weaker than that of PBd. The experimental result showed that when the solvophobicity of PS is weaker than that of PBd, the bumpy disk can be formed, which is quite consistent with our simulation results (Fig. 3f). Therefore, it can be concluded that by carefully controlling the solvent quality, other multicompartment micelles, such as the pupa-like multi-layered micelles (Fig. 4f) and reverse CSC spheres (Fig. 4e) may also be obtained from linear ABC triblock copolymers in experiments.
In addition, generally in experiments, strong incompatibility between different insoluble blocks is assumed to be essential in preparing multicompartment micelles.13 However, our simulation results illustrate that a relatively weak incompatibility between blocks B and C can still lead to phase separation between the different insoluble blocks (Fig. 3). By adjusting the incompatibility and the solvophobicity difference, a variety of multicompartment micelles with different micro-phase separation structures can be formed (Fig. 3 and 4).
3.3. The microphase separation behaviors of solvophobic blocks B and C
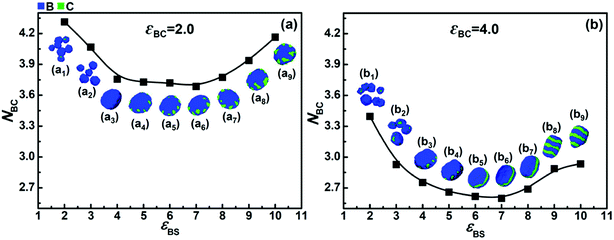
To further elucidate the effects of the incompatibility and the solvophobicity difference between blocks B and C on their microphase separation behaviors, the average contact numbers between blocks B and C (NBC), which reflects the microphase separation degree between blocks B and C, were calculated.Fig. 5a shows the variation of NBC with εBS when εCS = 5.0 and εBC = 2.0. It can be seen that when the solvophobicity difference between blocks B and C is rather small (i.e., εBS = 5.0–7.0), the value of NBC is very low, which indicates that the microphase separation between blocks B and C is sufficient. However, when the solvophobicity difference is large (i.e., εBS < 5.0 and εBS > 7.0), the value of NBC is relatively high. A high value of NBC means that the microphase separation between blocks B and C is insufficient, and therefore, we can infer that it is the solvophobicity difference rather than the incompatibility between blocks B and C that determines their microphase structure. Taking the case with the largest solvophobicity difference as an example (i.e., εBS = 10.0), it can be seen that a disk-like micelle with large bumps (composed of blocks C) on the edge is formed (Fig. 5a9). According to their high NBC value, the large C bumps apparently increase the contact area between the incompatible blocks B and C. However, the formation of large C bumps also reduces the contact area between the solvents and blocks B. Hence, the formation of large C bumps mainly results from the solvophobicity difference between blocks B and C. This reveals the fact that there is competition between the effects of the incompatibility and the solvophobicity difference on the microphase structures formed by blocks B and C. When the incompatibility between blocks B and C is much stronger, i.e., εBC = 4.0, as shown in Fig. 5b, all the NBC values are much smaller than that in Fig. 5a. This indicates that the microphase separation between blocks B and C is always stronger in the case of εBC = 4.0 than that in the case of εBC = 2.0. However, the overall trend of the NBC variation shown in Fig. 5b is quite similar to that shown in Fig. 5a, which indicates that the competition between the incompatibility and the solvophobicity difference between blocks B and C still exists when their incompatibility is strong. It should be noted that more microphase structures (Fig. 5b1–b9) formed by blocks B and C can be observed due to the competition between the stronger incompatibility and the solvophobicity difference.
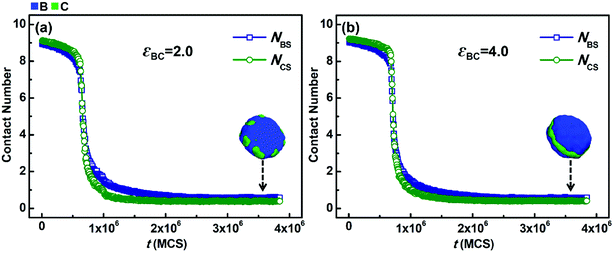
In addition to NBC, the average contact numbers between the solvophobic blocks and solvents (NBS and NCS), which reflects the phase separation degree between the solvophobic blocks and solvents, were also calculated. Fig. 6 shows the variations in NBS and NCS with simulation time (t) when the solvophobicity difference between blocks B and C is small, i.e., kBC = εBS/εCS = 6.0/4.0 = 1.5. The situations with weak (εBC = 2.0) and strong (εBC = 4.0) incompatibility between blocks B and C are shown in Fig. 6a and b, respectively. As shown in Fig. 6a, NBS and NCS rapidly decrease and then remain almost unchanged with an increase in t. Both the decreasing speed and equilibrium value of NBS are quite similar to that of NCS. This means that the phase separation speeds of blocks B and C from solvents are close, and the contact area of blocks B with solvents is similar to that of blocks C in the final micelles. This phenomenon is quite reasonable because the solvophobicity difference between blocks B and C is small. A similar phenomenon is also observed in Fig. 6b. This indicates that when the solvophobicity difference is small, increasing the incompatibility between blocks B and C has almost no impact on either the phase separation speeds or the final contact areas between the solvophobic blocks and solvents.
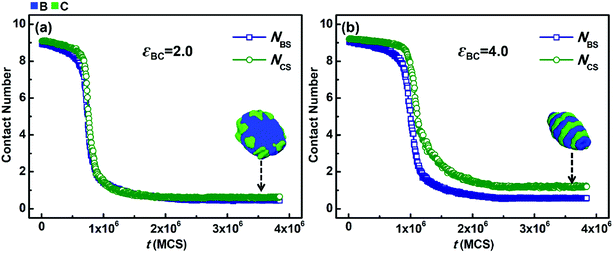
However, when the solvophobicity difference between blocks B and C is large, the situation is different. Fig. 7 shows the variations in NBS and NCS with t when the solvophobicity difference between blocks B and C is relatively large, i.e., kBC = εBS/εCS = 5.0/2.0 = 2.5. As shown in Fig. 7a, in the case of weak incompatibility (εBC = 2.0), the variation curves of NBS and NCS almost overlap with each other, which indicates that although the solvophobicity difference between blocks B and C increases, the phase separations of blocks B and C with solvents are still quite similar. However, as shown in Fig. 7b, when the incompatibility between blocks B and C is increased (εBC = 4.0), the decreasing speed of NBS is apparently faster than that of NCS, and the equilibrium value of NBS is much smaller than that of NCS. By comparing Fig. 7b with 7a, it can be found that an increase in the incompatibility between blocks B and C enlarges the effect of the solvophobicity difference between blocks B and C, which results in great changes in the micelle morphology.
From the simulation results shown in Fig. 6 and 7, it can be found that the competition between the incompatibility and solvophobicity difference between blocks B and C governs the microphase structures of the solvophobic cores in the micelles. On the other hand, when the solvophobicity difference between blocks B and C is large, an increase in the incompatibility can markedly enlarge the effect of the solvophobicity difference, which can result in big changes in not only the microstructures of the solvophobic cores, but also the overall micelle morphologies formed by ABC triblock copolymers.
4. Conclusions
In this study, the microphase separation behaviors of linear ABC triblock copolymers in A-selective solvents were investigated using Monte Carlo simulation. We mainly focused on the effects of the solvophobicity difference and the incompatibility between solvophobic blocks B and C on the micelle morphologies formed by linear ABC triblock copolymers. Phase diagrams as a function of the solvophobicity of blocks B and C were obtained at different repulsions between blocks B and C, respectively. A series of multicompartment micelles with distinct solvophobic parts were obtained, such as pupa-like multi-layered micelles, hamburger-like micelles and bumpy disks. Notably, when the solvophobicity of blocks B is much stronger than that of blocks C, a novel reverse core–shell–corona micelle with solvophilic blocks A located in the center of the micelle was obtained. By investigating the microphase structures of the solvophobic parts in the multicompartment micelles, it was found that the competition between the effects of the repulsions and the solvophobicity difference between blocks B and C determines the microphase separation structures in multicompartment micelles. Moreover, the simulation results also indicate that an increase in the incompatibility between blocks B and C enlarges the effect of the solvophobicity difference, which results in changes in not only the microstructures of the solvophobic cores, but also the overall micelle morphologies. These simulation results elucidate the mechanism of the formation of ABC triblock copolymer nanostructures and provide a theoretical basis for the precise control of micelle structures in experiments.Conflicts of interest
There are no conflicts to declare.Acknowledgements
This work was financially supported by the National Natural Science Foundation of China for the Major Program (51433009), the General Program (21474107), and the Natural Science Foundation of Jilin Province (20160520139JH). The resource provided by the Computing Center of Jilin Province is gratefully acknowledged.References
- Y.-C. Hsu, C.-I. Huang, W. Li, F. Qiu and A.-C. Shi, Polymer, 2013, 54, 431–439 CrossRef.
- J. F. Gohy, Adv. Polym. Sci., 2005, 190, 65–136 CrossRef.
- A. H. Gröschel and A. H. E. Müller, Nanoscale, 2015, 7, 11841–11876 RSC.
- A. O. Moughton, M. A. Hillmyer and T. P. Lodge, Macromolecules, 2012, 45, 2–19 CrossRef.
- H. Ringsdorf, P. Lehmann and R. Weberskirch, Abstr. Papers Am. Chem. Soc., 1999, vol. 217, p. U657 Search PubMed.
- H. Ringsdorf, B. Schlarb and J. Venzmer, Angew. Chem., Int. Ed., 1988, 27, 113–158 CrossRef.
- H. Baeumler and R. Georgieva, Biomacromolecules, 2010, 11, 1480–1487 CrossRef PubMed.
- T. P. Lodge, A. Rasdal, Z. B. Li and M. A. Hillmyer, J. Am. Chem. Soc., 2005, 127, 17608–17609 CrossRef PubMed.
- R. Savic, L. B. Luo, A. Eisenberg and D. Maysinger, Science, 2003, 300, 615–618 CrossRef PubMed.
- J. F. Lutz and A. Laschewsky, Macromol. Chem. Phys., 2005, 206, 813–817 CrossRef.
- U. Kedar, P. Phutane, S. Shidhaye and V. Kadam, Nanomedicine, 2010, 6, 714–729 CrossRef PubMed.
- F. H. Schacher, P. A. Rupar and I. Manners, Angew. Chem., Int. Ed., 2012, 51, 7898–7921 CrossRef PubMed.
- Z. B. Li, E. Kesselman, Y. Talmon, M. A. Hillmyer and T. P. Lodge, Science, 2004, 306, 98–101 CrossRef PubMed.
- Z. B. Li, M. A. Hillmyer and T. P. Lodge, Nano Lett., 2006, 6, 1245–1249 CrossRef PubMed.
- Z. B. Li, M. A. Hillmyer and T. P. Lodge, Langmuir, 2006, 22, 9409–9417 CrossRef PubMed.
- N. Saito, C. Liu, T. P. Lodge and M. A. Hillmyer, Macromolecules, 2008, 41, 8815–8822 CrossRef.
- J. W. Ma, X. Li, P. Tang and Y. Yang, J. Phys. Chem. B, 2007, 111, 1552–1558 CrossRef PubMed.
- E. B. Zhulina and O. V. Borisov, Macromolecules, 2008, 41, 5934–5944 CrossRef.
- W. Kong, B. Li, Q. Jin, D. Ding and A.-C. Shi, J. Am. Chem. Soc., 2009, 131, 8503–8512 CrossRef PubMed.
- G.-E. Yu and A. Eisenberg, Macromolecules, 1998, 31, 5546–5549 CrossRef.
- F. Schacher, A. Walther and A. H. E. Müeller, Langmuir, 2009, 25, 10962–10969 CrossRef PubMed.
- K. Skrabania, H. von Berlepsch, C. Boettcher and A. Laschewsky, Macromolecules, 2010, 43, 271–281 CrossRef.
- J.-N. Marsat, M. Heydenreich, E. Kleinpeter, H. von Berlepsch, C. Boettcher and A. Laschewsky, Macromolecules, 2011, 44, 2092–2105 CrossRef.
- S. Kubowicz, J. F. Baussard, J. F. Lutz, A. F. Thunemann, H. von Berlepsch and A. Laschewsky, Angew. Chem., Int. Ed., 2005, 44, 5262–5265 CrossRef PubMed.
- F. Schacher, A. Walther, M. Ruppel, M. Drechsler and A. H. E. Müeller, Macromolecules, 2009, 42, 3540–3548 CrossRef.
- T. Jiang, L. Wang, S. Lin, J. Lin and Y. Li, Langmuir, 2011, 27, 6440–6448 CrossRef PubMed.
- J. Dupont, G. Liu, K.-i. Niihara, R. Kimoto and H. Jinnai, Angew. Chem., Int. Ed., 2009, 48, 6144–6147 CrossRef PubMed.
- J. Dupont and G. Liu, Soft Matter, 2010, 6, 3654–3661 RSC.
- A. H. Gröeschel, F. H. Schacher, H. Schmalz, O. V. Borisov, E. B. Zhulina, A. Walther and A. H. E. Müeller, Nat. Commun., 2012, 3, 710 CrossRef PubMed.
- H. Cui, Z. Chen, S. Zhong, K. L. Wooley and D. J. Pochan, Science, 2007, 317, 647–650 CrossRef PubMed.
- R. Wang, P. Tang, F. Qiu and Y. Yang, J. Phys. Chem. B, 2005, 109, 17120–17127 CrossRef PubMed.
- Z. Ma, H. Yu and W. Jiang, J. Phys. Chem. B, 2009, 113, 3333–3338 CrossRef PubMed.
- Y. Zhu, H. Yu, Y. Wang, J. Cui, W. Kong and W. Jiang, Soft Matter, 2012, 8, 4695–4707 RSC.
- W. Kong, W. Jiang, Y. Zhu and B. Li, Langmuir, 2012, 28, 11714–11724 CrossRef PubMed.
- S.-H. Chou, H.-K. Tsao and Y.-J. Sheng, J. Chem. Phys., 2006, 125, 194903 CrossRef PubMed.
- C. Zhou, H. Xia, Y. Zhou, X. Xue and S. Luo, RSC Adv., 2015, 5, 58024–58031 RSC.
- Y. Zhao, Y.-T. Liu, Z.-Y. Lu and C.-C. Sun, Polymer, 2008, 49, 4899–4909 CrossRef.
- I. Carmesin and K. Kremer, Macromolecules, 1988, 21, 2819–2823 CrossRef.
- R. Larson, J. Chem. Phys., 1992, 96, 7904–7917 CrossRef.
- R. Larson, J. Chem. Phys., 1989, 91, 2479–2488 CrossRef.
- K. Haire, T. Carver and A. Windle, Comput. Theor. Polym. Sci., 2001, 11, 17–28 CrossRef.
- S. Ji and J. Ding, Langmuir, 2006, 22, 553–559 CrossRef PubMed.
- W. Hu, J. Chem. Phys., 1998, 109, 3686–3690 CrossRef.
- N. Metropolis, A. W. Rosenbluth, M. N. Rosenbluth, A. H. Teller and E. Teller, J. Chem. Phys., 1953, 21, 1087–1092 CrossRef.
- J. Xu, Z. Hou, X. Tang, J. Cheng and T. Li, Microsc. Res. Tech., 2011, 74, 1076–1082 CrossRef PubMed.
| This journal is © The Royal Society of Chemistry 2018 |

