DOI:
10.1039/C8RA05120H
(Paper)
RSC Adv., 2018,
8, 30491-30501
Preparation and properties of nanocomposites of β-cyclodextrin-functionalized polyacrylamide and its application for enhancing oil recovery
Received
14th June 2018
, Accepted 22nd August 2018
First published on 29th August 2018
Abstract
In this paper, β-cyclodextrin was successfully modified by maleic anhydride under certain experimental conditions. A novel water-soluble nanocomposite (AAMC-S1) consisting of nano-SiO2 was synthesized by free-radical polymerization using acrylamide (AM), 2-acrylamido-2-methyl propane sulfonic acid (AMPS) and modified β-cyclodextrin (MAH-β-CD) as raw materials. The characterization of AAMC-S1 was measured by Fourier transform infrared spectroscopy (FT-IR), 1H nuclear magnetic resonance spectroscopy (1H NMR), thermal degradation (TGA) and scanning electron microscopy (SEM). In the performance evaluation experiments, the AAMC-S1 nanocomposite demonstrated desirable properties in terms of its thickening ability, temperature resistance, salt tolerance and shear resistance compared to those of the pure polymer AM/AMPS/MAH-β-CD (denoted AAMC-S0). Desirable properties could be attributed to the introduction of inorganic nano-SiO2, which endowed the AAMC-S1 structure with rigidity and made the network structure denser and stronger. Based on the indoor displacement test, the AAMC-S1 nanocomposite gave a resistance factor (RF) of 22.31 and a residual resistance factor (RFF) of 5.58, compared with 17.71 and 2.73 for AAMC-S0. The enhanced oil recovery test showed that AAMC-S1 could remarkably enhance 13.25% of oil recovery while AAMC-S0 could enhance 7.12% of oil recovery. These behaviors made this novel nanocomposite promising in enhancing oil recovery.
1. Introduction
The global recovery factor ranges from 20% to 30% after primary and secondary recovery for most of a reservoir, and a lot of oil is still left in reservoirs.1 Therefore, enhanced oil recovery (EOR) methods have attracted more and more attention.2–5 It is known to all that polymer flooding has proved to be an effective technology to improve the EOR.6 Polyacrylamide (PAM) has been successfully employed in polymer flooding among which partially hydrolyzed polyacrylamide (HPAM) is one of the most commonly used in the oil field due to its superior solubility, excellent thickening property and capability of adjusting the water/oil ratio, resulting in higher flooding efficiency.7,8 However, HPAM suffers from serious problems under harsh reservoir conditions such as high-temperature and high-salinity. For example, the –CONH2 group of HPAM can be easily hydrolyzed at high temperature, and it is prone to phase separation and precipitation when HPAM is present in a high concentration of divalent cations (Mg2+, Ca2+), which will hinder its widespread application in the EOR process.9–11 On the other hand, the viscosity of HPAM solution drops dramatically at a high shear rate.12 It is due to the fact that irreversible shear degradation of the linear flexible chain impairs its network structure and polymer backbone.
Some efforts have shown that introduce functional groups, hydrophobic monomer and nanomaterials, etc. into HPAM can obviate the above mentioned problems.13–15 Cyclodextrins (CDs) are made up of 6, 7, or 8 glucose units forming doughnut-shaped cyclic oligosaccharides and denoted as α, β, or γ-CDs, respectively.16,17 Among them, β-CDs can be easily modified and have been extensively used in organic chemistry and polymer chemistry.18 The special molecular structure of β-CD consists of a hydrophobic inner core and a hydrophilic outer shell, making it can selectively incorporate a plenty of hydrophobic molecules as the guest into its cavity to form host-guest inclusion complex.19–21 Moreover, some research have indicated that the introduction of β-CD into copolymer backbone can exhibit remarkable salt-resistance and temperature-tolerance,22,23 which ensure its can be applied to oil field for EOR.
As we know, inorganic nanoparticle has gained great attention in many fields because of the very small size, large surface area, high surface energy and the plentiful hydroxyl on the surface.24,25 Nanoparticle has been gaining an interest for application in fields of petroleum engineering, such as drilling, fracturing, cementing and EOR, etc.26,27 Recently, some researches have focused on the use of polymer/nano-SiO2 nanocomposites to enhanced the performance of polymer flooding in EOR. Zhu et al. demonstrated that hydrophobically associating hydrolyzed polyacrylamide (HAHPAM) containing silica nanoparticles possessed high thermal stability, salt tolerance and the oil recovery factor higher than 10% in core flooding test.28 Maurya et al. reported the effect of the addition of SiO2 nanoparticles on the performance of polyacrylamide (PAM) solution, the result indicated that SiO2 nanoparticles could improve the apparent viscosity and rheological behavior of PAM.29 Pu et al. prepared a new type of core–shell hyperbranched polymer (HBPAM) with a silica nanoparticle in its core structure, it was found that the hyperbranched topological structure rendered the HBPAM excellent shear resistance, desirable salt resistance and temperature tolerance. The core flooding experiments showed that the HBPAM achieved good mobility control and improved sweep efficiency by constructing fr and frr in the porous medium.30 The work done by Lady J. Giraldo et al. showed nano-SiO2 was able to increasing the structure stability and prevent polymer from degradation in brine, thereby indicating its potential application in EOR.31 Typical methods employed to synthesis polymer nanocomposites consist of melt compounding, mechanical mixing and in situ polymerization methods, etc.32 These methods have been proven to be effective approach to improve the properties of polymer matrix, especially in situ polymerization. However, for naked SiO2 nanoparticles tended to be agglomerated into large clusters due to high surface energy, which caused SiO2 nanoparticles to be difficult to disperse in the polymer matrix.33 This also led to the nanocomposites can not exhibit their excellent performance. To prevent such agglomeration, SiO2 nanoparticles must be modified. Some studies have reported that silica surface modified with silane coupling agents not only made SiO2 nanoparticles disperse more uniformly but also could show the good compatibility with the polymer and could be successfully enhance the performance of pure polymer.34,35
In this work, a simple free-radical polymerization strategy was employed to prepared the novel AAMC-S1 nanocomposite by using acrylamide (AM), 2-acrylamido-2-methyl propane sulfonic acid (AMPS), modified β-cyclodextrin (MAH-β-CD) and modified nano-SiO2. Subsequently, characterized its structure by utilizing of Fourier transform infrared spectroscopy (FT-IR), nuclear magnetic resonance spectroscopy (1H NMR), scanning electron microscopy (SEM) and thermal gravity analysis (TGA). A series of properties of AAMC-S1 solution including viscosification, temperature resistance, salt tolerance, shear resistance and viscoelasticity were evaluated. In addition, the displacement performance of AAMC-S1 as a potential polymer flooding was also studied.
2. Experimental
2.1 Material
Acrylamide (AM, 98%), maleic anhydride (MAH, 99%) and tetraethyl orthosilicate (Si(OC2H5)4, TEOS, 99.5%) were purchased from Tianjin Guangfu Fine Chemical Limited Co., Ltd. (China). 2-Acrylamido-2-methyl propane sulfonic acid (AMPS, 99%), β-cyclodextrin (β-CD, 98%), sodium chloride (NaCl, 98%), calcium chloride anhydrous (CaCl2, 96%), magnesium chloride anhydrous (MgCl2, 98%) and sodium hydroxide (NaOH, 96%) were provided by Aladdin Industrial Corporation (China). Ammonium persulfate ((NH4)S2O8, 98%), sodium hydrogen sulfite (NaHSO3, 98%) and N,N-dimethylformamide (DMF, 99.5%) were bought from the Beijing Beihua Fine Chemicals Co., Ltd. (China). Acetone (CH3COCH3, 99.5%), trichloromethane (CHCl3, 98%), cryloxypropyltrimethoxysilane (γ-MPS, 99.5%) and absolute ethanol (99.7%) were purchased from Tianjin Fuchen Chemical Limited Co., Ltd. (China). Crude oil was obtained from Shengli Oilfield (China). The viscosity of oil was 6.9 mPa s at 90 °C, and its density was 0.85 g cm−3. All aqueous solutions were prepared using deionized water.
2.2 Preparation and modification of SiO2 nanoparticles
SiO2 nanoparticles were prepared according to the StÖber method.36 The TEOS was added to the mixture of deionized water, ethanol, NH3·H2O solution, then the reaction mixture was gently stirred at 350 RPM at ambient temperature for 12 h. Finally, the powders were wash 3 times by anhydrous ethanol and dried under vacuum oven at 60 °C for 12 h.
The above-mentioned synthetic SiO2 nanoparticles were added into an ethanol–water mixture in 500 mL four-necked flask equipped with a condenser. Then MPS was dropped and a few drops of ammonia were added. A molar ration of SiO2 nanoparticles and MPS was 18![[thin space (1/6-em)]](https://www.rsc.org/images/entities/char_2009.gif) :
:![[thin space (1/6-em)]](https://www.rsc.org/images/entities/char_2009.gif) 1. After the reaction went on in a nitrogen atmosphere under stirring for 12 h at 50 °C, modified SiO2 nanoparticles were purified by anhydrous ethanol to remove the excess MPS. Subsequently, some of modified SiO2 nanoparticles were taken out for characterization of Fourier transform infrared spectra (FT-IR), transmission electron microscope (TEM) and dynamic light scattering spectrophotometer (DLS).
1. After the reaction went on in a nitrogen atmosphere under stirring for 12 h at 50 °C, modified SiO2 nanoparticles were purified by anhydrous ethanol to remove the excess MPS. Subsequently, some of modified SiO2 nanoparticles were taken out for characterization of Fourier transform infrared spectra (FT-IR), transmission electron microscope (TEM) and dynamic light scattering spectrophotometer (DLS).
2.3 Synthesis of MAH-β-CD
The synthesis of MAH-β-CD referred to the method mentioned in the literature.37 11.36 g of β-CD and 9.8 g of MAH were added in a three neck-flask and completely dissolved by the addition of 60 mL DMF, and then stirred for 10 h at 80 °C. After the reaction mixture was cooled to room temperature, then a large of chloroform was poured into the reactant. Obtained white precipitate was filtered and washed at least three times by plenty of acetone then dried in vacuum oven at 80 °C. The synthetic route was shown in Fig. 1a.
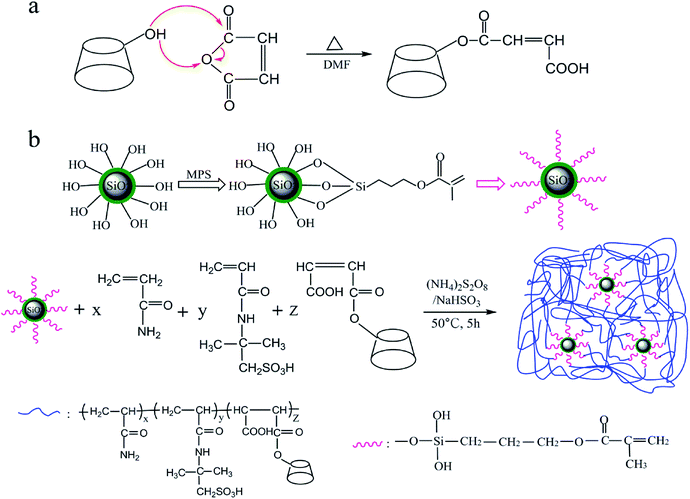 |
| | Fig. 1 Synthetic procedure to synthesize (a) MAH-β-CD and (b) nanocomposite AAMC-S1. | |
2.4 Synthesis of AAMC-S1 nanocomposite
Free radical copolymerization was adopted to synthesize AAMC-S1 nanocomposite. First, 29.625 g AM, 7.5 g AMPS, 0.375 g MAH-β-CD were dissolved in 112.5 g deionized water and were added into a 250 mL beaker with continuously stirring for 2 h. The pH value of reaction solution was control to 8–9 with NaOH. 0.375 g modified nano-SiO2 was poured into 5 mL ethanol and stirred until modified nano-SiO2 was completely dissolved. Then the two solutions were mixed and a certain amount of APS and NaHSO3 (molar ration 1![[thin space (1/6-em)]](https://www.rsc.org/images/entities/char_2009.gif) :
:![[thin space (1/6-em)]](https://www.rsc.org/images/entities/char_2009.gif) 1, 0.3 wt%) as the initiator were injected into the reaction solution with stirring under nitrogen atmosphere for 0.5 h. After the reaction for 5 h at 50 °C, a transparent polymeric colloid was obtained and washed with ethylalcohol several times. Finally, the colloid was cut into pieces and dried in the vacuum oven for 12 h at 60 °C. As a reference, the pure polymer AM/AMPS/MAH-β-CD (AAMC-S0) was also synthesized under the identical monomers feed and following the procedure mentioned above. The synthetic process was shown in Fig. 1b.
1, 0.3 wt%) as the initiator were injected into the reaction solution with stirring under nitrogen atmosphere for 0.5 h. After the reaction for 5 h at 50 °C, a transparent polymeric colloid was obtained and washed with ethylalcohol several times. Finally, the colloid was cut into pieces and dried in the vacuum oven for 12 h at 60 °C. As a reference, the pure polymer AM/AMPS/MAH-β-CD (AAMC-S0) was also synthesized under the identical monomers feed and following the procedure mentioned above. The synthetic process was shown in Fig. 1b.
2.5 Characterization
Fourier transform infrared (FT-IR) spectra of all samples were measured with KBr pellets on a FTS-3000 spectrophotometer (Digilab, America) from 4000 to 500 cm−1. The 1H NMR experiment was performed on a Bruker ASCEND-400 NMR spectrometer with D2O as solvent. The morphologies of solution samples were obtained by scanning electron microscope (SEM, SU800, Japan). The size and morphology of SiO2 nanoparticle were determined by transmission electron microscope (TEM, JEM-2100, Japan) at an accelerating voltage of 200 kV. Particle size distribution of the SiO2 nanoparticle was determined using a dynamic light scattering spectrophotometer (DLS, Qudix, Scatteroscope I system, Korea) at 25 °C. Thermal gravimetric analysis (TGA) in nitrogen atmosphere was conducted with a Diamond TG/DTA synchronal thermal analyzer (America). The samples were heated from 25 to 700 °C at a heating rate of 10 °C min−1 under a N2 flow rate of 140 cm3 m−1.
2.6 Measurement of the intrinsic viscosity
The intrinsic viscosity of the polymers was measured by Ubbelohde capillary viscometer at 25 ± 0.1 °C. All polymers were dissolved in 1.0 mol L−1 NaCl solution and the polymer solution was diluted by adding NaCl solution. All polymer solutions were repeatedly measured for three times, and the difference among each time was not more than 0.2 s. The viscosity-average molecular weight of the samples was caculated by employing Mark–Houwink equation;12,23| | |
[η] = 4.75 × 10⁻³Mη0.80
| (4) |
where t was the flow time for polymer solution (s), t0 was the flow time for 1.0 mol L−1 NaCl solution (s), C was the concentration of polymer solution (g mL−1), ηsp was the specific viscosity, ηr was the relative viscosity, [η] was the intrinsic viscosity (mg L−1), and Mη was the viscosity-average molecular weight (g mol−1).
2.7 Temperature-resistance evaluation
To evaluate temperature-resistance property, aqueous solutions were prepared by dissolving 0.25 g of AAMC-S0 and AAMC-S1 powder into 100 mL of deionized, respectively. The apparent viscosity in different temperature was measured and ranged from 20 to 90 °C by Brookfield DV-II + Pro viscometer (rotor speed = 20 rpm).
2.8 Salt-tolerance evaluation
First, appropriate amounts of NaCl, MgCl2 and CaCl2 were dissolved in 100 mL of deionized water to prepare a series of concentration salt solutions, respectively. Second, 0.25 g AAMC-S0 and AAMC-S1 powder were dissolved in the above prepared different concentration salt solutions, respectively. Finally, the apparent viscosity was measured by Brookfield DV-II + Pro viscometer at 25 °C (rotor speed = 20 rpm).
2.9 Shear-resistance evaluation
For estimation of shear resistance, the aqueous solutions of AAMC-S0 and AAMC-S1 were prepared with concentration of each solution equal to 2.5 g L−1. Then the rheological behaviours of those sample solutions were measured by HAAKE RS600 controlled rheometer (Germany) with continuous change shear rates from 1 to 1000 S−1 at 25 °C.
2.10 Displacement test
The sand pack tubes were used for displacement test, and the tubes of 30 cm in length and 2.5 cm in diameter were packed with 100–120 mesh sand. The composition of the brine used in the experiment was listed in Table 1. The flooding rate for both water flooding and polymer flooding was set as 1.0 mL min−1 and kept unchange. The resistance factor (RF) and residual resistance factor (RRF) was calculated with the following equation:| |
 | (5) |
| |
 | (6) |
Table 1 Composition of the brine
| Composition |
NaCl |
KCl |
CaCl2 |
MgCl2·5H2O |
Na2SO4 |
NaHCO3 |
Total |
| Concentration (mg L−1) |
2284 |
15 |
45 |
125 |
70 |
2204 |
4743 |
Where Kw and Kp were the aqueous and polymer phase permeability, respectively (mD); μw and μp were the aqueous and polymer viscosity, respectively (mD); Kwb and Kwa were the aqueous phase permeability before and after polymer flooding, respectively (mD).
2.11 Enhanced oil recovery (EOR) test
The process of polymer flooding in the artificial sandstone core at 45 °C was as follows. First, the porosity and permeability of the sandstone core were determined using an Automated Permeameter-Porodimeter (Coretest systems, Inc., U.S.A). And the basic parameters of sandstone core were given in Table 3. Second, the core was saturated with synthetic brine (the composition of brine was listed in Table 1) and then crude oil was injected into the core until no water went out at the outlet. Third, water flooding was conducted at a flow rate of 0.5 mL min−1 until the water cut reached 98%. Finally, 0.3 PV polymer slug was injected into the core after water flooding and then subsequent water flooding was conducted until water cut reached 98%.
Table 2 Resistance factor and residual resistance factor of samples
| Sample |
Permeability (μm) |
Concentration (mg L−1) |
Pressure of water flooding (MPa) |
Pressure of polymer flooding (MPa) |
Pressure of subsequent water flooding (MPa) |
RF |
RFF |
| AAMC-S0 |
643 |
1000 |
0.0048 |
0.085 |
0.0131 |
17.71 |
2.73 |
| AAMC-S1 |
652 |
1000 |
0.0052 |
0.116 |
0.029 |
22.31 |
5.58 |
Table 3 Core parameters and EOR of AAMC-S0 and AAMC-S1
| Core no. |
Length (cm) |
Diameter (cm) |
Porosity (%) |
Permeability (mD) |
Sample (1500 mg L−1) |
E1 (%) |
E2 (%) |
EOR (%) |
| 1# |
7.653 |
3.802 |
19.83 |
894 |
AAMC-S0 |
42.14 |
49.26 |
7.12 |
| 2# |
7.724 |
3.806 |
20.16 |
926 |
AAMC-S1 |
44.23 |
57.48 |
13.25 |
The oil recovery ratio E1 by water flooding was obtained from eqn (7); and the total oil recovery ratio E2 could be calculated by eqn (8). Finally, the oil recovery ratio by polymer flooding (EOR) was calculated by eqn (9).12
where
E1 was the total oil recovery by water flooding, %;
E2 was the total oil recovery, %;
V1 was the oil volume flooded by water flooding, mL;
V2 was the total oil volume fooded, mL;
V was the oil reserve in sand, mL.
3. Results and discussion
3.1 Characterization of unmodified and modified nano-SiO2
In the infrared spectroscopy spectrum (Fig. 2) of unmodified nano-SiO2, the characteristic bands at 1635 and 3444 cm−1 were representative of –OH group on the surface of SiO2. The typical bands at 1109 cm−1 was assigned to the formation of Si–O–Si. The bands at 472 and 790 cm−1 belonged to Si–O stretching vibration and bending vibration, respectively. Compared to unmodified nano-SiO2, modified nano-SiO2 showed the obvious difference was that 1709 cm−1 absorption peak corresponds to the C![[double bond, length as m-dash]](https://www.rsc.org/images/entities/char_e001.gif) O stretching vibration, and the absorption bands around 2834 and 2919 cm−1 attributed to the bending vibration of –CH2− in modified nano-SiO2, which confirmed that MPS was bonded to the silanol groups on the surface of silica.
O stretching vibration, and the absorption bands around 2834 and 2919 cm−1 attributed to the bending vibration of –CH2− in modified nano-SiO2, which confirmed that MPS was bonded to the silanol groups on the surface of silica.
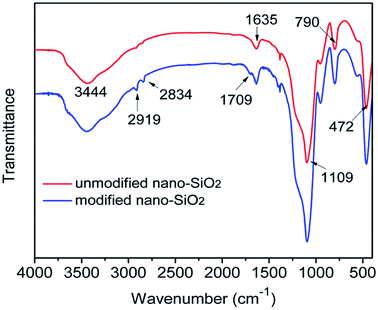 |
| | Fig. 2 FT-IR spectra of unmodified and modified nano-SiO2. | |
The TEM image of modified nano-SiO2 in Fig. 3a exhibited that the nanoparticles were modified via the MPS with a diameter of ∼50 nm. From the Fig. 3a, it was found that the agglomerate phenomenon was not observed and regular arrangement was much easier to obtain. The nanoparticle size distribution was measured using a dynamic light scattering spectrophotometer (DLS), which showed a distribution between 35 and 80 nm peaking at 50.75 nm. The size from DLS was usually reported to be bigger than that from TEM due to the surrounded water molecules and swelling effect of surface molecules. The SiO2 nanoparticles were modified by a silane coupling agent (MPS) to improve the interfacial adhesion between fillers and polymer matrix.
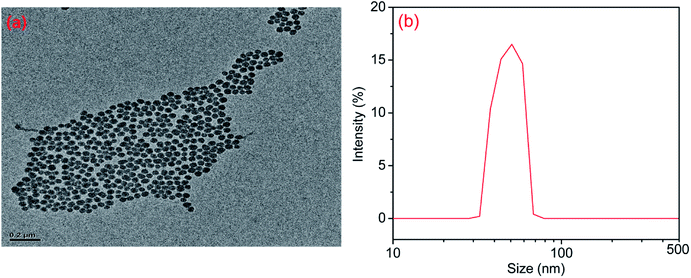 |
| | Fig. 3 (a) TEM image of modified Nano-SiO2. (b) Particle size distribution as from DLS. | |
3.2 Characterization of AAMC-S1 nanocomposite
FT-IR analysis. Fig. 4 showed the FT-IR spectra of MAH-β-CD and AAMC-S1. In the spectra of MAH-β-CD, the strong absorption peak at 3390 cm−1 was attributed to the stretching vibration of –OH. The bands at 2931, 1737 and 1163 cm−1 were representative of the stretching vibration peaks of –CH–, –COOH and C–O–C, respectively. The absorption peaks appearing at 1020 and 571 cm−1 were due to the stretching vibration of C–O in the -C-OH group and the skeleton vibration of β-CD, respectively. Besides, the 1641 and 1412 cm−1 absorption peaks corresponded to the stretching vibration of C![[double bond, length as m-dash]](https://www.rsc.org/images/entities/char_e001.gif) C. The above discussion indicated that the target intermediate product MAH-β-CD was obtained successfully. From the spectra of AAMC-S1, we could observe two strong absorption peaks at 3446 and 1661 cm−1, which were attributed to the stretching vibration of N–H and C
C. The above discussion indicated that the target intermediate product MAH-β-CD was obtained successfully. From the spectra of AAMC-S1, we could observe two strong absorption peaks at 3446 and 1661 cm−1, which were attributed to the stretching vibration of N–H and C![[double bond, length as m-dash]](https://www.rsc.org/images/entities/char_e001.gif) O in –CONH2 group. The peaks at 2928 cm−1 was ascribed to the stretching vibration of –CH–. The characteristic stretching vibration of β-CD ring at 1039 and 613 cm−1, which could be inferred that the structure of cyclodextrin had been successfully incorporated into AAMC-S1. The 1182 cm−1 absorption peaks corresponded to the stretching vibration of –S
O in –CONH2 group. The peaks at 2928 cm−1 was ascribed to the stretching vibration of –CH–. The characteristic stretching vibration of β-CD ring at 1039 and 613 cm−1, which could be inferred that the structure of cyclodextrin had been successfully incorporated into AAMC-S1. The 1182 cm−1 absorption peaks corresponded to the stretching vibration of –S![[double bond, length as m-dash]](https://www.rsc.org/images/entities/char_e001.gif) O in AMPS monomer. The typical peaks at 1115 and 781 cm−1 were attributed to the antisymmetric stretching vibration and symmetrical stretching vibration of Si–O–Si, respectively. These results indicated that the target AAMC-S1 nanocomposite was successfully synthesized.
O in AMPS monomer. The typical peaks at 1115 and 781 cm−1 were attributed to the antisymmetric stretching vibration and symmetrical stretching vibration of Si–O–Si, respectively. These results indicated that the target AAMC-S1 nanocomposite was successfully synthesized.
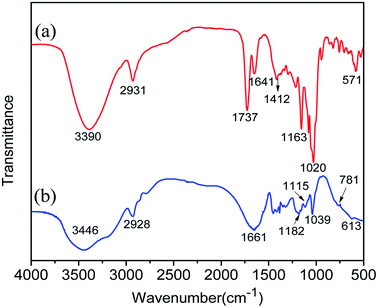 |
| | Fig. 4 FT-IR spectrum of (a) MAH-β-CD and (b) AAMC-S1 nanocomposite. | |
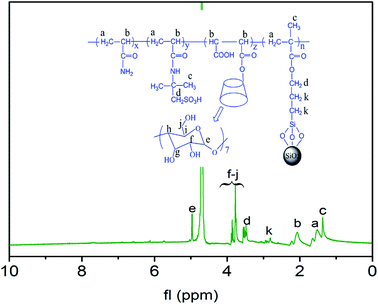
1H NMR analysis. 1H NMR was employed to further verify the successful synthesis of the AAMC-S1, so the 1H NMR spectrum of AAMC-S1 was shown in Fig. 5. The single peak at 4.99 ppm (e) and the multiple peak at 3.53–3.90 ppm (f–j) were attributed to the glucose unit protons of MAH-β-CD. The chemical shift value at 3.45–3.50 ppm (d) could be assigned to the proton of –CH2SO3H and modified nano-SiO2 (–CH2–(CH2)2–). The peaks located at chemical shift of 1.35 ppm (c) and 2.83 ppm (k) were due to –CH3 and modified nano-SiO2 (–CH2–(CH2)2–), respectively. The multiple peaks at 1.40–1.71 ppm (a) and 1.97–2.26 ppm (b) corresponded to –CH2– and –CH– of the polymeric chain, respectively. The 1H NMR and FT-IR analyses were in good agreement and could also be the proof of the successful synthesis of AAMC-S1.
 |
| | Fig. 5 H NMR spectrum of AAMC-S1 nanocomposite. | |
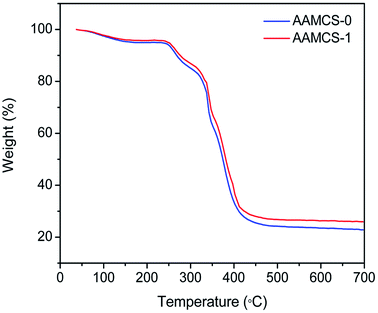
Thermal analysis. Thermal stability of both pure AAMCS-0 copolymer sample and AAMCS-1 nanocomposite sample was investigated by TGA and the thermogravimetric analysis plots were depicted in Fig. 6. It could be found that the weight of AAMCS-0 and AAMCS-1 started to took place in the range of 30–143 °C, which was resulted from the evaporation of intramolecular and intermolecular moisture. The mass of two samples remained stable from 143–251 °C while reduced abruptly in the range of 251–350 °C as a result of thermal decomposition of amide and β-CD group. The last weight loss occurred at 350–480 °C, which could be attributed to copolymer backbone degradation. Although two samples performed similar thermal degradation pattern under the same thermal condition, the weight loss of AAMC-1 was obviously lower than that of AAMC-0 and it's the most rapid decomposition temperature reached up to 348 °C, compared with the most rapid decomposition temperature of 337 °C for AAMC-0. This was due to two aspects: on the one hand, the SiO2 nanoparticle could appear as a excellent insulator and it could not be degradable at 600 or 700 °C,38 and on the other hand, the SiO2 nanoparticle acted as the role of catalytic in the polymer matrices.39,40
 |
| | Fig. 6 Thermal gravimetric cure of AAMCS-0 and AAMCS-1 nanocomposite. | |
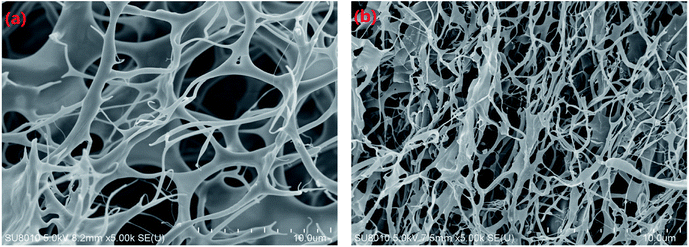
Morphologies. The morphologies of AAMC-S0 and AAMC-S1 nanocomposite were observed by SEM, which were shown in Fig. 7. The morphologies of two samples present the typical 3D network structure, including connected skeletons and many cavities. It was evident that the network structure of nanocomposite was much more compact in comparison to AAMC-S0 at the same scan size, which could be ascribed to the introduced nano-SiO2. On the one hand, it played a role of cross-linker in polymer matrix, forming a striplike structure, and on the other hand plenty of hydroxyls from β-cyclodextrin and surface of nano-SiO2 formed a large number of intramolecular and intermolecular hydrogen bonds, which further led to the formation of a thicker and stronger network structure. Such 3D network structure provided AAMC-S1 with robust under-mentioned comprehensive properties.
 |
| | Fig. 7 SEM morphologies of samples in deionized water: (a) AAMC-S0 and (b) AAMC-S1 nanocomposite (sample solution concentration, 2500 mg L−1). | |
3.3 Intrinsic viscosity and molecular weight
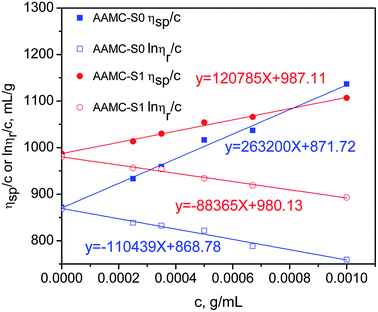
The relationship between ηsp/c(ln![[thin space (1/6-em)]](https://www.rsc.org/images/entities/char_2009.gif) ηr/c) and concentration of samples was show in Fig. 8. The intrinsic viscosity ([η]) was determined by plotting ηsp/c and ln
ηr/c) and concentration of samples was show in Fig. 8. The intrinsic viscosity ([η]) was determined by plotting ηsp/c and ln![[thin space (1/6-em)]](https://www.rsc.org/images/entities/char_2009.gif) ηr/c of sample solutions against concentration and extrapolating to infinite dilution and taking the intercept. If the intercept was not the same point, the average of the intercept was [η]. As shown in Fig. 8, [η] of AAMC-S0 and AAMC-S1 was determined as 870.25 and 983.62 mL g−1, respectively. According to the Mark–Houwink equation, the viscosity-average molecular weight of AAMC-S0 and AAMC-S1 were 3.79 × 10⁶ and 4.42 × 10⁶ g mol−1, respectively.
ηr/c of sample solutions against concentration and extrapolating to infinite dilution and taking the intercept. If the intercept was not the same point, the average of the intercept was [η]. As shown in Fig. 8, [η] of AAMC-S0 and AAMC-S1 was determined as 870.25 and 983.62 mL g−1, respectively. According to the Mark–Houwink equation, the viscosity-average molecular weight of AAMC-S0 and AAMC-S1 were 3.79 × 10⁶ and 4.42 × 10⁶ g mol−1, respectively.
 |
| | Fig. 8 Relationship between ηsp/c(ln![[thin space (1/6-em)]](https://www.rsc.org/images/entities/char_2009.gif) ηr/c) and concentration of samples. ηr/c) and concentration of samples. | |
3.4 Viscosification property of polymer solution
Viscosification is one of the most important properties for polymer solution used to increase the viscosity of displacement fluids.41 Different concentration aqueous solutions of samples were prepared with deionized water, and then the apparent viscosity of each polymer solution was measured at 25 °C. It could be seen from Fig. 9 that the viscosity of all polymer solutions increased as the polymer concentration increased. Compared with AAMC-S0 solution, AAMC-S1 solution had better thickening efficiency at the equivalent concentration. It could be interpreted that the rigid SiO2 nanoparticle reinforced the construction of three-dimensional network structure, leading to a high hydrodynamic volume.
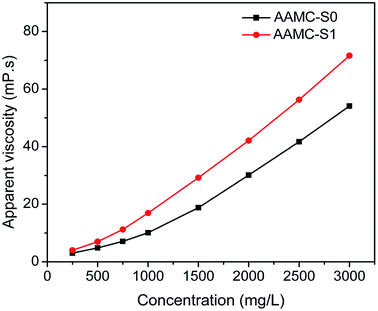 |
| | Fig. 9 Relationship between apparent viscosity and polymer concentrations (T = 25 °C). | |
3.5 Temperature-resistance of AAMC-S1 nanocomposite
It was well known that the temperature of the reservoir had a great effect on the performance of polymer solution, the high temperature would damage the polymer backbone, and the viscosity of the polymer solution would reduce.42 The effect of temperature on two samples had been investigated and results were recorded in Fig. 10. The result showed that the apparent viscosity of the sample solution was dependent on temperature and increasing the temperature result in a reduction in viscosity. However, it could be found that AAMC-S1 nanocomposite solution had higher viscosity and higher rate of viscosity retention than pure AAMC-S0 copolymer solution at the same temperature. It meant that the existence of SiO2 nanoparticle made network structure of AAMC-S1 stronger, which provided a steric hindrance for macromolecules that hindered the coiling of polymeric chains at the increased temperature.
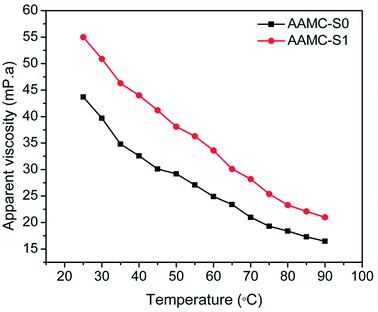 |
| | Fig. 10 The effect of temperature on apparent viscosity for pure AAMC-S0 and AAMC-S1 nanocomposites (concentration, 2500 mg L−1). | |
3.6 Salt-tolerance of AAMC-S1 nanocomposite
The viscosity under different NaCl, MgCl2, CaCl2 concentration for both AAMC-S0 and AAMC-S1 solutions was investigated as shown in Fig. 11. From the Fig. 11, it was found that the apparent viscosity of all samples decreased significantly while the concentration of salt was increased. This was because the electrolyte ions (Na+, Mg2+, Ca2+) shielded the effective charge, and then the electric double layer of polymers were compressed by salt ions, resulting in a reduction of hydrodynamic volume. The viscosity of AAMC-S0 solution decreased from 43 to 17.2 mPa in the NaCl concentration increasing procedure (from 0.0 to 5000.0 mg L−1) while the viscosity of AAMC-S1 nanocomposite solution decreased from 54 to 28.8 mPa. The viscosity retention of AAMC-S1 was higher in comparision with AAMC-S0, which demonstrated that AAMC-S1 possessed better salt resistance. The phenomenon was similarly observed in MgCl2 and CaCl2 solution with different concentrations, respectively. The illustration of polymers compressed by salt ions was presented in Fig. 12. As shown in Fig. 12, AAMC-S0 chains were stretched conformation in aqueous solution. When salt was dissolved in aqueous solution, the chains were compressed and the hydrodynamic volume of AAMC-S0 reduced sharply inducing a sharp decline of AAMC-S0 solution viscosity. For AAMC-S1 nanocomposite solution, although the chains were also compressed by salt ions, the hydrodynamic volume of AAMC-S1 decreased slightly than AAMC-S0. This might be due to that inorganic SiO2 nanoparticle provided stronger steric hindrance, rendering the polymer chains more stable, leading to the electric double layer was difficult to be compressed.
 |
| | Fig. 11 The effect of (a) NaCl solution, (b) MgCl2 and (c) CaCl2 solution on apparent viscosity for pure AAMC-S0 and AAMC-S1 nanocomposites (concentration, 2500 mg L−1; T = 25 °C). | |
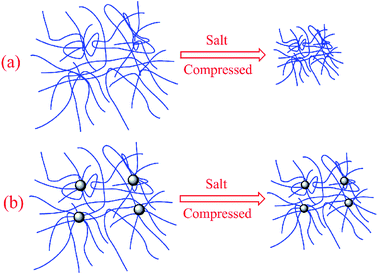 |
| | Fig. 12 Illustration of polymers compressed by salt ions. (a) AAMC-S0; (b) AAMC-S1 nanocomposite. | |
3.7 Shear-resistance of AAMC-S1 nanocomposite
Shear resistance was an important property for polymer solution applied in petroleum engineering. This was because that they would be subjected to a series of shearing action in the preparation, injection and seepage in porous medium.25 To investigate the shear resistance of sample solution, the effect of shear rate on apparent viscosity was plotted in Fig. 13. From the results, it was indicated that AAMC-S0 and AAMC-S1 presented a shear thinning behavior, i.e. the viscosity was gradually reduced with an increase of the shear rate. This might be due to shear action destroyed the interaction among molecules and broke down backbones of polymers. Obviously, at low shear rate (1–100 S−1), the apparent viscosity of AAMC-S1 nanocomposite was slightly reduced while the apparent viscosity was sharply reduced at high shear rate (100–1000 S−1). For pure AAMC-S0, the apparent viscosity was sharply reduced during the whole shearing. The phenomenon was attributed to the introduction of SiO2 nanoparticle made the AAMC-S1 had stronger network structure and abundant branch chains. At low shear rate, the shear action only destroyed part of the branch chain, which had no big effect on the whole structure. Therefore, compared with AAMC-S0, AAMC-S1 nanocomposite had higher viscosity and retention rate at the low shear rate. However, high shear destroyed the branch chain, even breaking down the backbones, resulting in a sharp decrease in viscosity. So, the anti-shearing properties still need to be improved further.
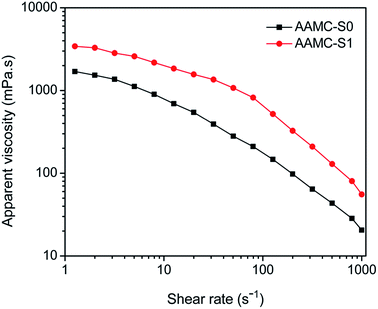 |
| | Fig. 13 The effect of shear rate on apparent viscosity for pure AAMC-S0 and AAMC-S1 nanocomposite (concentration, 2500 mg L−1; T = 25 °C). | |
3.8 Viscoelastic properties of AAMC-S1 nanocomposite solution
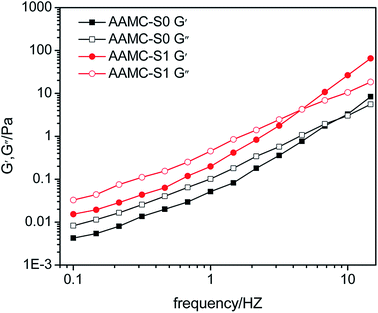
Viscoelastic properties of polymer solution played an important role in increasing oil recovery.43 Because the polymer had dragging effect on small oil blocks in the dead angles of formation under the of viscoelasticity. The variation of elastic modulus (G′) and viscous modulus (G′′) of pure AAMC-S0 and AAMC-S1 nanocomposite solutions as function of frequency was present in Fig. 14. It was found that with the increase of frequency both G′ and G′′ increase. And AAMC-S1 nanocomposite exhibited G′ and G′′ higher than that of pure AAMC-S0, indicating a better viscoelasticity could be given for the nanocomposite. As for AAMC-S1 and AAMC-S0, at a low frequency where the G′ was less than G′′, the viscous modulus played a dominating role. While at a frequency above the characteristic frequency at which curves G′ and G′′ cross each other (Gc), the elastic modulus played a dominating role for tow samples. The characteristic time tc corresponding to the Gc quantified disassociate lifetime, and tc could be obtained through the reciprocal of the frequency.30 It was clear that the tc of AAMC-S1 was longer than that of AAMC-S0, suggesting the nanocomposite structure made more contributions to elastic efficiency and relaxation time. Thus, AAMC-S1 had the superior viscoelastic properties than AAMC-S0.
 |
| | Fig. 14 Elastic modulus (G′) and viscous modulus (G′′) of pure AAMC-S0 and AAMC-S1 nanocomposite solutions as a function of frequency (concentration, 2500 mg L−1; T = 25 °C). | |
3.9 Displacement performance of AAMC-S1 nanocomposite
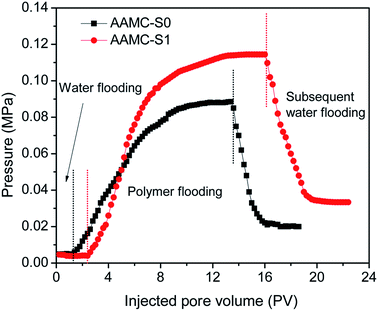
Based on the above research mainly focused on the viscosity for the nanocomposite samples. However, the displacement performance of nanocomposite solution in porous media was quit important for a potential flooding agent. The simulated salt water and sample solution (1000 mg L−1) went through sand-pack (approximate permeability of K = 650 × 10−3 μm), and the variation of pressure with injected pore volume was shown in Fig. 15. After the salt water flooding pressure reached an equilibrium and the water phase permeability was determined, the sample solution was injected. When the sample solution was injected, the injection pressure increased rapidly and then slowed down. We started the subsequent water flooding after the injection pressure reached an equilibrium again. At this stage, the injection pressure fell rapidly and finally became stable. The parameters of the injection pressure curves were shown in Table 2. The RF and RFF of AAMC-S1 nanocomposite solution were both higher than those of pure AAMC-S0 under the same conductions. However, the solution with higher RF and RFF could improve more sweep volume, penetrate or spread to the more rock porous region,44 which indicated that AAMC-S1 would more potential improve the oil recovery.
 |
| | Fig. 15 Flooding pressure plotted as a function of injected pore volume of the samples. | |
3.10 EOR ability of AAMC-S1 nanocomposite
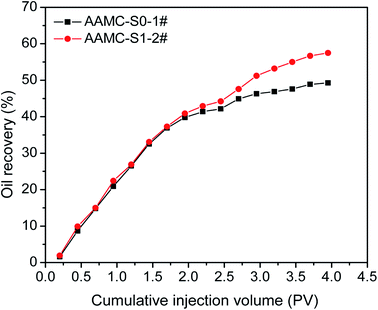
The capability of enhancing oil recovery for the AAMC-S0 and AAMC-S1 solutions was investigated in sandstone core, illustrated in Table 3. As the permeability was 900 mD approximately, following a water cut to 98% for water flooding, 0.3 PV polymer flooding and subsequent water flooding could further increase the (AAMC-S1) oil recovery to 13.25%, in comparision with the 7.12% oil recovery of AAMC-S0 (Fig. 16). The main reason to get a relatively high oil recovery could be attributed to its favourable shear resistance, rheology and displacement performance, which was caused by introduction of SiO2 nanoparticle.
 |
| | Fig. 16 EOR ability for AAMC-S0 and AAMC-S1. | |
4. Conclusion
A novel nanocomposite AAMC-S1 consisting of nano-SiO2 was synthesized through free water radical polymerization, and AAMC-S1 was characterized via FT-IR, 1H NMR, SEM and TGA analysis. By comparing with pure AAMC-S0, it was found that introduction of nano-SiO2 made AAMC-S1 to possess better properties on aspects of thickening ability, temperature resistance, salt tolerance and shear resistance. Dynamic rheology studies showed that nanocomposite structure endowed the AAMC-S1 with excellent elasticity. In addition, displacement test demonstrated that the AAMC-S1 were more effective at improving sweep efficiency by establishing higher RF and RFF in the porous medium. Moreover, the enhanced oil recovery test directly demonstrate that AAMC-S1 could remarkably enhance 13.25% of the oil recovery. These results showed a promising prospect for nanocomposite AAMC-S1 great potential to enhance oil recovery.
Conflicts of interest
There are no conflicts to declare.
Acknowledgements
This work was financially supported by the National Natural Science Foundation of China (Grant No. 51674270), Major project of the National Natural Science Foundation of China (No. 51490650), National Major project and the Foundation for Innovative Research Groups of the National Natural Science Foundation of China (Grant No. 2017ZX05009-003 and Grant No. 51521063).
References
- J. Cao, T. Song, Y. Zhu, S. Wang, X. Wang, F. Lv, L. Jiang and M. Sun, Energy Fuels, 2018, 32, 246–254 CrossRef.
- M. A. Sohal, G. Thyne and E. G. Søgaard, Energy Fuels, 2016, 30, 1904–1914 CrossRef.
- M. S. Sharafi, M. Jamialahmadi and S.-A. Hoseinpour, J. Mol. Liq., 2018, 250, 295–306 CrossRef.
- H. Park, J. Han and W. Sung, Energy, 2015, 84, 666–671 CrossRef.
- B. Sarsenbekuly, W. Kang, H. Fan, H. Yang, C. Dai, B. Zhao and S. B. Aidarova, Colloids Surf., A, 2017, 514, 91–97 CrossRef.
- Y. He, Z. Xu, F. Wu and Z. Luo, Colloid Polym. Sci., 2014, 7, 1725–1733 CrossRef.
- S. Deng, R. Bai and J. Chen, Sep. Purif. Technol., 2002, 29, 207–216 CrossRef.
- A. Samanta, A. Bera, K. Ojha and A. Mandal, J. Chem. Eng. Data, 2010, 55, 4315–4322 CrossRef.
- R. S. Seright, A. Campbell, P. Mozley and P. Han, SPE J., 2010, 15, 341–348 CrossRef.
- C. Dai, Z. Xu, Y. Wu, C. Zou, X. Wu, T. Wang, X. Guo and M. Zhao, Polymers, 2017, 9, 296 CrossRef.
- R. Yuan, Y. Li, C. Li, H. Fang and W. Wang, Colloids Surf., A, 2013, 434, 16–24 CrossRef.
- C. Zou, P. Zhao, X. Hu, X. Yan, Y. Zhang, X. Wang, R. Song and P. Luo, Energy Fuels, 2013, 27, 2827–2834 CrossRef.
- S. Dastan, S. Hassnajili and E. Abdollahi, J. Polym. Res., 2016, 23, 1–18 CrossRef.
- X. Li, Z. Shu, P. Luo and Z. Ye, J. Chem., 2018, 1, 1–9 Search PubMed.
- R. S. Kumar and T. Sharma, Colloids Surf., A, 2018, 539, 171–183 CrossRef.
- N. Kang and D. Wang, J. Mater. Chem. A, 2013, 1, 11376–11383 RSC.
- P. Singh, X. Ren, T. Guo, L. Wu, S. Shakya, Y. He, C. Wang, A. Maharjan, V. Singh and J. Zhang, Carbohydr. Polym., 2018, 190, 23–30 CrossRef PubMed.
- X. Liu, W. Jiang, S. Gou, Z. Ye and C. Luo, J. Appl. Polym. Sci., 2013, 128, 3398–3404 CrossRef.
- Y. Lu, W. Kang, J. Jiang, J. Chen, D. Xu, P. Zhang, L. Zhang, H. Feng and H. Wu, RSC Adv., 2017, 7, 8156 RSC.
- J. Wang, Z. Qiu, Y. Wang, L. Li, X. Guo, D. T. Pham, S. F. Lincoln and R. K. Prud'Homme, Beilstein J. Org. Chem., 2016, 12, 50–72 CrossRef PubMed.
- S. K. S. Al-Burtomani and F. O. Suliman, New J. Chem., 2018, 42, 5785 RSC.
- X. Li, C. Zou and C. Cui, Starch–Stärke, 2015, 67, 673–682 CrossRef.
- X. Hu, Y. Ke, Y. Zhao, S. Lu, C. Yu and F. Peng, Colloids Surf., A, 2018, 548, 10–18 CrossRef.
- N. Yoshio, H. Takafumi, K. Haruna and K. Keiichi, Chem. Lett., 2011, 40, 348–350 CrossRef.
- Y. An, G. Jiang, Y. Qi, Q. Ge and L. Zhang, RSC Adv., 2016, 6, 17246–17255 RSC.
- H. ShamsiJazeyi, C. A. Miller, M. S. Wong, J. M. Tour and R. Verduzco, J. Appl. Polym. Sci., 2014, 131, 1–13 CrossRef.
- X. Xia, J. Guo, Y. Feng, D. Chen, Y. Yu, J. Jin and S. Liu, RSC Adv., 2016, 6, 91728–91740 RSC.
- D. Zhu, L. Wei, B. Wang and Y. Feng, Energies, 2014, 7, 3858–3871 CrossRef.
- N. K. Maurya and A. Mandal, Pet. Sci. Technol., 2016, 34, 429–436 CrossRef.
- W. Pu, R. Liu, K. Wang, K. Li, Z. Yan, B. Li and L. Zhao, Ind. Eng. Chem. Res., 2015, 54, 798–807 CrossRef.
- L. J. Giraldo, M. A. Giraldo, S. Llanos, G. Maya, R. D. Zabala, N. N. Nassar, C. A. Franco, V. Alvarado and F. B. Cortes, J. Pet. Sci. Eng., 2017, 159, 841–852 CrossRef.
- Y. Zhao, X. Qi, Y. Dong, J. Ma, Q. Zhang, L. Song, Y. Yang and Q. Yang, Tribol. Int., 2016, 103, 599–608 CrossRef.
- B. Pan, F. Gao and H. Gu, J. Colloid Interface Sci., 2005, 284, 1–6 CrossRef PubMed.
- S. K. Mehdi, H. A. Vahid, R. R. Said, B. S. Farid, N. Mohammad and R. M. Hossein, J. Polym. Res., 2012, 19, 9793 CrossRef.
- K. Zhang, H. Chen, X. Chen, Z. Chen, Z. Cui and B. Yang, Macromol. Mater. Eng., 2003, 288, 380–385 CrossRef.
- W. Stoeber, A. Fink and E. Bohn, J. Colloid Interface Sci., 1968, 26, 62–69 CrossRef.
- Y. Wang, N. Yang, D. Wang, Y. He, L. Chen and Y. Zhao, Polym. Degrad. Stab., 2018, 147, 123–131 CrossRef.
- P. Russo, A. Costantini, G. Luciani, F. Tescione, M. Lavorgna, F. Branda and B. Silvestri, J. Appl. Polym. Sci., 2018, 135, 46006 CrossRef.
- D. Wang, A. Das, A. Leuteritz, R. Boldt, L. Häußler, U. Wagenknecht and G. Heinrich, Polym. Degrad. Stab., 2011, 96, 285–290 CrossRef.
- M. L. Saladinoa, T. E. Motaung, A. S. Luyt, A. Spinella, G. Nasillo and E. Caponettiac, Polym. Degrad. Stab., 2012, 97, 452–459 CrossRef.
- K. C. Taylor and H. A. Nasr-El-Din, J. Pet. Sci. Eng., 1998, 19, 265–280 CrossRef.
- T. Zhao, J. Xing, Z. Dong, Y. Tang and W. Pu, Ind. Eng. Chem. Res., 2015, 54, 10568–10574 CrossRef.
- L. J. Zhang and X. A. Yue, J. Hydrodyn. Ser. B., 2007, 19, 241–248 CrossRef.
- Y. Ke, G. Wei and Yi. Wang, Eur. Polym. J., 2008, 44, 2448–2457 CrossRef.
|
| This journal is © The Royal Society of Chemistry 2018 |
Click here to see how this site uses Cookies. View our privacy policy here.  Open Access Article
 *,
Yi Zhao,
Chengcheng Yu,
Shichao Lu and
Fangfang Peng
![[thin space (1/6-em)]](https://www.rsc.org/images/entities/char_2009.gif) :
:![[thin space (1/6-em)]](https://www.rsc.org/images/entities/char_2009.gif) 1. After the reaction went on in a nitrogen atmosphere under stirring for 12 h at 50 °C, modified SiO2 nanoparticles were purified by anhydrous ethanol to remove the excess MPS. Subsequently, some of modified SiO2 nanoparticles were taken out for characterization of Fourier transform infrared spectra (FT-IR), transmission electron microscope (TEM) and dynamic light scattering spectrophotometer (DLS).
1. After the reaction went on in a nitrogen atmosphere under stirring for 12 h at 50 °C, modified SiO2 nanoparticles were purified by anhydrous ethanol to remove the excess MPS. Subsequently, some of modified SiO2 nanoparticles were taken out for characterization of Fourier transform infrared spectra (FT-IR), transmission electron microscope (TEM) and dynamic light scattering spectrophotometer (DLS).![[thin space (1/6-em)]](https://www.rsc.org/images/entities/char_2009.gif) :
:![[thin space (1/6-em)]](https://www.rsc.org/images/entities/char_2009.gif) 1, 0.3 wt%) as the initiator were injected into the reaction solution with stirring under nitrogen atmosphere for 0.5 h. After the reaction for 5 h at 50 °C, a transparent polymeric colloid was obtained and washed with ethylalcohol several times. Finally, the colloid was cut into pieces and dried in the vacuum oven for 12 h at 60 °C. As a reference, the pure polymer AM/AMPS/MAH-β-CD (AAMC-S0) was also synthesized under the identical monomers feed and following the procedure mentioned above. The synthetic process was shown in Fig. 1b.
1, 0.3 wt%) as the initiator were injected into the reaction solution with stirring under nitrogen atmosphere for 0.5 h. After the reaction for 5 h at 50 °C, a transparent polymeric colloid was obtained and washed with ethylalcohol several times. Finally, the colloid was cut into pieces and dried in the vacuum oven for 12 h at 60 °C. As a reference, the pure polymer AM/AMPS/MAH-β-CD (AAMC-S0) was also synthesized under the identical monomers feed and following the procedure mentioned above. The synthetic process was shown in Fig. 1b.


![[double bond, length as m-dash]](https://www.rsc.org/images/entities/char_e001.gif) O stretching vibration, and the absorption bands around 2834 and 2919 cm−1 attributed to the bending vibration of –CH2− in modified nano-SiO2, which confirmed that MPS was bonded to the silanol groups on the surface of silica.
O stretching vibration, and the absorption bands around 2834 and 2919 cm−1 attributed to the bending vibration of –CH2− in modified nano-SiO2, which confirmed that MPS was bonded to the silanol groups on the surface of silica.
![[double bond, length as m-dash]](https://www.rsc.org/images/entities/char_e001.gif) C. The above discussion indicated that the target intermediate product MAH-β-CD was obtained successfully. From the spectra of AAMC-S1, we could observe two strong absorption peaks at 3446 and 1661 cm−1, which were attributed to the stretching vibration of N–H and C
C. The above discussion indicated that the target intermediate product MAH-β-CD was obtained successfully. From the spectra of AAMC-S1, we could observe two strong absorption peaks at 3446 and 1661 cm−1, which were attributed to the stretching vibration of N–H and C![[double bond, length as m-dash]](https://www.rsc.org/images/entities/char_e001.gif) O in –CONH2 group. The peaks at 2928 cm−1 was ascribed to the stretching vibration of –CH–. The characteristic stretching vibration of β-CD ring at 1039 and 613 cm−1, which could be inferred that the structure of cyclodextrin had been successfully incorporated into AAMC-S1. The 1182 cm−1 absorption peaks corresponded to the stretching vibration of –S
O in –CONH2 group. The peaks at 2928 cm−1 was ascribed to the stretching vibration of –CH–. The characteristic stretching vibration of β-CD ring at 1039 and 613 cm−1, which could be inferred that the structure of cyclodextrin had been successfully incorporated into AAMC-S1. The 1182 cm−1 absorption peaks corresponded to the stretching vibration of –S![[double bond, length as m-dash]](https://www.rsc.org/images/entities/char_e001.gif) O in AMPS monomer. The typical peaks at 1115 and 781 cm−1 were attributed to the antisymmetric stretching vibration and symmetrical stretching vibration of Si–O–Si, respectively. These results indicated that the target AAMC-S1 nanocomposite was successfully synthesized.
O in AMPS monomer. The typical peaks at 1115 and 781 cm−1 were attributed to the antisymmetric stretching vibration and symmetrical stretching vibration of Si–O–Si, respectively. These results indicated that the target AAMC-S1 nanocomposite was successfully synthesized.
![[thin space (1/6-em)]](https://www.rsc.org/images/entities/char_2009.gif) ηr/c) and concentration of samples was show in Fig. 8. The intrinsic viscosity ([η]) was determined by plotting ηsp/c and ln
ηr/c) and concentration of samples was show in Fig. 8. The intrinsic viscosity ([η]) was determined by plotting ηsp/c and ln![[thin space (1/6-em)]](https://www.rsc.org/images/entities/char_2009.gif) ηr/c of sample solutions against concentration and extrapolating to infinite dilution and taking the intercept. If the intercept was not the same point, the average of the intercept was [η]. As shown in Fig. 8, [η] of AAMC-S0 and AAMC-S1 was determined as 870.25 and 983.62 mL g−1, respectively. According to the Mark–Houwink equation, the viscosity-average molecular weight of AAMC-S0 and AAMC-S1 were 3.79 × 10⁶ and 4.42 × 10⁶ g mol−1, respectively.
ηr/c of sample solutions against concentration and extrapolating to infinite dilution and taking the intercept. If the intercept was not the same point, the average of the intercept was [η]. As shown in Fig. 8, [η] of AAMC-S0 and AAMC-S1 was determined as 870.25 and 983.62 mL g−1, respectively. According to the Mark–Houwink equation, the viscosity-average molecular weight of AAMC-S0 and AAMC-S1 were 3.79 × 10⁶ and 4.42 × 10⁶ g mol−1, respectively.


