 Open Access Article
Green and facile approach to prepare polypropylene/in situ reduced graphene oxide nanocomposites with excellent electromagnetic interference shielding properties†
Gejo Georgea,
Sanu Mathew Simona,
Prakashan V. P.a,
Sajna M. S.a,
Muhammad Faisalb,
Runcy Wilsonc,
Anoop Chandrand,
Biju P. R.a,
Cyriac Joseph a and
N. V. Unnikrishnan
 *a
*a
aSchool of Pure & Applied Physics, Mahatma Gandhi University, Kottayam, Kerala, India – 686 560. E-mail: nvu100@yahoo.com
bResearch Center – Physics, Department of Physics, PES University – South Campus, Bangalore, Karnataka, India – 560 100
cDepartment of Chemistry, St. Cyrils College, Adoor, Kerala, India – 691 529
dDepartment of Physics, St. Cyrils College, Adoor, Kerala, India – 691 529
First published on 28th August 2018
Abstract
The present work discloses the admirable electromagnetic interference shielding effectiveness (∼50 dB at X and Ku Bands) realized by means of excellent dispersion state of reduced graphene oxide (rGO) in a polypropylene (PP) matrix, even at high concentrations (20 wt%). This was achieved by means of a latex method (polymer matrix; here PP in the aqueous emulsion state) combined with in situ reduction of graphene oxide using L-ascorbic acid as the reducing agent (green approach). A probable reaction mechanism between the maleic acid anhydride part of the PP matrix with the remaining –OH groups of rGO which may further assist in the better dispersion of graphene is also suggested. The prepared PP/rGO nanocomposites showed a percolation threshold in between that of 1.5 and 3 wt% rGO content. The microcapacitor and the conductive pathway formation in the system are explained nicely with the help of a schematic diagram. The electromagnetic interference shielding effectiveness (EMI SE) of 50 and 48 dB achieved for the X and Ku-bands for the 20 wt% rGO filled sample is one of the best among current works based on GO as the filler. The thermal stability of the samples increased marginally due to the addition of thermally stable rGO. The crystallization temperature increased with increasing rGO content owing to its good nucleating ability, whereas the melting characteristics shifted from double to single melting behavior possibly due to the ability of rGO to explicitly nucleate a particular polymorph of PP. A simple, cost efficient, green and promising approach to prepare non-polar polymer/graphene nanocomposites with a good dispersion state of graphene and excellent properties is reported in the present work.
1. Introduction
Shielding of electromagnetic (EM) waves in the microwave frequency region has become an important necessity for the proper functioning of electronic devices.1–5 Previously there has been extensive use of metal based composites for potential EMI shielding applications due to their very high conductivity and hence capability to reflect the incident EM waves. However, their properties such as high weight, low rigidity, high environmental sensitivity etc. have limited their use.1,6 The current trend is the use of polymer based composites for EMI shielding applications owing to advantageous characteristics such as better compatibility, good flexibility, light weight nature, low cost etc1,7.The distinctive properties of carbon based nanofillers (carbon nanotubes (CNTs), carbon nanofibers (CNFs), graphene oxide (GO) etc.) such as excellent conductivity and huge aspect ratio have helped scientists/researchers universally to manufacture nanocomposites with enhanced electrical conductivity and low percolation thresholds.5,8–10 Researchers have reported that if a nanocomposite has a resistivity below 10 Ω sq−1 it can be used as efficient electromagnetic interference (EMI) shields.5,11
Researchers have stated that such resistivity values (high conductivity) can be achieved by the formation of interconnected conductive networks by the incorporation of nanofillers far beyond the electrical percolation threshold of the material.12–15 It has been reported that even in the case of one atom thick graphene which is supposed to be highly conductive, a very high graphene content is required to make a polymer nanocomposite be conducting in nature.12 Liang et al. in 2009 reported an electromagnetic interference shielding efficiency (EMI SE) of ∼21 dB for graphene/epoxy composites.16 An EMI SE of 20 dB was achieved by Ling et al. even after decreasing the graphene content to 10 wt% for the polyetherimide graphene system.12,17 Yan et al. however, incorporated a very high loading (30 wt%) of graphene into a polystyrene matrix and reported EMI SE values of 29.3 dB.12,18 Researchers have reported several graphene based composite systems involving matrices like polymethyl methacrylate,19 water borne polyurethane,20 phenolic21 etc. for potential EMI shielding applications. However, the general consensus is that for a composite material to show reasonable EMI SE (greater than or equal to 20 dB) properties copious amounts of nanofillers are to be added to the matrix.12 The incorporation of high nanofillers (graphene, CNT etc.) however, may lead to very high cost of production and processing difficulties.12 The significance of conductivity and percolation threshold on the EMI shielding ability of a given material is still not well understood.22
Polypropylene is one of the most common thermoplastics which has been reinforced with different types of fibres and fillers over the past decades to yield composites with superior properties.23 Researchers have recently showed the potential of graphene based PP nanocomposites as an appealing material for a number of practical applications owing to the enhanced mechanical, electrical, thermal and barrier properties due to the addition of graphene filler.23–31 Fabrication of materials with good strength and EMI shielding properties can be realized by the addition of graphene into PP matrix.32,33 However, careful analysis of the literature reveals that studies pertaining to the dielectric properties of PP/graphene system is very scarce.27
One of the major challenges in the preparation of PP/rGO or GO composites is to achieve a homogenous and uniformly dispersed graphene oxide in the PP matrix which is rather difficult owing to the weak interactions between these two.23 Melt mixing technique is one of the most common methods for the preparation of such materials and has been utilized by several researchers for the preparation of PP/graphene composites.23,24,28,29,31 Melt mixing process has however, several disadvantages such as poor dispersion of graphene in the PP matrix at very high loadings, risk of degradation of the polymer chains during the process etc. In order to overcome these shortcomings researchers have utilized the solution mixing process to fabricate PP/graphene composites.26,34 However, solution mixing process has a major drawback in the form of using toxic solvents (xylene, in the case of PP matrix) which is harmful to both the user and environment and also limits the use of this technology to a very small scale.23 In recent times several researchers have utilized a simple and environment friendly latex technology to produce polymeric nanocomposites based on carbon nanotubes and graphene.23,31,35 It has been claimed by these researchers that the mixing of carbon nanotube/graphene dispersion in water with a polymer emulsion will lead to composites with excellent filler distribution and dispersion.23,31,35 Hsiao et al.36 reported nanocomposites based on graphene nanosheets with high electrical conductivity and EMI shielding performance fabricated using a waterborne polyurethane as the matrix. Similarly Song et al.31 reported the preparation of graphene/PP masterbatch using PP latex technology and later mixed this masterbatch with a PP matrix to improve its mechanical and thermal stability. More recently, Wang et al.23 manufactured PP latex/in situ reduced graphene oxide composites and studied their dielectric properties. However, in most of the works where GO was reduced in situ, hydrazine hydrate was used as the reducing agent which is highly toxic and flammable in nature thereby presenting danger to both the user and the environment.31,37,38 Vitamin C or L-ascorbic acid is non toxic in nature and is naturally used as a reducing agent in living beings39–42 and also as a mild reductant in the laboratories.39,43–46 Researchers like Zhang et al.39 and Andrijanto et al.47 have already reported the use of L-ascorbic acid as a reducing agent to reduce graphene oxide to rGO at room temperature and 70 °C respectively. Zhang et al.39 reported that the use of L-ascorbic acid to reduce GO has the added benefit of L-ascorbic acid acting out as a capping agent to reduce the agglomeration tendency of reduced GO. Merino et al.48 had reported that among the various reducing agents available only ascorbic acid can compete with the conventional but toxic hydrazine hydrate in terms of reducing ability to reduce GO to rGO.
In this article, the major objective is to in situ reduce GO via a facile, cost efficient and green approach involving L-ascorbic acid as the reducing agent with in PP latex matrix (aqueous emulsion of PP); thus facilitating the efficient dispersion of rGO in PP matrix even at high concentration which is rather difficult in normal methods leading to PP/in situ reduced graphene oxide nanocomposites with excellent EMI shielding and conductivity. A careful study was done on the effect of rGO content on the EMI shielding and dielectric properties of these composites. Furthermore, this study also explored the effect of rGO content on the thermal properties of the composite specimens.
2. Experimental
2.1 Materials
An aqueous non-ionically modified polypropylene (PP) emulsion (Trade name: AQUACER 1868) stabilized by several SDS (sodium dodecyl sulfate) like anionic surfactants and possessing a maleic acid anhydride grafted PP content of 40 wt%, ∼40 mPa s viscosity and a pH level of 9 was used as the polymer matrix during this study and was supplied by BYK Additives & Instruments. Graphene oxide was procured from United Nanotech Innovations Pvt. Ltd, Bangalore, India with a purity of >98%, average sheet thickness of around 0.8–2 nm and average number of layers ranging from 3–10. L-Ascorbic acid was delivered by Sigma Aldrich (A92902). All the dispersions were prepared using distilled water.2.2 Preparation of in situ reduced graphene oxide incorporated polypropylene composites
Graphene oxide was dispersed in water with a weight concentration of 30 wt% using magnetic stirrer (speed 500 rpm and time 10 minutes) at room temperature. In order to attain uniformly mixed PP/GO dispersion the above mentioned GO dispersed in water was mixed with PP latex thoroughly using a magnetic stirrer (speed 1000 rpm for 10 minutes) at room temperature. To this mixture L-ascorbic acid dissolved in water was added and stirred for 24 h at room temperature. In a typical experimental setup to reduce (in situ) GO within the PP latex emulsion, a 2 : 1 concentration of L-ascorbic acid was taken with respect to the GO concentration. The mixture was then stirred for 24 h at room temperature. The rGO concentration was varied from 0–20 wt% (0–12 vol%) (0–0.12 Vf). A control reduction experiment was performed to demonstrate the reduction capability of L-ascorbic acid. In this experiment all the chemicals except PP latex was taken as mentioned above and reduction process was performed for 24 h under the same conditions. The rGO sheets precipitated out from the dispersion as the reduction process continued and finally after 24 h the black solids were collected after centrifuging, dried and later analyzed using FT-IR, UV-Vis, XPS, Raman, FE-SEM and TEM analysis.The PP/rGO dispersion was then poured into a Petri dish and kept in an air oven at 70 °C for 6 h to remove the water and other volatiles. The dried PP/rGO granules were then washed several times using distilled water to remove the ascorbic acid present in the system. The wet PP/rGO grains on a Petri dish were then kept in an air oven at 70 °C for 24 h to remove the water. To further enhance the uniform dispersion of rGO in the PP matrix and to wipe out any remaining moisture presence, the dried and moisture free PP/rGO grains were passed through an internal mixer (operating at 210 °C and 50 rpm speed for 5 minutes). Compression moulding at 210 °C, 10 MPa pressure and 15 min holding time was then utilized to prepare PP/rGO nanocomposites (2 mm thick) from the obtained PP/rGO lumps. The preparation scheme for the PP/in situ reduced rGO nanocomposite is shown in Fig. 1.
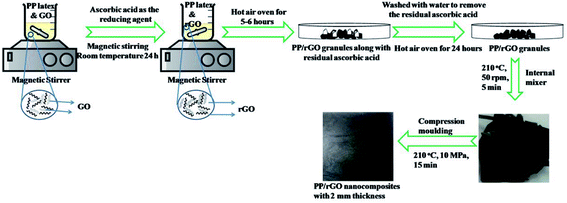 | ||
| Fig. 1 Schematic representation of the processing stages in the preparation of in situ reduced graphene oxide/PP nanocomposites. Part of the image was drawn using https://www.chemix.org/. | ||
2.3 Characterization of reduced graphene oxide and PP/rGO composites
Perkin Elmer Spectrum 400 FTIR spectrometer was used to record the Fourier Transform Infra Red Spectra (FT-IR) of the samples from 400 to 4000 cm−1. An Agilent Technologies Cary Series UV-Vis-NIR Spectrophotometer was used to record the absorption spectra of the samples. Field Emission Scanning Electron Microscopy (FE-SEM) and Transmission Electron Microscopy (TEM) analysis was used to characterize the reduced graphene oxide and its corresponding composites. A Nova NanoSEM 450 operating at 10–20 kV was used for the FE-SEM analysis of the samples. For FE-SEM analysis, rGO was taken as such, however in order to understand the interfacial adhesion between the matrix (PP) and reinforcement (rGO), a tiny piece of the composite specimen was dipped in liquid nitrogen and then fractured and used for FE-SEM analysis. A JEOL JEM-2010 at 200 kV was used to perform the TEM analysis of the samples. The rGO sample was dispersed in water, casted on a standard TEM grid and later dried for the TEM analysis. The composite sample on the other hand, was cryomicrotomed to cut the sample and cast on a TEM grid. Hioki 3532-50 LCR Hitester was used to study the dielectric properties (dielectric constant, ac conductivity etc.) of the samples (10 mm diameter and 2 mm thickness, coated with silver paste) with two probe method from 50 Hz to 5 MHz. The EMI SE values of rGO/PP nanocomposites (2 mm thick) in the X and Ku band regions of the microwave frequency was carried out using a Vector Network Analyser (Agilent Model PNA E8362B) employing the wave guide transmission technique. The EMI SE values by means of absorption, reflection and total shielding can be estimated using the scattering parameters. A TGA Perkin Elmer TGA 4000 was used to perform the thermogravimetric analysis of the samples in nitrogen atmosphere over a temperature range of 0–800 °C (heating rate 5 °C min−1). DSC Netzsch DSC204F1 equipment was used to study the crystallization and melting behavior of the composites using Differential Scanning Calorimetry (temperature range: −30 to 250 °C and heating rate 10 °C min−1). Raman spectra of the samples were recorded using a Horiba Jobin Yvon LABRAM-HR 800 spectrograph employing a 632 nm Helium neon laser. X-ray photoelectron spectroscopy (XPS) of the samples was measured using a Thermo Fisher Scientific ESCALAB X-ray Photoelectron Spectrometer employing a twin-crystal; micro-focused monochromator with a 500 mm Rowland circle. X-ray diffraction (XRD) studies were done using a PANalytical X'Pert PRO X-ray diffractometer from 2θ values ranging from 05–60°.3. Results and discussion
3.1 FT-IR, UV-visible, XPS, Raman spectroscopic and XRD analysis
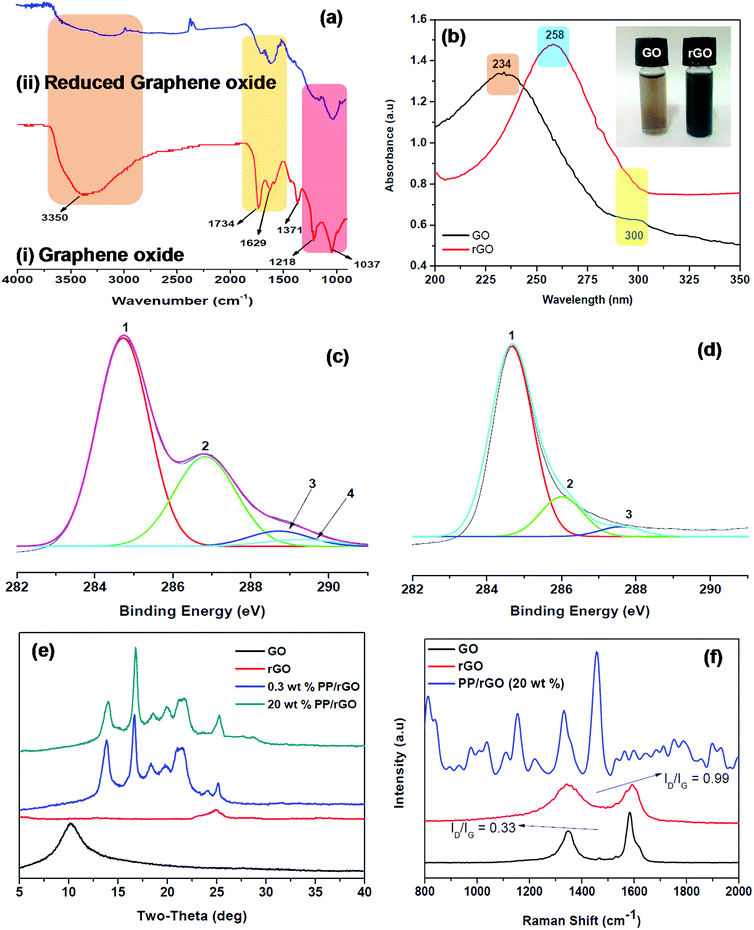
The FT-IR spectrum of graphene oxide and reduced graphene oxide (ascorbic acid as the reducing agent) is shown as Fig. 2a. The spectrum of GO (Fig. 2ai) clearly shows all the characteristic peaks of graphene oxide viz. the C–O stretching at 1037 cm−1, C–O–C bending at 1218 cm−1, C![[double bond, length as m-dash]](https://www.rsc.org/images/entities/char_e001.gif) O stretching at 1734 cm−1 and most importantly the broad peak at 3350 and small peak at 1371 cm−1 corresponding to the –OH stretching vibration and deformation respectively due to the C–OH groups in the material.
O stretching at 1734 cm−1 and most importantly the broad peak at 3350 and small peak at 1371 cm−1 corresponding to the –OH stretching vibration and deformation respectively due to the C–OH groups in the material.
The graphene oxide is then reduced using L-ascorbic acid (mentioned in the experimental section) for 24 h and the FT-IR spectrum is recorded (Fig. 2aii). The reduction of GO to rGO is confirmed by the complete removal and reduction in intensities of different peaks. The peaks centered at 1037, 1218, 1734 and 3350 cm−1 either disappeared completely or decreased in intensity significantly due to the elimination of oxygen containing functional groups as a result of the reduction process. A considerable decrease in the –OH peak (3350 cm−1) intensity is observed due to the removal or conversion of oxygen containing functional groups. However, it should be noted that –OH peak has not completely disappeared indicating that some left over oxygen functionalities still stay behind in the reduced graphene oxide. The recovery of sp2 lattice structure is confirmed by a strong band at 1629 cm−1.39,47 The reduction of GO to rGO was also confirmed using UV-Vis spectroscopy (Fig. 2b). Graphene oxide shows two characteristic peaks at 234 and 300 nm in the absorption spectrum, both of which on reduction gradually decays and vanishes after 24 hours of reaction. A new absorption peak centered at 258 nm shows up in the rGO absorption spectrum. The absorption intensity enhances for the reduced sample considerably and based on previous reports might be the indication of GO being reduced to rGO and the slow reinstatement of aromatic structure in the system.39,49 The GO and rGO aqueous solutions are shown in Fig. 2b inset and the change in colour from brown (GO) to black (rGO) is also clearly evident. Zhang et al.39 have stated that L-ascorbic acid has the added advantage of stabilizing the aqueous rGO dispersion without the help of other capping agents or surfactants. This additional benefit of L-ascorbic acid may assist in properly dispersing the rGO sheets throughout the aqueous PP latex emulsion. The photos of PP latex and PP/in situ reduced GO mixture are shown as Fig. S1 (ESI†).
The conversion of GO to rGO was further evidenced by XPS, XRD and Raman analysis. The C 1s XPS spectra of graphene oxide (Fig. 2c) shows the characteristic peaks at 284.74, 286.86, 288.71 and 289.32 eV respectively corresponding to C![[double bond, length as m-dash]](https://www.rsc.org/images/entities/char_e001.gif) C/C–C in aromatic rings, epoxy and alkoxy C–O, C
C/C–C in aromatic rings, epoxy and alkoxy C–O, C![[double bond, length as m-dash]](https://www.rsc.org/images/entities/char_e001.gif) O and COOH groups. However, after reduction (Fig. 2d) the C 1s peak intensities of all the carbons bound to oxygen especially the C–O (epoxy and alkoxy), C
O and COOH groups. However, after reduction (Fig. 2d) the C 1s peak intensities of all the carbons bound to oxygen especially the C–O (epoxy and alkoxy), C![[double bond, length as m-dash]](https://www.rsc.org/images/entities/char_e001.gif) O and COOH peaks clearly diminish. This reduction in intensity and disappearance of peak discloses the fact that most of the oxygen containing functionalities in GO were removed after the reduction process.39 The X-ray diffractograms of GO, rGO and PP/rGO nanocomposites are shown in Fig. 2e The XRD of GO reveals the presence of a peak at around 10° (0 0 2 plane) clearly indicating the oxidized state of graphene affecting the crystal structure.50 However, upon reduction the sample reveals a broad peak centered at around 25° indicating the reduction of GO leading to reduced graphene oxide nanosheets which may begin to stack up due to the strong van der Waals forces.50 For PP latex, diffraction peaks at 14, 16, 17, 21.5, 26° has been reported by researchers like Song et al.31 and Fu et al.37 The incorporation of rGO into PP latex matrix leads to nanocomposites showing only the crystalline diffraction peaks of PP matrix in the XRD spectra indicating that the rGO sheets dispersed in the PP matrix is well distributed.31 Fu et al.37 have stated that the absence of characteristic intense peaks at 10° or 27° corresponding to GO and graphite suggests that the dispersion state of graphene is good in the matrix. However, the peak shape and intensity change at 13.7, 16.8 and 18.0° corresponding to (110), (040) and (130) planes respectively in the presence of rGO denote that the existence of rGO affects the crystallization behavior of the matrix to some extent.31 This effect of rGO concentration on the crystallization of PP matrix is later investigated using DSC analysis. Raman spectroscopy was also used to further confirm the reduction of GO to rGO and to evaluate the change in characteristic peak reflections from graphite to GO and finally to rGO. Graphite exhibits two characteristic peaks namely the G band at around 1580 cm−1 and the weaker of the two bands known as the D band at 1350 cm−1 which is also referred to as the defect band.31 The G band is due to the sp2 hybridized graphitic domains whereas, the presence of sp3 hybridized carbon and defects are the reason for the D band in graphite.51,52 However, as evident from Fig. 2f GO on the other hand has two bands (G and D) broadened and shifted to the higher wavenumber regions (1593 and 1356 cm−1) respectively which is also accompanied by increased ID/IG values (0.33). This has been reported to be due to the increase in defect like amorphous domains and also to the seclusion of carbon double bonds as a result of oxidation.31,53 The reduction of GO to rGO leads to the G and D bands remaining broader than those of pristine graphite however, the ID/IG values increases dramatically to around 0.99. This increment in ID/IG values for rGO compared to GO has been attributed to increased number of aromatic domains of overall smaller size or due to the presence of defects in the crystal lattice as a result of reduction process.31,54–56
O and COOH peaks clearly diminish. This reduction in intensity and disappearance of peak discloses the fact that most of the oxygen containing functionalities in GO were removed after the reduction process.39 The X-ray diffractograms of GO, rGO and PP/rGO nanocomposites are shown in Fig. 2e The XRD of GO reveals the presence of a peak at around 10° (0 0 2 plane) clearly indicating the oxidized state of graphene affecting the crystal structure.50 However, upon reduction the sample reveals a broad peak centered at around 25° indicating the reduction of GO leading to reduced graphene oxide nanosheets which may begin to stack up due to the strong van der Waals forces.50 For PP latex, diffraction peaks at 14, 16, 17, 21.5, 26° has been reported by researchers like Song et al.31 and Fu et al.37 The incorporation of rGO into PP latex matrix leads to nanocomposites showing only the crystalline diffraction peaks of PP matrix in the XRD spectra indicating that the rGO sheets dispersed in the PP matrix is well distributed.31 Fu et al.37 have stated that the absence of characteristic intense peaks at 10° or 27° corresponding to GO and graphite suggests that the dispersion state of graphene is good in the matrix. However, the peak shape and intensity change at 13.7, 16.8 and 18.0° corresponding to (110), (040) and (130) planes respectively in the presence of rGO denote that the existence of rGO affects the crystallization behavior of the matrix to some extent.31 This effect of rGO concentration on the crystallization of PP matrix is later investigated using DSC analysis. Raman spectroscopy was also used to further confirm the reduction of GO to rGO and to evaluate the change in characteristic peak reflections from graphite to GO and finally to rGO. Graphite exhibits two characteristic peaks namely the G band at around 1580 cm−1 and the weaker of the two bands known as the D band at 1350 cm−1 which is also referred to as the defect band.31 The G band is due to the sp2 hybridized graphitic domains whereas, the presence of sp3 hybridized carbon and defects are the reason for the D band in graphite.51,52 However, as evident from Fig. 2f GO on the other hand has two bands (G and D) broadened and shifted to the higher wavenumber regions (1593 and 1356 cm−1) respectively which is also accompanied by increased ID/IG values (0.33). This has been reported to be due to the increase in defect like amorphous domains and also to the seclusion of carbon double bonds as a result of oxidation.31,53 The reduction of GO to rGO leads to the G and D bands remaining broader than those of pristine graphite however, the ID/IG values increases dramatically to around 0.99. This increment in ID/IG values for rGO compared to GO has been attributed to increased number of aromatic domains of overall smaller size or due to the presence of defects in the crystal lattice as a result of reduction process.31,54–56
The FT-IR spectrum of neat polypropylene and 20 wt% PP/graphene oxide sample (before and after reduction) is shown as Fig. 3. For neat polypropylene (Fig. 3a) the characteristic peaks of polypropylene are clearly visible. The symmetrical –CH stretching from methyl group is the reason for the peak at 2951 cm−1 whereas, the peaks at 2917, 1456 and 1367 are due to the asymmetrical –CH stretching, asymmetrical and symmetrical bending modes of methyl –CH bonds respectively. The peak at 1251 cm−1 is ascribed to the various bending modes (scissoring, rocking, wagging and twisting) of methylene group. The FT-IR spectrum of unreduced PP/GO composite sample is shown as Fig. 3c and contains the characteristic peaks of both PP and graphene oxide. The broad peak at 3293 cm−1 is due to the –OH stretching vibration of C–OH groups present in the graphene oxide. Similarly, as a result of the addition of unreduced graphene oxide into PP matrix, the presence of carbonyl groups (C![[double bond, length as m-dash]](https://www.rsc.org/images/entities/char_e001.gif) O stretching) and the presence of C–OH bending modes is validated by the peaks at 1636 and 1546 cm−1 respectively.47
O stretching) and the presence of C–OH bending modes is validated by the peaks at 1636 and 1546 cm−1 respectively.47
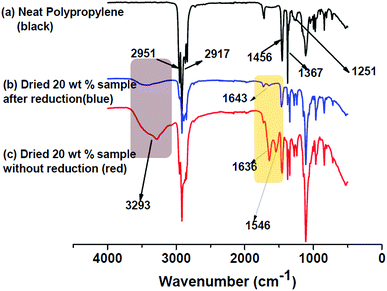 | ||
| Fig. 3 FT-IR spectra of (a) neat PP, (b) PP/rGO sample after 24 h reduction and (c) unreduced PP/GO sample. | ||
However, on in situ reduction of graphene oxide using L-ascorbic acid to fabricate PP/rGO nanocomposites the reduction in oxygen containing groups is clearly observable (Fig. 3b). The peaks at 1636 and 1546 cm−1 clearly diminish in the case of reduced sample demonstrating the elimination of oxygen containing functionalities present in GO. Most importantly the intense broad peak at 3293 cm−1 due to –OH stretching vibration clearly decreases in intensity pinpointing the removal of oxygen functionalities. It should however, be noted that the broad –OH peak has not totally vanished (only reduced in intensity) indicating that some residual oxygen functionalities still remain on the surface of GO even after reduction.
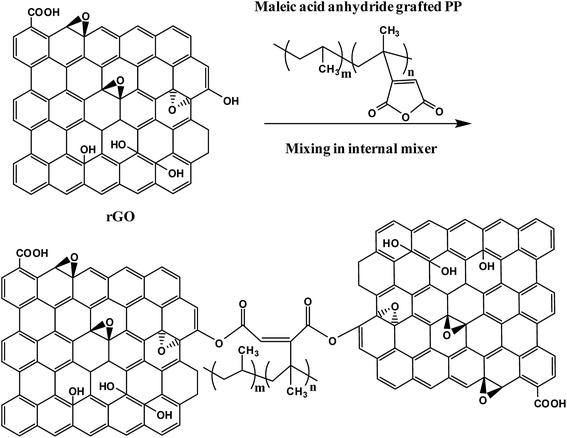
The PP latex utilized during this study is maleic acid anhydride grafted PP and hence has the minute possibility of maleic acid anhydride part of the PP matrix reacting with the remaining –OH groups of the rGO. The proposed reaction mechanism is shown in Fig. 4. The FT-IR spectrum of 20 wt% rGO filled PP composite after reduction shows a small peak at 1643 cm−1. This might be due to the anhydride and carboxylic acid functionalities produced as a result of the hydrolysis of esterification product of the reaction between the residual –OH groups in rGO with maleic anhydride. This minute possibility of bonding between the maleic anhydride parts of PP with rGO may lead to better and efficient dispersion of graphene sheets between the PP chains.
3.2 Morphological characterization
FE-SEM analysis was employed to get a peek into the morphology of rGO and PP/rGO composites. The FE-SEM images of rGO and PP/rGO samples are shown in Fig. 5.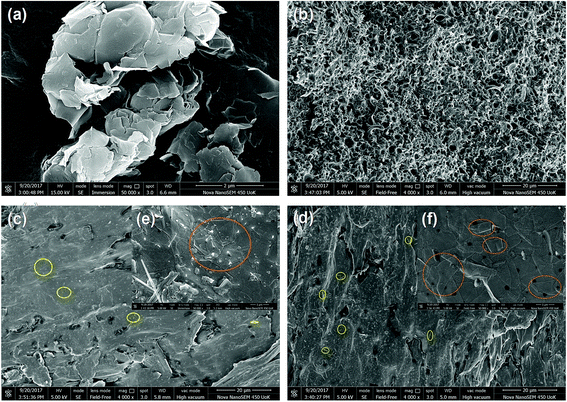 | ||
| Fig. 5 FE-SEM images of (a) reduced graphene oxide, (b) neat PP, (c) and (e) 5 wt% rGO filled PP composite and (d) and (f) 20 wt% rGO filled PP composite. | ||
Fig. 5a depicts the FE-SEM image of rGO sample and clearly shows sheets of rGO stacked together with each other. Fig. 5b on the other hand shows the FE-SEM image of neat polypropylene where the voids and pores on the surface are clearly visible. However, on the addition of reduced graphene oxide to this PP matrix a realistic uniform distribution of graphene in the PP matrix can be observed clearly with extremely low concentration of aggregation (Fig. 5c and d). This uniform distribution of graphene throughout the PP matrix even at high concentrations (20 wt%) of rGO leads us to believe that there is some degree of interaction taking place between rGO and PP matrix. Fig. 5(e) and (f) are the FE SEM images of PP/rGO composites with 5 and 20 wt% rGO respectively at higher magnification. Well dispersed sheet like structures of rGO is clearly visible in both the images. Since both the matrix and filler are being mixed in the solvent form itself, uniform mixing of rGO within the PP matrix will be achieved, possibly leading to reduction of voids and pores in the nanocomposites.
3.3 Distribution of rGO in PP matrix
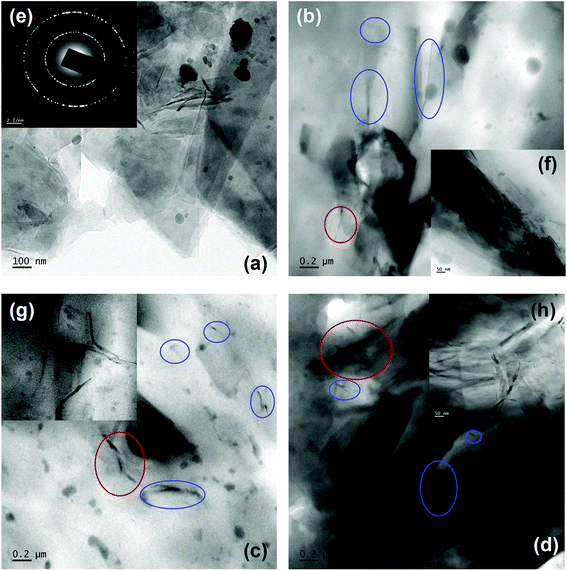
The distribution of rGO in the PP matrix was analyzed using TEM (Fig. 6). The TEM image of rGO (Fig. 6a) clearly reveals thin rGO sheets dispersed across the grid. The sheets at some places appear to be folded, irregular and entangled with each other. The SAED (selected area electron diffraction) pattern (Fig. 6e) of rGO shows well defined diffraction spots which leads us to conclude that the crystalline state of GO was re-established to some extent.39 The TEM images of 5, 10 and 20 wt% rGO filled PP latex composites are shown in Fig. 6(b), (c) and (d) respectively. The low viscosity of PP latex (∼40 mPa s) aids in the formation of well dispersed rGO sheets throughout the PP matrix as evidenced by the TEM images. Fig. 6(b)–(d) clearly show the distribution of few layers rGO (blue circles) in the PP matrix. The distribution of rGO in the PP matrix increases with increasing rGO concentration and is clearly observable in the TEM images. The magnification of the TEM images reveal rGO sheets [Fig. 6(f)–(h)] with thickness of ∼10–20 nm distributed uniformly throughout the PP matrix. This uniform distribution of rGO throughout the PP matrix may facilitate the formation of conductive networks or pathways in the composite. At very high rGO concentration (20 wt%) extensive networks of closely packed rGO sheets are clearly visible (Fig. 6h). The SEM and TEM analysis of the rGO filled PP latex composites conclusively showcases the uniform distribution of rGO sheets throughout the PP matrix with good homogeneity. This uniform distribution of rGO sheets in the PP matrix is attained due to three possible rationales: (a) PP dispersion/latex has a low viscosity of ∼40 mPa s and hence the nanoparticle dispersion can be uniformly and efficiently distributed using simple magnetic stirring owing to kinetic factors,57 (b) the PP emulsion employed in the current work is a water-based suspension of maleic anhydride-grafted isotactic polypropylene and has low tendency for nanoparticle aggregation and facilitates uniform dispersion and (c) the proposed reaction between rGO and maleic anhydride part of PP may also facilitate the uniform distribution of rGO in the PP matrix. It has been reported that the polarity of maleic anhydride will most likely assist in uniform and efficient dispersion of graphene oxide in the PP matrix.57,583.4 Thermal properties of PP/rGO nanocomposites
The thermogravimetric data of reduced graphene oxide and rGO/PP composites with varying rGO content are shown in Fig. 7. Reduced graphene oxide has good thermal stability and shows only a small degradation peak at around 500 °C, and may be due to the presence of small quantities of residual oxygen groups present even after reduction and other small defects. The residue after 800 °C is around 83% which depicts the good thermal stability of rGO in nitrogen atmosphere. The degradation of polypropylene latex shows two stage decomposition with the initial degradation probably due to moisture/water removal followed by the major degradation point at around 400 °C and is primarily attributed to the scission of saturated and unsaturated carbon bonds present in the PP system.59 This degradation leads to the residue remaining for PP latex after 800 °C close to 0%. However, on incorporating thermally stable rGO into PP latex, a part of the good inherent thermal stability of rGO is transferred to the as prepared composites also, thereby PP latex/rGO composites showcasing marginally improved stability compared to that of neat PP latex. The residue remaining for each sample depicts increasing residue % with increasing rGO content. For 1.5 wt% PP/rGO sample the residue is 1.01%, whereas for the 10 and 15 wt% samples the residue remaining is 8.9 and 14.6% respectively. This provides us with ample confirmation for the incorporation of rGO into PP latex matrix. Several earlier reports on graphene based polymeric nanocomposites have suggested that the incorporation of graphene into polymeric matrices enhances the thermal stability of the polymers to some extent only.31,60,61 The marginally enhanced thermal stability of PP/rGO nanocomposites imparted by the addition of thermally stable rGO into PP latex, is clearly evidenced by the monotonous rise in initial degradation (Ti) and marginal increment in maximum mass loss temperatures (Tmax). The values of Ti, Tmax and residue left for PP latex and PP latex/rGO composites are tabulated in Table 1.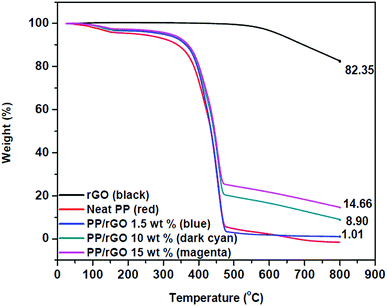 | ||
| Fig. 7 TGA thermograms of reduced graphene oxide and rGO/PP nanocomposites with varying rGO content. | ||
| Sample | Initial degradation temperature (Ti) (°C) | Maximum loss temperature (Tmax) (°C) | Residue left (%) at 800 °C |
|---|---|---|---|
| PP latex | 338 | 473 | 0.00 |
| 1.5 wt% rGO/PP | 358 | 476 | 1.01 |
| 10 wt% rGO/PP | 367 | 473 | 8.90 |
| 15 wt% rGO/PP | 368 | 473 | 14.6 |
This marginal increment in thermal stability for rGO filled PP composites may be credited to the barrier effects of graphene sheets just like that of clay planets.31 The increase of 20 °C in initial degradation temperature between PP latex and 1.5 wt% rGO/PP is similar to that of the increase reported by Song et al.31 wherein hydrazine hydrate was used as the reducing agent rather than ascorbic acid. The differential scanning calorimetric curves of crystallization and melting of in situ reduced rGO/PP composites are shown in Fig. 8.
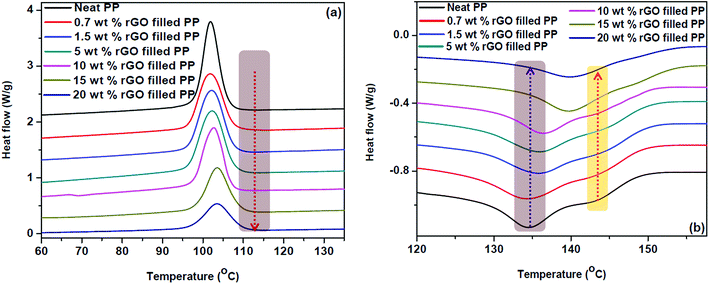 | ||
| Fig. 8 Differential scanning calorimetric curves of (a) crystallization and (b) melting of PP/rGO nanocomposites with different rGO contents. The arrow direction indicates increasing rGO content. | ||
The crystallization temperatures of the rGO filled composites are found to increase with increasing graphene concentration (Fig. 8a). In all the samples both the onset crystallization and crystallization temperatures followed an ascending trend with increasing rGO content. For instance, the crystallization temperature of PP filled with 20 wt% in situ reduced GO was found to be 1.6 °C higher than that of neat polypropylene. The effect of graphene content on crystallization is more obvious in the case of onset crystallization temperature, wherein the sample with 20 wt% rGO shows 2.2 °C increment compared to that of neat PP. Zhao et al.62 have credited this improvement in crystallization properties of PP with the addition of graphene to the strong heterogeneous nucleation effect of graphene sheets. The effect of graphene concentration on the onset crystallization and crystallization temperatures of PP/rGO composites are tabulated in Table 2. Nano materials are known to be efficient nucleating agents and Fig. 8a evidently points to the capability of graphene oxide sheets to speed up the crystallization process of PP by making available abundant nucleation sites. The vertical dashed line denotes the onset of crystallization temperature for 20 wt% rGO filled PP composite and is compared with the other samples in Table 2. It can also be observed from Fig. 8a that with increasing rGO content the crystallization (exothermic) curves became wider and shallower in accordance with the work of Wakabayashi et al.63 where graphite was used as the filler for PP matrix. This change in peak shape may point to the conservative rather than progressive increase in the crystallization rate. This finding is however, contradictory to the findings of Song et al.31 where PP latex/rGO composite did not show such an effect. This discrepancy in the crystallization behavior might be due to the difference in processing methods. Song et al.31 used PP latex and employed hydrazine hydrate for reducing GO followed by using this as a master batch and adding to PP granules (matrix) for the fabrication of composites. Whereas, in the present work PP latex is used as the matrix and utilizes ascorbic acid as the reducing agent to reduce GO.
| Sample | Crystallization temperature (°C) | Onset crystallization temperature (°C) | TM1 (°C) | TM2 (°C) |
|---|---|---|---|---|
| Neat polypropylene | 102.0 | 110.2 | 134.4 | 143.7 |
| 0.7 wt% rGO/PP | 102.0 | 111.1 | 134.4 | 144.0 |
| 1.5 wt% rGO/PP | 102.1 | 111.0 | 136.0 | 145.0 |
| 5 wt% rGO/PP | 102.3 | 111.7 | 136.1 | 145.2 |
| 10 wt% rGO/PP | 102.5 | 111.0 | 135.2 | Peak not visible |
| 15 wt% rGO/PP | 103.6 | 112.4 | 140.0 | Peak not visible |
| 20 wt% rGO/PP | 103.6 | 112.4 | 140.0 | Peak not visible |
The endothermic (melting behavior) of in situ reduced rGO/PP latex nanocomposites is shown in Fig. 8b. The melting curve of PP unmistakably exposes the double melting behavior (TM1 = 134.4 °C and TM2 = 143.7 °C). This double melting behavior however, slowly and steadily proceeds in the path of single melting behavior with the addition of reduced graphene oxide. The melting temperature 1 (TM1) gradually swings to higher temperatures and finally overlaps with the second melting peak (TM2) which is not clearly visible above 5 wt% rGO content. The values of TM1 and TM2 for different samples are tabulated in Table 2.
The obvious diminishing of double melting behavior for PP/rGO system is clearly noticeable above 5 wt% rGO filled composite and changes completely to a single peak at high rGO concentrations of 15 and 20 wt%. Miltner et al.35 have reported that materials with polymorphism (a materials ability to exist in more than one form or crystal structure) generally display multiple melting point behavior. The change in equilibrium between the two forms of PP (hexagonal and monoclinic) might be the reason for this shift of TM1 to higher temperature region and consequent vanishing of TM2 with increasing rGO content. Hence it can also be concluded that rGO has the unique potential to specifically nucleate a particular polymorph of PP than its counterpart, leading to the equilibrium shift. It is well reported that shear induced crystallization or the presence of nanoparticles can favour the crystallization of β form (hexagonal) of PP.64,65 Among these different types of nanoparticles graphene and its derivatives have already been reported to favour the β form (hexagonal) of PP during crystallization. Xu et al.28 reported that even at very low concentrations of GO (0.5 and 1 wt%) the crystallization of β form was favoured by means of shear amplification effect. Similarly Yuan et al.66 also accounted that at 1 wt% addition of functionalized graphene sheets the β form of PP was obtained. Hence, in the present work it is quite understandable that at high concentrations of rGO (20 wt%) the equilibrium between α (monoclinic) and β (hexagonal) forms of PP shifts to the β form predominantly.
3.5 Electrical conductivity studies of the composites
The dielectric constant (dielectric permittivity) and loss factor values of PP/rGO nanocomposites at room temperature are shown in Fig. 9 as a function of frequency with respect to varying graphene content.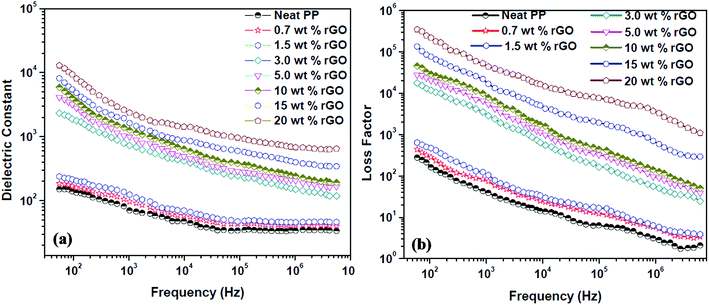 | ||
| Fig. 9 Effect of different rGO contents on the (a) dielectric constant and (b) loss factor of PP/rGO composites at room temperature as a function of frequency. | ||
The real part of the complex dielectric permittivity is more commonly referred to as dielectric constant or dielectric permittivity (ε′) whereas the loss factor can be defined as the amount of energy dissipated in a dielectric material.23 The composite or any given material should have high dielectric properties and conductivity in order to showcase good EMI shielding behavior.57 Fig. 9a and b clearly depict that both the dielectric constant and loss factor of PP/rGO composites increases with increasing weight % of rGO content. For neat PP, the dielectric constant at 102 Hz frequency is ∼150 which decrease to around 34 at 107 Hz. However, in the case of 20 wt% rGO incorporated PP composites the samples exhibit a dielectric constant of around 10![[thin space (1/6-em)]](https://www.rsc.org/images/entities/char_2009.gif) 219 at low frequency (102 Hz) which decreases to ∼680 at higher frequencies (107 Hz). The very high dielectric constant values for the PP/rGO composites indicate that the dielectric permittivity of PP composites can be significantly enhanced by blending it with reduced graphene oxide. The TEM images (Fig. 6) has shown that the conducting filler (reduced graphene oxide) is well distributed throughout the PP matrix. The exfoliated rGO layers predominantly appear to be secluded by the insulating PP matrix leading to the creation of large number of microcapacitor structures (Fig. 10) throughout the PP/rGO composite, which in turn may give rise to increased intensity of local electric field.
219 at low frequency (102 Hz) which decreases to ∼680 at higher frequencies (107 Hz). The very high dielectric constant values for the PP/rGO composites indicate that the dielectric permittivity of PP composites can be significantly enhanced by blending it with reduced graphene oxide. The TEM images (Fig. 6) has shown that the conducting filler (reduced graphene oxide) is well distributed throughout the PP matrix. The exfoliated rGO layers predominantly appear to be secluded by the insulating PP matrix leading to the creation of large number of microcapacitor structures (Fig. 10) throughout the PP/rGO composite, which in turn may give rise to increased intensity of local electric field.
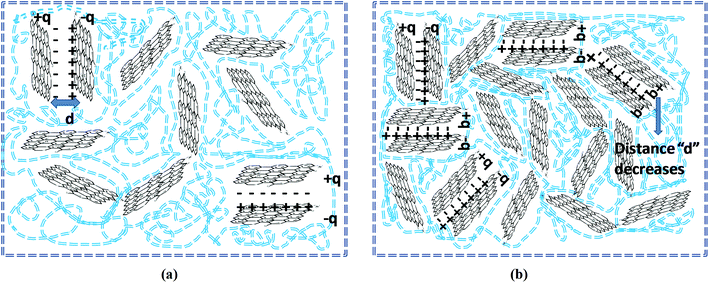 | ||
| Fig. 10 Schematic representation of microcapacitor formation in PP/rGO nanocomposites at (a) low rGO content and (b) high rGO content. Blue dotted lines represent PP chains. | ||
Researchers have already conclusively reported that the formation of large number of microcapacitor structures in a given material will lead to a remarkable enhancement in the dielectric constant of conducting filler/polymer composites at the percolation threshold.23,67–69 The increased intensity of local electric field as a result of improved presence of microcapacitors paves the way for enhanced migration and buildup of charge carriers at the PP/rGO interface.23 During the microcapacitor formation the few layers thick rGO sheets act as the electrode material which is isolated by polypropylene which is an insulator material. The formation of such microcapacitors increases with increasing rGO content and results in increased dielectric constant. The presence of large quantities of rGO in the PP matrix leads to decreased space between the electrodes (Fig. 10) in the microcapacitor thus aiding the total dielectric constant value of the sample. The brisk decrease of dielectric constant with increasing frequency (at low frequency regions) can be explained on the basis of incapability of dipoles with huge relaxation time to trail the quickly changing external field. However, when it comes to the MHz range this peculiar behavior is halted due to the fact that the relaxation times of dipoles in this regime is much lower compared to the applied frequency.
The substantial increase in dielectric constant with increasing rGO content can also be attributed to the polarization at the matrix (polymer) and filler (rGO) interface.57,70 This type of polarization is referred to as Maxwell–Wagner Sillar effect or interfacial polarization.57 A sharp increase (few orders magnitude) in dielectric constant is observed above 1.5 wt% rGO content, thus leading to the conclusion that for the present system the percolation threshold is in between 1.5 and 3 wt%. On attaining the percolation threshold the number of PP (matrix) – rGO (filler) interfaces increases dramatically along with increment in accumulation of charges at the interface thus leading to very high interfacial polarization and hence showing few orders magnitude increment in dielectric constant. Fig. 9a also reveals that above the percolation threshold the dielectric constant values of the samples more or less becomes frequency dependent mainly at lower frequencies. The dielectric constant values of 10, 15 and 20 wt% rGO filled samples clearly shows a sharp decreasing tendency with frequency compared to that of the samples with lower rGO contents. However, at very high frequencies (at or above 106 Hz) this reliance on frequency diminishes. The charge carriers present at the interface undergoes constant motion at higher frequencies and is the reason why at higher frequencies it remains more or less same.71,72 This trend of dielectric constant with frequency can also be attributed to two other factors namely, (a) lagging effect of interfacial and orientational polarization with applied external electric field and (b) charge and molecular reorientation hindering the rapid change in applied external field direction.70,73
The dielectric loss (Fig. 9b) of PP/rGO composites also showed the same tendency as that of the dielectric constant, the loss values increased with increasing rGO content but decreased with increasing frequency for all the samples. Above the percolation threshold (i.e. between 1.5 and 3 wt%) dielectric loss also showed a jump of few orders of magnitude for the composites. The leakage current is the major factor that controls the dielectric loss or loss factor of highly conducting polymeric composites.23 With increasing conducting filler content in polymer matrix based composite, once the percolation threshold is reached the formation of conductive networks/pathways takes place resulting in enhanced leakage current and thereby dielectric loss. The formation of such conductive networks/pathways in polymer composites due to the addition of highly conducting filler contributes to higher dielectric loss which in turn might aid the dissipation of electromagnetic waves by absorption mechanism.57 The effect of rGO content on the ac conductivity of PP/rGO composite systems as a function of frequency with respect to different rGO content is shown as Fig. 11.
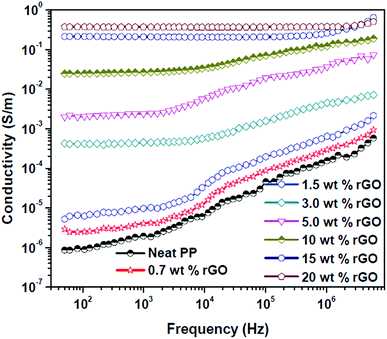 | ||
| Fig. 11 AC conductivity variation of PP/rGO composites with varying rGO content as a function of frequency. | ||
The values increased with increasing rGO content with the highest values being observed for 20 wt% rGO filled samples. Neat PP and composite specimens with 0.7 and 1.5 wt% rGO respectively demonstrated conductivity values in between that of 10−7 to 10−6 S m−1 (insulating behavior) at 50 Hz frequency and more importantly for all these samples the conductivity increased with increasing frequency which is characteristic of dielectric materials.22,74 On the other hand the sample with 3 wt% rGO content illustrated conductivity values in the range of 10−4 S m−1 whereas the samples with 10, 15 and 20 wt% rGO content showed conductivity values in the range of 10−2 and 10−1 S m−1 respectively. The important observation nonetheless is that, in the samples with 3 and 5 wt% rGO the conductivity was found to be independent of frequency until a frequency of 103 and 104 Hz respectively and after which the values increased with frequency. The DC conductivity values on the other hand are dominated by the polarization of dipoles and a characteristic feature of such polarization is this frequency independent behavior.22,75 Composite specimens with 15 and 20 wt% rGO content displayed frequency independent behavior throughout the entire frequency range. It has been reported that the onset of frequency independent performance is believed to be the transition of a material from insulating to conducting nature.22,76 Hence, this study reveals that for the present system (PP latex/in situ reduced rGO composite) the percolation threshold is in between 1.5 and 3 wt% of rGO. The dramatic increase in conductivity above the percolation threshold can be explained on the basis of formation of conductive pathways/networks throughout the system thus facilitating the current transfer. It has already been reported that composites filled with conductive fillers show huge increase in conductivity values above the percolation threshold due to the formation of conductive networks and also due to the hopping mechanism induced charge transfer.70 The different conducing mechanisms taking place inside a heterogeneous composite material before and after the percolation threshold can be depicted as shown in Fig. 12.
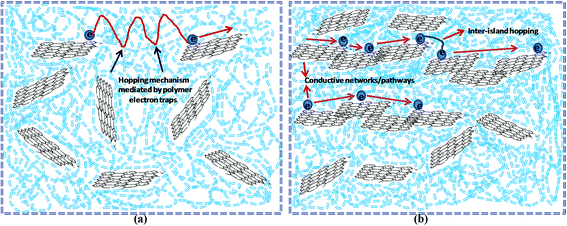 | ||
| Fig. 12 Proposed conducting mechanisms taking place in PP/rGO composites at (a) below percolation threshold and (b) above percolation threshold. | ||
Polypropylene is an insulator and such materials show hopping of electrons as the major charge transport mechanism in it. On the addition of conducting filler like rGO with its concentration below the percolation threshold, the formation of narrow conductive islands in the matrix along with hopping contributes to the total conductivity (Fig. 12a). However, the addition of rGO above the percolation threshold results in the formation of extensive conductive networks or pathways (Fig. 12b) throughout the system and supports the conduction process for extended distances and contributes sufficiently to the total conductivity. The conductivity above the percolation threshold is also aided by inter-island hopping mechanism. Below the percolation threshold the scarcity of long range conductive pathways or networks restricts the charge flow to only short distances and hence the conductivity will be low. The formation of conductive pathways or networks however, leads to long range metal like conduction thereby increasing the conductivity values to a few orders of magnitude above the percolation threshold.
Size, shape, concentration, distribution etc. of the filler are the major factors that govern the formation of conductive networks/pathways in a given composite material.70 A significant advantage of graphene reported by scientists is that, being a two dimensional material it assists in the process of connecting with each other more effortlessly compared to other conducting nanofillers due to its huge aspect ratio and hence the use of graphene based materials helps in attaining low percolation thresholds for composites.23,77 However, it has also been reported that on comparison, at the same filler content CNT based composites have higher conductivity than the graphene based counterparts due to the individual CNT showing very low contact resistance.5 They also claim that compared to 2D geometry of graphene sheets, the 1D geometry of CNTs are more favorable towards the formation of conductive networks.5 Al-Saleh, however has experimentally proven that the intrinsic conductivity of graphene conductive pathways or networks at high filler content is superior to that of the CNT networks.5 A low percolation threshold of conductivity can provide composites with many advantages such as maintenance of its mechanical properties at low filler loading, reduction in weight, low cost of production etc. However, percolation threshold of conductivity only means the amount of filler (wt% or vol%) required for the formation of conductive networks wherein the conductivity values show few order magnitude increment (For e.g. say from 10−7 to 10−4). Even so, it has been extensively reported that for a material to behave as an EMI shield it should possess even higher conductivity values.78,79 Hence, for practical EMI shielding applications the addition of rGO above the percolation threshold may be required.
3.6 Electromagnetic interference shielding effectiveness of in situ reduced rGO/PP composites
Conductivity, dielectric properties, dispersion state of the filler in the matrix, aspect ratio and loading of the incorporated fillers are some of the major aspects that govern the electromagnetic interference shielding effectiveness (EMI SE) of a given composite/nanocomposite. Good dielectric behavior and conductivity can be accomplished by means of incorporating highly conducting filler.57,80 The EMI SE of a given material can be determined using the S parameters (S11, S12, S22, S21). In materials with an EMI SE value of ∼10 dB, researchers have claimed that the major mechanism in such a system consists of absorption and reflection and in such cases multiple reflections can be neglected. The S parameters can be utilized to calculate the SER and SEA values using the following equations:5
 | (1) |
 | (2) |
| R = |S11|2 = |S22|2 | (3) |
| T = |S12|2 = |S21|2 | (4) |
| A = 1 − R − T |
Electromagnetic interference shielding effectiveness (EMI SE) is a thickness dependent property22,81 and throughout the course of this work samples with thickness of 2 mm was prepared and studied. The EMI SE values of in situ reduced rGO/PP nanocomposites with respect to rGO content over the X and Ku band regions are presented in Fig. 13.
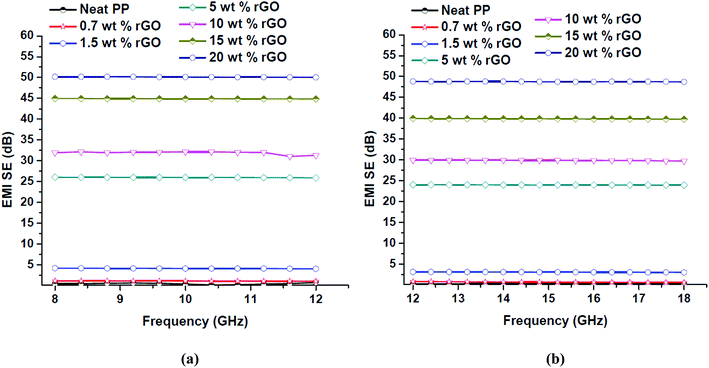 | ||
| Fig. 13 EMI SE values of PP/rGO composites with different rGO content over (a) X and (b) Ku bands of the microwave frequency region. | ||
The EMI SE values of PP/rGO composites clearly expose its frequency independent behavior over a broad frequency range (8–18 GHz). For neat PP the EMI SE value over X band was approximately 0.5 dB whereas over Ku band it was ∼0.3 dB. However, on addition of conducting filler like rGO the EMI SE values increased considerably over both the X and Ku band regions. The highest EMI SE values were shown by 20 wt% rGO filled samples (∼50 dB over X band and ∼48 dB over the Ku band respectively). The substantial increase in the EMI SE values of rGO filled PP samples may be the result of extensive conductive networks/pathways being formed with increasing rGO content. It can be observed that for the same sample the EMI SE values at two different bands (X and Ku) are dissimilar, this peculiarity has been reported by several researchers wherein the same sample will show different EMI SE values at different bands.22 The increased EMI SE values with increasing rGO content can also be attributed to (a) the continuity of the conductive networks/pathways being formed in the system increases with increasing rGO content and (b) the chance of formation of thick conductive interfaces between the PP multi-facets facilitating the enhanced EMI SE as a result of strong interaction with the EM waves.12 For practical commercial applications an EMI SE value of 20 dB equivalent to 1% of transmittance is required and can be achieved by conductivity of around 1 S m−1.57,70 This 20 dB EMI SE value was achieved using 5 wt% rGO itself. The present study without a doubt divulges that PP latex/in situ reduced rGO composites have the ability to meet the stringent conditions for its possible commercial applications. In order to show a relationship between the electrical conductivity and EMI shielding of a material the conductivity values at 1200 Hz and the EMI SE values of the samples at X (10 GHz) and Ku (15 GHz) bands are plotted against rGO content and is shown in Fig. 14.
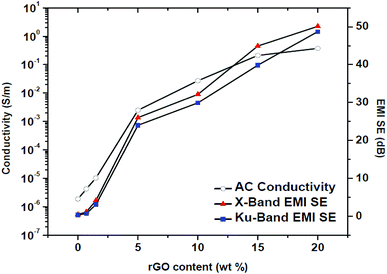 | ||
| Fig. 14 EMI SE values at X and Ku bands plotted together with ac conductivity at 1.2 kHz against different rGO contents. | ||
The EMI SE and conductivity values do not show any significant improvement upto 1.5 wt% rGO content. However, above 1.5 wt% rGO content which is the percolation threshold in this case, both the conductivity and EMI SE values showcase noteworthy improvement. Hence it can be concluded that a major criterion to achieve good EMI shielding behavior for polymer composites is that the conducting filler content should be well above the percolation threshold. Numerous conducting pathways and microcapacitors will be created above the percolation threshold which may aid in attenuating the EM waves properly.22 Kumar et al.22 have also claimed that a minimum conductivity of 10−4 S cm−1 for a given material will yield good EMI shielding behavior. Increased conductive pathways and microcapacitors above percolation threshold will lead to large number of nomadic charge carriers and/or electric or magnetic dipoles that can interact with EM waves24 thereby increasing the EMI shielding efficiency.22,82 Table 3 shows a comparative analysis of recently reported EMI SE values of graphene filled polymer composites. The values in Table 3 evidently demonstrate that the present method to in situ reduce graphene oxide within the PP latex matrix during the mixing stages itself yields excellent properties to the resulting composite. Moreover, the current work proposes a green and economical route for the preparation of PP/rGO composites wherein ascorbic acid (vitamin C) is used as the reducing agent and aqueous medium is used during the entire processing stages.
| Composite | Filler content wt (%) [vol%] {Vf} | Thickness (mm) | EMI SE (dB) | Ref. |
|---|---|---|---|---|
| PP/rGO | 20.0 [12] {0.12} | 2.0 | 50 (X band) | Present work |
| 48 (Ku band) | ||||
| PP/graphene nanosheets | 20.0 | 0.5 | 13.0 (S band) | 83 |
| PP/graphene nanoplatelets | 10.0 | 1.0 | 19.0 (X band) | 33 |
| PU/graphene nanosheets | 0.12 Vf | 0.05 | 14 (X band) | 84 |
| Epoxy/functionalized graphene | 15 | — | 21 (X band) | 16 |
| PS/rGO | 3.47 vol% | 2.5 | 45 (X band) | 12 |
| PVDF/graphene decorated with graphene quantum dots | 2 | — | 37 (X band) | 85 |
| PS/sulfur doped rGO | 7.5 vol% | 2.0 | 24.5 (Ku band) | 86 |
| PEI/graphene | 10 | 2.3 | 20 (X band) | 17 |
| PS/functionalized graphene sheets | 30 | 2.5 | 29 (X band) | 18 |
3.7 Electromagnetic interference shielding effectiveness mechanism
The contribution of absorption and reflection towards total shielding effectiveness at two different frequencies for both X and Ku bands was plotted against the rGO content (Fig. 15) to understand the EMI shielding mechanism of the prepared PP/rGO composites. It can be clearly observed that in both the X and Ku bands the absorption contribution is much higher compared to that of the reflection counterpart, in spite of varying rGO concentration. For e.g. at 9.2 GHz (X-band) the absorption contribution is ∼43 dB whereas, the reflection contribution is only ∼8 dB for 20 wt% rGO filled sample. In general the average contribution of absorption and reflection towards total shielding effectiveness in the X and Ku bands are ∼80–85 and ∼15–20 respectively. The above mentioned results clearly point to the fact that in PP/rGO system the primary shielding mechanism is absorption with not so little contribution from reflection also. It can be inferred that the present composites can be utilized as effective EM absorbers. Scientists have already established that for an EMI shielding material to showcase good EM absorption property it should possess high conductivity and high permeability.22 It has also been stated that changes in absorption contribution to total EMI SE will be more distinct than the reflection contribution with increasing electrical conductivity.22 This point is evident from our study wherein the samples with high conductivity demonstrate very high absorption contributions to total EMI SE. EMI shielding materials with good absorption contribution has the potential for applications in stealth by attenuating the EM waves to heat which is then dissipated by the shielding material possessing good thermal conductivity.22 In short, a simple green approach was utilized to fabricate PP/in situ reduced graphene oxide nanocomposites with the potential to be employed as effective EM absorbers.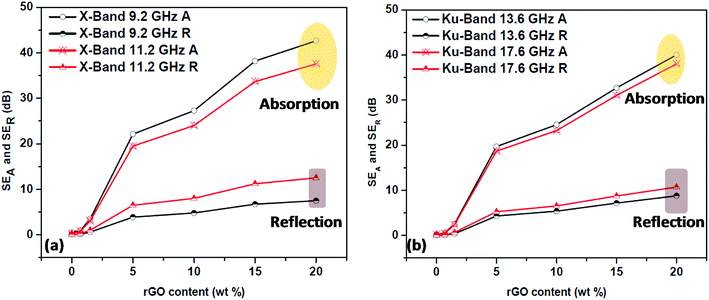 | ||
| Fig. 15 Absorption and reflection contributions to the total EMI shielding effectiveness of PP/rGO composites at two different frequencies of (a) X-Band and (b) Ku-Band. | ||
4. Conclusions
PP/in situ reduced rGO nanocomposites was successfully fabricated with exceptional rGO dispersion state via latex technology by means of simple magnetic stirring and L-ascorbic acid as the green reducing agent. The reduction of GO to rGO was confirmed using FT-IR, UV-visible, Raman and XPS spectroscopy. XRD was utilized to gain insight into the exfoliation state of rGO within the PP matrix. FE-SEM and TEM analysis was used to analyze the morphology and dispersion state of rGO in the PP matrix and were found to be uniformly distributed throughout the matrix. These results obviously point to the fact that the employed latex method (matrix in liquid form) combined with the in situ reduction via a green approach has an important part in homogenously dispersing the rGO sheets in the PP matrix which is otherwise rather very difficult to achieve at high filler loadings. The as prepared nanocomposites showcase excellent electrical properties (dielectric constant and ac conductivity) with a percolation threshold in between 1.5 and 3 wt%. The enhanced ac conductivity of the composites with increasing rGO content leads them to display excellent EMI shielding capability. The obtained EMI SE values of 50 and 48 dB for X and Ku bands respectively for the PP/rGO composites (2 mm thick) are one of the best among contemporary works where GO was used as the filler. The present PP/rGO system can be utilized as efficient EM absorbers because of the absorption mechanism dominating the reflection part. The prepared nanocomposites exhibited marginally improved thermal stability with increasing rGO content. The nanocomposites also exhibited increment in crystallization and onset crystallization temperatures due to the nucleating ability of rGO. The melting behavior on the other hand, changed from double melting performance to single melting due to the ability of rGO to specifically nucleate a particular polymorph of PP (β or hexagonal form). A green, low cost and effective approach to prepare rGO filled polymer composites with outstanding dispersion state of graphene nanosheets in the polymer matrix is proposed in this work. These prepared nanocomposites can be used as master batches which can be efficiently mixed with other polymers to prepare blends or can be mixed with PP granules itself. The as prepared polymer/rGO nanocomposites will have the potential to be used as novel dielectric and EMI shielding materials.Conflicts of interest
There are no conflicts to declare.Acknowledgements
Gejo George thankfully acknowledges the financial support by UGC in the form of Dr D. S. Kothari Postdoctoral Fellowship (No. F.4-2/2006(BSR)/CH/15-16/0211). Gejo George also gratefully acknowledges BYK Additives & Instruments for supplying us with the AQUACER 1868 samples for research purpose. Gejo George would also like to thank Mr Jacob K. Chacko, Research Scholar, SB College, Changanacherry, Kerala, India for his valuable suggestions and fruitful discussions. Gejo George would also like to thank https://www.chemix.org/ website for the help in drawing of certain parts in Fig. 1. Sanu Mathew Simon acknowledges the support in the form of DST PURSE PII (SR.417 & SR.416 dated 27.02.2017). The authors would like to also thank Sophisticated Instrumentation and Computation Centre (SICC), University of Kerala for performing XPS analysis.Notes and references
- P. Yadav, S. Rattan, A. Tripathi and S. Kumar, Mater. Res. Express, 2017, 4, 65601 CrossRef.
- S. L. Shi and J. Liang, Nanotechnology, 2008, 19, 255707 CrossRef PubMed.
- R. K. Goyal, Mater. Chem. Phys., 2013, 142, 195–198 CrossRef.
- S. Abbas, A. Dixit, R. Chatterjee and T. Goel, J. Nanosci. Nanotechnol., 2007, 7, 2129–2133 CrossRef PubMed.
- M. H. Al-Saleh, J. Phys. D: Appl. Phys., 2016, 49, 195302 CrossRef.
- W. L. Song, M. S. Cao, M. M. Lu, J. Yang, H. F. Ju, Z. L. Hou, J. Liu, J. Yuan and L. Z. Fan, Nanotechnology, 2013, 24, 115708 CrossRef PubMed.
- G. P. Kar, S. Biswas and S. Bose, Mater. Res. Express, 2016, 3, 64002 CrossRef.
- G. Mittal, V. Dhand, K. Y. Rhee, S. J. Park and W. R. Lee, J. Ind. Eng. Chem., 2015, 21, 11–25 CrossRef.
- C. Kingston, R. Zepp, A. Andrady, D. Boverhof, R. Fehir, D. Hawkins, J. Roberts, P. Sayre, B. Shelton, Y. Sultan, V. Vejins and W. Wohlleben, Carbon, 2014, 68, 33–57 CrossRef.
- M. S. Cao, X. X. Wang, W. Q. Cao and J. Yuan, J. Mater. Chem. C, 2015, 3, 6589–6599 RSC.
- M. H. Al-Saleh and U. Sundararaj, Carbon, 2009, 47, 2–22 CrossRef.
- D. X. Yan, H. Pang, B. Li, R. Vajtai, L. Xu, P. G. Ren, J. H. Wang and Z. M. Li, Adv. Funct. Mater., 2015, 25, 559–566 CrossRef.
- Z. Chen, W. Ren, L. Gao, B. Liu, S. Pei and H.-M. Cheng, Nat. Mater., 2011, 10, 424–428 CrossRef PubMed.
- X. Gui, H. Li, L. Zhang, Y. Jia, L. Liu, Z. Li, J. Wei, K. Wang, H. Zhu, Z. Tang, D. Wu and A. Cao, ACS Nano, 2011, 5, 4276–4283 CrossRef PubMed.
- X. Sun, H. Sun, H. Li and H. Peng, Adv. Mater., 2013, 25, 5153–5176 CrossRef PubMed.
- J. Liang, Y. Wang, Y. Huang, Y. Ma, Z. Liu, J. Cai, C. Zhang, H. Gao and Y. Chen, Carbon, 2009, 47, 922–925 CrossRef.
- J. Ling, W. Zhai, W. Feng, B. Shen, J. Zhang and W. ge Zheng, ACS Appl. Mater. Interfaces, 2013, 5, 2677–2684 CrossRef PubMed.
- D. X. Yan, P. G. Ren, H. Pang, Q. Fu, M. B. Yang and Z. M. Li, J. Mater. Chem., 2012, 22, 18772–18774 RSC.
- H. B. Zhang, W. G. Zheng, Q. Yan, Z. G. Jiang and Z. Z. Yu, Carbon, 2012, 50, 5117–5125 CrossRef.
- S. T. Hsiao, C. C. M. Ma, H. W. Tien, W. H. Liao, Y. S. Wang, S. M. Li and Y. C. Huang, Carbon, 2013, 60, 57–66 CrossRef.
- A. P. Singh, P. Garg, F. Alam, K. Singh, R. B. Mathur, R. P. Tandon, A. Chandra and S. K. Dhawan, Carbon, 2012, 50, 3868–3875 CrossRef.
- G. S. Kumar, D. Vishnupriya, A. Joshi, S. Datar and T. U. Patro, Phys. Chem. Chem. Phys., 2015, 17, 20347–20360 RSC.
- D. Wang, X. Zhang, J. W. Zha, J. Zhao, Z. M. Dang and G. H. Hu, Polymer, 2013, 54, 1916–1922 CrossRef.
- K. Kalaitzidou, H. Fukushima and L. T. Drzal, Composites, Part A, 2007, 38, 1675–1682 CrossRef.
- Y. Huang, Y. Qin, Y. Zhou, H. Niu, Z. Z. Yu and J. Y. Dong, Chem. Mater., 2010, 22, 4096–4102 CrossRef.
- M. C. Hsiao, S. H. Liao, Y. F. Lin, C. A. Wang, N. W. Pu, H. M. Tsai and C. C. M. Ma, Nanoscale, 2011, 3, 1516 RSC.
- Y. Li, J. Zhu, S. Wei, J. Ryu, L. Sun and Z. Guo, Macromol. Chem. Phys., 2011, 212, 1951–1959 CrossRef.
- J. Z. Xu, C. Chen, Y. Wang, H. Tang, Z. M. Li and B. S. Hsiao, Macromolecules, 2011, 44, 2808–2818 CrossRef.
- J. E. An, G. W. Jeon and Y. G. Jeong, Fibers Polym., 2012, 13, 507–514 CrossRef.
- M. El Achaby, F. E. Arrakhiz, S. Vaudreuil, A. el Kacem Qaiss, M. Bousmina and O. Fassi-Fehri, Polym. Compos., 2012, 33, 733–744 CrossRef.
- P. Song, Z. Cao, Y. Cai, L. Zhao, Z. Fang and S. Fu, Polymer, 2011, 52, 4001–4010 CrossRef.
- T. T. Li, A. P. Chen, P. W. Hwang, Y. J. Pan, W. H. Hsing, C. W. Lou, Y.-S. Chen and J. H. Lin, Mater. Manuf. Processes, 2017, 1–7 Search PubMed.
- F. E. Alam, J. Yu, D. Shen, W. Dai, H. Li, X. Zeng, Y. Yao, S. Du, N. Jiang and C. Te Lin, Polymer, 2017, 9, 662–672 Search PubMed.
- Y. S. Yun, Y. H. Bae, D. H. Kim, J. Y. Lee, I. J. Chin and H. J. Jin, Carbon, 2011, 49, 3553–3559 CrossRef.
- H. E. Miltner, N. Grossiord, K. Lu, J. Loos, C. E. Koning and B. Van Mele, Macromolecules, 2008, 41, 5753–5762 CrossRef.
- S. T. Hsiao, C. C. M. Ma, H. W. Tien, W. H. Liao, Y. S. Wang, S. M. Li, C. Y. Yang, S. C. Lin and R. B. Yang, ACS Appl. Mater. Interfaces, 2015, 7, 2817–2826 CrossRef PubMed.
- S. Fu, N. Li, K. Wang, Q. Zhang and Q. Fu, Colloid Polym. Sci., 2015, 293, 1495–1503 CrossRef.
- D. Wang, X. Zhang, J. W. Zha, J. Zhao, Z. M. Dang and G. H. Hu, Polymer, 2013, 54, 1916–1922 CrossRef.
- J. Zhang, H. Yang, G. Shen, P. Cheng, J. Zhang and S. Guo, Chem. Commun., 2010, 46, 1112–1114 RSC.
- P. Karrer, Chem. Rev., 1934, 14, 17–30 CrossRef.
- H. J. Loeffler and J. D. Ponting, Ind. Eng. Chem., Anal. Ed., 1942, 14, 846–849 CrossRef.
- M. B. Davies, D. A. Partridge and J. A. Austin, Vitamin C, The Royal Society of Chemistry, 1991 Search PubMed.
- M. Ambrosi, E. Fratini, V. Alfredsson, B. W. Ninham, R. Giorgi, P. Lo Nostro and P. Baglioni, J. Am. Chem. Soc., 2006, 128, 7209–7214 CrossRef PubMed.
- L. Lu, A. Kobayashi, K. Tawa and Y. Ozaki, Chem. Mater., 2006, 18, 4894–4901 CrossRef.
- G. S. Métraux, Y. C. Cao, R. Jin and C. A. Mirkin, Nano Lett., 2003, 3, 519–522 CrossRef.
- Y. Wang, P. H. C. Camargo, S. E. Skrabalak, H. Gu and Y. Xia, Langmuir, 2008, 24, 12042–12046 CrossRef PubMed.
- E. Andrijanto, S. Shoelarta, G. Subiyanto and S. Rifki, AIP Conf. Proc., 2016, 1725, 020003 CrossRef.
- M. J. Fernández-Merino, L. Guardia, J. I. Paredes, S. Villar-Rodil, P. Solís-Fernández, A. Martínez-Alonso and J. M. D. Tascón, J. Phys. Chem. C, 2010, 114, 6426–6432 CrossRef.
- D. Li, M. B. Müller, S. Gilje, R. B. Kaner and G. G. Wallace, Nat. Nanotechnol., 2008, 3, 101–105 CrossRef PubMed.
- S. K. Mishra, S. N. Tripathi, V. Choudhary and B. D. Gupta, Sens. Actuators, B, 2014, 199, 190–200 CrossRef.
- M. S. Dresselhaus, G. Dresselhaus, A. Jorio, A. G. Souza Filho and R. Saito, Carbon, 2002, 40, 2043–2061 CrossRef.
- K. N. Kudin, B. Ozbas, H. C. Schniepp, R. K. Prud'homme, I. A. Aksay and R. Car, Nano Lett., 2008, 8, 36–41 CrossRef PubMed.
- F. Tuinstra and J. L. Koenig, J. Chem. Phys., 1970, 53, 1126–1130 CrossRef.
- X. Zhao, Q. Zhang, D. Chen and P. Lu, Macromolecules, 2010, 43, 2357–2363 CrossRef.
- W. S. Hummers and R. E. Offeman, J. Am. Chem. Soc., 1958, 80, 1339 CrossRef.
- J. I. Paredes, S. Villar-Rodil, P. Solís-Fernández, A. Martínez-Alonso and J. M. D. Tascón, Langmuir, 2009, 25, 5957–5968 CrossRef PubMed.
- M. A. Poothanari, J. Abraham, N. Kalarikkal and S. Thomas, Ind. Eng. Chem. Res., 2018, 57, 4287–4297 CrossRef.
- R. A. Khare, A. R. Bhattacharyya and A. R. Kulkarni, J. Appl. Polym. Sci., 2011, 120, 2663–2672 CrossRef.
- S. M. Luz, J. Del Tio, G. J. M. Rocha, A. R. Gonçalves and A. P. Del'Arco, Composites, Part A, 2008, 39, 1362–1369 CrossRef.
- Y. Xu, W. Hong, H. Bai, C. Li and G. Shi, Carbon, 2009, 47, 3538–3543 CrossRef.
- J. Liang, Y. Huang, L. Zhang, Y. Wang, Y. Ma, T. Cuo and Y. Chen, Adv. Funct. Mater., 2009, 19, 2297–2302 CrossRef.
- S. Zhao, F. Chen, C. Zhao, Y. Huang, J. Y. Dong and C. C. Han, Polymer, 2013, 54, 3680–3690 CrossRef.
- K. Wakabayashi, P. J. Brunner, J. Masuda, S. A. Hewlett and J. M. Torkelson, Polymer, 2010, 51, 5525–5531 CrossRef.
- M. Aliofkhazraei, N. Ali, W. I. Milne, C. S. Ozkan, S. Mitura and J. L. Gervasoni, Graphene Science Handbook: Nanostructure and Atomic Arrangement, 2016 Search PubMed.
- F. Navarro-Pardo, J. Laria, T. Lozano, A. B. Morales-Cepeda, P. G. Lafleur, S. Sánchez-Valdés and F. Rodríguez-González, J. Appl. Polym. Sci., 2013, 130, 2932–2937 CrossRef.
- B. Yuan, C. Bao, L. Song, N. Hong, K. M. Liew and Y. Hu, Chem. Eng. J., 2014, 237, 411–420 CrossRef.
- Z. M. Dang, Y. H. Lin and C. W. Nan, Adv. Mater., 2003, 15, 1625–1629 CrossRef.
- Z. M. Dang, L. Wang, Y. Yin, Q. Zhang and Q. Q. Lei, Adv. Mater., 2007, 19, 852–857 CrossRef.
- Z. M. Dang, J. K. Yuan, J. W. Zha, T. Zhou, S. T. Li and G. H. Hu, Prog. Mater. Sci., 2012, 57, 660–723 CrossRef.
- J. Abraham, M. Arif P, P. Xavier, S. Bose, S. C. George, N. Kalarikkal and S. Thomas, Polymer, 2017, 112, 102–115 CrossRef.
- K. Prashantha, J. Soulestin, M. F. Lacrampe, P. Krawczak, G. Dupin, M. Claes and A. Tewari, Polym. Polym. Compos., 2010, 18, 489–494 Search PubMed.
- G. George, S. M. Simon, V. P. Prakashan, M. S. Sajna, M. Faisal, A. Chandran, R. Wilson, P. R. Biju, C. Joseph and N. V. Unnikrishnan, Polym. Compos., 2018, 39, E1169–E1183 CrossRef.
- P. Xu, H. Gui, Y. Hu, A. Bahader and Y. Ding, J. Electron. Mater., 2014, 43, 2754–2758 CrossRef.
- E. El Shafee, M. El Gamal and M. Isa, J. Polym. Res., 2012, 19, 9805–9812 CrossRef.
- R. V. Barde, K. R. Nemade and S. A. Waghuley, J. Australas. Ceram. Soc., 2015, 3, 116–122 CrossRef.
- P. Saini, V. Choudhary, B. P. Singh, R. B. Mathur and S. K. Dhawan, Synth. Met., 2011, 161, 1522–1526 CrossRef.
- C. W. Nan, Y. Shen and J. Ma, Annu. Rev. Mater. Res., 2010, 40, 131–151 CrossRef.
- J. M. Thomassin, C. Jérôme, T. Pardoen, C. Bailly, I. Huynen and C. Detrembleur, Mater. Sci. Eng., R, 2013, 74, 211–232 CrossRef.
- L. C. Jia, D. X. Yan, C. H. Cui, X. Jiang, X. Ji and Z. M. Li, J. Mater. Chem. C, 2015, 3, 9369–9378 RSC.
- S. R. Dhakate, K. M. Subhedar and B. P. Singh, RSC Adv., 2015, 5, 43036–43057 RSC.
- C. S. Zhang, Q. Q. Ni, S. Y. Fu and K. Kurashiki, Compos. Sci. Technol., 2007, 67, 2973–2980 CrossRef.
- M. Chen, L. Zhang, S. Duan, S. Jing, H. Jiang, M. Luo and C. Li, Nanoscale, 2014, 6, 3796–3803 RSC.
- C. L. Huang, C. W. Lou, C. F. Liu, C. H. Huang, X. M. Song and J. H. Lin, Appl. Sci., 2015, 5, 1196–1210 CrossRef.
- R. Jan, A. Habib, M. A. Akram, I. Ahmad, A. Shah, M. Sadiq and A. Hussain, Mater. Res. Express, 2017, 4, 35605 CrossRef.
- N. V. Lakshmi and P. Tambe, Compos. Interfaces, 2017, 24, 861–882 CrossRef.
- F. Shahzad, S. Yu, P. Kumar, J. W. Lee, Y. H. Kim, S. M. Hong and C. M. Koo, Compos. Struct., 2015, 133, 1267–1275 CrossRef.
Footnote |
| † Electronic supplementary information (ESI) available. See DOI: 10.1039/c8ra05007d |
| This journal is © The Royal Society of Chemistry 2018 |

