 Open Access Article
Influence from defects of three-dimensional graphene networks on the interface condition between the graphene basal plane and various resins†
Bo Tang *a,
Haiqun Chen*a,
Yunfei Sun
 b,
Mingan Lib,
Zhengwei Wanga,
Haogang Yua,
Tingting Maa and
Sen Lia
aJiangsu Key Laboratory of Oil and Gas Storage and Transportation Technology, School of Petroleum Engineering, Changzhou University, Changzhou 213016, People's Republic of China. E-mail: tangbo@cczu.edu.cn; chenhq@cczu.edu.cn
bCollege of Electronic and Information Engineering, Suzhou University of Science and Technology, Suzhou, Jiangsu 215009, People's Republic of China
First published on 3rd August 2018
Abstract
Graphene assisted thermal interface materials (TIMs) attract more and more attention because of their high thermal conductivities. However, how to improve the phonon transport ability at the interface between the graphene basal plane and the matrix is still unclear. In this study, three-dimensional graphene networks (3DGNs) with varying defect densities are fabricated by adjusting the chemical vapor deposition processes, and these specimens are adopted as fillers to modify various resins with different functional groups to reveal the interface contact rule. By optimizing the defect density of the 3DGNs, a synergy between the thermal boundary resistances of the filler and matrix and the high intrinsic thermal conductivity of the filler can be achieved in the resulting TIMs, and the epoxy group from the matrix is found to be the best active group to form a close contact between the defects of the 3DGNs. After that, the thermal performance stability of the resulting TIMs under a high temperature for a long time is detected, and the influence from increased Umklapp scattering is partially offset by the weakened Kapitza scattering. Moreover, the corresponding mechanical properties have been measured to confirm the feasibility of the resulting TIMs for practical application areas.
Introduction
In the past decade, graphene has become a star material since its first isolation in 2004 by the scotch tape approach.1–6 Because of its versatile performances in terms of electrical, optical and mechanical properties, the preparation and applications of graphene attract more and more attention.1–10 Two strategies, top-down and bottom-up, are used to prepare graphene. Therein, chemical vapor deposition (CVD) is the most popular method (bottom-up process) to fabricate high-quality graphene samples based on a precursor gas which contains carbon atoms.11,12 On the other hand, natural graphite is widely adopted as the starting material to prepare graphene with a relatively high defect density through an oxidation-reduction process (top-down process), and the product is labelled reduced graphene oxide (RGO).13–15 The specific conversion process includes graphite (oxidation reaction)–graphene oxide (reduction reaction)–RGO. Beside quality, the major distinctions between the graphene specimens by using the abovementioned two means are average size and surface functional groups. The average size of the RGO is nanometer scale, while this parameter of the graphene prepared by CVD is limited by the size of the adopted substrate. Functional groups are introduced by strong oxidants on the surface of the RGO only. With the development of graphene research, a three-dimensional (3D) structure of this material displays significant advantages in some application fields, such as graphene-based electrodes, thermal interface materials (TIMs), aerogel and composite photocatalyst et al.16–18 In these cases, graphene is anticipated to play as a network and to provide the fast transport channel for electrons and phonons (or act as a frame to provide an outstanding mechanical strength for the resulting composites).Generally, the 3D graphene networks (3DGNs) prepared by CVD method possess obvious superiority because of the high quality and naturally continuous structure compared with that of the RGO. However, we found the performances of the 3DGNs assisted TIMs and photoanodes (for dye sensitized solar cells, DSSCs) are far from expectation in some cases, which are even inferior to that of the RGO.19,20 After careful analysis, the poor interface contact between the graphene basal plane and matrix (resin for TIMs, TiO2 for photoanode) leads to the degraded performances.20 A barrier, which induces an extra thermal resistance (and electrical resistance) to the resulting composites, appears at the interface area because of the slightly active surface of the 3DGNs. On the contrary, the residual surface functional groups of the RGO (including 3DRGO) play as the bridge to promote the transport of phonons and electrons at the interface, offsetting part losing resulting from the defects of the filler, which leads to the similar performances in the resulting TIMs and photoanodes compared with these cases by using the 3DGNs samples.19–21 Recently, the total amount and type of the surface functional groups of the RGO are found that exert a remarkable influence on the interface contact, demonstrating the interface condition is sensitive to the bonding capacity of the graphene basal plane.21 In recently, the RGO and 3DGNs are employed as co-modifier to improve the thermal and electrical properties of corresponding composites by our group to full play the functions of these two fillers, and the obtained results enhance significantly.20,22 The 3DGNs provide a fast transport channel, while the RGO enhances the corresponding transport ability at the interface. However, an elaborate additional procedure is needed to combine the 3DGNs and RGO to achieve the synergy between them, restricting the widely application.
In fact, defects of the 3DGNs are proven that can act as the same role of functional groups to ameliorate the interface condition between the graphene and TiO2 particles by our recent study.23,24 Therefore, controlling the defect density of the 3DGNs by adjusting the gas flow and cool rate shows a promising potential to enhance the performance of the graphene assisted inorganic substance in the photocatalysis and DSSCs areas. Naturally, the same expectation is given to the graphene modified organic matters, such as graphene–epoxy resin (ER) based TIMs, graphene-furan resin based high tensile strength composite and graphene–PMMA resin based fungi-proofing composites.25,26 However, the corresponding research on the influence from defects of the 3DGNs on the contact between the graphene and resin organic matters is rare. In this study, the 3DGNs with a series of designed defect densities are achieved, and the as-prepared specimens are utilized to combine with ER, acrylic resin (AR) and phenolic resin (PR) to reveal the effect on the interface contact between the filler and matrix as well as the resulting thermal and mechanical performances. The interaction between the defects of the 3DGNs and these resins are studied. After optimizing the defect density of the 3DGNs, a remarkable enhancement in the thermal and mechanical properties of the resulting TIMs are achieved, implying the potential prospect of the designed 3DGNs in the thermal area.
Results and discussion
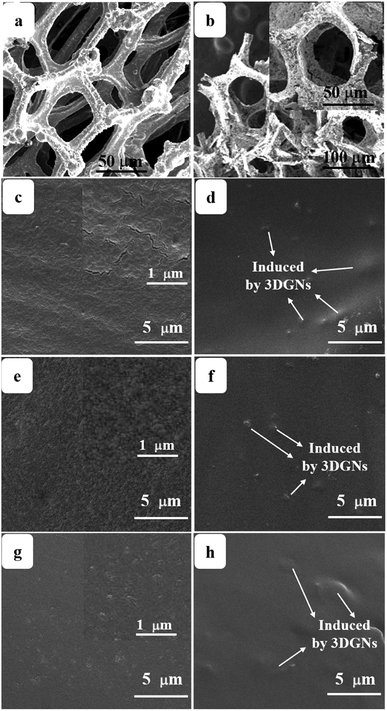
Surface morphologies of the original 3DGNs, ER, AR and PR are recorded by SEM, and the corresponding images are shown in the Fig. 1. The unsupported 3DGNs sample copies the morphology of the nickel foam template after remove the substrate (Fig. 1a and b are the samples with and without the template). Moreover, all the pristine resins display rough surfaces, and some tiny cracks (Fig. 1c, the high magnification image of the ER is shown in the inset) and pores (AR and PR, Fig. 1e and g, the corresponding high-magnification images are supplied in the insets) can be seen on the surface, respectively, leading the low thermal conductivities of these original resin (0.2 W m−1 K−1 for the ER, 0.18 W m−1 K−1 for the AR and 0.22 W m−1 K−1 for the PR). The similar surface morphologies of these pristine resins manifest that the cracks and pores form during the solidification process resulting from the evaporation of water and volatile organic compounds, which is in agreement with previous reports. After adding the 3DGNs, a remarkable change, the smooth surfaces, can be seen from the Fig. 1d, f and 1h, indicating the added filler avoiding the cracks and removing the pores of the matrix during the stir and solidification procedures. Moreover, some obvious concave-convex structure appears on the surface of the resulting composite TIMs, which results from the added 3DGNs filler. These TIMs with the more smoother surfaces display potential high thermal performances compared with that of the pristine resins.By adjusting the gas flow of methane and cool rate of substrate during the CVD growth process, the defect density of the 3DGNs can be controlled. Raman spectroscopy is widely adopted to analyze kinds of carbon allotropes including graphene, C60, carbon nanotubes and amorphous carbon, and the information such as thickness, defect density and average size of these graphite-like samples can be abstracted from the corresponding curves. There are three major fingerprint signals, G, D and 2D peaks, can be seen from the Raman patterns.27–30 Therein, the D peak, which disappears for a high-quality sample, is induced by defects of graphene specimens, and the integrity intensity is closely related to the corresponding defect density.27 The 2D peak is the two-order signal of the D peak, but it is free of defect.27 Contrarily, its occurrence demonstrates a relatively high quality of samples, which derives from a two-phonon process. Moreover, the G peak associates to the E2g phonon at the Brillouin zone center, and its position and integrity intensity reflects the charge state and thickness of the graphene, respectively.27 Based on the Raman profiles of the fabricated 3DGNs, the changed intensities of D peak manifest that the corresponding defect density is various, and the specific value can be calculated by the following method (Fig. 2). The average size of graphene basal plane is closely related to the IG/ID:27
 | (1) |
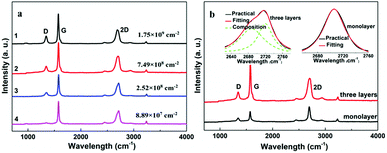 | ||
| Fig. 2 (a) Raman curves of the adopted 3DGNs, (b) the Raman curves of monolayer and three-layer specimens, the fitting of the 2D peaks are displayed in the inset. | ||
The defect density can be roughly defined as (1/L)2 in cm−2. After calculating, the defect densities of various fillers are listed in the Table 1. Furthermore, the thickness of these graphene samples can be calculated by the ratio of I2D/IG, which are proven by the shape and number of fitting peaks of the 2D peak (Fig. 2b, the monolayer and three-layer samples are prepared).27
| Samples | Parameters | ||
|---|---|---|---|
| IG/ID | Average sizes (nm) | Defect density (cm−2) | |
| 1 | 22.02 | ∼960 | 8.89 × 10⁷ |
| 2 | 14.51 | ∼630 | 2.52 × 10⁸ |
| 3 | 8.38 | ∼370 | 7.49 × 10⁸ |
| 4 | 5.51 | ∼240 | 1.75 × 10⁹ |
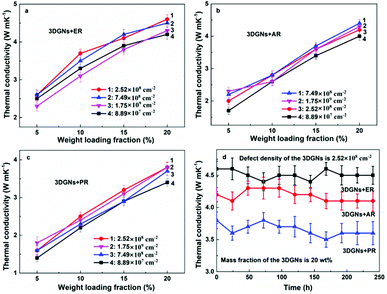
In order to reveal the influence from defect density of the 3DGNs on the thermal conductivities of the resulting TIMs, the relationship between the mass fractions of fillers and obtained thermal performances are recorded (Fig. 3a–c). Some generalities by using different resins can be found based on the resulting thermal performances. Firstly, the increase of thermal conductivity is almost in a linear way with the increased proportion of the 3DGNs for all the TIMs. Secondly, with an identical mass fraction of various fillers, the resulting thermal performances dependent on their defect densities, indicating the defects of fillers inflict a significant influence on the resulting thermal property (the difference from the resulting thermal conductivities reaches ∼15%). Although the specific data of various TIMs is discrepant, the whole tendency is consistent. As we can see, with the increased defect densities of the 3DGNs, the thermal conductivities of TIMs increase obviously at the start phase and then decrease slightly when the value excesses a certain value. Two possible reasons bring to the observed phenomenon: change of thermal contact at the interface and change of the instinct thermal conductivity of the fillers. We have found that the 3DGNs play as the fast transport network for the phonon in the TIMs. Therefore, the increased defect density of graphene samples will degrade their intrinsic thermal conductivity and enhance the thermal resistance (enhanced Umklapp scattering due to the shorten means free path of phonons).28 However, the thermal conductivities of these TIMs improve with the increased defect density of the 3DGNs at the initial phase, and the growth rates are more than 5% for all kinds of TIMs (when the defect density increases from 8.89 × 10⁷ to 2.52 × 108 cm−2). The sole reasonable explanation is the increased defects (in a proper range) ameliorate interface thermal contact between the graphene basal plane and resin matrix (weaken the Kapitza scattering), and the total effect is positive to the as-prepared TIMs. When the defect density excesses a certain value (such as 7.49 × 107 cm−2), the influence becomes negative, demonstrating the weaken Kapitza scattering cannot offset the enhanced Umklapp scattering. The inverted relationship between the resulting thermal conductivities of TIMs and the defect density of fillers is logical because the deterioration of intrinsic thermal performance of the 3DGNs is continuous with the increased defect density, while the amelioration of interface contact saturates when the defect density reaches a certain value.
In order to confirm this point of view, the thermal boundary resistances of various resins and 3DGNs with various defect densities are calculated. Based on Balandin's theory, the thermal conductivity of graphene assisted TIMs can be calculated by the following equation:29
 | (2) |
| Samples | 3DGNs-ER | 3DGNs-AR | 3DGNs-PR | |||||
|---|---|---|---|---|---|---|---|---|
| Defect density (×107 cm−2) | 8.89 | 25.2 | 175 | 8.89 | 25.2 | 74.9 | 8.89 | 175 |
| δ (×10−9 m2 K W−1) | 6.3 | 5.1 | 5.0 | 8.3 | 7.2 | 6.8 | 9.9 | 8.9 |
The interaction between the defects of the 3DGNs and functional groups of resins determines the interface contact condition of the resulting TIMs. IR curve is one of useful tools to detect kinds of vibration of chemical bonds. The corresponding profiles of the 3DGNs, pristine resins and as-prepared TIMs are shown in the Fig. 4. The adsorption band located at ∼1600 cm−1 is ascribed to the skeletal vibration of the graphene sheets, while these adsorption bands that located at ∼772 cm−1, ∼831 cm−1, ∼1390 cm−1, ∼3000 cm−1 and ∼3380 cm−1 are caused by the rocking of –CH2, stretching of C–O–C, deformation of C–H, and stretching of C–H and C–OH from the curve of the ER.30–32 As for the AR and PR, the corresponding adsorption peaks are labeled in the curves, and the major signals includes vibrations of –C–H (∼2971 cm−1), C![[double bond, length as m-dash]](https://www.rsc.org/images/entities/char_e001.gif) O (∼1730 cm−1), C
O (∼1730 cm−1), C![[double bond, length as m-dash]](https://www.rsc.org/images/entities/char_e001.gif) C (∼1410 cm−1), C–O (∼1250 cm−1 and 1170 cm−1) and C–O–C (∼1250 cm−1, ∼1190 cm−1 and ∼1150 cm−1) for the AR and vibrating of O–H (∼3300 cm−1), C
C (∼1410 cm−1), C–O (∼1250 cm−1 and 1170 cm−1) and C–O–C (∼1250 cm−1, ∼1190 cm−1 and ∼1150 cm−1) for the AR and vibrating of O–H (∼3300 cm−1), C![[double bond, length as m-dash]](https://www.rsc.org/images/entities/char_e001.gif) O (∼1650 cm−1), C
O (∼1650 cm−1), C![[double bond, length as m-dash]](https://www.rsc.org/images/entities/char_e001.gif) C (∼1600 cm−1), –CH2 (∼1450 cm−1 and ∼1360 cm−1) and C–O (∼1000 cm−1) for the PR.33,34 After the combination of the 3DGNs with various resins, some changes can be found in the IR patterns. The signal band belongs to epoxy groups of the ER weakens remarkably (marked by dotted line circle in the Fig. 4), while no obvious change can be seen from the curves of the AR and PR. The observed results manifest that a relatively stronger chemical bond forms between the 3DGNs and the ER (through the epoxy groups of the ER rather than the hydroxyl and carboxyl groups of the AR and PR). The 3DGNs grow by the methane gas under a hydrogen atmosphere, and the dangling bond of carbon atoms at the defect areas will be occupied by hydrogen atoms. Therefore, the reducibility of C–H band is activated to react with oxidizing epoxy groups of the ER rather than carboxyl groups and hydroxyl groups under the high temperature during the solidification process (the XPS curves also prove this point.4 Therefore, ER is a proper selection for the matrix when the defected 3DGNs is adopted as the thermal filler.
C (∼1600 cm−1), –CH2 (∼1450 cm−1 and ∼1360 cm−1) and C–O (∼1000 cm−1) for the PR.33,34 After the combination of the 3DGNs with various resins, some changes can be found in the IR patterns. The signal band belongs to epoxy groups of the ER weakens remarkably (marked by dotted line circle in the Fig. 4), while no obvious change can be seen from the curves of the AR and PR. The observed results manifest that a relatively stronger chemical bond forms between the 3DGNs and the ER (through the epoxy groups of the ER rather than the hydroxyl and carboxyl groups of the AR and PR). The 3DGNs grow by the methane gas under a hydrogen atmosphere, and the dangling bond of carbon atoms at the defect areas will be occupied by hydrogen atoms. Therefore, the reducibility of C–H band is activated to react with oxidizing epoxy groups of the ER rather than carboxyl groups and hydroxyl groups under the high temperature during the solidification process (the XPS curves also prove this point.4 Therefore, ER is a proper selection for the matrix when the defected 3DGNs is adopted as the thermal filler.
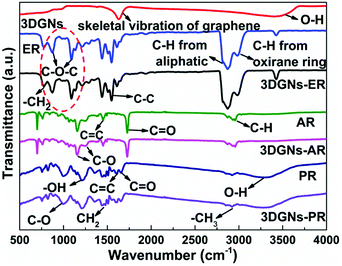 | ||
| Fig. 4 IR patterns of the 3DGNs, pristine resins and resulting composite TIMs, the origins of the absorption bands are marked. | ||
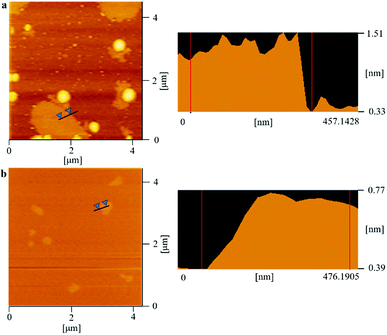
As we know, the electrical and thermal properties of graphene are deeply dependent on its thickness. Therefore, the influence from the thickness of the utilized fillers on the resulting thermal conductivities of the 3DGNs-ER is studied. By adjusting the cooling rate of nickel substrate, the 3DGNs with a selective thickness can be achieved. Fig. 5 shows AFM images of the 3DGNs with monolayer and three-layer structures, and the specific thicknesses are ∼0.7 nm and ∼1.5 nm (Fig. 5a and b, an additional ∼0.3 nm thickness induces by mica substrate). By using these fillers, the thermal performances of the as-prepared TIMs are recorded. For all the three kinds of composites, no obvious degradation of the thermal conductivities can be found when the thickness of the 3DGNs increase from monolayer to multilayer, indicating the influence from the thickness of the fillers can be ignored (Table S1 in the ESI†). The result implies that the primary thermal resistances, which acts as the crucial factor for the obtained thermal conductivity, of these TIMs results from the interface area (all the defects of 3DGNs almost locate at the surface for the monolayer and three-layer specimens). In the practical cases, the electron devices need continuous working for a long time. Therefore, the stability of thermal performance of the TIMs is quite important. The changes of thermal conductivities of these as-prepared composites with a long working time are shown in the Fig. 3d (the defect density and mass fraction of the 3DGNs are 2.52 × 108 cm−2 and 20 wt%), and no remarkable change can be found, indicating their high stability. Moreover, the corresponding stability of the 3DGNs-ER samples with various 3DGNs fillers under a high temperature for a long time are also measured, and the decrease of the thermal conductivities less than 10% when the temperature is raised to 340 K and kept for 10 days, demonstrating the potential for the practical application (Fig. 6). The phenomenon also manifests that the interface contact condition is stable during a wide temperature range. In fact, the phonon transport ability enhances at the interface because of the weaken Kapitza scattering under a high temperature.
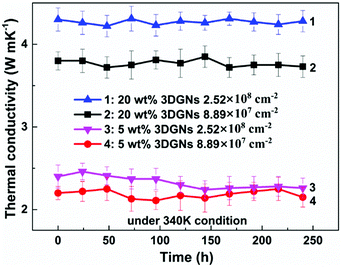 | ||
| Fig. 6 The stability of thermal property of the 3DGNs-ER under 340 K condition with a working period. | ||
Beside an outstanding thermal performance, the mechanical properties of the TIMs are also momentous to the possible industrialization. The stress–strain curve is a popular criterion to judge the mechanical property of composite materials. As for the 3DGNs-ER samples (the mass fractions of the filler include 5 wt% and 10 wt%), the ultimate strengths increase by a factor of 1.04 and 1.26 compared with that of the original resin, demonstrating an excellent mechanical flexibility (Table 3). Similarly, the 3DGNs assisted AR and PR display the high level of mechanical properties after the combination, even higher than that of the pristine matrixes (10 wt% 3DGNs added samples). Moreover, the stretching limits, another important parameter for the TIMs, of these resulting composites are also recorded. After employing the 3DGNs filler (10 wt%), the avulsion of ER, AR and PR increase from 220%, 200% and 105% to 280%, 240% and 115% (deformation), showing a significant enhancement to the ruggedness of the matrixes (Table 3). These obtained results indicate that the continuous construction of the 3DGNs maintains a high intrinsic mechanical performance and inflicts a positive influence on the resulting TIMs, which is in agreement with the previous reports.4,21 According to the studies of Zhang group, Li group and our group,4,19,35,36 the mechanical performances display slight degradation when the RGO filler is adopted, manifesting the 3DGNs with a well-designed defect density is the more proper filler both for the high thermal and mechanical performances of the resulting TIMs.
| Samples | Parameters | |||
|---|---|---|---|---|
| 5 wt% | 10 wt% | |||
| Ultimate strength (%) | Stretching limit (%) | Ultimate strength (%) | Stretching limit (%) | |
| Pristine ER | 100 | 220 | 100 | 220 |
| 3DGNs-ER | 104 | 260 | 126 | 280 |
| Pristine AR | 100 | 200 | 100 | 200 |
| 3DGNs-AR | 102 | 230 | 118 | 240 |
| Pristine-PR | 100 | 105 | 100 | 105 |
| 3DGNs-PR | 100 | 110 | 105 | 115 |
Experimental
Materials
Nickel foam with a 300 m2 g−1 BET area and 12 mm in thickness was purchased from Haobo Co., Ltd. (Shenzhen, China) and used as a template to fabricate the 3DGNs. The ER and curing agent were obtained commercially from Sanmu Co. Ltd. (Suzhou, China). AR and PR were purchased from Yufan Co. Ltd (Shanghai, China) and Dinghe Co. Ltd (Shanghai, China), respectively. The ethanol, hydrochloric acid and polymethyl methacrylate (PMMA, average molecular mass 996![[thin space (1/6-em)]](https://www.rsc.org/images/entities/char_2009.gif) 000, 4% in ethyl lactate) were obtained commercially from the Beijing chemical reagent plant (Beijing, China).
000, 4% in ethyl lactate) were obtained commercially from the Beijing chemical reagent plant (Beijing, China).
Preparation
The preparation of the 3DGNs samples with varied defect densities has been reported in our previous study.23 Briefly, Nickel foam was heated to 1100 °C under Ar (300 sccm) and H2 (150 sccm) atmosphere with a 20 °C min−1 heating rate in a tube furnace to reduce the grain boundary of the substrate. Then, a small amount of CH4 (2, 5, 10, 15 sccm) was introduced for 2 min. After that, samples were cooled down to room temperature under Ar (300 sccm) and H2 (200 sccm) atmosphere, and the cooling rates are 8, 5, 2 and 1 °C s−1, respectively. The preparation of composite TIMs has been described by our recent report.4,19,20 Briefly, a certain amount of 3DGNs was put into a mold, and then the ER including curing agent was dropped on the 3DGNs surface. After dropping a layer of ER (3DGNs were covered), some 3DGNs was added again. The two steps are repeated for three or four times. The dropped ER penetrates into the 3DGNs easily because of the porosity of the 3DGNs. Finally, the 3DGNs–ER mixture was cured at 110 °C for 5 h. The preparation of the 3DGNs-AR and 3DGNs-PR is similar with that of the 3DGNs-ER.Characterization
Morphological images were recorded by a scanning electron microscope (SEM, FEI Sirion 200 working at 5 kV). Raman spectra were obtained by the LabRam-1B Raman microspectrometer at 532 nm. AFM results were recorded by E-Sweep (Seiko, Japan) in tapping mode. Infrared spectroscopy (IR) curves were measured on an IR Prestige-21 system. Laser flash analysis and differential scanning calorimetry (Diamond DSC, PerkinElmer) were used to obtain the thermal performance of the composites. Mechanical properties of these composites were recorded by a Triton DMTA (Triton Instrument, UK) instrument.Conclusions
3DGNs with various defect densities are prepared by adjusting the gas flow and cooling rate during the growth process, and the as-prepared samples are used to combine with kinds of resins to reveal the influence on the interface contact between the filler and matrix from the surface defects of the 3DGNs. Based on the practical thermal performances and corresponding calculations, the thermal boundary resistance is closely related to the defect density of the 3DGNs, and a moderate defect density endows a promoted phonon transport ability at the interface area. According to the corresponding IR curves, a stronger chemical bond will form between the epoxy groups rather than carboxyl and hydroxyl groups with surface defects of the 3DGNs (C–H reacts with the epoxy group during the solidification process). Therefore, the ER displays a better potential than the AR and PR as a matrix for the TIMs when the 3DGNs is adopted as the fillers. The resulting composites possess well stabilities after a long working time under a high temperature. Moreover, the mechanical properties including ultimate strengths and stretching limits are detected, and all the TIMs show outstanding performances because of the continuous structure of the 3DGNs and the well interface contact between the filler and matrix.Conflicts of interest
There are no conflicts to declare.Acknowledgements
This work was supported by the National Natural Science Foundation of China (51506012, 51472035, 51572036, 51671037, 51706023), Natural Science Foundation of Jiangsu Province (BK20150266), the Science and Technology Department of Jiangsu Province (BY2016029-12, BY2015027-18), Changzhou key laboratory of graphene-based materials for environment & safety (CM20153006, CE20160001-2).Notes and references
- K. S. Novoselov, A. K. Geim, S. V. Morozov, D. Jiang, Y. Zhang, S. V. Dubonos, I. V. Grigorieva and A. A. Firsov, Science, 2004, 306, 666–669 CrossRef PubMed.
- J. C. Wei, T. Vo and F. Inam, RSC Adv., 2015, 5, 73510–73524 RSC.
- P. S. Zong, J. F. Fu, L. Y. Chen, J. T. Yin, X. Dong, S. Yuan, L. Y. Shi and W. Deng, RSC Adv., 2016, 6, 10498–10506 RSC.
- B. Tang, G. X. Hu, H. Y. Gao and L. Y. Hai, Int. J. Heat Mass Transfer, 2015, 85, 420–429 CrossRef.
- B. Tang, G. J. Ji, Z. W. Wang, H. Q. Chen, X. F. Li, H. G. Yu, S. Li and H. Liu, RSC Adv., 2017, 7, 45280–45286 RSC.
- S. K. Mishra, M. U. Kahaly and M. Shikha, Int. J. Therm. Sci., 2017, 121, 358–368 CrossRef.
- B. Tang and G. X. Hu, J. Power Sources, 2013, 234, 60–68 CrossRef.
- M. K. Kyung and C. B. In, Int. J. Therm. Sci., 2016, 100, 346–356 CrossRef.
- B. Tang, P. F. Zhou and D. W. Wu, J. Changzhou Univ., Nat. Sci. Ed., 2017, 29, 48–54 Search PubMed.
- W. L. Xiong, Y. Chen, M. Hao, L. Zhang, T. Mei, J. Y. Wang, J. H. Li and X. B. Wang, Appl. Therm. Eng., 2015, 91, 630–637 CrossRef.
- B. Tang and G. X. Hu, J. Phys. Chem. C, 2013, 117, 25175–25184 CrossRef.
- Z. P. Chen, C. W. Ren, L. B. Gao, B. L. Liu, S. F. Pei and H. M. Cheng, Nat. Mater., 2011, 10, 424–428 CrossRef PubMed.
- G. X. Hu and B. Tang, Mater. Chem. Phys., 2013, 138, 608–614 CrossRef.
- B. Tang and G. X. Hu, J. Power Sources, 2012, 220, 95–102 CrossRef.
- Q. Q. Zhai, B. Tang and G. X. Hu, J. Hazard. Mater., 2011, 198, 78–86 CrossRef PubMed.
- B. Tang, S. L. Wang, J. Zhang, Z. W. Wang, Y. F. He and W. Q. Huang, Int. Mater. Rev., 2018, 63, 204–225 CrossRef.
- B. Tang, H. Q. Chen, H. P. Peng, Z. W. Wang and W. Q. Huang, Nanomaterials, 2018, 8, 105–131 CrossRef PubMed.
- L. Wei, Z. Chen, L. J. Zheng and Q. H. Yang, J. Phys. Chem. Lett., 2015, 6, 658–668 CrossRef PubMed.
- Y. F. Sun, B. Tang, W. Q. Huang, S. L. Wang and Z. W. Wang, Appl. Therm. Eng., 2016, 103, 892–900 CrossRef.
- B. Tang, Z. W. Wang, W. Q. Huang, S. Li, T. T. Ma, H. G. Yu and X. F. Li, Nanoscale Res. Lett., 2017, 12, 527–533 CrossRef PubMed.
- Y. F. Sun, Y. F. He, B. Tang, J. M. Ban, C. B. Tao and L. Jiang, RSC Adv., 2017, 7, 55790–55795 RSC.
- Y. F. Sun, Y. C. Cao, W. Q. Huang, J. M. Ban, C. B. Tao and B. Tang, Mater. Lett., 2016, 165, 178–180 CrossRef.
- B. Tang, H. Q. Chen, Y. F. He and Z. W. Wang, Compos. Sci. Technol., 2017, 150, 54–64 CrossRef.
- J. Zhang, S. Li, B. Tang, Z. W. Wang, G. J. Ji, W. Q. Huang and J. P. Wang, Nanoscale Res. Lett, 2017, 12, 457–461 CrossRef PubMed.
- C. Li, S. F. Li and S. L. Yan, RSC Adv., 2016, 6, 62572–62578 RSC.
- V. S. Nagarajan and S. Jahanmir, Dent. Mater., 2004, 20, 63–72 CrossRef PubMed.
- B. Tang, G. X. Hu and H. Y. Gao, Appl. Spectrosc. Rev., 2010, 45, 369–407 CrossRef.
- Q. Hao, Y. Xiao and H. B. Zhao, Appl. Therm. Eng., 2017, 111, 1409–1416 CrossRef.
- M. F. Khan and A. A. Balandin, Nano Lett., 2012, 12, 861–867 CrossRef PubMed.
- R. Z. Zhang and W. Chen, J. Mater. Chem. A, 2013, 1, 11457–11464 RSC.
- B. Neumann, P. Bogdanoff and H. Tributsch, J. Phys. Chem. B, 2005, 109, 16579–16586 CrossRef PubMed.
- Q. Xiao, J. Zhang and C. Xiao, Sol. Energy, 2008, 82, 706–713 CrossRef.
- C. M. Pedro, L. F. José and F. G. Marta, J. Appl. Polym. Sci., 2011, 120, 2167–2173 Search PubMed.
- Q. Han, D. P. Li, X. P. Li, X. W. Peng and D. P. Zhang, Int. J. Adhes. Adhes., 2017, 77, 72–77 CrossRef.
- L. X. Zhang, H. Q. Jiao, H. F. Jiu, J. X Chang, S. M. Zhang and Y. N. Zhao, Composites, Part A., 2016, 90, 286–295 CrossRef.
- P. Li, Y. Zheng, T. Shi, Y. Wang and M. Li, Carbon, 2016, 96, 40–48 CrossRef.
Footnote |
| † Electronic supplementary information (ESI) available. See DOI: 10.1039/c8ra04932g |
| This journal is © The Royal Society of Chemistry 2018 |

