DOI:
10.1039/C8RA04668A
(Paper)
RSC Adv., 2018,
8, 31717-31724
Organic solvent extraction-assisted catalytic hydrothermal liquefaction of algae to bio-oil†
Received
31st May 2018
, Accepted 16th August 2018
First published on 12th September 2018
Abstract
In this paper, we report our investigation into a two-step method of transformation of algae to bio-oil. Elemental analysis, gas chromatography-mass spectrometry and Fourier transform infrared spectroscopy were used to analyze bio-oil. First, organic solvent Soxhlet extraction and reflux extraction were used in the algal extraction step. Ethanol was proven to be the best solvent, and the addition of MgSO4 could transform acids to esters. In MgSO4 extraction oil, the yield of hexadecanoic acid ethyl ester was as high as 48.40%. Then, the residual algae powders through the catalytic hydrothermal liquefaction process were converted to bio-oil. Commercialized noble metal catalysts Pd/C, Pt/C, Ru/C and Rh/C combined with Pd/HZSM-5 were used in the second step. Rh/C performed the best in the catalytic hydrothermal liquefaction process, and the highest bio-oil yield of 50.98% and HHV of 30.67 MJ kg−1 were achieved. The oil yield through two steps was higher than that by a direct decomposition step. Also, the two-step method could achieve a higher energy conversion ratio of 85.61% and total energy of 81.09 kJ.
1 Introduction
With the consumption of traditional fossil energy, biofuels are attracting increasing attention worldwide.1 As a promising third-generation bio-energy source, algae have excellent advantages compared to the first- and second-generation sources: higher photosynthesis efficiency, lipid content, growth rate, and cultivability on saline-alkali land.2,3 Compared to other algae conversion methods, catalytic hydrothermal liquefaction (HTL) has become an effective method to reduce energy consumption and heterogeneous atom content due to elimination of complicated drying processes.4,5 Moreover, commercialized noble metal catalysts such as Pd/C,6 Pt/C,7 Rh/C and Ru/C8 are widely used and exhibit excellent performance in biomass conversion processes. However, in algae conversion processes, there are still several problems in one-step methods such as low oil yield, high coke yield and low algae utilization ratio.9
Algae cells have the potential to rapidly accumulate lipids and thus, organic solvent extraction methods at low temperature are used to obtain organic acids and other high-value products. Related research has been concentrated on the optimization of different experimental conditions for effective product generation. For instance, different extraction methods such as Soxhlet extraction, reflux extraction, and Halim (HP) and Bligh and Dyer (BD) have been used in algae powder extraction processes.10–12 Large amounts of saturated and unsaturated organic acids were obtained. It is well-known that acids in bio-oil can reduce oil quality, and the obtained bio-oil cannot be used directly; however, until now, this problem is still unsolved. Besides, the bio-oil yield from extraction processes is low and does not exceed 25%.13 There are many useful compounds in the residual algae powder. However, there has been no report to date on the utilization of residual algae powder in extraction processes. Thus, the maximum utilization of algae has become a research focus.
In this study, a two-step method combining solvent extraction with HTL process was used as the algae transformation process. First, several organic solvents and two methods (Soxhlet extraction (SE) and reflux extraction (RE)) were used in the algae extraction step. Then, the residual algae powder through the catalytic HTL process was used to generate bio-oil. Besides, a direct algae catalytic HTL process was used to compare the effects between the one-step method and the two-step method. Elemental analysis (EA), gas chromatography-mass spectrometry (GC-MS) and Fourier transform infrared spectroscopy (FTIR) were used to analyze bio-oil quality, which proved that the two-step method could provide higher oil yield and better bio-oil quality than the one-step method. Also, Rh/C was proved to have the best catalytic effect in the algae conversion process.
2 Materials and methods
2.1. Materials
Spirulina was purchased from Fuqing Xindaze Spirulina Co. Composition and results of the elemental analysis are listed in Table 1. Dichloromethane (DCM), formic acid (HCOOH, 98%), palladium nitrate [Pd(NO3)2], and Pd/C, Pt/C, Rh/C and Ru/C (all elemental content of 5%) were purchased from Sinopharm Chemical Reagent Co. Ltd. Absolute ethanol and anhydrous magnesium sulfate (MgSO4) were purchased from Shanghai Chemical Reagent Co. Ltd. All reagents were analytically pure (AR grade) and used directly without any purification.
Table 1 Bio-oil yield and element analysis of bio-oil, algae and PRE algae after MgSO4 extraction
| |
Oil yield/% |
C/% |
H/% |
N/% |
O/% |
Ash/% |
HHV/MJ kg−1 |
| MgSO4 extraction bio-oil |
10.14 |
73.71 |
9.86 |
0.88 |
25.55 |
— |
36.42 |
| Algae |
— |
46.03 |
7.07 |
10.33 |
29.69 |
6.88 |
19.55 |
| PRE algae |
— |
42.34 |
7.15 |
10.65 |
33.11 |
6.75 |
17.84 |
2.2. Experimental procedure
2.2.1. Synthesis of Pd/HZSM-5. HZSM-5 (Si/Al ratio of 80) was synthesized according to our previous method.9 An aqueous solution of Pd(NO3)2 (0.6 g, 15 mg g−1) and 0.3 g of HZSM-5 were added to a beaker with 10 ml of water. The mixture was stirred at room temperature for 24 h. Then, the solution was placed in an oven at 120 °C for 10 h. The dry powder was washed with water and filtered. After filtering, the catalyst was calcined in H2 at 400 °C for 4 h.
2.2.2. Extraction procedure. Five g algae and a certain amount of solvent were added in a flask with a condensate pipe or a Soxhlet extractor. Then, the flask was heated to the setting temperature. After the reaction was completed, the products were filtered, and the liquid was evaporated at 60 °C to remove the solvent; then, the bio-oil product was obtained. For MgSO4 extraction, 5 g algae, 5 g MgSO4 and 100 ml ethanol were added in a flask. After reaction was completed, the products were filtered; the liquid was evaporated at 60 °C to remove the solvent, and the solid was added to a beaker with 100 ml water. After 20 min ultrasonic treatment, the solid was filtered and dried at 50 °C under vacuum conditions. The residual algae were named as PRE algae, which indicated that the samples were pretreated algae. After MgSO4 extraction, we obtained 4.1 g PRE algae (yield 82%). EA results of PRE algae and oil yield and EA results of bio-oil after MgSO4 extraction are also shown in Table 1.
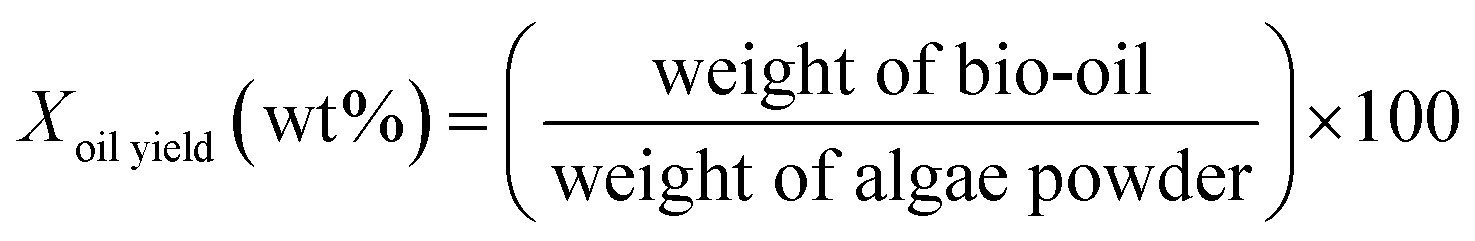
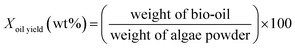
2.2.3. Hydrothermal liquefaction. A 304-stainless steel reactor with a volume of 30 mL was purchased from the Yantai Muping Shuguang precision instrument factory. Algae (0.5 g), HCOOH, water, and 0.01 g of the catalyst were added to the reactor. Then, the reactor was placed in a salt bath consisting of sodium nitrite, sodium nitrate, and potassium nitrate in the mass ratio 40![[thin space (1/6-em)]](https://www.rsc.org/images/entities/char_2009.gif) :7:53.14 The reaction was conducted at 380 °C for 2 h. After it was completed, the reactor was quenched with cool water for 40 min. DCM (150 ml) and absolute ethanol (50 ml) were used to wash the reactor so that all the products could be washed out. The mixture was filtered by a membrane with an aperture of 0.45 μm. After filtering, the solution was dried with 2 g of MgSO4. After another membrane filtration, the solvent was evaporated at 60 °C, and the bio-oil product was obtained. Each experiment was repeated twice, and the average values of the oil yields were reported. The experimental procedures are illustrated in Fig. 1, and the formulas for the oil and coke yields are given as follows:
:7:53.14 The reaction was conducted at 380 °C for 2 h. After it was completed, the reactor was quenched with cool water for 40 min. DCM (150 ml) and absolute ethanol (50 ml) were used to wash the reactor so that all the products could be washed out. The mixture was filtered by a membrane with an aperture of 0.45 μm. After filtering, the solution was dried with 2 g of MgSO4. After another membrane filtration, the solvent was evaporated at 60 °C, and the bio-oil product was obtained. Each experiment was repeated twice, and the average values of the oil yields were reported. The experimental procedures are illustrated in Fig. 1, and the formulas for the oil and coke yields are given as follows:| |
 | (1) |
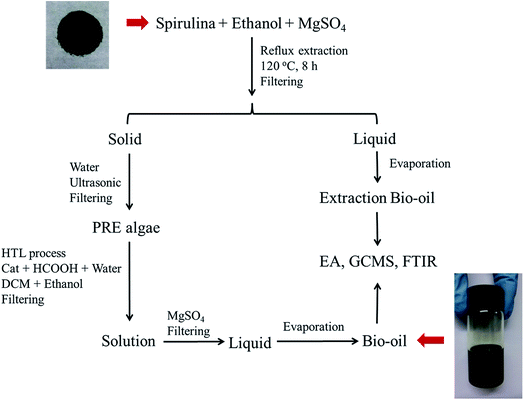 |
| | Fig. 1 Experimental procedure for obtaining bio-oil (HTL = hydrothermal liquefaction, DCM = dichloromethane, and Cat = catalyst). | |
2.3. Characterization techniques
2.3.1. Elemental analysis. The elemental compositions (C, H, and N) of spirulina and bio-oil were determined using a Vario EL III instrument. For each experiment, the oils obtained from two parallel experiments were mixed to obtain the results. HHV was estimated using the Dulong formula:8| | |
HHV (MJ kg−1) = 0.338C + 1.423H − 0.154O − 0.145N,
| (2) |
Here, C, H, N, and O are the weight percentages of each atom in the bio-oil.
2.3.2. GC-MS analysis. GC-MS analysis was performed using an Agilent Technologies 7890A-5975C instrument equipped with an auto-sampler and auto-injector. An Agilent HP-5MS column was used to separate the constituents. One microliter of bio-oil solution with the DCM solvent was injected into the column. To protect the filament, 3 min solvent delay was necessary. The column temperature was initially held at 40 °C for 3 min; it was then ramped up to 250 °C at 4 °C min−1 and held for 10 min with a detection time of 65.5 min. The analysis time was long enough to separate all the constituents. Helium served as the carrier gas. Wiley mass spectral library was used to identify all the compounds. For each experiment, the oils obtained from two parallel experiments were mixed to obtain the GC-MS sample.
2.3.3. FTIR analysis. Fourier transform infrared spectra (FTIR) were recorded on a PerkinElmer Spectrum One FT-IR spectrometer at room temperature with KBr pellets (4000–400 cm−1, resolution of 1 cm−1).
3 Results and discussion
3.1. Effects of algae extraction
First, two extraction methods (RE and SE) were applied in algae extraction experiments. For each method, nine solvents (dichloromethane (DCM), ethanol, ether, acetonitrile, tetrahydrofuran (THF), ethyl acetate, petroleum ether (PE), toluene and acetone) were used. Oil yields with element analysis and GCMS results are shown in Table 2. In Table 2, for each solvent, RE and SE were found to have no significant difference in oil yield and oil quality. Also, the effect of temperature was not clear; oil yield and quality were mainly influenced by different solvents. PE (SE) exhibited the highest hydrocarbon content and HHV of 39.30 MJ kg−1 as it can dissolve more hydrocarbons due to its similar structure, but the oil yield was only 2.02% (Table 2, Entry 7). Ethanol (RE) obtained the lowest HHV, because both the total acid and n-hexadecanoic acid yields were the highest. At the same time, ethanol (RE) exhibited the highest oil yield (Table 2, Entry 11). Thus, ethanol (RE) was chosen to be the best solvent for algae extraction.
Table 2 Properties of extracted bio-oils by Soxhlet extraction and Reflux extraction
| Method |
Entry |
Solvent |
Temperature/oC |
Oil yield/% |
Hydrocarbons/% |
Heptadecane/% |
Total acids/% |
n-Hexadecanoic acid/% |
HHV/MJ kg−1 |
| Soxhlet extraction |
1 |
DCM |
70 |
5.62 |
49.96 |
22.73 |
38.84 |
20.23 |
34.02 |
| 2 |
Ethanol |
120 |
8.15 |
34.76 |
26.78 |
49.77 |
22.85 |
29.59 |
| 3 |
Ether |
60 |
1.11 |
39.75 |
30.21 |
36.12 |
19.50 |
31.48 |
| 4 |
Acetonitrile |
140 |
8.39 |
34.94 |
23.17 |
48.76 |
22.31 |
25.66 |
| 5 |
THF |
110 |
7.78 |
21.97 |
14.36 |
23.43 |
10.75 |
32.56 |
| 6 |
Ethyl acetate |
130 |
5.34 |
31.53 |
22.80 |
48.24 |
22.37 |
33.75 |
| 7 |
PE |
120 |
2.02 |
65.31 |
35.94 |
28.43 |
15.46 |
39.30 |
| 8 |
Toluene |
155 |
6.22 |
33.89 |
17.89 |
41.26 |
18.22 |
34.15 |
| 9 |
Acetone |
100 |
5.44 |
32.46 |
22.13 |
46.10 |
20.44 |
33.55 |
| Reflux extraction |
10 |
DCM |
70 |
4.98 |
53.74 |
29.02 |
35.28 |
19.76 |
33.31 |
| 11 |
Ethanol |
120 |
10.14 |
32.85 |
20.20 |
53.36 |
24.33 |
29.36 |
| 12 |
Ether |
60 |
1.08 |
43.24 |
25.85 |
32.62 |
17.31 |
35.82 |
| 13 |
Acetonitrile |
140 |
5.60 |
32.16 |
21.72 |
48.69 |
22.46 |
32.00 |
| 14 |
THF |
110 |
7.94 |
48.67 |
9.81 |
17.41 |
8.89 |
38.83 |
| 15 |
Ethyl acetate |
130 |
5.01 |
30.23 |
21.81 |
49.31 |
22.15 |
33.80 |
| 16 |
PE |
120 |
2.25 |
52.01 |
33.94 |
32.39 |
16.28 |
35.46 |
| 17 |
Toluene |
155 |
5.96 |
35.71 |
20.52 |
44.85 |
20.17 |
34.55 |
| 18 |
Acetone |
100 |
5.88 |
32.21 |
20.08 |
39.97 |
18.35 |
32.53 |
3.2. Results of extraction method optimization
In previous algae extraction experiments, solvent volume was too large to ensure that all constituents can be extracted; also, the extraction time was too long. In this section, different solvent volumes and reaction times were investigated; the results are shown in Fig. 2. First, the effect of different solvent volumes was studied (Fig. 2a). In Fig. 2a, it is revealed that when the ethanol volume was 100 ml, the oil yield reached to 9.94%. However, more ethanol had negligible effect on oil yield and thus, 100 ml was chosen as the best extraction volume. When the reaction time was prolonged from 2 h to 8 h, the oil yield increased from 8.86% to 10.36%, and prolonging the reaction time resulted in decreased oil yield. Thus, the best extraction conditions were 100 ml ethanol and 8 h.
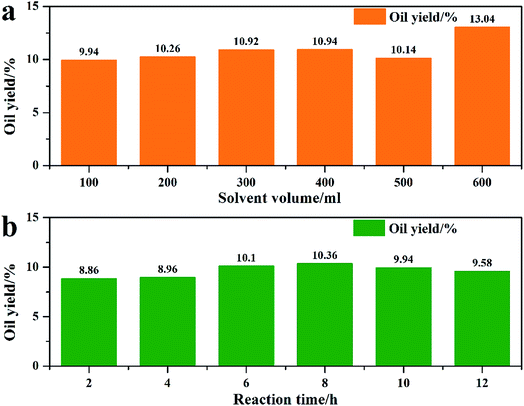 |
| | Fig. 2 Reaction condition optimization of the ethanol extraction process. ((a) reaction condition: 5 g algae + ethanol, 120 °C reflux extraction 10 h; (b) reaction condition: 5 g algae + 100 ml ethanol, 120 °C reflux extraction). | |
3.3. Results of dehydration
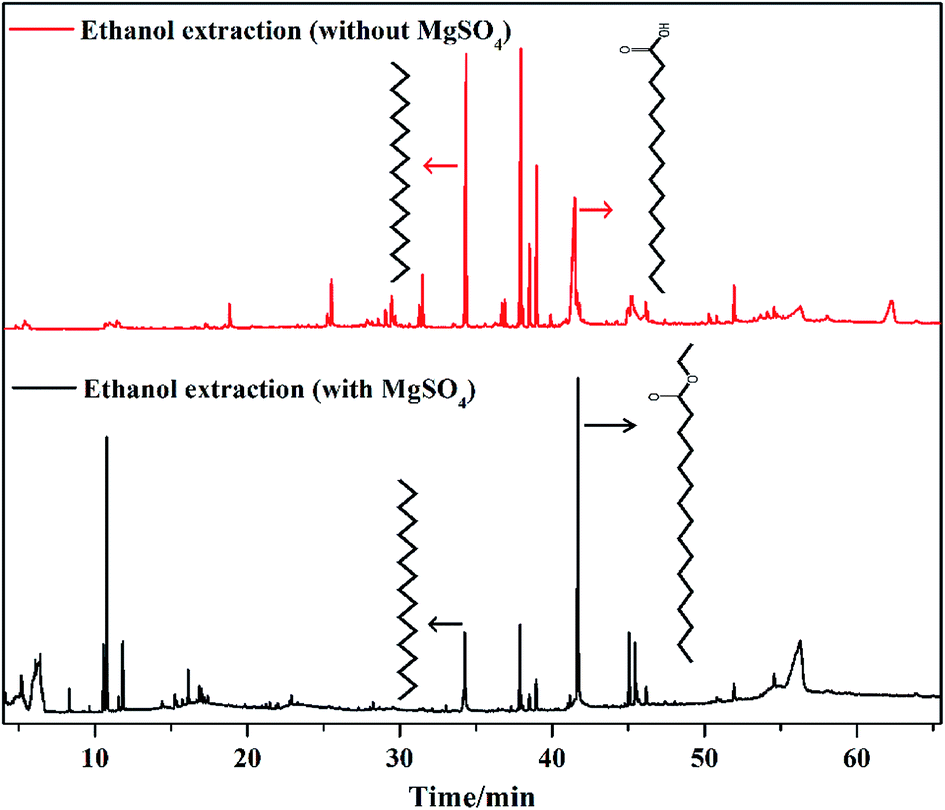
In ethanol-extracted oil, total acid content reached 28.21% and n-hexadecanoic acid content was 19.33% (Table S1†). Considering that the extraction solvent is ethanol and MgSO4 can absorb water, MgSO4 was added in the reaction system to remove water from the esterification reaction between n-hexadecanoic acid and ethanol, which promoted the formation of hexadecanoic acid ethyl ester. In this process, 5 g MgSO4 was added to the flask, and the reaction conditions were also 100 ml ethanol and 8 h. After MgSO4 extraction, n-hexadecanoic acid was not detected in the bio-oil obtained by extraction. However, at the same time, the bio-oil contained 48.40% hexadecanoic acid ethyl ester (Table S2†). This proved that MgSO4 could absorb water effectively, which resulted in complete esterification. Also, the components of the bio-oil became simpler (Table S2†). Fig. 3 shows the GCMS image of ethanol-extracted bio-oil with and without MgSO4. Other compounds not listed in Tables S1 and S2† were silicone-containing compounds. In Fig. 3, for the bio-oil obtained by MgSO4 extraction, the n-hexadecanoic acid peak disappeared, and the hexadecanoic acid ethyl ester peak intensity was very high. Despite slight decrease in the oil yield (Fig. 2a and Table 1), adding MgSO4 had excellent effect in improving the quality of the bio-oil obtained by extraction.
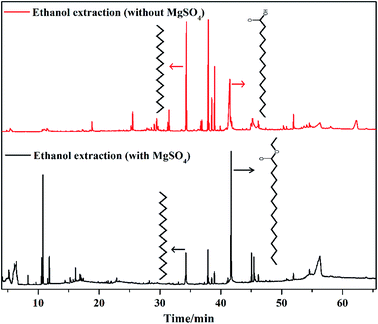 |
| | Fig. 3 GC-MS results of ethanol-extracted oil with and without MgSO4. | |
3.4. Hydrothermal liquefaction reaction condition optimization
For the algae hydrothermal liquefaction reaction, reaction conditions were optimized with Pd/HZSM-5 catalyst and oil yields were measured to determine optimum reaction conditions (Fig. 4). As the predominant influencing factor, reaction temperature was optimized first. In Fig. 4a, the oil yield first increased then decreased as the reaction proceeded. When the temperature was 340 °C, the highest oil yield was obtained. This may be due to the fact that algae first decomposed to form bio-oil and then re-polymerized when the temperature was higher than 340 °C. In Fig. 4b, it is revealed that when water volume was 2 ml, the highest bio-oil yield was obtained. High water volume could influence the stability of catalyst and cause decreased oil yield. When the catalyst dosage increased, the oil yield first increased then decreased (Fig. 4c). This may be due to the fact that the addition of more catalysts in the reaction promoted the reaction. However, 0.05 g catalyst caused low oil yield, which may have been because of catalyst nanoparticle agglomeration. Also, it is well-known that formic acid, as an in situ hydrogen atom donor, can decompose completely to H2 at approximately 300 °C,15–18 which was confirmed by our previous study.9 Thus, 0.4 ml formic acid (HCOOH) was added to the reaction to generate H2 (Fig. 4d). From Fig. 4, on the basis of these results and for economical reasons, we chose reaction temperature of 340 °C, reaction time of 2 h, water volume of 4 ml, catalyst dosage of 0.04 g and HCOOH volume of 0.4 ml as the optimal reaction conditions.
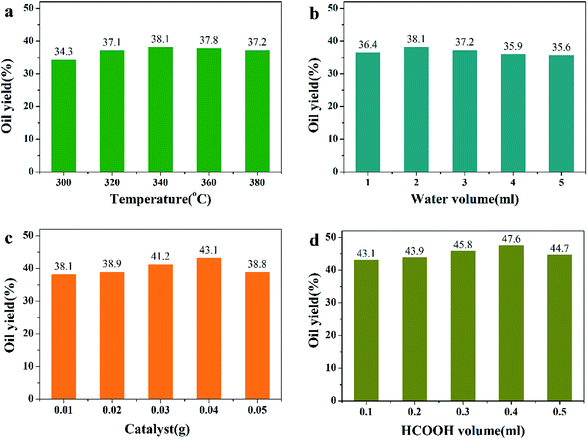 |
| | Fig. 4 Results of oil yields with different HTL reaction conditions. (Catalyst: Pd/HZSM-5. Reaction conditions: (a) 0.5 g algae + 2 ml water + 0.01 g catalyst + 0.1 ml HCOOH + 2 h; (b) 0.5 g algae + 340 °C + 0.01 g catalyst + 0.1 ml HCOOH + 2 h; (c) 0.5 g algae + 2 ml water + 340 °C + 0.1 ml HCOOH; (d) 0.5 g algae + 340 °C + 0.01 g catalyst + 2 h.) | |
3.5. Results of oil yields in algae and PRE algae catalytic hydrothermal liquefaction
Table 3 shows the oil yields by algae and PRE algae catalytic HTL process. The algae dosage and PRE algae dosage were the same. Pd/HZSM-5, Pd/C, Pt/C, Rh/C and Ru/C were chosen in the catalytic HTL procedure. Total oil yield (Table 3, Entry 3) was calculated by eqn (4); the MgSO4 extraction algae yield was 0.82, and the MgSO4 extraction oil yield was 10.14%.| | |
Total oil yield (%) = PRE algae oil yield (%) × 0.82 + 10.14
| (4) |
Table 3 Oil yields from algae and PRE algae by different catalysts
| Entry |
|
None |
Pd/HZSM-5 |
Pt/C |
Pd/C |
Rh/C |
Ru/C |
| Total yield in extraction procedure and hydrothermal liquefaction procedure. |
| 1 |
Algae |
36.20 |
47.60 |
49.80 |
50.40 |
51.20 |
50.60 |
| 2 |
PRE algae |
35.50 |
46.80 |
45.00 |
47.60 |
49.80 |
49.70 |
| 3 |
PRE algaea |
39.25 |
48.52 |
47.04 |
50.81 |
50.98 |
50.89 |
In Table 3, for algae bio-oil, Rh/C obtained the highest oil yield (Table 3, Entry 1); the catalyst also obtained the highest oil yield in PRE algae bio-oil (Table 3, Entry 2). As seen in Table 3, the yield of PRE algae bio-oil was lower than that of algae bio-oil; this was because the extraction procedure resulted in some extracted compounds and caused decrease in useful components. However, for the two-step method, it was revealed that the total oil yield was higher than that of the direct hydrothermal liquefaction method except for Pt/C and Rh/C catalysts. These results showed that the two-step method can achieve higher oil yield and obtain more compounds during algae utilization.
3.6. EA results in algae and PRE algae catalytic hydrothermal liquefaction
Table 4 shows the results of bio-oil elemental analysis. In this table, TE indicates total energy and represents the energy of bio-oil obtained from 5 g algae consumption. For algae, it was calculated using eqn (5) (Entry 6); for PRE algae, it was calculated using eqn (6) (Entry 13) and represented the total TE value by the two-step method. Using eqn (6), the algae dosage after MgSO4 extraction was 4.1, HHV of MgSO4-extracted bio-oil was 36.42, and the oil yield by MgSO4 extraction was 10.14% (Table 1).| | |
TE/kJ = HHV/MJ kg−1 × oil yield (%) × 5
| (5) |
| | |
TE/kJ = HHV/MJ kg−1 × oil yield (%) × 4.1 + 36.42 × 10.14% × 5
| (6) |
Table 4 Elemental analysis, TE and EC values of algae bio-oil and PRE algae bio-oil for different catalysts
| |
Entry |
EA |
None |
Pd/HZSM-5 |
Pt/C |
Pd/C |
Rh/C |
Ru/C |
| Algae |
1 |
C/% |
55.36 |
60.16 |
63.07 |
63.17 |
64.36 |
63.27 |
| 2 |
H/% |
9.27 |
8.62 |
8.79 |
8.81 |
8.94 |
9.40 |
| 3 |
N/% |
7.01 |
6.11 |
4.21 |
4.49 |
4.40 |
4.11 |
| 4 |
O/% |
28.36 |
25.11 |
23.93 |
23.53 |
22.30 |
23.22 |
| 5 |
HHV/MJ kg−1 |
26.53 |
27.85 |
29.53 |
29.61 |
30.41 |
30.59 |
| 6 |
TE/kJ |
48.02 |
66.28 |
73.53 |
74.62 |
77.85 |
77.39 |
| 7 |
EC/% |
49.12 |
67.81 |
75.22 |
76.33 |
79.64 |
79.17 |
| PRE algae |
8 |
C/% |
52.04 |
57.91 |
57.97 |
60.09 |
62.19 |
64.42 |
| 9 |
H/% |
8.63 |
8.81 |
8.22 |
8.66 |
9.79 |
9.01 |
| 10 |
N/% |
7.12 |
5.75 |
4.87 |
5.67 |
4.41 |
5.48 |
| 11 |
O/% |
32.21 |
27.53 |
28.94 |
25.58 |
23.61 |
21.09 |
| 12 |
HHV/MJ kg−1 |
23.87 |
27.04 |
26.13 |
27.87 |
30.67 |
30.56 |
| 13 |
TE/kJ |
53.21 |
70.35 |
66.67 |
72.86 |
81.09 |
80.74 |
| 14 |
EC/% |
47.50 |
70.93 |
65.91 |
74.36 |
85.61 |
85.14 |
Also, in this table, EC means energy conversion; it was calculated using eqn (7). For algae, the value of HHV/MJ kg−1 (algae) was 19.55; for PRE algae, the value of HHV/MJ kg−1 (algae) was 17.84 (Table 1).
| | |
EC/% = HHV/MJ kg−1 (bio-oil) × oil yield (%)/HHV/MJ kg−1 (algae)
| (7) |
When nothing was added to the reaction, the formed bio-oil exhibited low HHV with low TE and EC values. Noble metal-based catalytic processes favored hydrogenation. In algae hydrothermal liquefaction, Ru/C achieved the highest HHV (Table 4, Entry 5), but Rh/C achieved the highest TE and EC values (Table 4, Entries 6 and 7). For PRE algae hydrothermal liquefaction, Rh/C achieved the highest HHV, TE and EC values simultaneously (Table 4, Entries 12, 13 and 14). Also, except for Rh/C, HHV of other PRE algae bio-oils was lower than that of algae bio-oil (Table 4, Entry 5 and 12); this was also ascribed to the previous extraction procedure, which resulted in some extracted components. Except for Pt/C and Pd/C, TE values of PRE algae bio-oil were higher than those of algae bio-oil (Table 4, Entries 6 and 13); this result also confirmed that the two-step method can maximize algae utilization. For Rh/C and Ru/C, the EC value of PRE algae bio-oil was higher than that of algae bio-oil (Table 4, Entries 7 and 14), which may be because of better algae decomposition by both these catalysts. Besides, these two catalysts can catalyze more compounds via a hydrogenation process to form bio-oil.
3.7. GC-MS results in algae and PRE algae catalytic hydrothermal liquefaction
GC-MS was applied to identify the bio-oil composition in these experiments. Table 5 shows the main fractions from GC-MS results. Hydrocarbon content, O-containing content, N-containing content and N and O-containing contents are listed in Table 5. For the original GC-MS results, there were some organic silicon fractions; these fractions were from the column of the GC-MS instrument and thus, we must subtract these fractions and normalize to ensure that the total fraction percent is 100%. The other compounds not listed in Table 5 were the compounds that could not be studied.
Table 5 GC-MS results of algae bio-oil and PRE algae bio-oil for different catalysts
| |
Entry |
Compounds |
None |
Pd/HZSM-5 |
Pt/C |
Pd/C |
Rh/C |
Ru/C |
| Algae |
1 |
Hydrocarbons/% |
33.36 |
55.96 |
65.80 |
57.35 |
64.14 |
64.58 |
| 2 |
O containing/% |
29.33 |
15.49 |
16.80 |
20.51 |
11.87 |
11.81 |
| 3 |
N containing/% |
1.11 |
5.63 |
4.34 |
2.19 |
4.85 |
3.49 |
| 4 |
N and O containing/% |
19.17 |
15.31 |
13.00 |
11.79 |
9.97 |
17.47 |
| PRE algae |
5 |
Hydrocarbons/% |
28.53 |
54.76 |
34.51 |
37.81 |
55.68 |
46.91 |
| 6 |
O containing/% |
19.98 |
24.67 |
36.92 |
28.17 |
21.47 |
16.26 |
| 7 |
N containing/% |
9.94 |
3.38 |
9.81 |
13.06 |
8.47 |
8.81 |
| 8 |
N and O containing/% |
39.39 |
14.15 |
15.27 |
18.92 |
14.39 |
26.96 |
When nothing was added in the reaction, there were a large amount of heterogeneous atom compounds in algae bio-oil, and the hydrocarbon content was only 33.36% (Table 5, Entry 1). Adding noble metal catalysts dramatically increased hydrocarbon content and decreased heterogeneous atom compound content. O content in Pd/HZSM-5-catalyzed bio-oil was lower than that in Pd/C ones, which proved that HZSM-5 had a deoxygenation effect.19 However, Rh/C and Ru/C performed better than other catalysts in reducing O content. For PRE algae bio-oil, it was noticed that the hydrocarbon content was lower than that for algae bio-oil as hydrocarbons were partially removed in the first extraction step. Nevertheless, Rh/C catalyst still obtained 55.68% hydrocarbon content for the bio-oil. Based on these results, it was concluded that Rh/C performed the best during the catalytic HTL process.
3.8. Results of FTIR spectra
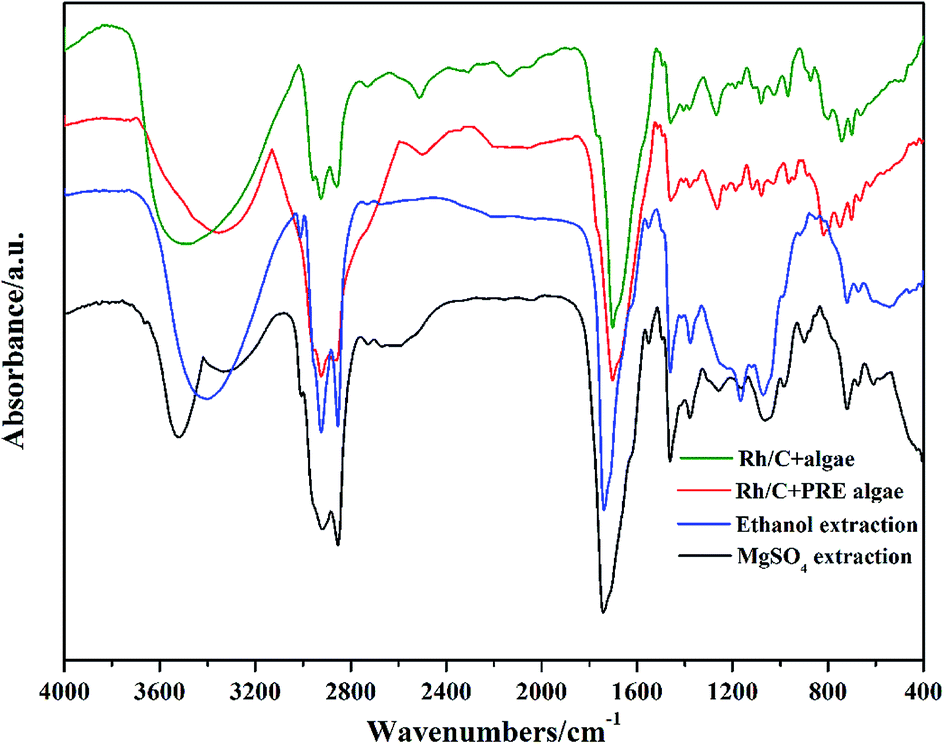
FTIR spectra were used to examine the functional groups and structures of bio-oil components (Fig. 5). The broad absorption band at 3600–3100 cm−1 was ascribed to the –OH stretching vibration in hydroxyl or carboxyl groups,20 which was consistent with the results of acid compounds in bio-oil obtained from GCMS. As we mentioned before, adding MgSO4 reduced the acid content, and this was also proved by the FTIR spectra as the absorption band was smaller than others. In Fig. 5, all spectra displayed strong absorption bands between 3000 and 2800 cm−1, which could be due to asymmetrical and symmetrical C–H stretching vibrations. This indicated the existence of hydrocarbons and fatty acids. The absorption band at 1750–1650 cm−1 represented the C![[double bond, length as m-dash]](https://www.rsc.org/images/entities/char_e001.gif) O group stretching vibration, which is mainly present in acids and esters. It was observed that there was a slight blue shift of the CO group band in the spectrum of MgSO4-extracted bio-oil, which may indicate the existence of esters.
O group stretching vibration, which is mainly present in acids and esters. It was observed that there was a slight blue shift of the CO group band in the spectrum of MgSO4-extracted bio-oil, which may indicate the existence of esters.
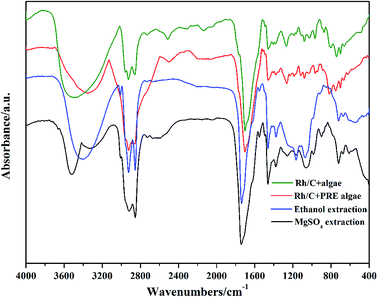 |
| | Fig. 5 FTIR spectra of bio-oils from different conditions. | |
4 Conclusion
A two-step method of organic solvent extraction and catalytic hydrothermal liquefaction was shown to be an effective way to produce bio-oil. In the first extraction step, several organic solvents and two extraction methods were tested, and ethanol (SE) was shown to be the best solvent. Adding MgSO4 could reduce the acid content and gave 48.40% yield for hexadecanoic acid ethyl ester. For residual algae powder, several noble metal catalysts were used in the catalytic HTL process, and Rh/C gave the highest total oil yield of 58.69% and HHV of 30.67 MJ kg−1. Oil yield through the two-step method was higher than that via a direct decomposition step; this revealed that the two-step method can maximize the utilization of algae. Also, the two-step method could achieve a higher energy conversion ratio of 85.61% and total energy of 81.09 kJ. The results of FTIR also confirmed our conclusions.
Conflicts of interest
There are no conflicts to declare.
Acknowledgements
This work was financially supported by the National Science Foundation of Shanghai (No. 18ZR1411100).
References
- G. Silvia, C. G. John, A. Daniel, F. José, S. Aurora and J. H. Svein, Algal Res., 2017, 27, 121 CrossRef.
- Y. Chen, Y. L. Wu, D. R. Hua, C. Li, M. P. Harold, J. L. Wang and M. D. Yang, RSC Adv., 2015, 5, 18673 RSC.
- S. V. Antonio, G. Elke, M. G. Andrés, G. H. Nestor and R. Uwe, Energy Convers. Manage., 2017, 138, 261 CrossRef.
- V. V. Stanislav and G. V. Christina, Fuel, 2016, 181, 1 CrossRef.
- Y. Pierson, X. Chen, F. D. Bobbink, J. G. Zhang and N. Yan, ACS Sustainable Chem. Eng., 2014, 2, 2081 CrossRef.
- P. G. Duan and P. E. Savage, Ind. Eng. Chem. Res., 2011, 50, 52 CrossRef.
- P. G. Duan and P. E. Savage, Bioresour. Technol., 2011, 102, 1899 CrossRef PubMed.
- J. Yang, L. Zhao, S. T. Liu, Y. Y. Wang and L. Y. Dai, Bioresour. Technol., 2016, 212, 302 CrossRef PubMed.
- C. Z. Liu, L. P. Kong, Y. Y. Wang and L. Y. Dai, Algal Res., 2018, 33, 156 CrossRef.
- J. Hussain, Y. Lan, W. A. Lopes, J. I. Druzian, C. O. Souza, G. C. Carvalho, I. A. Nascimento and W. Liao, Appl. Biochem. Biotechnol., 2015, 175, 3048 CrossRef PubMed.
- Y. Li, F. G. Naghdi, S. Garg, T. C. Adarme-Vega, K. J. Thurecht, W. A. Ghafor, S. Tannock and P. M. Schenk, Microb. Cell Fact., 2014, 13, 767 Search PubMed.
- M. V. Derakhshan, B. Nasernejad, F. Abbaspour-Aghdam and M. Hamidi, Biotechnol. Appl. Biochem., 2015, 62, 375 CrossRef PubMed.
- M. Olkiewicz, M. P. Caporgno, J. Font, J. Legrand, O. Lepine, N. V. Plechkova, J. Pruvost, K. R. Seddon and C. Bengoa, Green Chem., 2015, 17, 2813 RSC.
- Z. Q. Hou, L. G. Luo, K. Liu, C. Z. Liu, Y. Y. Wang and L. Y. Dai, Chem. Eng. J., 2014, 236, 415 CrossRef.
- Q. Y. Bi, J. D. Lin, Y. M. Liu, H. Y. He, F. Q. Huang and Y. Cao, J. Power Sources, 2016, 328, 463 CrossRef.
- X. Liu, L. He, Y. M. Liu and Y. Cao, Acc. Chem. Res., 2014, 47, 793 CrossRef PubMed.
- Q. Y. Bi, J. D. Lin, Y. M. Liu, F. Q. Huang and Y. Cao, Int. J. Hydrogen Energy, 2016, 41, 21193 CrossRef.
- J. G. Zhang and N. Yan, Green Chem., 2016, 18, 5050 RSC.
- N. Mo and P. E. Savage, ACS Sustainable Chem. Eng., 2014, 2, 88 CrossRef.
- Z. D. Huang, A. Wufuer, Y. Y. Wang and L. Y. Dai, Process Biochem., 2018, 69, 136 CrossRef.
Footnote |
| † Electronic supplementary information (ESI) available. See DOI: 10.1039/c8ra04668a |
|
| This journal is © The Royal Society of Chemistry 2018 |
Click here to see how this site uses Cookies. View our privacy policy here. 
 Open Access Article
 This Open Access Article is licensed under a Creative Commons Attribution-Non Commercial 3.0 Unported Licence
 * and
Liyi Dai
* and
Liyi Dai