 Open Access Article
Recent development of boronic acid-based fluorescent sensors
Guiqian
Fang
abcd,
Hao
Wang
abcd,
Zhancun
Bian
abcd,
Jie
Sun
 abcd,
Aiqin
Liu
abcd,
Hao
Fang
e,
Bo
Liu
abcd,
Qingqiang
Yao
abcd and
Zhongyu
Wu
abcd,
Aiqin
Liu
abcd,
Hao
Fang
e,
Bo
Liu
abcd,
Qingqiang
Yao
abcd and
Zhongyu
Wu
 *abcd
*abcd
aSchool of Medicine and Life Sciences, University of Jinan-Shandong Academy of Medical Sciences, Jinan 250200, Shandong, China. E-mail: wu_med@foxmail.com
bInstitute of Materia Medica, Shandong Academy of Medical Sciences, Jinan 250062, Shandong, China
cKey Laboratory for Biotech-Drugs Ministry of Health, Jinan 250062, Shandong, China
dKey Laboratory for Rare & Uncommon Diseases of Shandong Province, Jinan 250062, Shandong, China
eDepartment of Medicinal Chemistry, School of Pharmaceutical Sciences, Shandong University, Jinan, Shandong 250012, China
First published on 20th August 2018
Abstract
As Lewis acids, boronic acids can bind with 1,2- or 1,3-diols in aqueous solution reversibly and covalently to form five or six cyclic esters, thus resulting in significant fluorescence changes. Based on this phenomenon, boronic acid compounds have been well developed as sensors to recognize carbohydrates or other substances. Several reviews in this area have been reported before, however, novel boronic acid-based fluorescent sensors have emerged in large numbers in recent years. This paper reviews new boron-based sensors from the last five years that can detect carbohydrates such as glucose, ribose and sialyl Lewis A/X, and other substances including catecholamines, reactive oxygen species, and ionic compounds. And emerging electrochemically related fluorescent sensors and functionalized boronic acid as new materials including nanoparticles, smart polymer gels, and quantum dots were also involved. By summarizing and discussing these newly developed sensors, we expect new inspiration in the design of boronic acid-based fluorescent sensors.
1. Introduction
Different elements form a rich and colorful world dynamically, and they are in diverse forms of existence through a series of physical effects and biochemical reactions. To accurately understand these processes, we need to give consideration to their existence at the molecular level. The objects of scientists' research vary from single ions to complex and changeable proteins. In order to deeply understand them, scientists have devoted much time to developing effective recognizing tools, and molecular recognition sensors are utilized extensively. Normally, two conditions should be taken into consideration while fabricating an ideal sensor. First, it is necessary to have a specific recognition site that combines with objects such as the human microenvironment of ions, carbohydrates, peptides, etc. Second, the dynamic changes made by these combinations can be detected by monitoring environment, and some of the extensively used reporters are optical and electrical.1 The interactions of recognition originate from noncovalent bonding, such as hydrogen bonds, van der Waal's forces, π–π interactions, electromagnetic effects and so on, extending to covalent bonds and other sensory systems.2,3 In recent years, using boronic acid groups to fabricate a variety of fluorescent sensors have attracted great interest among scientists. Based on the principle that boronic acid forms a reversible five- or six-membered cyclic boronic esters with cis-1,2- or 1,3-diols,4 the fabrication of boronic acid fluorescent sensor extends from boronic acid-appended molecular sensors to apply unconventional smart new materials, including boronic acid-functionalized polymers, boronic acid-modified nanoparticles, and boronic acid-based electrochemical sensors.4,5 For instance, boronic acid-functionalized hydrogels are important smart materials that can be used to fabricate the self-controlled insulin releasing device in the biomedical field.6 Hydrogels endows special properties to boronic acid sensors due to their compatibility with organisms to a certain degree.7,8 Recently, numerous new types of boronic acid sensors have been fabricated to detect blood glucose concentrations,9–13 ionic compounds,14–17 traces of water in solvents,18,19 hydrogen peroxide (H2O2),20–22 catecholamines,23 as well as using boronic acids as biochemical tools for various applications, including tumor cell imaging,24,25 enzyme inhibitors26 and cell delivery systems.27 Therefore, the boron-based fluorescent sensor is still hot in today's research. This review summarized the recent development of boronic acid-based fluorescent sensors for carbohydrates, catecholamines, reactive oxygen species (ROS), ionic compounds and new materials. Although numerous remarkable achievements have been mentioned in previous reviews,28 some areas of research have faded and many new and exciting areas have developed. In order to update knowledge of this rapidly developing field, it is worth highlighting their merits and discussing the remaining shortcomings, as well as the development perspective of fabricating boronic acid sensors. It is also hoped that inspires others to exploit novel sensing strategies.2. Carbohydrates boronic acid sensors
As the important material basis, carbohydrates widely distribute in the body and maintain the normal operation of life. They are usually divided into mono-, di-, and polysaccharides, which play numerous roles in nature. For example, glucose serves as the primary form of energy for basic life processes such as nervous system regulation, cell proliferation, etc. Cellulose endows nature with structural rigidity. Starch and glycogen can serve as energy reserves to sustain life. In addition, they can combine with other molecules to form glycoproteins, glycolipids and so on,29 which play key roles in many biological basic activities such as cancer migration,30 cell fusion,31 protein function regulation32 and embryo development.33 Consequently, the recognition of carbohydrates in the medical, cell biology and other life sciences is of great significance.342.1. Chemical basis for the combination of boronic acid and carbohydrates
The initial study of forming reversible covalent bonds between boronic acids and 1,2- or 1,3-diols can be traced back to 1959. Lorand and Edwards compared different covalent bond constants between the phenylboronic acids (PBA) and diols compounds involving saccharides via the observation of a pH drop.35 As depicted in Fig. 1, boronic acid interacts with water, resulting in a rapid transformation of the boron atoms from the trivalent plane sp2 (neutral) form 1 to the tetravalent tetrahedral sp3 (anion) form 2, and then releasing the proton. Due to the unique electron configuration of the elemental boron element 5, the electron configuration 1s2 2s2 2p1 allows the form of three covalent bonds in the sp2 geometry. In the sp2 hybrid conformation, boron has only 6 valence electrons and can accept an electron pair, thus it is Lewis acid. Namely, boron has an “electron hole” that interacts with the Lewis base, thereby forming a covalent bond with the tetrahedral sp3 geometry. It is an acid–base reaction that applies to the formation of borate ester. Davis et al. reported the relative rates of cyclic boronic esters, manifesting that the six-membered rings are thermodynamically more stable than the five-membered rings.5 Due to boronic acid and borate are likely to exist in two different hybrid forms of sp2 or sp3, there are three processes in the borate–sugar interaction process, and the equilibrium constant is expressed by Ktrig. The second equilibrium is the process of sp3 hybridized borate anions 3 to borate ester anions 4 whose equilibrium constant is called Ktet. These two equilibrium constants alone can't really reflect the true situation of boronic acid combined with carbohydrates. Thus the third general combination constant Keq is often used, regardless of the specific hybrid state of boron. Later, Wang et al. found that Ktet was actually measured by the pH drop method, and Keq was measured by spectroscopy.36,37 Therefore, when comparing the literature value, we need to pay special attention to the specific method of determining the binding constant.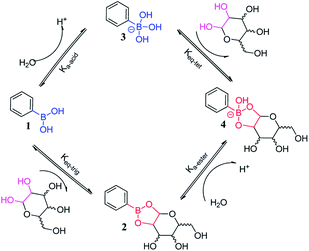 | ||
| Fig. 1 Transformation of boronic acid to boronic ester.37 | ||
2.2. D-Glucose boronic acid sensors
As a basic necessity of organisms, D-glucose plays an important role in biological processes. Humoral abnormal glucose level is a warning signal for medical conditions, and the development of selective glucose sensors for clinical and biomedical applications has become a crucial goal in the field of boronic acid-based chemical sensing. The selectivity of boronic acid for fructose has a higher abundance than glucose, thus reversing the intrinsic binding property has been the focus of early studies.4 The selectivity of glucose can be achieved via molecular design,38 and this technology is maturing,13 and recent developments tend to produce glucose optical responses by inducing nanoscale self-assembly of boronic acid-containing amphiphiles or other materials.39 This section will briefly introduce fluorescent sensors that were fabricated with anthracene, pyrene, heterocyclic ring as fluorescent units, and then the analysis of ribose,40 sialic acids,25,41 glucosamine,42 α-hydroxy carboxylate,43 ATP,44,45 amyloid-β plaques46 fluorescent sensors are followed. This paper summarized the unique design ideas of these fluorescent sensors, the luminescence response mechanisms and the development perspective in the future.| Sensor | Structure | Spectroscopic properties (λex; λem) | C (LOD; range) | Functions and applications |
|---|---|---|---|---|
| 5 47 |

|
—; 416 nm | —; 3.7 mmol L−1 | pKa modulation, the apparent fructose dissociation constant at 7.4; providing a tight, reversible association mechanism and a signal transduction mechanism |
| 6 49 |

|
348 nm; 416 nm | —; 0–50 mmol L−1 | The adjacent hydrogens influence the selectivity, the binding of catechol is stronger than that of saccharide; illustrating the influence of spatial steric |
| 7 50 |

|
370 nm; 420 nm | —; 0.05 mol L−1 | No significant difference was found between fructose and glucose; illustrating the selectivity of monoboronic acid for fructose has a higher abundance than glucose |
| 8 51 |

|
370 nm; 423 nm | —; 0.3–1 mmol L−1 | Diboronic acid, D-glucose (log![[thin space (1/6-em)]](https://www.rsc.org/images/entities/char_2009.gif) K = 3.6); the binding of D-glucose is stronger than that of other saccharide K = 3.6); the binding of D-glucose is stronger than that of other saccharide |
| 9 56 |

|
377 nm; 427 nm | —; 10−5–10 −1 mol L−1 | Diboronic acid, high 13C chemical shifts of the binding of D-glucose; the binding of D-glucose is stronger than that of other saccharide |
| 11 59 |

|
358 nm; 418 nm | 0.8 μmol L−1; 0.003–3.0 mmol L−1 | Fluorescence intensity↑, lower detection limit; successfully applied to glucose detection in human serum samples |
| 12 62 |
|
405 nm; 488 nm | 4.4 mmol L−1; 0–55.6 mmol L−1 | Diboronic acid, good biocompatibility; applied in vivo and successfully tracked the fluctuation in blood glucose concentration |
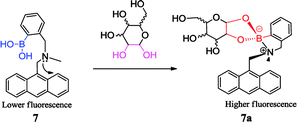
Subsequently, Shinkai et al. reported the anthracene monoboronic acid sensor 7 selectively recognizing D-fructose and the anthracene diboronic acid sensor 8 which selectively recognizes D-glucose.50,51 The sensor 7 was combined with carbohydrates to form 7a, and its N–B bond interaction of 7a was enhanced, which hindered the photoinduced electron transfer (PET) process from the tertiary amino group to the anthracene fluorophore. PET mechanism is generally believed that the aromatic ring electrons can be excited to the vibrational energy level of the first electron excited state or higher excited state after the aroma system is excited by the excitation light, and then it reaches the lowest vibrational energy level of the first excited singlet state after the internal energy conversion or vibration relaxation process. Finally, it returns to the ground state in the form of radiation to produce fluorescence.52 If there are nitrogen atoms and other atoms in the molecule, due to the energy of the lone pair electrons is between the ground state and the singlet state, the solitary electrons can transfer to the aromatic ring of the electron deficient and occupy its orbit, resulting that the original excitation of the electrons can't return to ground state, and can't produce fluorescence. Thus this combination brings great changes in the fluorescence properties that can be applied to detect specific carbohydrates.53,54 The discovery of PET mechanism will contribute in the future study of fluorescent sensors. However, the PET mechanism is not consistent with all data based on boronic acid sensors. Recently, Sun et al. proposed internal conversion mechanisms supported by three aspects. First, the receptors and its complexes with fructose are solvent-inserted without B–N interaction. Second, these sensors were also verified to not be aggregated. Third, there was no fluorescence response upon binding fructose while the –B(OH)2 was converted to the –B(OMe)2 groups in pure methanol.55
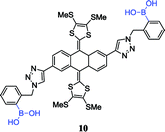
Similarly, anthracene was used as the fluorescent unit of sensor 8, but its selectivity was reversed because of bearing multiple boronic acid groups. Based on the above studies, Eggert et al. fabricated the sensor 9 that has a better selectivity for D-glucose, compared to fructose and mannose, and its stable complex structure was confirmed by 1H and 13C NMR data.56 However, this was a part of the story. Diboronic acid sensors research was expanded by other groups.57 Those studies give us a new insight: the inherent selectivity of boronic acid sensors to specific carbohydrates can be controlled by molecular design to form diboronic acid, which has better fluorescence selectivity through comfortable spatial position between the two boronic acids. Later, Mulla et al. took advantage of this feature and fabricated the sensor 10 containing a redox-active tetrathiafulvalene (TTF) unit and two boronic acid groups to selectively recognize carbohydrates.58
Recently, Wang et al. reported a sandwich boronate affinity sorbent assay (SBASA) for glucose detection. Sensor 11 was synthesized with anthracene group as a fluorescent monomer.59 This method has a higher selectivity, a wider linear range (0.003 to 3.0 mmol L−1) and a lower detection limit (0.8 μmol L−1). Moreover, it was successfully applied to glucose detection in human serum samples.
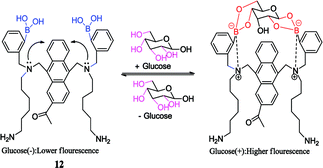
With the further improvement of technology, the selectivity of diboronic acid to glucose has been applied to the study of living animals. Takeuchi et al. utilized the anthracene boronic acid sensor 12 reported by Shinkai et al.60 to fabricate injectable-sized fluorescent beads with uniformity and high throughput via polymerization. Those fluorescent beads were applied in vivo successfully by implanting fluorescent beads into the ear skin of mice for continuous glucose monitoring. As a result, it was found that the fluorescence intensity successfully tracked the fluctuation in blood glucose concentration from 0 mg dL−1 to 1000 mg dL−1.61 Subsequently, Takeuchi et al. went on further investigation by improving the polymerization technique.62 Hydrogel fibers were fabricated, which could stay in mice for up to 140 days. When implanted, they can control and quantify the amount of fluorescence. Moreover, they are easily removed from the body and have better applicability.
| Sensor | Structure | Spectroscopic properties (λex; λem) | C (LOD; range) | Functions and applications |
|---|---|---|---|---|
| 13 63 |
|
299, 342 nm; 417, 460 nm | —; — | Diboronic acid, the binding of D-glucose is stronger than that of other saccharide, K (142 ± 12 L mol−1), ↑3-fold; serving as selective glucose sensor, offer FRET mechanism |
| 14 63 |

|
342 nm; 397 nm | —; — | D-Glucose: K (44 ± 3 L mol−1), ↑4.5-fold; poor selectivity for glucose |
| 15 63 |

|
299 nm; 369 nm | —; — | D-Glucose: K (30 ± 7 L mol−1), ↑1.5-fold; poor selectivity for glucose |
| 16 12 |

|
328 nm; 510 nm | 0.1 mmol L−1; 0–10 mmol L−1 | D-Glucose: high binding constant, K (1378 L mol−1), ↑3.9-fold; knocked out the interference of D-fructose by PBA and clearly recognize D-glucose |
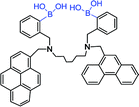
As mentioned in the previous part, glucose selectivity can be achieved via exquisitely fabricating receptors with multiple boronic acid groups. Such a modular approach to saccharide recognition has been pioneered by James,65 Wang,66 Singaram,67 to name but just a few. The boronic acid sensor 13 contains two PBA groups for selectivity, two different fluorophores units and a hexamethylene unit as a linker.63 They found that hexamethylene was the best linker to obtain D-glucose selectivity. The emission wavelength of phenanthrene 15 (donor) was 369 nm and the excitation wavelength of pyrene 14 (acceptor) was 342 nm. They were overlapped. The conjugate of sensor 13 and the D-glucose was irradiated with the excitation wavelength of phenanthrene (299 nm), and its emission wavelength was further as the excitation wavelength of pyrene. Finally, the fluorescence intensity increased 3.9 times at 397 nm. At 299 nm and 342 nm, the fluorescence enhancement of D-fructose was 1.9 fold and 3.2 fold, respectively. D-glucose complex was a rigid 1![[thin space (1/6-em)]](https://www.rsc.org/images/entities/char_2009.gif) :
:![[thin space (1/6-em)]](https://www.rsc.org/images/entities/char_2009.gif) 1 cyclic, while the D-fructose complex was a flexible 2
1 cyclic, while the D-fructose complex was a flexible 2![[thin space (1/6-em)]](https://www.rsc.org/images/entities/char_2009.gif) :
:![[thin space (1/6-em)]](https://www.rsc.org/images/entities/char_2009.gif) 1 acyclic. As shown in the results, the energy transfer from phenanthrene to pyrene in D-glucose complex is more effective than D-fructose complex. Thus D-glucose is responded by sensor 13. This study showed that two points should be taken into account while fabricating fluorescent sensors employing FRET mechanism as a method to enhance sensitivity and selectivity. First, energy transfer in donors and acceptors should have corresponding fluorescence relationships. Second, it is critical in this sensor that the two boronic acids groups have a comfortable spatial position. As such, there are some strict requirements in the use of the FRET mechanism, but it does offer another novel method to fabricate fluorescent sensors. Subsequently, FRET mechanism is widely used in boronic acid-based sensor development.23
1 acyclic. As shown in the results, the energy transfer from phenanthrene to pyrene in D-glucose complex is more effective than D-fructose complex. Thus D-glucose is responded by sensor 13. This study showed that two points should be taken into account while fabricating fluorescent sensors employing FRET mechanism as a method to enhance sensitivity and selectivity. First, energy transfer in donors and acceptors should have corresponding fluorescence relationships. Second, it is critical in this sensor that the two boronic acids groups have a comfortable spatial position. As such, there are some strict requirements in the use of the FRET mechanism, but it does offer another novel method to fabricate fluorescent sensors. Subsequently, FRET mechanism is widely used in boronic acid-based sensor development.23
Due to the complex process of improving glucose selectivity by synthesizing diboronic acid groups or multiple boronic acid groups, Huang et al. had been exploring novel sensing regimes to improve the inherent selectivity of simpler monoboronic acid sensor 16, as depicted in Fig. 2.12 It is generally accepted that binding affinity of the boronic acid with fructose is higher than that with glucose. The specific recognition of glucose can be explained by the stoichiometric point of glucose and fructose binding to boronic acid. In the presence of D-fructose, a boronic acid derivative was produced to form an amorphous 1![[thin space (1/6-em)]](https://www.rsc.org/images/entities/char_2009.gif) :
:![[thin space (1/6-em)]](https://www.rsc.org/images/entities/char_2009.gif) 1 conjugates. Highly ordered 2
1 conjugates. Highly ordered 2![[thin space (1/6-em)]](https://www.rsc.org/images/entities/char_2009.gif) :
:![[thin space (1/6-em)]](https://www.rsc.org/images/entities/char_2009.gif) 1 fluorescent conjugates were obtained in the presence of D-glucose. This sensor system utilized the selective sensing mechanism both of the interaction of boronic acid with diols and aggregation induced by pyridinium cation-π interactions. The binding constants of PBA with D-fructose and D-glucose were 4365 and 110, respectively, while the binding constant of the sensor 16 with fructose and D-glucose were 353 and 1378, respectively. Huang et al. used this kind of property and knocked out the interference of D-fructose by PBA strongly selective binding to D-fructose in the case of D-glucose and D-fructose mixed solution. Under this treatment, the sensor 16 can more clearly recognize D-glucose.
1 fluorescent conjugates were obtained in the presence of D-glucose. This sensor system utilized the selective sensing mechanism both of the interaction of boronic acid with diols and aggregation induced by pyridinium cation-π interactions. The binding constants of PBA with D-fructose and D-glucose were 4365 and 110, respectively, while the binding constant of the sensor 16 with fructose and D-glucose were 353 and 1378, respectively. Huang et al. used this kind of property and knocked out the interference of D-fructose by PBA strongly selective binding to D-fructose in the case of D-glucose and D-fructose mixed solution. Under this treatment, the sensor 16 can more clearly recognize D-glucose.
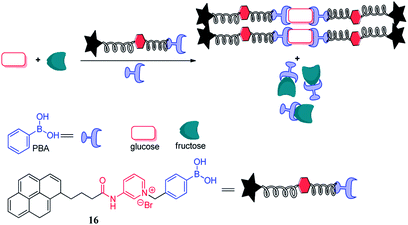 | ||
| Fig. 2 Cartoon illustrating the knock-out effect of an excess of PBA.12 | ||
| Sensor | Structure | Spectroscopic properties (λex; λem) | C (LOD; range) | Functions and applications |
|---|---|---|---|---|
| 17 68 |

|
299, 342 nm; 417, 460 nm | —; 0–40 mmol L−1 | D-Glucose: ↑4.5-fold; used in the contact lens and sensitive to the very low concentrations of tear glucose |
| 21 13 |

|
328 nm; 510 nm | —; 0–5 mmol L−1 | D-Glucose: ↓0.79-fold; the selectivity of glucose binding is modulated by the distance, serving as an ‘‘on–off’’ fluorescence sensor for selective glucose detection |
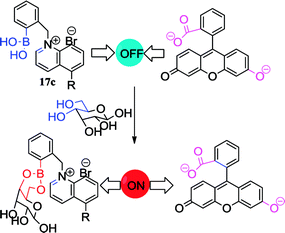
Based on the encouraging research results of Badugu and co-workers, Bruen et al. conducted an in-depth study of the affordable, continuous and minimally invasive glucose monitoring system.69 The negatively-charged BA groups are capable of interacting with the positively-charged N present in the structure, resulting in fluorescence quenching. In contrast, indirect sensing using BA species has also been explored, such as the selection of fluorescein as fluorophore for pairing with BA species. Due to the electrostatic interaction of fluorescein and 17c, the fluorescence of the fluorescein is quenched. However, with the addition of glucose, the 17c preferentially binds to the glucose, and the fluorescence intensity is restored by releasing the fluorescein.
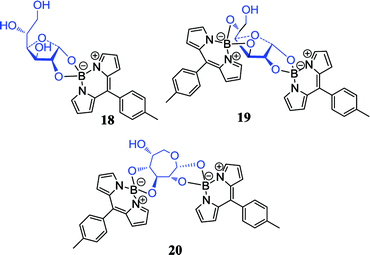
Brothers et al. reported the first O-BODIPY-glucose conjugate, which connected glucose directly to the dipyrrometheneboron difluoride (BODIPY) dye core by forming two B–O–C bonds, and the boronic acid recognition function and the fluorescence properties of BODIPY were combined into an entity.70 The reaction of Cl-BODIPY with glucose in acetonitrile formed a 1:1 α-glucofuranose BODIPY complex 18, a 1:2 α-glucofuranose BODIPY complex 19 and 1:2 α-glucoseptanose BODIPY complex 20. To our knowledge, compound 20 is a novel example of unnatural septanose form of glucose. These fluorescent and hydrolytically stable conjugates open a new paradigm for carbohydrates labeling, sensing, and visualization by connecting strong fluorophores directly to carbohydrates rather than by long-range binding.
Recently, Zhai et al. reported the synthesis of a new bis-boronic acid sensor using copper catalysed azide–alkyne cycloaddition (CuAAC) reactions and fabricated a new glucose-selective fluorescent sensor 21.13 Interestingly, isothermal titration calorimetry (ITC) experiments showed that sensor has higher binding affinity toward glucose than fructose when two linkers with BPA were in the ortho-position. It manifested that the selectivity of glucose binding is modulated by the distance between the two boronic acid groups. Based on this principle, they fabricated sensor 21 subsequently. Excitingly, its fluorescent intensity shows compliance with ITC experimental prediction.
In general, diol sensors are identified based on fluorophore-appended boronic acids, and their applications are often limited due to the lack of discrimination and one-dimensional response. However, Axthelm et al. designed a strategy that could compensate for this defect.71 The combination of fluorinated boronic acid-appended pyridinium salts 22 with 19F NMR spectroscopy enables the screening of a library of 59 biological analytes including monosaccharides. It is worth noting that these receptors are highly sensitive, selective and water-soluble. In addition, their 19F-NMR analyte fingerprint is pH-robust making them particularly suitable for medical applications. For example, in a 188 MHz NMR spectrometer, the concentration of glucose detected in synthetic urine samples was down to 1 mmol L−1.
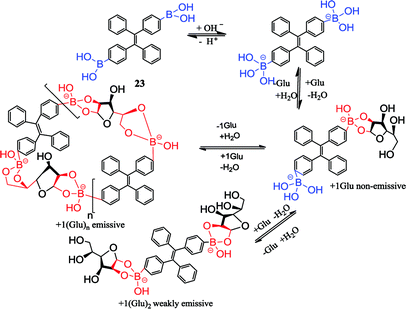
In another intriguing example, Li et al. recently reported a similar glucose fluorescent sensor 24 (TPEA + BAP) with the same response mechanism but a different method to induce aggregation, as depicted in Fig. 3.72 Negatively charge of phenylboronic acid-containing polymer (BAP) induced positively charged tetraphenylethylene (TPEA) aggregation by electrostatic interaction, thus aryl rotor intramolecular rotation was limited, and the excited state released fluorescence through the radiation decay. Subsequently, after adding glucose and glucose oxidase, there was the formation of H2O2 that would react with PBA and then formed a weak acid phenol, thereby reducing the negatively charge on the BAP, resulting in disaggregation of TPEA. The limited internal rotation was liberated, and radiation decay transferred to non-radiation decay, resulting in fluorescence intensity weakening. Simultaneously, the team found that sensor 24 has small fluorescence changes when added D-fructose, D-galactose, and D-mannose, and then they successfully used sensor 24 to detect glucose in human serum. This is the first fluorescent sensor based on the difference in acidity between PBA and phenol, which brings a new concept for the study of glucose fluorescent sensors.
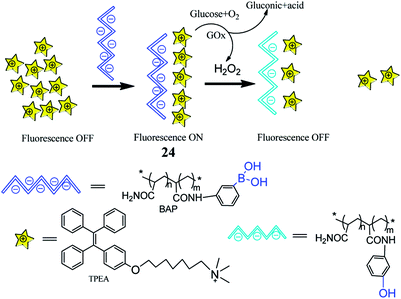 | ||
| Fig. 3 Cartoon illustrating sensor 24 detecting glucose.72 | ||
2.3. Ribose boronic acid sensors (Table 4)
Ribose can be used for the treatment of hepatitis B virus (HBV) and other diseases, the detection of ribose concentration in the body is very important.73 Zhang et al. synthesized a set of differently substituted diboronic acid sensor arrays (25), which achieved a discrimination of all tested five disaccharides and six monosaccharides by linear discriminant analysis (LDA).74 Fructose and ribose are the most selective in the binding selectivity of tested monosaccharides. The occurrence of different selectivity may be ascribed to the rigid and coplanar furanose form containing a pair of adjacent hydroxyl groups, which prefer to combine with boronic acid in order to minimize the angular strain. Moreover, the spatial orientation of the diol moiety largely regulates the combined process. This is the first time the IDA protocol involving diboronic acid sensors, providing new ideas for the development of sensors.| Sensor | Structure | Spectroscopic properties (λex; λem) | C (LOD; range) | Functions and applications |
|---|---|---|---|---|
| 25 74 |

|
440 nm; 528 nm | —; 1 mmol L−1 | Ribose: Kortho (213 ± 15 L mol−1), Kmeta (122 ± 4 L mol−1), Kpara (93 ± 4 L mol−1); providing IDA protocol for diboronic acid sensors |
| 26 75 |
|
637, 720 nm; 820 nm | 300 nmol L−1; — | Displaying selectivity toward ribose in the pH range of 7.8 to 8.3; well-suited for detecting glycan abundance in cells or tissues |
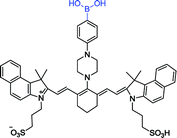
Lopez et al. described a new long-wavelength fluorescent sensor 26 containing a tricarbocyanine and boronic acid structure.75 By adjusting the pH of the medium, this sensor can selectively recognize different kinds of carbohydrates. In one typical example, sensor 26 can selectively recognize ribose and fructose in the pH range of 7.8 to 8.3. Interestingly, this sensor has the longest fluorescent emission reported upon carbohydrates interaction. After excited at 720 nm or 637 nm, it has a maximum at 820 nm. Due to a sensitive signal in aqueous media and avoiding the use of co-solvents, sensor 26 can yield a true fluorescent response. Therefore, this sensor is well-suited for detecting glycan abundance in cells or tissues as well as other bioanalytical applications.
2.4. Sialic acid boronic acid sensors (Table 5)
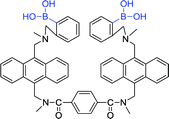
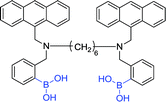
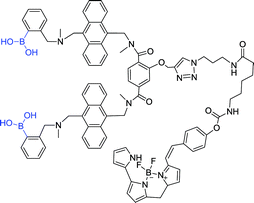
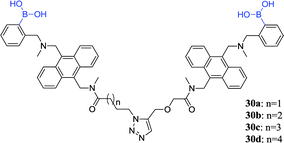
Cell surface glycoprotein is composed of sugar and protein, such as sialyl Lewis X, sialyl Lewis A, etc. closely correlated with the development of tumor cells. These cell surface carbohydrates are normally regarded as markers of tumor cells.24 Borate compounds can bind to tumor cells and visualize them via fluorescence. A sensor (such as anthracene boronic acid sensors) prepared by linking two boronic acid groups with a peptide has highly selective to sialyl Lewis X and can be used to selectively label the surface of human hepatoma cells.76 Sialyl Lewis X is a kind of carbohydrates, which is not only considered a tumor cell marker but also as an antigen associated with the malignant behavior of tumor cells.77| Sensor | Structure | Spectroscopic properties (λex; λem) | C (LOD; range) | Functions and applications |
|---|---|---|---|---|
| 27 78 |
|
370 nm; 426 nm | —; 60 μmol L−1 | Fluorescence intensity enhancement (nearly 40%); binding with sialyl Lewis X, labeling sialyl Lewis X of HepG2 cells |
| 28 79 |
|
367 nm; 415 nm | —; 60 μmol L−1 | Fluorescence intensity↑; binding with sialyl Lewis X, staining HepG2 and HEP3B liver carcinoma cells |
| 29 25 |
|
651 nm; 660 nm | —; — | The intensity of tumor (95 ± 12); binding with sialyl Lewis X, imaging of implanted tumor in mice |
| 30 80 |
|
375 nm; 424 nm | —; 60 μmol L−1 | Fluorescence intensity enhancement (over 70%); 30a and 30d recognize sialyl Lewis Y with selectivity over other Lewis sugars |
| 31 24 |
|
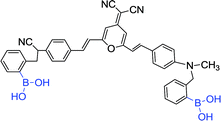
400 nm; 617 nm | —; 0.1 to 20 μmol L−1 | 94% yield, >↑2-fold (1 μmol L−1); binding with sialyl Lewis X, showed close integration with hepatocellular carcinoma cell-line HepG2 and with colon cancer cell-line Colo 205, and with Cos-7 |
| 32 24 |
|
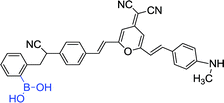
400 nm; 614 nm | —; 0.1 to 20 μmol L−1 | 89% yield, >↑2-fold (1 μmol L−1); binding with sialyl Lewis X, showed close integration with hepatoma B cell-line PLC/PRF/5, with HepG2 |
| 33 24 |

|
400 nm; 607 nm | —; 0.1 to 20 μmol L−1 | 82% yield, ↑3-fold (0.10 μmol L−1); binding with sialyl Lewis X, showed specific integration with PLC/PRF/5 and with HepG2 |
In early 2002, Wang et al. reported the synthesis of an anthracene diboronic acid sensor 27 for sialyl Lewis X detection by an exquisite fabrication between diboronic acid groups.78 The sensor 27 has a strong affinity with sialyl Lewis X and is capable of selectively labeling sialyl Lewis X of HepG2 cells. Encouraged by the positive result, Wang et al. recently fabricated a novel fluorescent sensor 28 which is capable of selectively labeling the HEPG2 and HEP3B cell lines at low concentration (1 μmol L−1).79
Chu et al. developed boronolectin with high affinity and selectivity to recognize sialyl Lewis X, and fabricated sensor 29 by conjugated boronolectin with known fluorescent group BODIPY. In a further study, sensor 29 was successfully applied to fluorescence imaging of implanted tumor in mice.25 This work indicates that boronolectin can be used for selective imaging tumor in vivo.
Wang et al. synthesized four anthracene-based fluorescent diboronic acid sensors (30a–d) and examined the selectivity of different length linkers for sialyl Lewis.80 It was found that the fluorescence of 30a increased after binding to sialyl Lewis Y. The result indicates that 30a has a high sensitivity and selectivity for sialyl Lewis Y. Although all the diboronic acids 30a–d have very similar molecular structures, the different length linkers may affect the difference in the relative positions of the boronic acid groups, thereby causing different selectivity. Subsequently, Wang and co-worker evaluated the ability of 30a to selectively label sialyl Lewis Y-expressing cells and found that sensor 30a selectively stained HEP3B cells. To date, there are no sensitive and selective boronic acid-based sensors for sialyl Lewis Y, therefore sensor 30a is a very valuable research tool and potential diagnostic agent.
Chang et al. synthesized three potential diboronic acid fluorescent sensors 31–33 to detect sialyl Lewis X, which bind to sialyl Lewis X antigens by PET mechanism.24 Wherein the sensor 33 exhibits the strongest fluorescence enhancement when combined with sialyl Lewis X. Moreover, it was confirmed non-toxic to the cells and well selective to detect sialyl Lewis X. This sensor holds great potential for the diagnosis of tumor cells.
Sialic acids are unusual carbohydrates that are widely expressed at the termini of glycan chains on the cell surface. In particular, compared to normal cells, it has a much higher expression level on the cancer cells surface.81,82 Zhang et al. reported a novel method to analyze sialic acids on cancer cells surface via inductively coupled plasma mass spectrometry (ICP-MS).41 Under physiological conditions (pH 7.4), biotinylated 3-aminophenylboronic acid (biotin-APBA) 34 selectively recognizes sialic acids. Based on this property, gold nanoparticles (AuNPs) can significantly enhance the biotin-APBA signal in ICP-MS when AuNP are used as labeled elements biotin-APBA, as depicted in Fig. 4. The result demonstrated that the proposed method is highly selective to tumor cells. HepG2 cells and MCF-7 cells were used as two tumor models to evaluate the expression level of sialic acid on the cancer cells surface. The mean numbers of sialic acid expression on MCF-7 cells and HepG2 cells were 7.0 × 10⁹ and 5.4 × 10⁹, respectively. For systematic extension of the research, the numbers of HepG2 and MCF-7 cells were 120 and 64, respectively under the limits of detection. The relative standard deviations were 9.6% and 8.9%, respectively. And the linear ranges for HepG2 cell and MCF-7 cell were 300–1000 and 170–11![[thin space (1/6-em)]](https://www.rsc.org/images/entities/char_2009.gif) 000, respectively. This method can be applied to analyze sialic acid on the tumor cells surface, which is favorable to diagnose cancer according to tumor markers.83
000, respectively. This method can be applied to analyze sialic acid on the tumor cells surface, which is favorable to diagnose cancer according to tumor markers.83
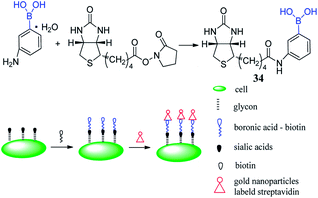 | ||
| Fig. 4 Cartoon illustrating sensor 34 combining with AuNPs.41 | ||
2.5. Glucosamine boronic acid sensors
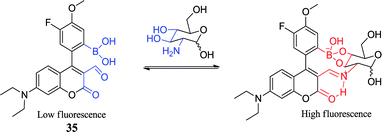
Although pharmacokinetics and pharmacodynamics of glucosamine are unclear, glucosamine is one of the most popular non-prescription nutritional products on the market that is used to treat osteoarthritis. However, reports related glucosamine on the treatment of diseases are various, such as rheumatoid arthritis, gastric ulcer and hepatitis.84 The concentration of glucosamine in normal living cells is between 1 and 2 mmol L−1, but it can reach 10 mmol L−1 if oral administration. High concentrations of glucosamine or its derivatives can inhibit certain tumor cells.85 Those findings are favorable in developing new drugs for the treatment of cancer, thus the detection of glucosamine is particularly important. Tam Minh Tran et al. reported a novel sensor 35 for glucosamine.42 Based on a boronic acid-containing coumarin aldehyde, the sensor 35 has a smaller binding chamber. Due to form a boronic ester and an iminium ion, it exhibits an excellent selectivity for glucosamine. The aldehyde group of the sensor 35 can be reversibly bound to the primary amine to form an ammonium ion, and the ammonium ion enhances the ICT of the coumarin, resulting in a large red shift of the excitation spectrum. When added glucosamine at therapeutic concentration and excited at 488 nm, sensor emission increased and moved from 520 nm to 568 nm. The sensor has a higher fluorescence intensity and binding affinity towards glucosamine than other similar biomolecules. Compared to simple amino acids, the binding constant (Ka = 4100 L mol−1) was nearly two orders of magnitude higher. The study offered a new concept for the fabrication of a highly selective open optical sensor that selectively detects multifunctional biomolecules.2.6. α-hydroxy carboxylate boronic acid sensors
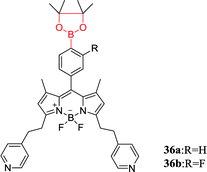
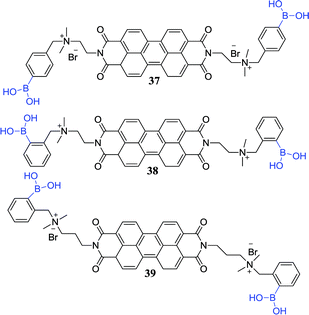
Lactate is a biologically important α-hydroxy carboxylate formed by the red blood cells, and its abnormally high content (>6.5 mM) is associated with sepsis, trauma and other severe diseases. Therefore, monitoring lactate content is an important significance for intensive care unit diagnosis and prevention of diseases. Hansen et al. reported that BODIPY-based boronic acid pinacolate derivatives sensors 36a and 36b act as high lactate selectivity detectors at physiological pH (7.4).43 Interestingly, some biologically important monosaccharides (D-glucose, D-fructose, and D-mannose) were found to have no response to sensors 36a and 36b. The potentially interfering substances (L-malate, vitamin C) are often overlooked because their concentrations are constant and low in the body. Sensors 36a and 36b have absorption maxima at 612 nm and 613 nm respectively, and their respective absorption spectra are the same as their excitation spectra. As the DL-lactate concentration is increased, sensors 36a and 36b exhibit a significant increase in excitation and emission intensity. This phenomenon may be ascribed to the fact that the electrons are less likely to be accepted by the arylboronate unit, resulting in the oxidative quenching of the BODIPY core upon arylboronate formation decreasing.Owing to most pharmaceutical agents requires asymmetric synthesis in the progress of discovery and production, the fabrication of available analytical tools for the recognition of the enantio-composition of reaction products plays a key role. Wu et al. fabricated chirality sensors 37 and 38 for α-hydroxy carboxylates by linked boronic acid groups to a perylene bisimide (PBI) chromophore and induced helical aggregation of achiral PBI.86 PBI chromophore functionalized with boronic acid moieties is shown to be efficient chirality sensors for α-hydroxy carboxylates. The aggregates displayed induced circular dichroism (CD) signals from the PBI chromophore and indicated the ee of the analytes. In a further study, they combined sensor 37 with an aldehyde-functionalised PBI sensor 39 for sensing of L-DOPA.87 As a result, owing to aggregation made the boronic acid and aldehyde groups form two dynamic covalent bonds, the two sensor components showed to be efficient binding to L-DOPA.
2.7. ATP boronic acid sensors
Adenosine triphosphate (ATP) mainly provides energy for cells and plays an important role in the activation of neuronal transmission,88 ion channel.89 The development of sensors that effectively detect intracellular ATP concentrations is important for the study of human metabolic activity and the monitoring of health levels.90 Wang et al. reported sensor 40 that has good biocompatibility and membrane permeation can rapidly detect intracellular ATP.44 There were three aspects facilitating the formation of ring-opening structure and produce strong fluorescence. First, the boronic acid group combined with the ribose moiety of ATP via the reversible covalent bond and forms boronic acid esters. Second, the π–π stack was formed by xanthane and adenine. Third, there was the electrostatic interaction between the amino group and the phosphoric acid ester group. Sensor 40 is effective in response to ATP at a concentration of 10 μmol L−1, while has no significant fluorescence changes with other biomolecules such as carbohydrates, metal ions, etc. The team cultured cells with high levels of ATP by using camptothecin-induced apoptosis, and then sensed them with fluorescent sensor 40. The results showed that camptothecin-treated cells were clearly stained, while the untreated control group was not stained. The sensor can effectively monitor intracellular ATP levels in real time and provides an effective strategy for the development of such sensors.Jiang et al. reported that gold nanoparticles (AuNPs) coated with 4-mercaptophenylboronic acid (MPBA) can be used for the determination of ATP, as depicted in Fig. 5.45 Interestingly, the treated AuNPs are easily polymerized to form a boroxine ring, and its color changes from red to blue. However, in the presence of ATP, a stable borate ester is formed by the boronic acid group of the MPBA preferentially binding the 2,3-hydroxyl group of ATP. At the same time, the polymer dissolves and its color is reversed. In addition, AuNPs-based colorimetric assays successfully detected ATP levels in human breast cancer and in samples treated with antineoplastic drugs. Due to their low cost, easy preparation and the ability to perform bare eyes observation, colorimetric assays offer a potential new strategy for the early diagnosis of cancer.
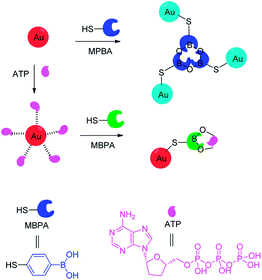 | ||
| Fig. 5 Cartoon illustration of ATP detection via the AuNPs-based colorimetric assay.45 | ||
2.8. Amyloid-β plaques boronic acid sensors
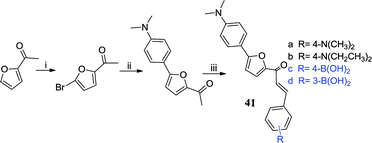
Amyloid-β (Aβ) plaques are mainly composed of the amyloid-β peptide, which is a key pathological feature of AD.91 Thus, the detection of Aβ plaques can be used to monitor the potential for AD progression in vitro and in vivo.92 Recently, the interest in the research of the Aβ plaque dye has increased, such as Thioflavin T,93 DAPI,94 Congo red95 and so on. Jung et al. found that boronic acid has a good selectivity to Aβ aggregation and fabricated a boronic acid fluorescent sensor 41c, which significantly increased the fluorescence intensity in response to Aβ aggregation (64.37 fold, FAβ/F0), and the wavelength had a blue shift (105 nm).46 They found that boronic acid as a functional group improved the binding affinity with the Aβ aggregates (KD value = 0.79 ± 0.05 μmol L−1 for 41c) and confirmed that 41c selectively stained Aβ plaques in brain slices of APP/PS1 mice. Using mice (normal and APP/PS1) for fluorescence imaging in vitro also showed that 41c is able to penetrate the blood–brain barrier (BBB) and stains the Aβ-plaque in the brain. From these results, it showed that 41c will be useful as a fluorescent sensor in AD-related preclinical studies and provides valuable information for the development of Aβ-plaque sensors.3. Catecholamines boronic acid sensors
Catecholamines are benzene derivatives with two neighboring (ortho-) hydroxyl groups, including adrenaline, norepinephrine and dopamine and their derivatives.96 Adrenaline and norepinephrine are not only hormones secreted by the adrenal medulla, but also the neurotransmitters of the norepinephrine fibers in the central nervous system and the sympathetic nervous system. Adrenaline has low content in the central nervous system, while norepinephrine is widely present in the central nervous system and its content is more abundant. Dopamine is present in the vertebral body as a nerve medium. Catecholamines that contain a strong biological activity of endogenous substances in the brain are important adrenergic receptor agonists and play an important role in various nerve signal transmissions. The content of catecholamines in the organism is closely related to the physiological and pathological phenomena of the human body. Catecholamines not only regulate the metabolism in the body, but also affect the kidney, cardiovascular system, nervous system, endocrine system and other normal physiological activities.97 The detection of catecholamines in the human body contributes to the diagnosis of renal insufficiency, thyroid dysfunction, diabetes mellitus, congestive heart failure and other diseases, and some tumor cells can lead to metabolic abnormalities of catecholamines in the body, such as some pheochromocytoma, neuroblastoma, paraganglioma.In a further study of catecholamines, the analytical methods are increasingly diversified. It is important to choose a high selectivity and sensitivity method for catecholamines. Up until now, the main analytical methods are based on high-performance liquid chromatography (HPLC). It is less application via combining capillary electrophoresis with fluorescence spectrophotometry or combining electrochemical analysis with liquid chromatography as analytical methods.98 Catecholamines are chemically characterized by a dihydroxybenzene nucleus and a side chain with amino groups. In the biological sample, the content of catecholamines is very low. Furthermore, catecholamines have extremely poor stability and are easily oxidized. In addition, it is difficult to accurately determine the concentration of catecholamines in the biological sample by adding various endogenous chemical disruptors. High selectivity and sensitivity in the determination of catecholamines in biological samples such as the precise determination of serum norepinephrine or adrenaline are currently required to achieve the clinical goal, thus the development of a simple operation, cheap and highly sensitive detection methods is imperative. In recent years, the use of fluorescent methods to detect catecholamines is various, wherein boronic acid fluorescent sensors have been widely concerned.99,100 Aromatic cis-diols or catechol derivatives interact with boronic acid and form reversible cyclic esters. In one typical example, Chaicham et al. reported a FRET-based detection system contained two different fluorescent sensors and an appropriate catecholamine acting as a guest linker, as depicted in Fig. 6. Catecholamine can interact with boronic acid and aldehyde, inducing the FRET mechanism to recognize the effectively structural similarity of catecholamines.23
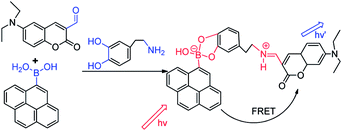 | ||
| Fig. 6 Catecholamine detection diagram.23 | ||
In another intriguing example, Jun et al. fabricated a fluorescent sensor 42 which is used to detect catecholamines, such as dopamine, dopa, and 3,4-dihydroxyphenylacetic acid (DOPAC).101 They found that DOPAC shows the largest association constant with sensor 42 and displays fluorescence quenching effects, while D-fructose, D-glucose, and phenylalanine have no remarkable fluorescence change. In addition, they carefully explained the unique intermolecular excimer formation and fluorescence quenching effects with DOPAC and catechols based on the theoretical calculations. Ptak et al. investigated the interaction of PBA with noradrenaline, dopamine, L-DOPA, DOPA-P and catechol via potentiometry and NMR spectroscopy, respectively. For comparison, they fabricated sensor 43 and did the same test. They found that PBA has a high affinity to noradrenaline, while sensor 43 shows promising ability to bind dopamine.102
Devi et al. reported a fluorescent sensor 44 (Au-BSA-APBA) that amino phenyl boronic acid (APBA) conjugated to gold nanocluster (Au-BSA NCs) can apply to detect dopamine,103 as depicted in Fig. 7. It took advantage of the combination of lactose and fluorescent sensors resulting in fluorescence quenching, and then dopamine was competitively substituted for lactose resulting fluorescence opening. Compared to glucose and galactose, the lactose molecule has two sets of cis-diols groups, showing the highest sensitivity to the Au-BSA-APBA sensor with a detection limit as low as 0.02 μmol L−1. Due to the sensor has a greater affinity to dopamine, it is easier to form a stable complex. With the increase of dopamine concentration, lactose was gradually replaced, aggregates ruptured and restored fluorescence with a detection limit of 0.7 μmol L−1. The team found that the Au-BSA-APBA-lactose conjugate has a specific fluorescence response in the presence of catecholamines such as adrenaline and norepinephrine. They also carried out the effects of interfering analytes including ascorbic acid, uric acid, arginine, histidine, and lysine. It was gratifying that the Au-BSA-APBA-lactose conjugate maintains the specificity and sensitivity to dopamine. Due to the green dual mode turn-off – turn-on nano-sensor and the simple method and low consumption time, the Au-BSA-APBA sensor has a great prospect in the future medical diagnosis and treatment.
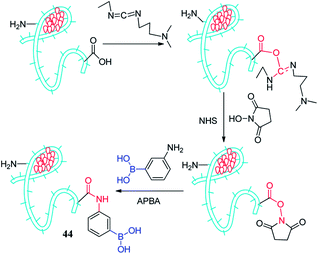 | ||
| Fig. 7 Formation of boronic acid conjugated gold nanoclusters (sensor 44).103 | ||
4. Reactive species boronic acid sensors
Reactive oxygen species (ROS) are generally referred to a class of substances that contain active oxygen atoms in the body. It mainly includes superoxide anion radical (O2−), H2O2, hydroxyl radical (HO−), hypochlorite (ClO−), etc. It has been found that peroxides on the regulation of a variety of physiological activities in the cell are indispensable, such as activation of immune cells, immune response, signal transduction, and so on.104 In addition, ROS are also associated with a number of diseases, such as cancer and Alzheimer's disease, neurodegenerative Parkinson's disease.105 Therefore, the timely and accurate detection of the concentration of ROS in the body is very valuable in the prevention of disease, diagnosis, and treatment. However, due to the strong reactivity of active oxygen and poor stability, it is extremely important to develop sensors with high selectivity for ROS.4.1. Hydrogen peroxide boronic acid sensors (Table 6)
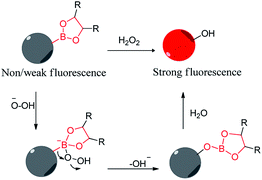
As one of the most important biological ROS, H2O2 is associated with immune system function and considered as the function of healthy physiological signaling pathways such as cell proliferation, differentiation and migration. Therefore, it is important to detect H2O2in vivo.21 The use of fluorescent sensors can be achieved “real-time, visible, quantitative” detection of H2O2 in living cells and tissues by means of laser confocal imaging technology. This provides an important approach for demonstrating the role of H2O2 in the physiological and pathological process.| Sensor | Structure | Spectroscopic properties (λex; λem) | C (LOD; range) | Functions and applications |
|---|---|---|---|---|
| 45 22 |

|
332 nm; 454 nm | —; 0–100 μmol L−1 | ↑100-fold, high quantum yield and emission in the visible region; useful for the in vitro and in vivo detection of H2O2 |
| 46 106 |

|
400 nm; 475 nm | —; 0–250 μmol L−1 | ↑5-fold; good selectivity for H2O2 over other ROS |
| 47 107 |

|
391 nm; 522 nm | 6.8 × 10⁻⁸ mol L−1; 1.0 × 10⁻⁷ to 2.5 × 10⁻⁵ mol L−1 | Absorption band reached its maximum over a pH range from 9.0 to 12.0; applied to detect H2O2 in rain water |
| 48 108 |

|
330 nm; 488 nm | 3 mmol L−1;— | Fluorescence intensity↑, a blue shift; demonstrating the biggest “off–on” response upon reaction with H2O2 |
| 49 108 |

|
350 nm; 500 nm | 3 mmol L−1; — | Fluorescence intensity↓; visualizing a bright signal against a dark background and providing easier analysis of H2O2 in a biological sample |
| 50 108 |

|
350 nm; 455 nm | 3 mmol L−1; 0 to 21 mmol L−1 | ↑3.6-fold; offering a new strategy to optimize the acidity of the boronic acid groups to enhance the reaction with nucleophilic ROS, whilst maximizing the amount of free sp2 boron available for the reaction |
| 51 110 |
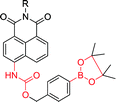
|
410 nm; 540 nm | —; 200 μmol L−1 | Emission intensities (F540/F475)↓12-fold; visualize H2O2 produced in living cells by ratiometric imaging |
| 52 20 |
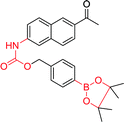
|
370 nm; 450, 500 nm | —; 1 mmol L−1 | Emission intensities (Fgreen/Fblue)↑17-fold; a marked blue-to-green emission color change in response to H2O2, visualizing H2O2 levels in live cells |
| 53 111 |
|
365 nm; 525 nm | —; 100 μmol L−1 | ↑20-fold (1 h), two photon imaging of H2O2 in live RAW264.7 cells; superior signal to noise and higher spatial resolution compared to other commonly used sensors for ROS, DCF and DHR |
| 54 112 |

|
400 nm; 650 nm | 5 μmol L−1; 5 × 10⁻³ to 100 mmol L−1 | 16-Fold lower LOD and higher absorption, ↑1.6–1.8-fold (100 mmol L−1); a promising tool for the detection of H2O2 in modern medicine and environmental monitoring |
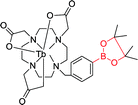
| 55 114 |
|
280 nm | —; 200 μmol L−1 | ↑6-fold, time-gated; capable of detecting changes in H2O2 levels in living cells by time-gated emission spectroscopy |
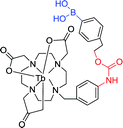
| 56 114 |
|
280 nm 545 nm | —; 200 μmol L−1 | ↑6-fold, time-gated; capable of detecting changes in H2O2 levels in living cells by time-gated emission spectroscopy |
| 57 115 |
|
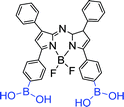
600 nm; 682, 724 nm | —; 0.2 to 500 mmol L−1 | Fluorescence intensity increase (F730/F680), ↑0.47-fold; near-infrared imaging and dual-wavelength detection of intracellular H2O2 |
Merocyanine is a heterocyclic compound consisting of an electron withdrawing group and an electron donating group such as a phenol group. When the electron donor group is converted from phenol to phenol salts, ICT mechanism will be significantly improved. Zhan et al. reported a boron-based merocyanine sensor 47.107 When H2O2 was present, the borate of sensor 47 was oxidized and hydrolyzed to hydroxyl, and the merocyanine dye was released. The process remarkably changed from colorless (λmax = 391 nm) to dark red (λmax = 522 nm). The absorption peak of the merocyanine dye in its acidic form was at 420 nm, while the absorption peak in its alkaline form was at 522 nm. The sensor absorption was linear with the concentration of H2O2 in the range of 1.0 × 10⁻⁷ mol L−1 to 2.5 × 10⁻⁵ mol L−1 with the detection limit of 6.8 × 10⁻⁸ mol L−1 under optimum conditions. Subsequently, they found that foreign substances had litter influence on the sensor. In summary, the sensor is successfully applied to detect hydrogen peroxide in rainwater in a buffer solution of pH 9. The unique performance of merocyanine dye makes it possible to be a promising structural scaffold for fabricating sensors.
Lampard et al. reported on a series of H2O2 boronate fluorescent sensors.10848a and 48b showed fluorescent responses towards H2O2, which may be ascribed to the loss of ICT excited state. Whereas, due to the introduction of ICT excited state, the fluorescence intensity of 48c and 48d decreased in the presence of H2O2. This shows the importance of electron-withdrawing or electron-donating groups in these systems. Based on the above principles, the research team synthesized two H2O2 sensors (49 and 50) by using the same steps. Unfortunately, the extended conjugation between boronic acid and dimethylamino in 49 resulted in a fluorescence response similar to that of 48c, whereas the fluorescence of 50, although increased 3.6-fold, could not be applied to detection of H2O2 with cell imaging experiments because of poor sensitivity. Nonetheless, these studies are very useful for the development of a series of ICT fluorescent sensors that enhance sensitivity to H2O2.
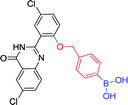
Lindberg et al. reported H2O2 sensor 53 using a quinazolinone precipitating dye (QPD) connected to a boronic acid-based immolative linker.111 QPD is highly photostable and capable of highly localizable fluorescent signals in cells. Synthetic B(OH)2-QPD, in the presence of H2O2, yields the para-benzyl hydroxyl and QPD, causing a strong fluorescence precipitate. In addition, in the live cell experiments performed, bright fluorescence precipitates were observed, demonstrating a selective response to hydrogen peroxide in a cellular context and enabling the visualization of endogenous hydrogen peroxide in phagosomes.
Jia et al. reported a new optical sensing method for detecting H2O2, which introduced phenylboronic acid groups can effectively enhance the response of polydiacetylene vesicles to H2O2.112 Sensor 54 has maximum absorption at 650 nm. It has a good linear relationship in the concentration range from 5 × 10⁻³ to 100 mmol L−1, and R2 reaches 0.991. The detection limit is 5 μmol L−1.
Xu et al. reported that borate-functionalized azaborine-methylene dyes 57 showed changes in intracellular H2O2 during biological processes, as depicted in Fig. 9.115 This is a designed sensor for near-infrared imaging and dual-wavelength detection. Due to proper cell permeability and long excitation and emission wavelengths, it can avoid autofluorescence from natural cell interference. Moreover, the selectivity of the boronic acid group to react with hydrogen peroxide is higher than other ROS.
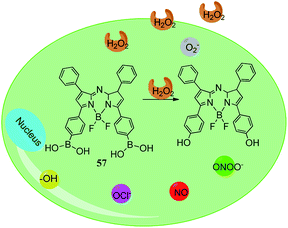 | ||
| Fig. 9 Cartoon illustration of intracellular hydrogen peroxide using sensor 56.115 | ||
4.2. Peroxynitrite boronic acid sensors
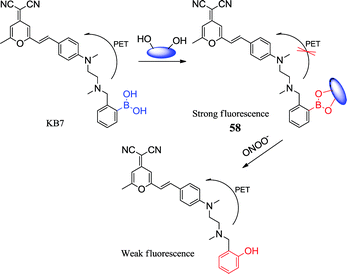
Peroxynitrite (ONOO−) is a highly active oxidant and an effective nitrating agent in physiological and pathological processes, which is formed by nitric oxide (NO) and O2−.116 The use of simple and rapid methods for the effective and applicable detection of ONOO− is increasingly significant. Han et al. synthesized a fluorescent borate-based sensor 58 for rapid detection of ONOO− by a reaction-based indicator displacement assay (RIA).117 The fluorescent sensor KB7 was based on the effective coupling between DCM and the boronic acid moiety. DCM dye had a long excitation and emission wavelength118 and the boronic acid moiety was acted as a saccharide receptor.119 The boronic acid moiety interacted rapidly with lactulose in an aqueous media and formed a fluorescent KB7-lactose complex (sensor 58) that exhibits higher sensitivity and better selectivity for ONOO− than other tested substances. The introduction of the glycosyl group not only improved the water solubility and biocompatibility of KB7-lactose complex, but also protected the boronic acid from oxidation by other oxidants. This might be ascribed to the mechanism that ONOO− attacked aromatic carbon adjacent to the boron atom, resulting in partial cracking of the boronic acid. The sensor of KB7 (20 μmol L−1)–lactulose (100 mmol L−1) can penetrate into viable cells and show strong fluorescence throughout the cytoplasm. Sensor 58 can be used for visualization of ONOO−. Subsequently, cytotoxicity tests conducted by the team showed non-toxic. Compared to other competitive ROS or nitrogen species (RNS), the sensor exhibits better selectivity for ONOO− and is more useful for measuring trace amounts of ONOO− in live cells and real water samples. This study offers insight into the development of displacement test based on fluorescent sensors with enhanced water solubility and biocompatibility.5. Ions boronic acid sensors (Table 7)
Owing to the simplicity and the low detection limit of the fluorescence, sensors based on the ion-induced changes in fluorescence have attracted numerous researchers devoting their time and energies to the investigation. Recently, an abundance of boronic acid sensors is fabricated to detect all kinds of ionic compounds, including fluoride sensors,17 copper ions,120,121 mercury ion,122etc.| Sensor | Structure | Spectroscopic properties (λex; λem) | C (LOD; range) | Functions and applications |
|---|---|---|---|---|
| 59 120 |

|
450 nm; 525 nm | —; 0–10 μmol L−1 | Red-shift, fluorescence intensity↓ 75%; displaying high selectivity for Cu2+ in living cells, 59–Cu2+ displayed fluorescence enhancement with fructose, and the system could be described as a fluorescence INHIBIT logic gate |
| 59a 120 |

|
450 nm; 525 nm | —; — | No fluorescence intensity changes; suggesting the importance of the boronic acid moiety in 59 for the binding of Cu2+ |
| 59b 120 |

|
450 nm; 525 nm | —; — | No fluorescence intensity changes; suggesting the imine group plays a role in the coordination of Cu2+ |
| 60 121 |

|
270 nm; 435 nm | —; 5 × 10⁻³ mol L−1 | Huge chemical shift, colourimetric and “turn on” fluorescence sensor of F−; distinct visual color changes (colorless to yellow), a colorimetric sensor for Cu2+ in aqueous medium; acting as colorimetric sensor for Cu2+ and colorimetric as well as fluorimetric sensor for F− among the studied ions |
| 61 122 |
|
510 nm; 580 nm | —; 3 × 10⁻³ to 1.5 mol L−1 | The colorimetric change, fluorescence intensity↑; “Off–On”-type fluorescent and colorimetric changes for Hg2+ |
| 62 122 |
|
510 nm; 580 nm | —; 3 × 10⁻³ to 0.6 mol L−1 | The colorimetric change, ↑9-fold; “Off–On”-type fluorescent and colorimetric changes for Hg2+ |
| 63 126 | — | <400 nm; 520, 690 nm | 8 nmol L−1; 0.01 to 5 μmol L−1 | Fluorescence intensity↓, colorimetric sensor, changed from blue to red; meeting the requirement of the WHO standard for the detection of the maximum allowable level of Hg2+ in drinking water |
| 64 129 |

|
319 nm; 540 nm | 645 ppm; 500 μmol L−1 | Blue shift, color change from yellow to colorless, fluorescence quenching; selective fluorescent sensor toward CN− in the presence of most competing anions |
| 65 132 | — | 490 nm; 540 nm | 0.28 μmol L−1; 1.39 to 260 μmol L−1 | Fluorescence intensity↓; detecting Cr(VI) |
5.1. Fluoride ion boronic acid sensors
Low concentrations of fluoride anions have been shown to be effective in preventing dental caries, and their levels in water are above 4 ppm, which can seriously affect human health, such as fluorosis. It is becoming extremely important to monitor the concentration of fluoride in real time by the simple and efficient method.123 Mohammadpour et al. reported that carbon nanodots (CDs) can be used as a fluorescence platform for recognition of fluoride ions by the inner filter effect (IFE) of simple aryl boronic acid, and conducted the comprehensive experiments and theoretical studies of water-soluble fluoride sensors.17 The comparison of the UV spectra of NPBA and PBA has reflected that the acidic power of the NPBA's acid surpassed that of the PBA when adding the fluoride. It indicated a significant effect on the acidic power of the aromatic acid by the resonance overlap when the electron withdrawing groups was on the para-position of the benzene ring. In this experimental condition, it was determined to achieve maximum fluorescence change when the NPBA concentration was adjusted to 0.5 mmol L−1 under buffer conditions (phosphate acetate 0.05 mol L−1, pH 4) and after incubated for 5 minutes. The signal of the CDs/NPBA solution was gradually increasing and then suppressed when the concentration of fluoride ions was continuously increased. Furthermore, fluorescence signal changed with fluoride concentration manifesting a linear range of 0 to 15 mmol L−1, and the LOD value of 1.46 × 10⁻⁴ (L) was still meeting EPA's safety requirements for water. Selective experiments indicated that the boron center of NPBA is highly selective for fluoride and has no significant affinity for chlorides, bromides, acetates, phosphates, and nitrates. Subsequently, DFT calculations indicated that the introduction of electron-withdrawing groups on the benzene ring of NPBA may increase the Lewis acids properties and facilitates to fabricate a more sensitive fluoride sensor.Sensor 16 was reported by Huang et al. for recognizing D-glucose. Interestingly, it can detect fluoride ions in another sensing system. Wu et al. reported a sensing system based on sensor 16 capable of directly detecting fluoride ions.124 This is a combination of fluoride ions that triggers the aggregation of sensor 16 with catechol in an acidic aqueous solution, resulting in intense fluorescence changes. The fluoride binding constant is higher than 103 L mol−1. This may be ascribed to the presence of the catechol increasing the Lewis acidity, thereby enhancing the fluoride affinity of the boronic acid. In addition, the boronate fluoride complex is mixed with bulk water to enhance the apparent fluoride affinity.
5.2. Copper ion boronic acid sensors
Copper ions (Cu2+) play a key role in the catalysis of cytochrome C oxidase, tyrosinase, etc. And excessive copper ions are highly toxic to organisms and can induce neurodegenerative diseases.125 Based on these biological implications, fluorescent sensors for Cu2+ have been extensively explored. Li et al. reported three fluorescent sensors (59, 59a and 59b). Wherein borate fluorescent sensor 59 showing high selectivity for Cu2+ in living cells, which uses naphthamide as a mother nucleus and boronic acid group as a binding site.120 This is few examples of boronic acid-based fluorescent chemosensors for Cu2+. The sensor 59 has a maximum absorbance at 450 nm. With the increase of Cu2+ concentration (0–300 mol L−1), significant enhancement of absorption can be observed, and red shift to 465 nm occurs at the absorption maximum. Interestingly, the addition of Cu2+ significantly decreased the fluorescence intensity by 75% with a binding constant of 3.39 × 10⁵ mol L−1, while the other ions did not cause significant fluorescence changes. In addition, fructose can increase the fluorescence of the chelates (sensor 59–Cu2+) after Cu2+ induces a significant decrease in sensor 59 fluorescence intensity. Subsequently, they studied the ability of sensor 59 to detect Cu2+ in HeLa cells. Confocal microscopy showed that sensor 59 entered the cells and showed strong fluorescence in the absence of external copper ions. On the contrary, it was observed a very weak fluorescence response when 5 equivalents of Cu2+ (250 μmol L−1) were added, illustrating quenching. These encouraging results have great guiding significance for the development of ion sensor systems.Maity et al. reported on new boronic ester sensor 60 that can be used for the detection of both Cu2+ and F− ions.121 The addition of F− results in a change in the absorption spectral distribution, which may be ascribed to the coordination of F atoms on the electron-poor boron atoms, resulting in a small blue shift of the lowest energy absorption band, and excessive F− induce the deprotonation of the phenolic O–H protons, resulting in a bright yellow color. The addition of Cu2+ may result in the charge transfer transition of phenoxide-O to Cu2+ in the resulting 2![[thin space (1/6-em)]](https://www.rsc.org/images/entities/char_2009.gif) :
:![[thin space (1/6-em)]](https://www.rsc.org/images/entities/char_2009.gif) 1 complex to form a strong and beautiful yellow color. This sensor is capable of detecting both Cu2+ and F− ions as a very rare example.
1 complex to form a strong and beautiful yellow color. This sensor is capable of detecting both Cu2+ and F− ions as a very rare example.
5.3. Mercury ion boronic acid sensors
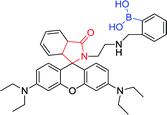
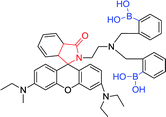
Inorganic mercury is one of the most common toxic metals in nature, and it may cause great damage to the brain, kidneys and endocrine systems.14 Therefore, the detection of mercury ions and mercury salts is of great significance. Kim et al. designed two new rhodamine fluorescent sensors with monoboronic acid and diboronic acid groups, respectively. The perchlorate salts of Hg2+, Ag+, Ca2+, Cd2+, Co2+, etc. were detected by both sensor 61 and sensor 62 (3 μmol L−1) in CH3CN·H2O (9![[thin space (1/6-em)]](https://www.rsc.org/images/entities/char_2009.gif) :
:![[thin space (1/6-em)]](https://www.rsc.org/images/entities/char_2009.gif) 1) solution, respectively. The excitation and emission wavelengths were 510 nm and 580 nm, respectively, and only the Hg2+ shows large fluorescence enhancement.122 Fluorescence intensity increasing and colorimetric changes are ascribed to open lactam rings. Hg2+ complexation results in the conversion of caprolactam (non-fluorescent) to ring-opening amide (fluorescence), thus a switch type of fluorescent sensor was found. In this process, the boronic acid group and Hg2+ are combined into one unit. A library of rhodamine derivatives and other fluorophores can apply to a new switched-mode fluorescent sensor through similar transduction.
1) solution, respectively. The excitation and emission wavelengths were 510 nm and 580 nm, respectively, and only the Hg2+ shows large fluorescence enhancement.122 Fluorescence intensity increasing and colorimetric changes are ascribed to open lactam rings. Hg2+ complexation results in the conversion of caprolactam (non-fluorescent) to ring-opening amide (fluorescence), thus a switch type of fluorescent sensor was found. In this process, the boronic acid group and Hg2+ are combined into one unit. A library of rhodamine derivatives and other fluorophores can apply to a new switched-mode fluorescent sensor through similar transduction.
Zhou et al. have designed a simple and rapid colorimetric sensor 63 for detecting Hg2+ that induced AuNP aggregation by MPBA in an aqueous medium.126 Hg2+ inhibited this aggregation, resulting in a visible color change of the AuNP solution from red to blue, while no significant color change was observed when other competing metal ions were added. It may be ascribed that the thiol group of MPBA preferentially binds to Hg2+ and MPBA loses the ability to induce AuNP aggregation. It has a good linear relationship in the concentration range from 0.01 to 5 μmol L−1, and R2 reaches 0.998. The detection limit is 8 nmol L−1. Interestingly, Kong et al. developed a similar method and found Hg2+ inhibited AuNP aggregation, which can apply to detect Hg2+ in aqueous solutions.127
5.4. Other ions boronic acid sensors
The use of cyanide is widespread in chemical and related industries, which eventually accidental releases into the environment. Cyanide can inhibit cytochrome oxidase activity and is considered as one of the most toxic compounds. Normally, oral administration of a small amount of CN− solution is sufficient to cause death in a few minutes. Consequently, it is important to develop a highly sensitive sensor for CN− detection.16,128 Wang et al. fabricated boronic acid sensor 64 with 2-aminophenol and (2-formylphenyl)boronic acid as raw materials.129 The sensor has a strong fluorescence efficiency at 540 nm, which may be ascribed to the B–N interaction of the rigid five-membered ring framework. Interestingly, the fluorescence disappeared when added CN−. While the addition of F−, Cl−, Br−, I−, NO3−, HSO4−, H2PO4−, AcO− and N3− did not cause much fluorescence change. The detection limit of the boron-based receptor for CN− was determined to 645 ppm by fluorescence titration experiments. In the past, most of the CN− sensors relied on the interaction of hydrogen bonds to improve the selectivity. Furthermore, sensors were interfered by F−, AcO−.130 Boronic acid sensor 64 removes of those defects, and its own structure is simple and easy to fabricate.Owing to mining, electroplating, dyes and other industries discharge a large amount of waste water containing Cr, it brings great harm to the environment. The development of sensors capable of efficiently monitoring Cr in real time can undoubtedly control the random discharge of Cr and reduce the pollution of heavy metals to the environment.131 Tian et al. used 3-aminophenylboronic acid as a starting material to prepare nitrogen and boron co-doped carbon dots sensor 65 that has a high quantum yield.132 It has a good linear relationship in the concentration range from 1.39 to 260 μmol L−1, and R2 reaches 0.997. The detection limit is 0.28 μmol L−1. The synthesized N/B-CD exhibited strong green fluorescence, which is applied to real sample detection. The moreover, the sensor was utilized for the analysis of dopamine in biological samples.
6. Electrochemical boronic acid sensors
Electrochemical sensors detect compounds by converting biological events to an electronic signal through the special combination or catalytic reaction on the electrode surface.133,134 The electrochemical biosensor is typically fabricated by modifying the surface of the metal and carbon electrode with special materials, such as polymers, self-assembled monolayers, organic oils, biomaterials (enzymes, antibodies), and so on.135 One of the most widely studied electrochemical biosensors is based on ferrocene boronic acid (FcBA).136 Due to FcBA containing the unique properties of binding sites (boronic acid moieties) and electrochemically active moieties (Fc residues),137 it is normally used for electrochemical sensing of ribose,138 glycosylated hemoglobin (HbA1c),135 fluoride ion,139etc. The basis of the electrochemical determination of carbohydrates mainly consists of two aspects. First, it is the cyclic borate formed by FcBA residues with 1,2- or 1,3-diols. Second, the redox properties of FcB-carbohydrates adducts are different from those of free FcBA.140It is generally accepted that microRNAs (miRNAs) play a key role in cancer diagnosis and prognosis serving as reliable molecular biomarkers. Xia et al. used FcBA as a redox marker and fabricated a label-free electrochemical sensor which is sensitive to miRNAs.138 The surface of the Au electrode was modified with a single molecular layer of single-stranded deoxyribonucleic acid (DNA). After incubation of the electrodes in the sample solution, FcBA was anchored to the ribose sugar in miRNAs via the formation of the boronic acid ester covalent bond. Consequently, miRNAs could be captured by the pre-immobilized DNA sensor and recognized by voltammetric measurement of FcBA. Due to the 1,2-diols function can't be used for DNA, FcBA can selectively recognize miRNAs in the concentration range of 5 nmol L−1 to 1 μmol L−1.
Thakur et al. fabricated a new ferrocene-modified boronic acid sensor 66 and found the electrochemical and spectral properties in acetonitrile.139 The sensor exhibits large cathodic displacements of the redox potential of Fe (II/III) pairs when combined with fluoride ions (K = 106 L mol−1), whereas it displays a negligible affinity towards other effective competitors, such as Cl−, Br−, I−, AcO−. It indicated that the sensor has good selectivity for fluoride ion in organic solvents. Consequently, it can induce a strong color change from yellow to deep green associated with aerobic oxidation of the Fc moiety, and the fluorescence emission is quenched drastically. Due to the transformation of boronic esters to anionic borates, there is a strong effect on the redox potential and color adjacent to ferrocene. Therefore, it holds the potential to “naked eye” detection of fluoride ions.
Zhou et al. developed a potentiometric method for the detection of sialic acid.141 Glassy carbon (GC) electrodes were modified with poly(anilineboronic acid) (PABA) and electrodeposition of reduced graphene oxide (ERGO). The principle of sialic acid detection is ascribed to the reversible covalent bonds of PABA/ERGO/GC electrode. Boronic acid and diols formed a cyclic ester, as depicted in Fig. 10. Due to the introduction of the graphene layer on the electrode surface, the prepared electrochemical sensor significantly improved the sensitivity of the sensor response. Under the optimum conditions, the detection limit of the sensor is 0.8 μmol L−1 and the linear range is 2 μmol L−1 to 1.38 mmol L−1. Furthermore, the electrochemical sensor has the advantages of good stability and high selectivity. It is able to accurately analyze sialic acid in human serum. The use of boronic acid electrochemistry as a new method of sensing carbohydrates and other substances holds the great potential in the practical applications.
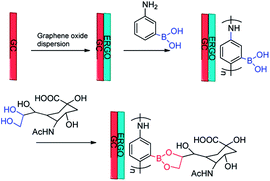 | ||
| Fig. 10 Schematic illustration of modification progress of the GC electrode and the sensing mechanism of sialic acid.141 | ||
7. Smart polymeric materials boronic acid sensors (Table 8)
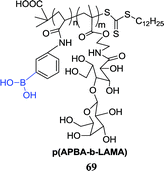
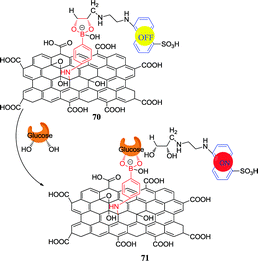
Incorporation of boronic acid groups into the polymer matrix can significantly enhance the binding. This boronic acid functional polymer dates back to the pioneering work of Wulff et al.142 Smart polymers can convert the variation in external stimuli, such as temperature, pH, or glucose level. Due to the stability, handling and biocompatibility of polymers, scientists tend to consider this smart polymer when fabricating sensors, including Asher et al.143 Boronic acid functional polymers are extensively used, such as the modification of quantum dots (QDs) with PBA,11,144 the use of molecularly imprinted polymers,145 the construction of multifunctional hybrid nanogels,10 including the fluorescent beads mentioned above.61,62 Those molecular sensors that combined with smart polymers to detect D-glucose are receiving increasing attention.| Sensor | Structure | Spectroscopic properties (λex; λem) | C (LOD; range) | Functions and applications |
|---|---|---|---|---|
| 67 150 | — | 620 nm; 736 nm | 0.2 μmol L−1; 0–400 μmol L−1 | Fluorescence intensity↓; applied to the detection of dopamine in human serum sample |
| 68 151 | — | —; 653 nm | 23.1, 118.7 μmol L−1; 0–30 mmol L−1 | Fluorescence intensity↑; serving as “turn-on” detection of glucose in blood serum |
| 70 160 | — | 360 nm; 500 nm | 2 mg mL−1; 2 to 75 mg mL−1 | Fluorescence intensity↑; easily synthesized and can be stored for a period of long time for the detection based application |
| 72 161 | — | 260 nm; 340 nm | 0.12 μmol L−1; 1–100 mmol L−1 | Fluorescence intensity↑; fast and ultrasensitive determination of carbohydrates in biofluids and semi-solid biotissues carbohydrate |
| 73 170 | — | 302 nm; 388 nm | —; 0–200 mmol L−1 | Fluorescence intensity↓, higher binding constant of sialic acid compared to other carbohydrates (KpH7.4 = 12.3, KpH6.5 = 12.7); offering a highly translational approach for clinical diagnosis and therapy of solid tumors |
| 74 171 | — | 281 nm; 418 nm | 0.167 nmol L−1; 0–100 nmol L−1 | Fluorescence intensity↑; determining the 5hmC content of genomic DNA in tissue samples, serving as a useful diagnostic and prognostic tool for disease |
7.1. Quantum dot boronic acid sensors
With the application of fluorescent sensors to protein labeling in living cells, it is more clearly understood dynamics of intracellular structures, signal transduction and interactions of cells, but more complex environmental requirements are encountered, such as the need for long observation times, masked signals from labeled molecules by cells autofluorescence, and so on.146 This requires new methods and tools. The size and shape of QDs can be precisely controlled by time, temperature, etc. Their energy levels are quantized with values directly related to the size (hence the name quantum dots).147 Compared with traditional fluorophores, QDs with a diameter of several nanometers have broader band absorption spectrum and long fluorescence lifetime, which meet the needs of fluorescent sensors.148Zhou et al. reported that the CdS QDs were immobilized in a microgel containing boronic acid groups and have a good selectivity to glucose.144 For the expanded research, they modified CdTe/ZnTe/ZnS core–shell (CS) QDs with PBA, and incorporated them into mouse melanoma cells, as depicted in Fig. 11. As a result, they could successfully image mouse melanoma cells.11
 | ||
| Fig. 11 Schematic illustration of modification progress of CdTe/ZnTe/ZnS core–shell (CS) QDs with PBA.11 | ||
Zhang et al. reported firstly the method of boron-doped graphene quantum dots (BGQD), which selectively recognize glucose on the surface of BGQD,149 as depicted in Fig. 12. This may be ascribed to the reaction of two cis-diols units in glucose with two boronic acid groups on the surface of BGQD. They produced a structurally rigid BGQD-glucose aggregation that limited intramolecular rotation, blocked nonradiative relaxation channels, and filled the radiation attenuation, resulting in a substantial increase in the strength of PL. Due to the absence of two cis-diols units, fructose, galactose or mannose were simply combined with BGODs containing exposed boronic acid groups, but couldn't be further combined to form an aggregation. They found that the signal intensity increases with increasing glucose concentration in the range of 0.1 to 10 mmol L−1, the detection limit is about 0.06 mmol L−1. This study brought a new scientific understanding of glucose detection.
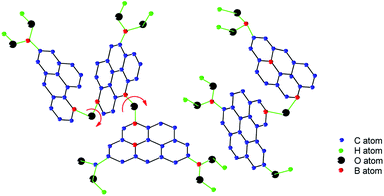 | ||
| Fig. 12 Schematic illustration of the BGQD.149 | ||
Due to boronic acids formed stable boronate complexes with vicinal diols, Liu et al. functionalized water-soluble sensor 67 (CuInS2 QDs) with 3-aminophenyl boronic acid by the one-step hydrothermal method.150 The CuInS2 QDs were covalently bound to the 3-aminophenyl boronic acid and formed 3-aminophenyl boronic acid functionalized CuInS2 quantum dots (F–CuInS2-QDs). This sensor contained boronic acid groups, which were capable of reacting with ortho-diols to form a five- or six-membered cyclic ester in an aqueous alkaline solution. This combination caused F–CuInS2-QDs fluorescence quenching. Consequently, the sensor could be applied to detect dopamine based on this property, as depicted in Fig. 13. Under the optimum conditions, the linear range of dopamine detection is 0.5 to 40 mol L−1, and the detection limit is 0.2 mol L−1.
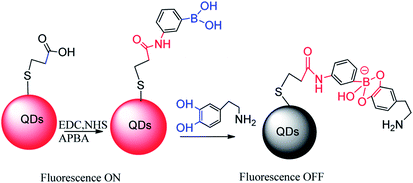 | ||
| Fig. 13 Boronic acid QDs synthesis and dopamine detection diagram.150 | ||
7.2. Smart polymer gels boronic acid sensors
The microgels react with 1,2- or 5,6-cis-diols of glucose and form glucose bisboronate complexes, resulting in gel network shrinkage. Based on this nature, Zhou et al. prepared a highly selective glucose sensor 68, which had two boronic acid microgels (GS@(4-VPBA) and GS@pPBAs) with covalently immobilized graphene sheet (GS),151 as depicted in Fig. 14. The monolayer carbon atoms of graphene have a huge electron mobility, can induce the PBA ionization around graphene, making the microbial gel into a negatively charged at physiological pH 7.4. Glucose crosslinked with two boronic acid groups of microgels, causing microgel volume shrinkage and further leading to an increase in photoluminescence of graphene. However, the fructose and borate formed a monodentate complex, causing microgel volume expansion. The team had successfully applied this material to the detection of glucose in serum samples, which may open up new possibilities for the synthesis of potentially selective glucose-reactive microgels.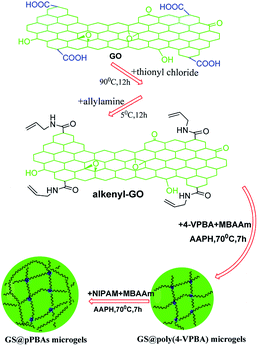 | ||
| Fig. 14 Schematic illustration for the synthesis of GS@poly(4-VPBA) and GS@pPBAs microgels.151 | ||
The hydrogel is a polymer network that can swell and retain aqueous solutions, meeting the need of functional and tunable biomaterials.152 Cai et al. synthesized a glucose-reactive hydrogel 69 that 3-acrylamidophenyl boronic acid copolymerized with ethylaminoethyl methacrylic (p(APBA-b-LAMA)).27 When glucose was added, the insulin release was significantly increased, indicating that glucose was triggered by the molecular exchange process. Subsequently, cytotoxicity analysis in vitro showed that the presence of carbohydrates polymers did not adversely affect cell proliferation. Due to the introduction of the carbohydrates moiety, cell compatibility of the carbohydrates-polymer hydrogel with PBA is significantly improved, which makes it potentially useful in the biomedical field. Consequently, the development of intelligent glucose response insulin delivery system in the treatment of diabetes has an important practical application.
The molecularly imprinted polymer (MIP) is selectively detected the target compound by binding the binding cavity. Target compound polymerizes with the crosslinking agent and functional acceptor, and then binding cavity forms by removing the target compound under appropriate conditions, which is similar to target compound on size, shape and surface chemical properties. Owing to the prepared binding cavity is suitable for the target compound, selective recognition can be performed.153 Zhao et al. developed the biologically significant sensor for glucose, mannose, and galactose through the borate affinity MIP method,145 as depicted in Fig. 15. They converted glucose into diborate and then implanted it into the micelle by copolymerization with the methacrylate group in the micellar nucleus, followed by washing with different polar solutions to remove the glucose and obtained a binding cavity. The Ka value between MINP (glucose) and glucose is 1.18 × 10³ L mol−1, and the Ka value of the other monosaccharides is negligible, which is in good agreement with the expected selective binding of the target compound. Molecular imprinting creates complementary objects that are increasingly popular,154 and the number of binding sites of per nanoparticle can be controlled by the ratio of surfactant to the target compound. It is completely water-soluble and can be used to precisely position and orient the binding groups on a cross-linked micelle, which distinguishes different carbohydrates.
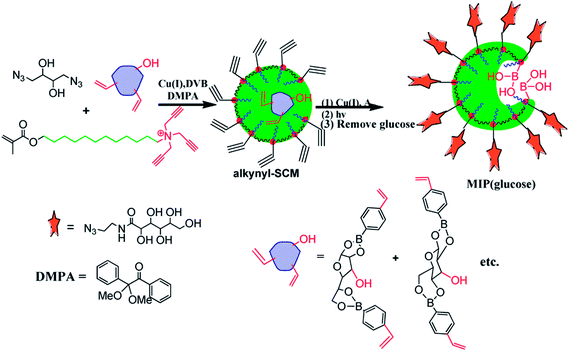 | ||
| Fig. 15 Schematic illustration the progress of boronic acid-functionalized MINP for glucose.145 | ||
7.3. Nanosensors
For small molecule sensors, there are some constraints to improving the selectivity by changing their structure, such as increasing the amount of boronic acid groups as recognition sites. Owing to the comfortable spatial position between boronic acids also plays an important role in the selectivity of the sensor, increasing the molecular structure undoubtedly increases the difficulty of synthesis. Thus, designing higher selective sensors requires the assistance of other fields of technology. Nanosensors have the high surface area, strong adsorption capacity and good electrical conductivity, which endows special properties to some small molecule sensors. Nanomaterials are very sensitive to changes in the external environment, such as temperature, light, humidity, etc., which can cause rapid changes in surface or interface ion valence and electron output.155 Therefore, the small molecule sensors connected to the nanomaterial interact with detection object causing a small change, which is amplified by the nanomaterial, making easily captured by the detector, thereby improving the selectivity and sensitivity of the sensor to a certain extent. Carbon nanometer is an ideal building material. For instance, boronic acid modified carbon nanotubes (CNTs) can be prepared by a variety of sensors, one of which is near infrared reflection (NIR) optics glucose sensor for in vivo glucose monitoring prepared by combining boronic acid with single-walled CNTs (SWNT).156 There are transistors composed of CNTs and pyrene boronic acid, which are used to detect D-glucose concentration.157 The content of D-glucose, D-fructose, and D-mannose in fruit juice can be determined by the glass carbon electrode modified with graphene oxide and 4-aminophenylboronic acid.158Basiruddin et al. reported on a fluorescent nanosensor 70 that can be applied to detect glucose.160 It consists of phenylboronic acid functionalized reduced graphene oxide (rGO PBA) and diol-modified fluorescent sensor. Diol modified fluorescent sensor and rGO PBA form cyclic ester bonds, leading to fluorescence quenching. However, after addition of glucose, glucose replaces the diol-modified fluorescent sensor on the GO and forms a new cyclic boronate 71 with rGO PBA, thereby starting fluorescence. Glucose concentrations in the range of 2 mg mL−1 to 75 mg mL−1 can be tracked by this fluorescent nanosensor. Due to their ease of synthesis and long-term storage, nanosensors can be designed as drug delivery drug carriers for the detection of various cancer cells.
Ouyang et al. reported an ultra-sensitive solid phase microextraction (SPME) sensor 72. It was fabricated by PBA functionalizing CNTs and successfully applied to direct recognition of carbohydrates in biological fluids and semi-solid biological tissue in vitro or in vivo.161 First, PBA functionalized CNTs acted as carbohydrates nanoreceptors. Nano-receptors hybridized with acid resisting polyacrylonitrile (PAN) groups in an appropriate ratio and then linked to a pretreated quartz fiber via the dip-coating method. In this progress, 3D interconnected architecture was formed, which facilitated the sensor binding to carbohydrates, and its enrichment factor was up to 151. The proposed sensor is able to couple with GC-MS after changing the pH, which is remarkably increasing the sensitivity of carbohydrates recognition, as depicted in Fig. 16. The sensor offered a specific scaffold of the diols unit, in particular, cis-diols. Thus carbohydrates that have various 1,3 or 1,2 cis-diols units can be easily captured by the scaffolds. Up until now, the sensor was far superior to other sensors that were widely used for bioanalysis, including polydimethylsiloxane (PDMS)162,163 and C18,164 and they were ideally suited for the identification and differentiation of carbohydrates in multi-carbohydrates systems. Compared to most carbohydrates sensors, the sensor has higher sensitivity, wider linear range and excellent qualitative ability in multi-carbohydrates systems. Consequently, this approach holds the unique potential of new avenues for the facile and efficient recognition of carbohydrates.
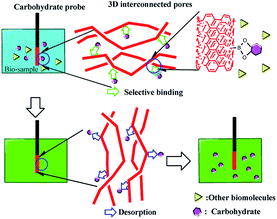 | ||
| Fig. 16 Schematic illustration of saccharides sensing by means of the PBA-functionalized CNTs.161 | ||
Based on the principle that boronic acid forms a reversible five- or six-membered cyclic boronic esters with cis-1,2- or 1,3-diols, Ramsay et al. reported the identification and discrimination of mixtures containing different components of carbohydrates by single molecule analysis.165 According to the fluctuation of the ion current generated by the binding of the boronic acid-modified engineering protein nanopore to different sugars, this method can determine the binding mode, thereby realizing the differentiation of different carbohydrates. In the disaccharide (D-maltose) and monosaccharide (D-glucose) mixture components, it is easy to discriminate by visually checking the current recording. In the monosaccharide mixed components, the characteristics of D-glucose and D-fructose can be distinguished by dwell-time analysis. Owing to distinguishing multi-component carbohydrates, this single-molecule analysis method is beneficial to improve the accuracy of blood glucose monitoring and will have a great impact on the design of continuous blood glucose monitoring devices for medical diagnosis. Similarly, Nishino et al. reported a supramolecular strategy for carbohydrates detection by single molecule junction.166 Owing to only glucose forms a single molecule junction composed of 1![[thin space (1/6-em)]](https://www.rsc.org/images/entities/char_2009.gif) :
:![[thin space (1/6-em)]](https://www.rsc.org/images/entities/char_2009.gif) 2 monosaccharide 4MPBA supramolecular complex, this strategy can contribute toward the achievement of minimally invasive glucose sensing.
2 monosaccharide 4MPBA supramolecular complex, this strategy can contribute toward the achievement of minimally invasive glucose sensing.
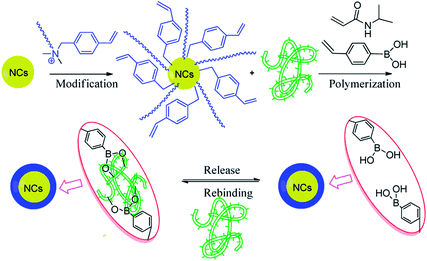 | ||
| Fig. 17 Schematic illustration of NCs self-assembly and sensing progress.167 | ||
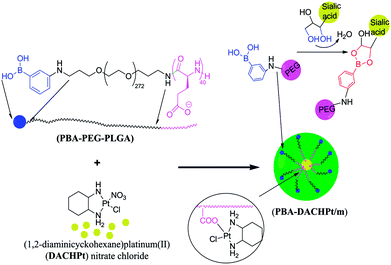 | ||
| Fig. 18 PBA moieties on the surface of the nanocarriers can identify sialic acid.170 | ||
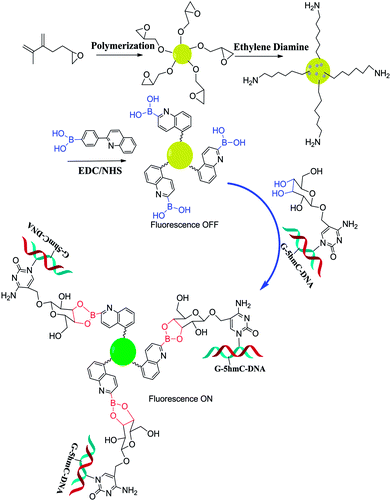 | ||
| Fig. 19 Schematic illustration of the quantification of 5hmC content in genomic DNA using the PBAQA-PGMA sensor.171 | ||
8. Conclusions and perspective
Boronic acids have been successively developed as fluorescent sensors for carbohydrates since the phenomenon that boronic acids and 1,2-dihydroxy or 1,3-dihydroxy group can reversibly bind in an aqueous solution was reported in 1959. These sensors are based on different fluorescence mechanisms such as PET, FRET and so on, which can combine with carbohydrates to achieve off-on or on-off fluorescence changes. Owing to the carbohydrates have multiple binding sites, the diboronic acid having a specific structure can significantly increase the affinity and selectivity for certain carbohydrates. The selective recognition of carbohydrates, especially those with physiological and pathological functions, is of great significance for the in-depth study of related diseases. For example, glucose selective fluorescent sensors provide great help for the diagnosis and treatment of diabetes. Fluorescent sensors targeting tumor cell surface-specific sialyl Lewis oligosaccharide lay a foundation for tumor cell imaging and in vivo imaging. Early effective diagnosis and screening of cancer have always been the direction of scientists' constant efforts. In this regard, boronic acid fluorescent sensors may provide an effective strategy. In addition, there are many reports on the identification of boronic acid sensors such as catecholamines, various ions, and reactive oxygen species. They are expected to be utilized in several analytical tasks in the future, including on-site diagnosis of disease,173 detections of ionic compounds,14–17 protein modifications,174 or cancer cells imaging.24,77In recent years, the design of boronic acid sensors has become more sophisticated, and the more fields involved. As mentioned in the review above, the selectivity can be increased by adding a boronic acid groups to the molecular structure and maintaining a comfortable spatial position, or by connecting a new material such as a quantum dots to increase the fluorescence intensity. Some new material fields endow unique properties to boronic acid sensors. For example, a smart gel that forms a multifunctional hybrid nanogel with boronic acids can respond to the release of insulin regulation by a glucose sensor detecting the blood glucose concentration. Owing to smart gels can remain in patients for long periods of time, hydrogels with highly selective glucose sensors have enormous potential for clinical treatment of diabetes.175 Simultaneously, some research has focused on exploiting next-generation functional materials for other uncharted regions, such as PBA-modified QDs,150 PBA functionalized CNTs,156 boronic acid functionalized gold nanoparticles as electrochemical sensing elements,159etc.
Although there are many fluorescent sensors reported so far, most of the discovery strategies are based on blind screening, and the hit rate is not high. A truly effective borate screening model for a target carbohydrates, especially related models based on computer-aided design, is rarely reported. The main reason is the compatibility of boronic acids in some calculation software, and some parameters combined in aqueous solution are difficult to simulate with calculation software. With the increasing number of boronic acid sensors reported so far, if we can summarize the relevant binding rules and structure–activity relationships, and establish an effective screening model to achieve a “rational design” of boronic acid sensors, it will greatly save development time and cost. Sensors targeting tumor cell surface-specific oligosaccharides have been reported now. However, due to the complexity of the physiological environment in the body and many interference factors, there is still a long way to go before they can be applied to human body. In the future, if breakthroughs can be made in terms of selectivity and fluorescence properties, achieving early diagnosis of diseases, tumor treatment and prognosis will be the gospel of cancer patients and all human beings. From a personal perspective, the research of boronic acid sensors is as hot now as it has ever been. We anticipate that this review will inspire others to explore more practical boronic acid sensors.
Conflicts of interest
The authors confirm that this article content has no conflict of interest.Acknowledgements
The authors would like to thank the Innovation Project of Shandong Academy of Medical Sciences for financial support. This work was supported by Shandong Provincial Natural Science Foundation, China (Grant No. ZR2014YL035), Shandong Academy of Medical Sciences Foundation (Grant No. 2016-5), Shandong Provincial Natural Science Foundation, China (Grant No. ZR2017PH003).Notes and references
- X. Sun and T. D. James, Chem. Rev., 2015, 115, 8001–8037 CrossRef CAS PubMed.
- B. Breiten, M. R. Lockett, W. Sherman, S. Fujita, M. Alsayah, H. Lange, C. M. Bowers, A. Heroux, G. Krilov and G. M. Whitesides, J. Am. Chem. Soc., 2013, 135, 15579–15584 CrossRef CAS PubMed.
- M. R. Lockett, H. Lange, B. Breiten, A. Heroux, W. Sherman, D. Rappoport, P. O. Yau, P. W. Snyder and G. M. Whitesides, Angew. Chem., Int. Ed., 2013, 52, 7714–7717 CrossRef CAS PubMed.
- X. Wu, X. X. Chen and Y. B. Jiang, Analyst, 2017, 142, 1403–1414 RSC.
- Y. Kubo, R. Nishiyabu and T. D. James, Chem. Commun., 2015, 51, 2005–2020 RSC.
- N. Siddiqui, N. Billa, C. Roberts and Y. A. Osei, Pharmaceutics, 2016, 8, 30 CrossRef PubMed.
- J. Jagur-Grodzinski, Polym. Adv. Technol., 2010, 21, 27–47 CAS.
- Y. Guan and Y. Zhang, Chem. Soc. Rev., 2013, 42, 8106–8121 RSC.
- G. Kaur, H. Fang, X. Gao, H. Li and B. Wang, Tetrahedron, 2006, 62, 2583–2589 CrossRef CAS.
- W. Wu, N. Mitra, E. C. Y. Yan and S. Zhou, ACS Nano, 2010, 4, 4831–4839 CrossRef CAS PubMed.
- W. Wu, T. Zhou, A. Berliner, P. Banerjee and S. Zhou, Angew. Chem., Int. Ed., 2010, 49, 6554–6558 CrossRef CAS PubMed.
- Y. J. Huang, W. J. Ouyang, X. Wu, Z. Li, J. S. Fossey, T. D. James and Y. B. Jiang, J. Am. Chem. Soc., 2013, 135, 1700–1703 CrossRef CAS PubMed.
- W. Zhai, L. Male and J. S. Fossey, Chem. Commun., 2017, 53, 2218–2221 RSC.
- X. Zhu, X. Zhou and D. Xing, Biosens. Bioelectron., 2011, 26, 2666–2669 CrossRef CAS PubMed.
- R. Guan, H. Chen, F. Cao, D. Cao and Y. Deng, Inorg. Chem. Commun., 2013, 38, 112–114 CrossRef CAS.
- S. A. Lee, G. R. You, Y. W. Choi, H. Y. Jo, A. R. Kim, I. Noh, S. J. Kim, Y. Kim and C. Kim, Dalton Trans., 2014, 43, 6650–6659 RSC.
- Z. Mohammadpour, A. Safavi, A. Omidvar, A. Mohajeri, N. Mobaraki and M. Shamsipur, J. Fluorine Chem., 2016, 190, 12–22 CrossRef CAS.
- Y. Ooyama, A. Matsugasako, K. Oka, T. Nagano, M. Sumomogi, K. Komaguchi, I. Imae and Y. Harima, Chem. Commun., 2011, 47, 4448–4450 RSC.
- Y. Ooyama, K. Furue, K. Uenaka and J. Ohshita, RSC Adv., 2014, 4, 25330–25333 RSC.
- C. Chung, D. Srikun, C. S. Lim, C. J. Chang and B. R. Cho, Chem. Commun., 2011, 47, 9618–9620 RSC.
- H. Nonaka, Q. An, F. Sugihara, T. Doura, A. Tsuchiya, Y. Yoshioka and S. Sando, Anal. Sci., 2015, 31, 331–335 CrossRef CAS PubMed.
- Ý. L. Du, N. Ni, M. Li and B. Wang, Tetrahedron Lett., 2010, 51, 1152–1154 CrossRef PubMed.
- A. Chaicham, S. Sahasithiwat, T. Tuntulani and B. Tomapatanaget, Chem. Commun., 2013, 49, 9287–9289 RSC.
- M. H. Chang and C. N. Chang, Tetrahedron Lett., 2014, 55, 4437–4441 CrossRef CAS.
- Y. Chu, D. Wang, K. Wang, Z. L. Liu, B. Weston and B. Wang, Bioorg. Med. Chem. Lett., 2013, 23, 6307–6309 CrossRef CAS PubMed.
- H. Fu, H. Fang, J. Sun, H. Wang, A. Liu, J. Sun and Z. Wu, Curr. Med. Chem., 2014, 21, 3271–3280 CrossRef CAS.
- B. Cai, Y. Luo, Q. Guo, X. Zhang and Z. Wu, Carbohydr. Res., 2017, 445, 32–39 CrossRef CAS PubMed.
- S. Huang, M. Jia, Y. Xie, J. Wang, W. Xu and H. Fang, Curr. Med. Chem., 2012, 19, 2621–2637 CrossRef CAS PubMed.
- R. Danne, C. Poojari, H. Martinez-Seara, S. Rissanen, F. Lolicato, T. Róg and I. Vattulainen, J. Chem. Inf. Model., 2017, 57, 2401–2406 CrossRef CAS PubMed.
- Y. Li, S. Li and L. Huang, Oncol. Res., 2018, 26, 123–130 CrossRef.
- K. A. Green, Y. Becker, A. Tanaka, D. Takemoto, H. L. Fitzsimons, S. Seiler, H. Lalucque, P. Silar and B. Scott, Mol. Microbiol., 2017, 103, 657–677 CrossRef CAS.
- A. Aroca, J. M. Benito, C. Gotor and L. C. Romero, J. Exp. Bot., 2017, 68, 4915–4927 CrossRef CAS.
- R. Emmerstorfer, K. Radefeld, V. Havlicek, U. Besenfelder, H. Yu, C. Mayrhofer, C. Vogl, G. Brem and S. Papp, Reprod., Fertil. Dev., 2017, 30, 205–206 CrossRef.
- N. K. Broeker, D. Andres, Y. Kang, U. Gohlke, A. Schmidt, S. Kunstmann, M. Santer and S. Barbirz, Perspect. Sci., 2017, 11, 45–52 CrossRef.
- J. P. Lorand and J. O. Edwards, J. Org. Chem., 1959, 24, 769–774 CrossRef CAS.
- G. Springsteen and B. Wang, Chem. Commun., 2001, 1608–1609 RSC.
- G. Springsteen and B. Wang, Tetrahedron, 2002, 58, 5291–5300 CrossRef CAS.
- T. D. James, K. R. A. S. Sandanayake and S. Shinkai, Angew. Chem., Int. Ed. Engl., 1994, 33, 2207–2209 CrossRef.
- X. Wu, Z. Li, X. X. Chen, J. S. Fossey, T. D. James and Y. B. Jiang, Chem. Soc. Rev., 2013, 42, 8032–8048 RSC.
- S. Jiang, J. O. Escobedo, K. K. Kim, O. Alptürk, G. K. Samoei, S. O. Fakayode, I. M. Warner, O. Rusin and R. M. Strongin, J. Am. Chem. Soc., 2006, 128, 12221–12228 CrossRef CAS.
- X. Zhang, B. Chen, M. He, Y. Zhang, L. Peng and B. Hu, Analyst, 2016, 141, 1286–1293 RSC.
- T. M. Tran, Y. Alan and T. E. Glass, Chem. Commun., 2015, 51, 7915–7918 RSC.
- J. S. Hansen, T. Hoeg-Jensen and J. B. Christensen, Tetrahedron, 2017, 73, 3010–3013 CrossRef CAS.
- L. Wang, L. Yuan, X. Zeng, J. Peng, Y. Ni, J. C. Er, W. Xu, B. K. Agrawalla, D. Su and B. Kim, Angew. Chem., 2016, 55, 1773–1776 CrossRef CAS.
- G. Jiang, W. Zhu, X. Shen, L. Xu, X. Li, R. Wang, C. Liu and X. Zhou, Microchim. Acta, 2017, 1–8 Search PubMed.
- S. J. Jung, J. Y. Lee, T. H. Kim, D. E. Lee, J. Jeon, S. D. Yang, G. H. Min, J. J. Min and D. P. Yong, Bioorg. Med. Chem. Lett., 2016, 26, 1784–1788 CrossRef CAS.
- J. Yoon and A. W. Czarnik, J. Am. Chem. Soc., 1992, 114, 276–277 Search PubMed.
- F. P. Schwarz and S. P. Wasik, Anal. Chem., 1976, 48, 524–528 CrossRef CAS.
- J. Yoon and A. W. Czarnik, Bioorg. Med. Chem., 1993, 1, 267–271 CrossRef CAS.
- T. D. James, K. R. A. S. Sandanayake and S. Shinkai, J. Chem. Soc., Chem. Commun., 1994, 47, 477–478 RSC.
- T. D. James, R. Iguchi and S. Shinkai, J. Am. Chem. Soc., 1995, 117, 8982–8987 CrossRef CAS.
- M. A. Fox, Photochem. Photobiol., 1990, 52, 617–627 CrossRef CAS.
- J.-r. Wei, Y.-l. Ni, W. Zhang, Z.-q. Zhang and J. Zhang, Anal. Chim. Acta, 2017, 960, 110–116 CrossRef CAS.
- S. Cecioni and D. J. Vocadlo, J. Am. Chem. Soc., 2017, 139, 8392–8395 CrossRef CAS.
- X. Sun, T. D. James and E. V. Anslyn, J. Am. Chem. Soc., 2018, 140, 2348–2354 CrossRef CAS.
- H. Eggert, J. Frederiksen, C. Morin and J. C. Norrild, ChemInform, 1999, 64, 3846–3852 CAS.
- Y. Liu, C. Deng, L. Tang, A. Qin, R. Hu, J. Z. Sun and B. Z. Tang, J. Am. Chem. Soc., 2011, 133, 660–663 CrossRef CAS.
- M. Shao and Y. Zhao, Tetrahedron Lett., 2010, 51, 2508–2511 CrossRef CAS.
- C. Wang, Y. Li and Y. Wei, Sens. Actuators, B, 2017, 247, 595–601 CrossRef CAS.
- T. Kawanishi, M. A. Romey, P. C. Zhu, M. Z. Holody and S. Shinkai, J. Fluoresc., 2004, 14, 499–512 CrossRef CAS.
- H. Shibata, Y. J. Heo, T. Okitsu, Y. Matsunaga, T. Kawanishi and S. Takeuchi, Proc. Natl. Acad. Sci. U. S. A., 2010, 107, 17894–17898 CrossRef CAS.
- Y. J. Heo, H. Shibata, T. Okitsu, T. Kawanishi and S. Takeuchi, Proc. Natl. Acad. Sci. U. S. A., 2011, 108, 13399–13403 CrossRef CAS.
- S. Arimori, M. L. Bell, C. S. Oh and T. D. James, Org. Lett., 2002, 4, 4249–4251 CrossRef CAS.
- R. M. Clegg, Curr. Opin. Biotechnol., 1995, 6, 103–110 CrossRef CAS.
- Y. J. Huang, Y. B. Jiang, S. D. Bull, J. S. Fossey and T. D. James, Chem. Commun., 2016, 52, 3456–3469 RSC.
- S. Jin, Y. Cheng, S. Reid, M. Li and B. Wang, Med. Res. Rev., 2010, 30, 171–257 CAS.
- Z. Sharrett, S. Gamsey, L. Hirayama, B. Vilozny, J. T. Suri, R. A. Wessling and B. Singaram, Org. Biomol. Chem., 2009, 7, 1461–1470 RSC.
- R. Badugu and C. D. Lakowicz JRGeddes, Bioorg. Med. Chem., 2005, 13, 113–119 CrossRef CAS.
- D. Bruen, C. Delaney, L. Florea and D. Diamond, Sensors, 2017, 17, 1866 CrossRef.
- B. Liu, N. Novikova, M. C. Simpson, M. S. Timmer, B. L. Stocker, T. Söhnel, D. C. Ware and P. J. Brothers, Org. Biomol. Chem., 2016, 14, 5205–5209 RSC.
- J. Axthelm, A. Shc, M. Elstner, U. R. Gandra, H. Görls, P. Bellstedt and A. Schiller, J. Am. Chem. Soc., 2017, 139, 6165–6170 CrossRef.
- H. Li, L. Zhu, X. Zhu and H. Zhang, Sens. Actuators, B, 2017, 246, 819–825 CrossRef CAS.
- N. Dey and S. Bhattacharya, Chem.–Eur. J., 2017, 23, 16547–16554 CrossRef CAS.
- X. T. Zhang, S. Wang and G. W. Xing, Chem.–Asian J., 2015, 10, 2594–2598 CrossRef CAS.
- L. C. Samaniego, M. A. Lago Huvelle, M. L. Uhrig, L. F. Coluccio and C. C. Spagnuolo, Chem. Commun., 2015, 51, 4895–4898 RSC.
- X. D. Xu, H. Cheng, W. H. Chen, S. X. Cheng, R. X. Zhuo and X. Z. Zhang, Sci. Rep., 2013, 3, 2679 CrossRef.
- T. M. Kolben, F. Kraft, T. Kolben, C. Goess, A. Semmlinger, C. Dannecker, E. Schmoeckel, D. Mayr, N. N. Sommer, S. Mahner and U. Jeschke, Future Oncol., 2017, 13, 145–157 CrossRef CAS.
- W. Yang, S. Gao, X. Gao, V. V. Karnati, W. Ni, B. Wang, W. B. Hooks, J. Carson and B. Weston, ChemInform, 2002, 12, 2175–2177 CAS.
- Y. E. Wang, R. X. Rong, H. Chen, M. Y. Zhu, B. H. Wang and X. L. Li, Chin. Chem. Lett., 2017, 28, 1262–1267 CrossRef CAS.
- Y. Wang, R. Rong, H. Chen, M. Zhu, B. Wang and X. Li, Bioorg. Med. Chem. Lett., 2017, 27, 1983–1988 CrossRef CAS.
- D. Wang, E. Ozhegov, L. Wang, A. Zhou, H. Nie, Y. Li and X. L. Sun, Glycoconjugate J., 2016, 33, 725–733 CrossRef CAS.
- A. Varki and P. Gagneux, Ann. N. Y. Acad. Sci., 2012, 1253, 16–36 CrossRef CAS.
- H. Wang, M. He, B. Chen and B. Hu, J. Anal. At. Spectrom., 2017, 32, 1650–1659 RSC.
- J. Runhaar, R. Rozendaal, M. v. Middelkoop, J. Bijlsma, M. Doherty, K. Dziedzic, L. Lohmander, T. McAlindon, W. Zhang and S. Bierma-Zeinstra, Ann. Rheum. Dis., 2017, 76, 973–974 CrossRef.
- Z. Xu, S. Wu, G. Huang, H. Ding, R. Gui and B. Zhu, Mater. Lett., 2017, 195, 131–135 CrossRef CAS.
- X. Wu, X. X. Chen, B. N. Song, Y. J. Huang, Z. Li, Z. Chen, T. D. James and Y. B. Jiang, Chemistry, 2014, 20, 11793–11799 CrossRef CAS.
- X. X. Chen, X. Wu, P. Zhang, M. Zhang, B. N. Song, Y. J. Huang, Z. Li and Y. B. Jiang, Chem. Commun., 2015, 51, 13630–13633 RSC.
- C. Sobieski, M. J. Fitzpatrick and S. J. Mennerick, J. Neurosci., 2017, 37, 1888–1899 CrossRef CAS.
- Z. Zhang, F. Liu and J. Chen, Cell, 2017, 170, 483–491 CrossRef CAS.
- M. Maffei, E. Longa, A. Sabatini, A. Vacca and S. Iotti, Eur. Biophys. J., 2017, 46, 195–202 CrossRef CAS.
- R. H. Takahashi, T. Nagao and G. K. Gouras, Pathol. Int., 2017, 67, 185–193 CrossRef CAS.
- C. Zhang, A. Griciuc, E. Hudry, Y. Wan, L. Quinti, J. Ward, A. M. Forte, X. Shen, C. Ran, D. R. Elmaleh and R. E. Tanzi, Sci. Rep., 2018, 8, 1144 CrossRef PubMed.
- E. Cabrera, P. Mathews, E. Mezhericher, T. G. Beach, J. Deng, T. A. Neubert, A. Rostagno and J. Ghiso, Biochim. Biophys. Acta, Mol. Basis Dis., 2018, 1864, 208–225 CrossRef CAS PubMed.
- K. H. Han, B. M. Arlian, M. S. Macauley, J. C. Paulson and R. A. Lerner, Proc. Natl. Acad. Sci. U. S. A., 2018, 115, E372–E381 CrossRef CAS.
- B. Baumann, A. Woehrer, G. Ricken, M. Augustin, C. Mitter, M. Pircher, G. G. Kovacs and C. K. Hitzenberger, Sci. Rep., 2017, 7, 43477 CrossRef.
- J. Sedó, J. Saiz-Poseu, F. Busqué and D. Ruiz-Molina, Adv. Mater., 2013, 25, 653–701 CrossRef.
- L. Eichhorn, F. Erdfelder, F. Kessler, R. C. Dolscheidpommerich, B. Zur, U. Hoffmann, R. K. Ellerkmann and R. Meyer, Int. J. Sports Med., 2016, 38, 85–91 CrossRef.
- A. D. Andersen, M. Blaabjerg, M. Binzer, A. Kamal, H. Thagesen, T. W. Kjaer, E. Stenager and J. B. P. Gramsbergen, J. Neurochem., 2017, 141, 614–625 CrossRef CAS.
- D. Seto, T. Maki, N. Soh, K. Nakano, R. Ishimatsu and T. Imato, Talanta, 2012, 94, 36–43 CrossRef CAS.
- Z. Wu, M. Li, H. Fang and B. Wang, Bioorg. Med. Chem. Lett., 2012, 22, 7179–7182 CrossRef CAS.
- E. J. Jun, H. Liu, Y. C. Ji, Y. L. Jin and J. Yoon, Sens. Actuators, B, 2013, 176, 611–617 CrossRef CAS.
- T. Ptak, P. Młynarz, A. Dobosz, A. Rydzewska and M. Prokopowicz, J. Mol. Struct., 2013, 1040, 59–64 CrossRef CAS.
- J. S. A. Devi, B. Aswathy, S. Asha and S. George, J. Anal. Chem., 2017, 72, 445–459 CrossRef.
- R. J. Aitken, Mol. Reprod. Dev., 2017, 84, 1039–1052 CrossRef CAS.
- B. Xiao, J. Y. Goh, L. Xiao, H. Xian, K. L. Lim and Y. C. Liou, J. Biol. Chem., 2017, 292, 16697–16708 CrossRef CAS.
- L. Du, N. Ni, M. Li and B. Wang, Tetrahedron Lett., 2010, 51, 1152–1154 CrossRef CAS.
- X. Q. Zhan, B. Y. Su, H. Zheng and J. H. Yan, Anal. Chim. Acta, 2010, 658, 175–179 CrossRef CAS.
- E. V. Lampard, A. C. Sedgwick, X. Sun, K. L. Filer, S. C. Hewins, G. Kim, J. Yoon, S. D. Bull and T. D. James, ChemistryOpen, 2018, 7, 262–265 CrossRef CAS.
- Y. Liu, J. Niu, J. Nie, F. Meng and W. Lin, New J. Chem., 2017, 41, 3320–3325 RSC.
- D. Srikun, E. W. Miller, D. W. Domaille and C. J. Chang, J. Am. Chem. Soc., 2008, 130, 4596–4597 CrossRef CAS.
- E. Lindberg and N. Winssinger, ChemBioChem, 2016, 17, 1612–1615 CrossRef CAS.
- C. Jia, J. Tang, S. Lu, Y. Han and H. Huang, J. Fluoresc., 2016, 26, 121–127 CrossRef CAS.
- P. Mahata, S. K. Mondal, D. K. Singha and P. Majee, Dalton Trans., 2016, 46, 301–328 RSC.
- A. R. Lippert, T. Gschneidtner and C. J. Chang, Chem. Commun., 2010, 46, 7510–7512 RSC.
- J. Xu, J. Zhai, Y. Xu, J. Zhu, Y. Qin and D. Jiang, Analyst, 2016, 141, 2380–2383 RSC.
- R. Radi, J. Biol. Chem., 2013, 288, 26464–26472 CrossRef CAS.
- K. B. Li, L. Dong, S. Zhang, W. Shi, W. P. Jia and D. M. Han, Talanta, 2017, 165, 593–597 CrossRef CAS PubMed.
- X. Wu, X. Sun, Z. Guo, J. Tang, Y. Shen, T. D. James, H. Tian and W. Zhu, J. Am. Chem. Soc., 2014, 136, 3579–3588 CrossRef CAS.
- W. Zhai, X. Sun, T. D. James and J. S. Fossey, Chem.–Asian J., 2015, 10, 1836–1848 CrossRef CAS.
- M. Li, H. Ge, R. L. Arrowsmith, V. Mirabello, S. W. Botchway, W. Zhu, S. I. Pascu and T. D. James, Chem. Commun., 2014, 50, 11806–11809 RSC.
- D. Maity, N. Hari and S. Mohanta, ChemistrySelect, 2017, 2, 9037–9045 CrossRef CAS.
- S. K. Kim, K. M. K. Swamy, S. Y. Chung, H. N. Kim, J. K. Min, Y. Jeong and J. Yoon, Tetrahedron Lett., 2010, 51, 3286–3289 CrossRef CAS.
- M. Li, Z. Liu, H. C. Wang, A. C. Sedgwick, J. E. Gardiner, S. D. Bull, H. N. Xiao and T. D. James, Dyes Pigm., 2017, 149, 669–675 CrossRef.
- X. Wu, X. X. Chen, B. N. Song, Y. J. Huang, W. J. Ouyang, Z. Li, T. D. James and Y. B. Jiang, Chem. Commun., 2014, 50, 13987–13989 RSC.
- C. Paolucci, I. Khurana, A. A. Parekh, S. Li, A. J. Shih, H. Li, I. J. Di, J. D. Albarracincaballero, A. Yezerets and J. T. Miller, Science, 2017, 357, 898–903 CrossRef CAS.
- Y. Zhou, H. Dong, L. Liu, M. Li, K. Xiao and M. Xu, Sens. Actuators, B, 2014, 196, 106–111 CrossRef CAS.
- Y. Kong, J. Shen and A. Fan, Anal. Sci., 2017, 33, 925–930 CrossRef CAS.
- E. P. Randviir and C. E. Banks, TrAC, Trends Anal. Chem., 2015, 64, 75–85 CrossRef CAS.
- S. T. Wang, Y. W. Sie, C. F. Wan and A. T. Wu, J. Lumin., 2016, 173, 25–29 CrossRef CAS.
- A. a. O. El-Ballouli, Y. Zhang, S. Barlow, S. R. Marder, M. H. Al-Sayah and B. R. Kaafarani, Tetrahedron Lett., 2012, 53, 661–665 CrossRef CAS.
- X. Liu, T. Li, Q. Wu, X. Yan, C. Wu, X. Chen and G. Zhang, Talanta, 2017, 165, 216 CrossRef CAS.
- T. Tian, Y. He, Y. Ge and G. Song, Sens. Actuators, B, 2017, 240, 1265–1271 CrossRef CAS.
- T. N. Narayanan, S. Alwarappan and M. O. Valappil, Curr. Org. Chem., 2015, 19, 1163–1175 CrossRef.
- X. R. Cheng, B. Y. Hau, T. Endo and K. Kerman, Biosens. Bioelectron., 2014, 53, 513–518 CrossRef CAS.
- L. Liu, N. Xia, Y. Xing and D. H. Deng, Int. J. Electrochem. Sci., 2013, 8, 11161–11174 CAS.
- M. Li, S. Y. Xu, A. J. Gross, J. L. Hammond, P. Estrela, J. Weber, K. Lacina, T. D. James and F. Marken, ChemElectroChem, 2015, 2, 867–871 CrossRef CAS.
- B. Wang, S. Takahashi, X. Du and J. Anzai, Biosensors, 2014, 4, 243–256 CrossRef CAS.
- N. Xia, X. Wang, D. Deng, G. Wang, H. Zhai and S. J. Li, Int. J. Electrochem. Sci., 2013, 8, 9714–9722 CAS.
- A. Thakur, D. Mandal, S. Sao and S. Ghosh, J. Organomet. Chem., 2012, 715, 129–135 CrossRef CAS.
- M. Li, W. Zhu, F. Marken and T. D. James, Chem. Commun., 2015, 51, 14562–14573 RSC.
- Y. Zhou, H. Dong, L. Liu, J. Liu and M. Xu, Biosens. Bioelectron., 2014, 60, 231–236 CrossRef CAS.
- G. Wulff, Pure Appl. Chem., 1982, 54, 2093–2102 Search PubMed.
- M. M. Muscatello, L. E. Stunja and S. A. Asher, Anal. Chem., 2009, 81, 4978–4986 CrossRef.
- W. Wu, T. Zhou, J. Shen and S. Zhou, Chem. Commun., 2009, 4390–4392 RSC.
- J. K. Awino, R. W. Gunasekara and Z. Yan, J. Am. Chem. Soc., 2016, 138, 9759–9762 CrossRef CAS.
- A. L. Bulin, M. Kucinska, M. Broekgaarden, E. Briars, I. Rizvi and T. Hasan, Photodiagn. Photodyn. Ther., 2017, 17, A67–A68 CrossRef.
- M. Liu, O. Voznyy, R. Sabatini, F. P. García de Arquer, R. Munir, A. H. Balawi, X. Lan, F. Fan, G. Walters, A. R. Kirmani, S. Hoogland, F. Laquai, A. Amassian and E. H. Sargent, Nat. Mater., 2016, 16, 258–263 CrossRef.
- C. Hunsur Ravikumar, J. Schiffman and B. Geetha, Quantum Dots as Fluorescent Probes: Synthesis, Surface Chemistry, Energy Transfer Mechanisms, and Applications, 2018 Search PubMed.
- L. Zhang, Z. Y. Zhang, R. P. Liang, Y. H. Li and J. D. Qiu, Anal. Chem., 2014, 86, 4423–4430 CrossRef CAS.
- S. Liu, F. Shi, X. Zhao, L. Chen and X. Su, Biosens. Bioelectron., 2013, 47, 379–384 CrossRef CAS.
- M. Zhou, J. Xie, S. Yan, X. Jiang, T. Ye and W. Wu, Macromolecules, 2014, 47, 6055–6066 CrossRef CAS.
- T. E. Brown and K. S. Anseth, Chem. Soc. Rev., 2017, 46, 6532–6552 RSC.
- J. Wackerlig and R. Schirhagl, Anal. Chem., 2016, 88, 250–261 CrossRef CAS PubMed.
- L. Li, Y. Lu, Z. Bie, H. Y. Chen and Z. Liu, Angew. Chem., 2013, 52, 7451–7454 CrossRef CAS.
- M. Ghaani, N. Nasirizadeh, S. A. Y. Ardakani, F. Z. Mehrjardi, M. Scampicchio and S. Farris, Anal. Methods, 2016, 8, 1103–1110 RSC.
- K. Yum, T. P. Mcnicholas, B. Mu and M. S. Strano, J. Diabetes Sci. Technol., 2013, 7, 72–87 CrossRef.
- M. B. Lerner, N. Kybert, R. Mendoza and R. Villechenon, Appl. Phys. Lett., 2013, 102, 183113–183114 CrossRef.
- Q. Wang, I. Kaminska, J. Niedziolkajonsson, M. Opallo, M. Li, R. Boukherroub and S. Szunerits, Biosens. Bioelectron., 2013, 50, 331–337 CrossRef CAS.
- T. V. Shishkanova, P. Fitl, V. Král and J. Barek, J. Electroanal. Chem., 2016, 761, 106–111 CrossRef CAS.
- S. K. Basiruddin and S. K. Swain, Mater. Sci. Eng., C, 2016, 58, 103–109 CrossRef CAS.
- G. Ouyang, G. Chen, J. Qiu, J. Xu, X. A. Fang, Y. Liu, S. Liu, R. Jiang, T. Luan and F. Zeng, Chem. Sci., 2016, 7, 1487–1495 RSC.
- G. Ouyang, K. D. Oakes, L. Bragg, S. Wang, H. Liu, S. Cui, M. R. Servos, D. G. Dixon and J. Pawliszyn, Environ. Sci. Technol., 2011, 45, 7792–7798 CrossRef CAS.
- O. P. Togunde, K. D. Oakes, M. R. Servos and J. Pawliszyn, Environ. Sci. Technol., 2012, 46, 5302–5309 CrossRef CAS.
- F. S. Mirnaghi and J. Pawliszyn, Anal. Chem., 2012, 84, 8301–8309 CrossRef CAS.
- W. J. Ramsay and H. Bayley, Angew. Chem., Int. Ed. Engl., 2018, 57, 2841–2845 CrossRef CAS.
- T. Nishino, H. Shiigi, M. Kiguchi and T. Nagaoka, Chem. Commun., 2017, 53, 5212–5215 RSC.
- W. Zhang, W. Liu, P. Li, H. Xiao, H. Wang and B. Tang, Angew. Chem., 2014, 126, 12697–12701 CrossRef.
- M.-H. Park, E. Reátegui, W. Li, S. N. Tessier, K. H. K. Wong, A. E. Jensen, V. Thapar, D. Ting, M. Toner, S. L. Stott and P. T. Hammond, J. Am. Chem. Soc., 2017, 139, 2741–2749 CrossRef CAS.
- A. Matsumoto, H. Cabral, N. Sato, K. Kataoka and Y. Miyahara, Angew. Chem., Int. Ed., 2010, 49, 5494–5497 CrossRef CAS.
- S. Deshayes, H. Cabral, T. Ishii, Y. Miura, S. Kobayashi, T. Yamashita, A. Matsumoto, Y. Miyahara, N. Nishiyama and K. Kataoka, J. Am. Chem. Soc., 2013, 135, 15501–15507 CrossRef CAS.
- H. Y. Chen, J. R. Wei, J. X. Pan, W. Zhang, F. Q. Dang, Z. Q. Zhang and J. Zhang, Biosens. Bioelectron., 2017, 91, 328–333 CrossRef CAS.
- A. Szwagierczak, S. Bultmann, C. S. Schmidt, F. Spada and H. Leonhardt, Nucleic Acids Res., 2010, 38, e181 CrossRef.
- A. Matsumoto, K. Kataoka and Y. Miyahara, Polym. J., 2015, 46, 483–491 CrossRef.
- P. M. Cal, R. F. Frade, C. Cordeiro and P. M. Gois, Chemistry, 2015, 21, 8182–8187 CrossRef CAS.
- Z. Li, Q. Huang, Y. Liu, Q. Wang, L. Wang, S. Xiao, F. Bi and J. Ding, Materials, 2017, 10, 170 CrossRef.
| This journal is © The Royal Society of Chemistry 2018 |

