 Open Access Article
Nitroxide radical-modified CuS nanoparticles for CT/MRI imaging-guided NIR-II laser responsive photothermal cancer therapy
Chengwan Xia†
a,
Diya Xie†a,
Lang Xionga,
Qian Zhanga,
Yang Wanga,
Zezheng Wanga,
Yuxin Wang*a,
Bin Li *a and
Chao Zhang*ab
aNanjing Stomatological Hospital, Medical School of Nanjing University, Nanjing, Jiangsu 210093, P. R. China. E-mail: 904489973@qq.com; 1libin@163.com; 1446980166@qq.com
bCollaborative Innovation Center of Chemistry for Life Sciences, College of Engineering and Applied Sciences, Nanjing University, Nanjing, Jiangsu 210093, China
First published on 31st July 2018
Abstract
Herein, we reported nitroxide radical-modified CuS nanoparticles (CuS–NO˙ NPs), and they exhibited a typical absorption peak at 1182 nm. Due to such a long wavelength absorbance, CuS–NO˙ NPs exhibited excellent therapeutic outcome and low damage to normal tissues. Besides, we simultaneously achieved CuS–NO˙ NPs for MRI and CT dual-modal imaging, which successfully provided a new strategy for imaging-guided tumor treatment, thus increasing potential clinical applications for cancer treatment.
Introduction
Many evidences have indicated that traditional cancer treatments are failing to eradicate tumors. There are two major reasons for this. On the one hand, oncotherapy is seriously influenced by tumor environment, which assists the invasion and metastasis of tumor cells and leads to cancer recurrence.1–4 On the other hand, traditional cancer treatments such as surgery, chemotherapy, and radiation result in indistinguishable small lesions, extreme drug resistance, and carcinogenesis in normal tissues.5,6 In this regard, it is essential to find new avenues for cancer treatment.Photothermal therapy (PTT) has attracted tremendous attention owing to its noninvasive nature and high photothermal conversion efficiency.7–18 Ideal PTT agents are capable of converting absorbed optical energy into heat. Good optical energy absorption is a prerequisite for such materials. Based on this, many PTT agents based on noble-metals, semiconductors, carbon, and polymers have been developed.19–26 However, most of these PTT agents display short wavelength absorbance, thus limiting tissue penetration depths and maximum permissible exposure (MPE).27–29 NIR-I ranging from 650 nm to 950 nm and NIR-II ranging from 1000 nm to 1350 nm are two NIR biological windows.30 Comparatively speaking, although the NIR-I window has been more widely researched, the NIR-II window permits deeper tissue penetration depths and higher MPE of lasers.31 Unfortunately, studies concerning PTT treatment in the NIR-II region have rarely been reported. Therefore, the synthesis of NIR-II laser-responsive PTT agents capable of achieving deeper tissue penetration depths and higher MPE is vital but remains challenging.
Herein, we successfully synthesized nitroxide radical-modified CuS nanoparticles (CuS–NO˙ NPs), which have a typical absorption peak at 1182 nm. The absorption peak was much higher than those previously reported.32 Based on this, a 1177 nm laser was employed to investigate the photothermal conversion efficiency in PTT treatment. Due to such a long wavelength absorbance, CuS–NO˙ NPs exhibited excellent therapeutic outcome and low damage to normal tissues, which were demonstrated by in vitro and in vivo tests. Besides, both the CuS nanoparticles (CuS NPs) and NO˙ radicals were stable and separately contributed to enhanced CT and T1-weighted MR imaging, respectively.33–37 In principle, CT imaging suffers from low spatial resolution, whereas MR imaging has no response to calcification. In this system, CuS–NO˙ NPs were simultaneously achieved for MRI and CT dual-modal imaging, thus successfully compensating for the low spatial resolution rendered by single CT imaging and the negative response to calcification of single MR imaging. Although some nanoparticles can be used for CT/MR dual mode imaging, they are usually composed of multicomponent metals, thereby leading to heavy-metal toxicities.38 We believe these tailor-made CuS–NO˙ NPs will provide a new strategy for CT/MR imaging-guided NIR-II laser-responsive PTT treatment and increase the possible clinical applications in cancer treatment.
Experimental section
Materials and animals
CuCl2·2H2O, sodium hydroxide (NaOH), and thioacetamide were purchased from Aladdin (Shanghai, China). SH–PEG–COOH (Mw 20![[thin space (1/6-em)]](https://www.rsc.org/images/entities/char_2009.gif) 000 Da) was bought from J&K Chemicals (Beijing, China). N-(3-Dimethylaminopropyl)-N′-ethylcarbodiimide hydrochloride (EDC, Bioxtra), N-hydroxy-succinamide (NHS, 98.0%), and phosphate-buffered saline (PBS, pH ∼ 7.4) were obtained from Jinpan Biotech (Nantong, China). Human umbilical vein endothelial cells (HUVECs) and human cervical carcinoma (HeLa) cell line were purchased from Servicebio Company (Wuhan, China). Nude mice (female, 4–6 weeks) were bought from Comparative Medicine Centre of Yangzhou University. All animal experiments were approved by the Care Committee of Nanjing University (including guidelines for animal care and use and guidelines for euthanasia of mice, Protocol #20170322-016).
000 Da) was bought from J&K Chemicals (Beijing, China). N-(3-Dimethylaminopropyl)-N′-ethylcarbodiimide hydrochloride (EDC, Bioxtra), N-hydroxy-succinamide (NHS, 98.0%), and phosphate-buffered saline (PBS, pH ∼ 7.4) were obtained from Jinpan Biotech (Nantong, China). Human umbilical vein endothelial cells (HUVECs) and human cervical carcinoma (HeLa) cell line were purchased from Servicebio Company (Wuhan, China). Nude mice (female, 4–6 weeks) were bought from Comparative Medicine Centre of Yangzhou University. All animal experiments were approved by the Care Committee of Nanjing University (including guidelines for animal care and use and guidelines for euthanasia of mice, Protocol #20170322-016).
Preparation of CuS–NO˙ NPs
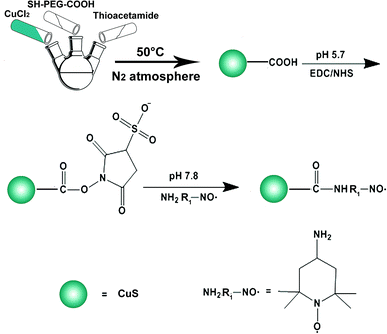
CuS–NO˙ NPs were synthesized as illustrated in Scheme 1. First, an aqueous solution (50 mL) of SH–PEG–COOH (0.1 mmol) was mixed with an aqueous solution (50 mL) of CuCl2·2H2O (0.1 mmol) and reacted for 1 h. Afterward, an aqueous solution (1 mL) of NaOH (0.5 mmol) was added dropwise to adjust the solution pH to 9. Then, the solution was transferred to a three-necked flask, and an aqueous solution (2 mL) of thioacetamide (0.1 mmol) was added. The reaction was carried out under constant stirring at 60 °C for 1.5 h, and the process was protected by N2 atmosphere. Conjugation of NO˙ was performed by activating the carboxyl groups of CuS NPs. Briefly, EDC (3 mg), sulfo-NHS (1.8 mg) and 4-amino-2,2,6,6-tetramethylpiperidinooxy free radicals (1 mg) were added to CuS NP suspension (10 mL DI water, 0.1 mg mL−1). Conjugation proceeded for 4 h at room temperature under continuous stirring. Afterwards, the resultant CuS–NO˙ NPs were harvested by centrifuging three times and washing with PBS to remove non-specifically absorbed NO˙ and excess reactants. Purified CuS–NO˙ NPs were re-suspended in PBS and stored at 4 °C before use.Characterization
The morphologies of the obtained CuS NPs and CuS–NO˙ NPs were observed by transmission electron microscopy (TEM, JEOL), and UV-vis absorption spectra were recorded on a spectrophotometer (UV3100, Shimadzu, Japan). Size distribution was confirmed by using a dynamic light scattering (DLS) instrument (Brookhaven, BI-9000AT, USA). The signal of NO˙ in CuS–NO˙ NPs was tested by electron paramagnetic resonance (EPR) experiments. To study photothermal effects, a 1177 nm diode laser (LE-LS-1177-3000TFC-D, LaserGlow Technologies, Toronto, Canada) was used. The photothermal conversion efficiency (η) was derived from the following formula10,18 (w represents laser power, 0.5 W; m represents mass of CuS–NO˙ NP solution, 1.1 × 10⁻³ kg; t represents laser irradiation time, 600 s; c represents specific heat capacity of CuS–NO˙ NP solution, 4.2 × 10³ J (kg−1 K−1); Δt represents temperature increase of PEG–DA–CuS NP solution):MTT assay
An MTT test was used to evaluate the effect of CuS–NO˙ NPs on cell viability. Briefly, HUVECs were inoculated in 96-well plates (3 × 10³ cells per well). After 12 h, the culture medium supernatant was discarded. Then, the cells were washed with PBS (pH 7.4) and co-cultured with different concentrations of CuS–NO˙ NPs for 24 h. A 20 μL volume per well of MTT was added into 96-well plates. After 4 h, DMSO was used to dissolve the blue formazan crystals for 0.5 h. The absorbance of 96-well plates was obtained at 490 nm by an ELISA plate reader (BIO-RAD Inc., USA).In vivo PET imaging
In vivo PET imaging was carried out to estimate the hypoxic level in HeLa-xenograft-bearing mice after NIR-II laser-responsive PTT treatment rendered by CuS–NO˙ NPs. Each mouse was intravenously administrated with 100 μL saline containing 18F-MISO (75 μCi) before treatment. Mice were scanned by the Inveon PET/CT system (Siemens, GER) in a micro-PET scan 1 h post administration.CT imaging assay
A clinical CT Gemstone Spectral 64-Detector CT (Discovery CT 750HD, GE Amersham Healthcare System, Milwaukee, WI) was used for all CT scans. For in vitro CT imaging, different concentrations of CuS–NO˙ NP solution (0, 1, 3, 5, and 7 mg mL−1) were added to a 6-well plate. For in vivo CT imaging, HeLa-xenograft-bearing mice received intratumoral injection of CuS–NO˙ NPs or iodixanol (4 mg kg−1) solution, and the scans were conducted 1 h post intratumoral injection.MR imaging study
A 7.0 T small animal MR scanner (Bruker PharmaScan, Germany) was used for all MR scans. A turbo spin echo sequence (parameters: field of view = 150 × 150 mm; repetition time = 400–675 ms; echo time = 18 ms; slice thickness = 1 mm; slice gap = default; matrix = 188 × 151; number of signals averaged = 2) were investigated by TEM. As shoaging. Total scan duration was set at 48 s. A turbo spin echo sequence was used for in vivo T1-weighted MR imaging with a field of view of 3.0 × 3.0 cm, twelve axial slices with a slice thickness of 1 mm, matrix size of 256 × 256, repetition time of 500 ms, and total scan time of 120 s.Infrared thermal imaging study
An infrared thermographic camera (ThermaCAM SC3000, FLIR, USA) was employed to monitor and record the change of temperature of HeLa-xenograft-bearing mice intratumorally injected with PBS or CuS–NO˙ NPs (100 μL, 1 mg mL−1) solution and exposed to a 1177 nm laser. Irradiation was carried out 1 h after injection with output power density of 0.5 W cm−2 and irradiation time of 10 min.In vitro antitumor effect
The Annexin-V-FITC/propidium iodide (PI) staining method was employed to assess in vitro PTT rendered by CuS–NO˙ NPs. Briefly, HeLa cells were seeded into 96-well plates (1 × 10⁴ cells and 100 mL medium per well) and incubated for one day. Then, the cells were washed twice with PBS, followed by incubation with CuS–NO˙ NPs. Afterward, the cells were cultured with fresh culture medium at 37 °C for 4 h. Finally, the cells were collected and resuspended in a binding buffer (500 μL). Annexin V-FITC and PI were added following the manufacturer's guidelines. After incubation in darkness at room temperature for 20 min, the samples were analysed using flow-cytometry (FACSVerse, BD Bioscience) and the relevant FlowJo software.In vivo antitumor effect
HeLa-xenograft-bearing mice, with an average tumor size of 500 mm3, were employed to assess in vivo antineoplastic efficiency. The mice were randomized into four different groups (intratumoral injection of saline (4 mg kg−1), intratumoral injection of CuS–NO˙ NPs (4 mg kg−1) alone, intratumoral injection of CuS NPs (4 mg kg−1) plus 1177 nm laser, and intratumoral injection of CuS–NO˙ NPs (4 mg kg−1) plus 1177 nm laser). Tumor size was evaluated by monitoring and recording the volume. Survival and body weight of each mouse were also monitored and recorded.Pathology analysis
Organs (lung, heart, spleen, liver, and kidney) were collected from the mice on day 7, day 15 and day 30 after NIR-II laser response PTT treatment rendered by CuS–NO˙ NPs or from untreated normal mice to observe histological changes. These collected organs were immobilized with 4% paraformaldehyde and then embedded with paraffin. Finally, representative images were obtained using a light microscope after the sections received hematoxylin and eosin (H&E) staining.Hematology and biochemical assay
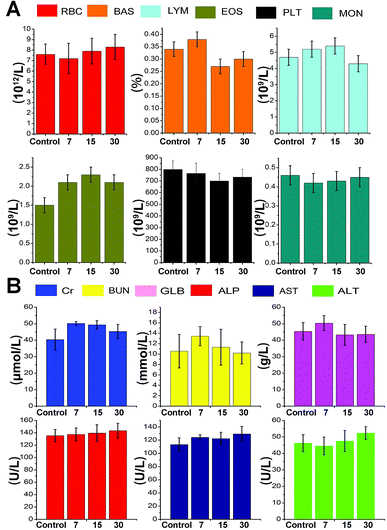
Hematology and biochemical assays were conducted by collecting mouse blood on day 7, day 15 and day 30 after NIR-II laser-responsive PTT treatment rendered by CuS–NO˙ NPs or from untreated normal mice. Peripheral blood lymphocytes (LYM), blood urea nitrogen (BUN), monocytes (MON), platelets (PLT), behavioral approach system (BAS), alanine aminotransferase (ALT), aminopherase (AST), red blood cells (RBC), serum globulin (GLB), eosinophils (EOS), alkaline phosphatase (ALP), and creatinine (Cr) were all monitored to assess biocompatibility and in vivo toxicity of CuS–NO˙ NPs.Results and discussion
Characterisation
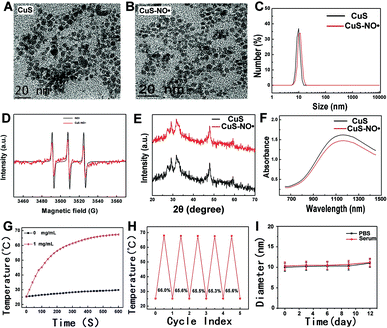
The morphologies of the as-obtained CuS NPs and CuS–NO˙ NPs were investigated by TEM. As shown in Fig. 1A and B, the addition of NO˙ did not change the size and morphology of CuS NPs; both CuS NPs and CuS–NO˙ NPs exhibited a morphology of homogeneously dispersed spheres and a mean diameter of about 10.8 nm. Furthermore, there was a slight increase in the hydrodynamic diameter after modification of NO˙ on CuS NPs, as measured by dynamic light scattering (Fig. 1C). The presence of NO˙, featuring a triplet-curve in the electron paramagnetic resonance (EPR) spectrum, was confirmed on the surface of CuS NPs (Fig. 1D). Fig. 1E shows the XRD pattern of CuS–NO˙ NPs, which is in agreement with the powder diffraction pattern of CuS (JCPDS no. 06-0464). High absorption in the NIR-II region is the prerequisite for PTT agents for use in NIR-II laser-responsive PTT treatment. As expected, both CuS NPs and CuS–NO˙ NPs showed significant absorption intensities at about 1100–1300 nm in the UV spectra, and a maximum absorption peak at 1182 nm was displayed (Fig. 1F). For this reason, a 1177 nm laser with laser power of 0.5 W cm−2 was used to irradiate the CuS–NO˙ NP solution (1 mL, 1 mg mL−1), and an infrared thermographic camera was employed to monitor and record temperature elevation. As exhibited in Fig. 1G, we could observe a sharp rise in temperature in the CuS–NO˙ group, and the temperature reached near 70 °C after 10 min irradiation, demonstrating the highly efficient NIR-II laser energy-heat conversion capacity of CuS–NO˙ NPs. Fig. 1H shows the conversion efficiency of CuS–NO˙ NPs, and the values were near 66% without clear change in the five cycles of laser irradiation, indicating CuS–NO˙ NPs could play an active role in NIR-II laser-responsive PTT treatment. It is worth mentioning that these CuS–NO˙ NPs did not show any change in hydrodynamic diameter in PBS or acidic PBS, confirming their potential to be applied in the body.MTT assay
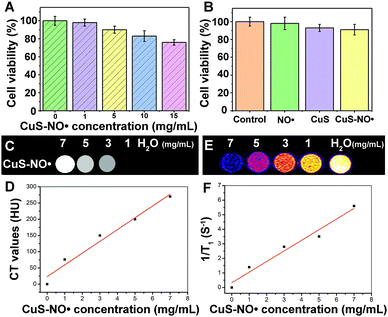
The cytotoxicity of CuS–NO˙ was evaluated via MTT analysis (Fig. 2A and B). The cells safely tolerated CuS–NO˙ below a concentration of 1 mg mL−1, as indicated by negligible loss of viability (<4%, Fig. 2A). Even when the nanoparticles were introduced in concentration as high as 5 mg mL−1, over 85% viability could still be reached (Fig. 2A), further suggesting that CuS–NO˙ NPs featured good biocompatibility and were suitable for in vivo applications. Furthermore, in each group (CuS–NO˙ NPs, CuS NPs or NO˙), there was no difference in MTT assay results after 24 h incubation (Fig. 2B) at 5 mg mL−1. Based on this, a concentration of 5 mg mL−1 CuS–NO˙ NPs was adopted in the following experiments.In vitro CT and MRI studies
CuS NPs have been reported for use in CT imaging.39 As such, CT scans of CuS–NO˙ NPs were also performed to evaluate the feasibility of CuS–NO˙ NPs for use as CT contrast agents. In vitro CT imaging is shown in Fig. 2C. It was clear that CuS–NO˙ NPs could be used for CT imaging as they showed comparably bright images (Fig. 2C). CT contrast brightness and Hounsfield unit (HU) values of CuS–NO˙ NPs increased linearly with the concentration of CuS–NO˙ NPs (Fig. 2D). At present, multi-modal imaging technology has attracted widespread attention in biomedical applications. In particular, the combination of MRI and CT is a prospect for the development of more sensitive, precise biological imaging systems and imaging guidance therapy.Owing to its high 1H water relaxivities (r1), superparamagnetic performance, and long in vivo circulation,35–37 NO˙ has been widely investigated as a T1 MRI contrast agent. We hypothesized that CuS–NO˙ NPs might also be used for MR imaging. Therefore, different concentrations of CuS–NO˙ NP aqueous solutions (0, 1, 3, 5, and 7 mg mL−1) were studied for in vitro MRI. Fig. 2E and F show that CuS–NO˙ NPs had comparably bright T1-weighted phantom images, and the brightness of T1-weighted phantom images and the longitudinal relaxivity (r1) value both increased linearly with the concentration of CuS–NO˙ NPs, indicating superior MRI function.
In vivo CT and MR imaging
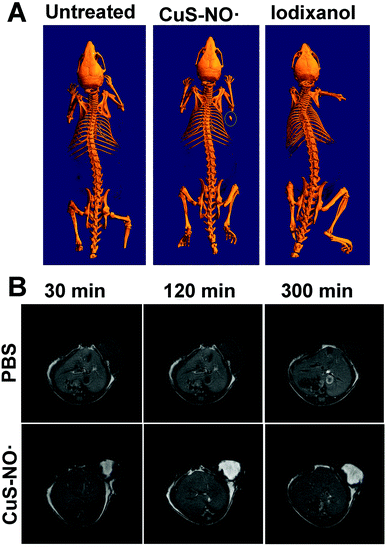
To assess the potential applications of CuS–NO˙ NPs for in vivo CT imaging, HeLa-tumor-bearing mice were intratumorally injected with CuS–NO˙ NPs or iodixanol. Significant CT signal was seen for the tumor injected with CuS–NO˙ NPs, whereas no CT signal was observed for the tumor injected with iodixanol (Fig. 3A). This is reasonable because iodixanol as a small molecule has poor retention in tumors.40–42 These results demonstrated that CuS–NO˙ NPs hold promise as CT contrast agents to locate tumor sites. Encouraged by the superior CT imaging capacity in vivo, the feasibility of CuS–NO˙ NPs for in vivo MRI was examined. The mice were anaesthetized, intratumorally injected with CuS–NO˙ NP (4 mg kg−1) solution, and then scanned with the MRI system at 30 min, 120 min, and 300 min. As expected, enhanced T1-weighted images were continuously observed over time via intratumoral injection of CuS–NO˙ NPs (Fig. 3B). Taken together, all data suggested that CuS–NO˙ NPs possessed a long time window in the CT/MRI-guided tumour treatment.Infrared (IR) thermal imaging
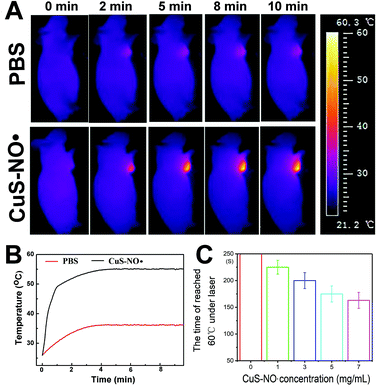
HeLa-xenograft-bearing mice were treated with intratumoral injection of PBS or CuS–NO˙ NPs and directly exposed to a 1177 nm laser to assess the photothermal effect of CuS–NO˙ NPs in vivo. As displayed in Fig. 4A, after 10 min 1177 nm NIR irradiation (0.5 W cm−2) at 1 h after injection, there was no remarkable temperature elevation of tumor in the PBS group. In contrast, the temperature elevation of the tumor in the CuS–NO˙ NP group exhibited rapid and significant increase, implying CuS–NO˙ NPs could play an important role in NIR-II laser-responsive PTT treatment. As depicted in the temperature profiles of HeLa-tumour-bearing mice (Fig. 4B), both the PBS group and CuS–NO˙ NP group exhibited temperature increase as a function of irradiation time. However, the temperature of tumor sites in the PBS group rose slowly and reached 34.5 °C at 10 min after laser irradiation, suggesting that PBS could not be used for NIR-II laser-responsive PTT treatment. In contrast, the temperature of tumor sites in the CuS–NO˙ NP group increased rapidly and reached 55.2 °C at 10 min after laser irradiation. Meanwhile, the higher the CuS–NO˙ NP concentration, the shorter the time needed to reach 55 °C (Fig. 4B), which demonstrated the potential of CuS–NO˙ NPs in NIR-II laser-responsive cancer treatment.Flow cytometry and in vivo micro-PET effect
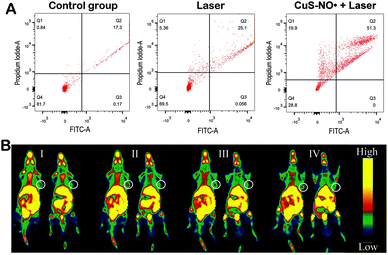
Subsequently, 1177 nm laser light was selected, and the survival rate of HeLa cells incubated with different groups (control group, Laser group, CuS–NO˙ + 300 s Laser group) was evaluated. As indicated in Fig. 5A, the control group cell survival rate (Q4) was 81.7%. However, the survival rate of the cells in the CuS–NO˙ + 300 s Laser group was only 28.8%, further demonstrating that NIR-II laser-responsive PTT rendered through CuS–NO˙ NPs was effective in killing cancer cells.PET imaging with 18F-MISO was employed to illustrate the tumor volume and analyze the hypoxia condition after NIR-II laser-responsive PTT treatment rendered by CuS–NO˙ NPs or just after intratumoral injection of saline. As exhibited in Fig. 5B, compared with the observations for the saline group, the tumor volumes in the CuS–NO˙ NP group greatly regressed after treatment. More importantly, the two groups displayed different hypoxia degrees. The hypoxia signal in four different layers of a tumor from a mouse in the CuS–NO˙ NP group was barely detected after treatment (Fig. 5B, white circle). In contrast, four different layers of a tumor from a mouse in the saline group showed serious hypoxia degree. Hypoxic zone has been reported to be associated with malignancy degree of tumor, and a high hypoxia level represents high tumor malignancy condition.10,18 As such, small range of hypoxic zone meant NIR-II laser-responsive PTT rendered by CuS–NO˙ NPs was effective for tumor treatment.
In vivo antitumor effect
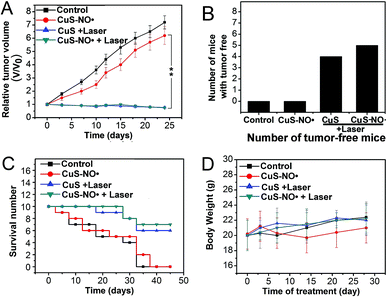
Having demonstrated that CuS–NO˙ NPs could be used for CT/MR imaging-guided NIR-II laser-responsive PTT treatment in vitro, their effects in vivo was next examined. HeLa-tumour-bearing mice treated with 4 mg kg−1 CuS–NO˙ NPs, 4 mg kg−1 CuS–NO˙ NPs with 1177 nm laser irradiation (0.5 W cm−2, 10 min), and 4 mg kg−1 CuS NPs with 1177 nm laser irradiation (0.5 W cm−2, 10 min) were monitored for 25 days. Intratumoral injection of saline was used as the control. As can be seen in Fig. 6A, rapid growth of tumor tissues was observed in the saline group and CuS–NO˙ NPs group, and tumor volumes on day 25 increased approximately 7.1- and 6.2-fold, respectively, compared with those at day 0. On the contrary, a dramatic decrease of tumor volume was observed in CuS–NO˙ NPs and CuS NPs plus laser irradiation groups. Notably, as shown in Fig. 4, 5 and 6B tumor tissues from the mice completely disappeared in the CuS–NO˙ NPs and CuS NPs plus laser irradiation groups, respectively, whereas no tumor tissue from the mice disappeared in the control and CuS–NO˙ treated groups (Fig. 6B). The same trend was seen for the life spans (Fig. 6C). No mice were alive on day 35 and day 40 in the control group and CuS–NO˙ group, respectively. In contrast, the mice in CuS–NO˙ NPs and CuS NPs plus laser irradiation groups exhibited longer life spans; seven and six mice were alive at the end in the CuS–NO˙ NPs and CuS NPs plus laser irradiation groups, respectively.Moreover, no clear changes occurred in the body weights of the mice throughout the experiment regardless of different treatments (Fig. 6D), confirming that CuS–NO˙ had no acute toxicity.
Pathological analysis and hematology assay
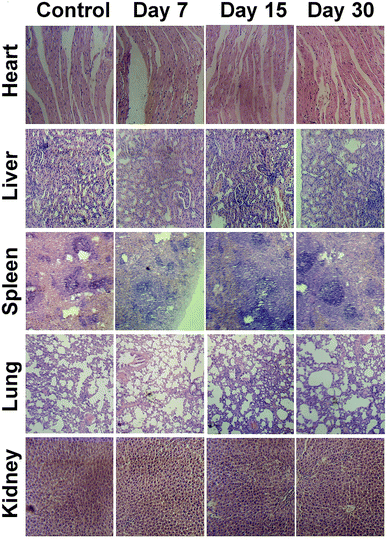
The general conditions of tumor-bearing mice were monitored after treatment. There were no clear changes in the general conditions in mice after injection of CuS–NO˙ NPs. The in vivo cytotoxicity to normal tissues was evaluated by H&E staining in major organs. As Fig. 7 shows, compared with the observations for the control group, no apparent pathological changes, including necrosis, fibrosis, and hydropic degeneration, were observed in any organs isolated from CuS–NO˙ NP-treated mice. These results confirmed the good biocompatibility of CuS–NO˙ NPs.Hematology and biochemical assays were conducted by collecting mouse blood on day 7, day 15 and day 30 after NIR-II laser-responsive PTT treatment rendered by CuS–NO˙ NPs or from untreated normal mice. Fig. 8A shows the levels of MON, PLT, EOS, LYM, BAS, and RBC; the values at 7, 15, and 30 days after NIR-II laser responsive PTT treatment rendered by CuS–NO˙ NPs were similar to those in normal mice, implying that negligible immune response had been aroused. The serum levels of ALT, AST, ALP, GLB, BUN, and Cr are connected with liver, kidney and spleen function. From Fig. 8B, no clear changes of ALT, AST, ALP, GLB, BUN, and Cr levels at 7, 15, and 30 days after NIR-II laser-responsive PTT treatment rendered by CuS–NO˙ NPs were detected compared with those in normal mice, indicating that the NIR-II laser-responsive PTT treatment rendered by CuS–NO˙ NPs did not damage the liver, kidney and spleen functions. Collectively, these results demonstrated that CuS–NO˙ NPs are safe for in vivo bioapplications.
Conclusions
In summary, we tailor-made CuS–NO˙ NPs, which had a long wavelength absorbance and exhibited excellent therapeutic outcome in the NIR-II region. Meanwhile, negligible damage to normal tissues was detected due to the low energy 1177 nm laser used in this system. Besides, both the NO˙ radicals and CuS nanoparticles were stable and separately contributed to enhanced CT and T1-weighted MR imaging, respectively. In this system, CuS–NO˙ NPs were simultaneously achieved for MRI and CT dual-modal imaging, successfully compensating for the low spatial resolution rendered by single CT imaging and negative response to calcification rendered by single MR imaging. Finally, CuS–NO˙ NPs for CT/MR dual-modal imaging-guided tumor treatment may provide a new path for the clinical applications in the treatment of cancer.Conflicts of interest
The authors report no conflicts of interest in this work.Acknowledgements
This study was supported by Medical Science and Technology Development Foundation, Nanjing Department of Health (ZKX17032) and key medical subjects of Jiangsu Province (2016).Notes and references
- J. A. Joyce and J. W. Pollard, Nat. Rev. Cancer, 2009, 9, 239–252 CrossRef PubMed.
- D. F. Quail and J. A. Joyce, Nat. Med., 2013, 19, 1423–1437 CrossRef PubMed.
- R. Mathew, V. Karantza-Wadsworth and E. White, Nat. Rev. Cancer, 2007, 11, 961–967 CrossRef PubMed.
- J. Folkman, Semin. Cancer Biol., 2003, 13, 159–167 CrossRef PubMed.
- K. Wang, X. Wu, J. Wang and J. Huang, Int. J. Nanomed., 2013, 8, 899–908 Search PubMed.
- D. P. Dearnaley, V. S. Khoo, A. R. Norman, L. Meyer, A. Nahum, D. Tait, J. Yarnold and A. Horwich, Lancet, 1999, 353, 267–272 CrossRef.
- R. L. G. Lecaros, L. Huang, T. C. Lee and Y. C. Hsu, Mol. Ther., 2016, 24, 106–116 CrossRef PubMed.
- C. Zhang, X. Cheng, M. Chen, J. Sheng, J. Ren, Z. Jiang, J. Cai and Y. Hu, Colloids Surf., B, 2017, 160, 345–354 CrossRef PubMed.
- Y. Y. He, Y. Z. Shen, S. Q. Zhou, Y. H. Wu, Z. W. Yuan, C. Wei, L. J. Gui, Y. S. Chen, Y. Q. Gua and H. Y. Chen, RSC Adv., 2018, 8, 14268–14279 RSC.
- C. Zhang, J. Ren, J. Hua, L. Xia, J. He, D. Huo and Y. Hu, ACS Appl. Mater. Interfaces, 2017, 10, 1132–1146 CrossRef PubMed.
- S. Zhao, Y. Tian, W. F. Liu, Y. Y. Su, Y. L. Zhang, Z. G. Teng, Y. Zhao, S. J. Wang, G. M. Lu and Z. H. Yu, RSC Adv., 2018, 8, 9023–9030 RSC.
- A. X. Zheng, X. L. Zhang, Y. B. Huang, Z. X. Cai, X. L. Liu and J. F. Liu, RSC Adv., 2018, 8, 6781–6788 RSC.
- Z. Liu, J. Liu, R. Wang, Y. Du, J. Ren and X. Qu, Biomaterials, 2015, 56, 206–218 CrossRef PubMed.
- F. P. Shu, D. J. Lv, X. L. Song, B. Huang, C. Wang, Y. Z. Yu and S. C. Zhao, RSC Adv., 2018, 8, 6581–6589 RSC.
- L. Liang, S. W. Peng, Z. W. Yuan, C. Wei, Y. Y. He, J. R. Zheng, Y. Q. Gu and H. Y. Chen, RSC Adv., 2018, 8, 6013–6026 RSC.
- R. M. Yang, C. P. Fu, J. Z. Fang, X. D. Xu, X. H. Wei, W. J. Tang, X. Q. Jiang and L. M. Zhang, Int. J. Nanomed., 2017, 12, 197–206 CrossRef PubMed.
- R. K. Thapa, J. Y. Choi, B. K. Poudel, H. G. Choi, C. S. Yong and J. O. Kim, Int. J. Nanomed., 2016, 11, 2799–2813 Search PubMed.
- P. Zhao, S. Ren, Y. Liu, W. Huang, C. Zhang and J. He, ACS Appl. Mater. Interfaces, 2018, 10, 3405–3413 CrossRef PubMed.
- C. Zhang, J. Ren, Y. Yang, D. Wang, J. He, D. Huo and Y. Hu, RSC Adv., 2016, 6, 113919–113923 RSC.
- S. Ren, X. Cheng, M. Chen, C. Liu, P. Zhao, W. Huang, J. He, Z. Zhou and L. Miao, ACS Appl. Mater. Interfaces, 2017, 9, 31509–31518 CrossRef PubMed.
- T. Cantu, K. Walsh, V. P. Pattani, A. J. Moy, J. W. Tunnell, J. A. Irvin and T. Betancourt, Int. J. Nanomed., 2017, 12, 615–632 CrossRef PubMed.
- Z. Wang, Z. Chen, Z. Liu, P. Shi, K. Dong, E. Ju, J. Ren and X. Qu, Biomaterials, 2014, 35, 9678–9688 CrossRef PubMed.
- S. Y. Madani, F. Shabani, M. V. Dwek and A. M. Seifalian, Int. J. Nanomed., 2013, 8, 941–950 Search PubMed.
- K. Dong, Z. Liu, J. Liu, S. Huang, Z. Li, Q. Yuan, J. Ren and X. Qu, Nanoscale, 2014, 6, 2211–2217 RSC.
- Z. Liu, X. Liu, X. Ran, E. Ju, J. Ren and X. Qu, Biomaterials, 2015, 69, 56–64 CrossRef PubMed.
- Z. Liu, J. Liu, R. Wang, Y. Du, J. Ren and X. Qu, Biomaterials, 2015, 56, 206–218 CrossRef PubMed.
- A. F. Zedan, S. Moussa, J. Terner, G. Atkinson and M. S. El-Shall, ACS Nano, 2013, 7, 627–636 CrossRef PubMed.
- H. Yuan, A. M. Fales and T. Vodinh, J. Am. Chem. Soc., 2012, 134, 11358–11361 CrossRef PubMed.
- M. Li, X. Yang, J. Ren, K. Qu and X. Qu, Adv. Mater., 2012, 24, 1722–1728 CrossRef PubMed.
- L. Prodi, E. Rampazzo, F. Rastrelli, A. Speghini and N. Zaccheroni, Chem. Soc. Rev., 2015, 44, 4922–4952 RSC.
- X. Ding, H. L. Chi, M. Zhang, R. Huang, C. Li, H. Shen, M. Liu, Y. Zou, N. Gao and Z. Zhang, J. Am. Chem. Soc., 2014, 136, 15684–15693 CrossRef PubMed.
- X. J. Liu, Q. L. Ren, F. F. Fu, R. J. Zou, Q. Wang, G. B. Xin, Z. Y. Xiao, X. J. Huang, Q. Liu and J. Q. Hu, Dalton Trans., 2015, 44, 10343–10351 RSC.
- Z. Meng, F. Wei, R. Wang, M. Xia, Z. Chen, H. Wang and M. Zhu, Adv. Mater., 2016, 28, 245–253 CrossRef PubMed.
- L. Zhang, S. Gao, F. Zhang, K. Yang, Q. Ma and L. Zhu, ACS Nano, 2014, 8, 12250–12258 CrossRef PubMed.
- A. Rajca, Y. Wang, M. Boska, J. T. Paletta, A. Olankitwanit, M. A. Swanson, D. G. Mitchell, S. S. Eaton, G. R. Eaton and S. Rajca, J. Am. Chem. Soc., 2012, 134, 15724–15727 CrossRef PubMed.
- F. Hyodo, K. I. Matsumoto, A. Matsumoto, J. B. Mitchell and M. C. Krishna, Cancer Res., 2006, 66, 9921–9928 CrossRef PubMed.
- G. Audran, L. Bosco, P. Brémond, J. M. Franconi, N. Koonjoo, S. R. A. Marque, P. Massot, P. Mellet, E. Parzy and E. Thiaudière, Angew. Chem., Int. Ed., 2015, 54, 13379–13384 CrossRef PubMed.
- J. N. Liu, W. B. Bu and J. L. Shi, Chem. Rev., 2017, 117, 6160–6224 CrossRef PubMed.
- L. Lin, X. Li, Y. Yang, L. Jing, X. Yue, X. Chen and Z. Dai, Curr. Drug Delivery, 2017, 14, 334–341 CrossRef PubMed.
- C. Peng, L. F. Zheng, Q. Chen, Q. M. Shen, R. Guo, H. Wang, X. Y. Cao, G. X. Zhang and X.-Y. Shi, Biomaterials, 2012, 33, 1107–1119 CrossRef PubMed.
- P. Moitra, K. Kumar, P. Kondaiah and S. Bhattacharya, Angew. Chem., 2014, 126, 1131–1135 CrossRef.
- S. K. Misra, P. Moitra, P. Kondaiah and S. Bhattacharya, Colloids Surf., B, 2016, 142, 130–140 CrossRef PubMed.
Footnote |
| † These authors contributed equally to this work. |
| This journal is © The Royal Society of Chemistry 2018 |

