DOI:
10.1039/C8RA04497J
(Paper)
RSC Adv., 2018,
8, 31972-31978
Influence of molecular weight on molecular dynamics and dynamic rheology of polypropylene glycol filled with silica
Received
12th June 2018
, Accepted 3rd August 2018
First published on 13th September 2018
Abstract
Molecular weight strongly influences the molecular dynamics and rheological responses of nanocomposites, which is far from being well understood. Herein molecular dynamics and rheological behaviors of hydrophilic fumed silica filled unentangled polypropylene glycol (PPG) were investigated as a function of weight averaged molecular weight (Mw) of PPG and volume fraction (∅) of silica. It is shown that Mw does not affect the glassy layers surrounding the nanoparticles and the segmental dynamics of the mobile PPG phase. On the other hand, the mobile PPG phase in the highly filled nanocomposites exhibits an abnormal “more fragile” to “stronger” transition with increasing Mw. The reinforcement and thinning behaviors are stronger in lower-Mw nanocomposites with the “more fragile” mobile PPG phase. The results suggest that reinforcement of nanocomposites affects the dynamic fragility of the mobile phase of the matrix.
Introduction
Interactions between nanoparticles and polymers significantly influence the relaxation of polymers adjacent to particles, which is usually ascribed to the main cause influencing rheological and mechanical behaviors of nanocomposites.1–4 The molecular weight, polarity and active groups of polymers strongly affect the interfacial interactions and relaxation behaviors.5–11 Differences of molecular dynamics are macroscopically reflected in changes of glass transition temperature as well as thermal, mechanical electrical, light and other properties,12–19 which allows quantifying the interfacial interactions by means of differential scanning calorimetry (DSC),19 broadband dielectric spectrum (BDS),20–23 low field nuclear magnetic resonance,24–29 small angle neutron scattering,30,31 and so on. Both BDS and DSC methods are extensively applied to investigate interfacial interactions in nanocomposites.32,33 Besides the usual segmental dynamics (α relaxation), an additional relaxation, namely, α′ relaxation, being two orders of magnitude slower than the α relaxation, could be detected in some nanocomposites containing restricted chains fractions,4,23,32,34 whose dielectric strength can be used to evaluate interfacial interactions23 and estimate the fraction of restricted chains (φimm).22,35,36 By using temperature-modulated DSC, the fraction of glassy fractions with totally forbidden α relaxation might be detected according to φg = 1 − ΔCp/[(1 − w)ΔC0p].37 Here, w is weight fraction of filler, and ΔCp and ΔC0p are heat capacity increments of the nanocomposites and neat polymer during glass transition, respectively.
Except for the significant influence of filler volume fraction (∅), the rheology of nanocomposites is highly dependent on weight-averaged molecular weight (Mw) of the matrix,38–40 nanocomposites with lower-Mw matrices exhibiting greater reinforcement and stronger nonlinearity.31,41,42 However, influences of ∅ and Mw on the interfacial interactions20,31,32,43 and rheological responses31,41,42 are far from being understood. Pissis, et al.36 using DSC and BDS find that, in silica and titania filled polydimethylsiloxane, φimm does not change while φg increases with increasing ∅.1,2 Klonos, et al.36,44 show that φimm increases with specific surface area of filler and active sites of molecular chains. Zukoski, et al.31 using low field nuclear magnetic resonance method find that, in silica filled polyethyleneglycol nanocomposites, φg and φimm increase with increasing ∅ and Mw. Considering that the interfacial interactions strongly influence rheology of nanocomposites,45–47 the present article is focused on the effects of Mw of unentangled, monodispersed polypropylene glycol (PPG) and ∅ of silica on the chains immobilization and rheology of the nanocomposites. Unentangled PPG, with Mw below critical entanglement molecular weight 5300 g mol−1 (ref. 48) or 7000 g mol−1,49 is a kind of oligomer widely used in traditional industrial fields such as coatings50,51 and adhesives52 as well as emerging materials like shear thickening fluid and liquid body armor.53,54 Fumed silica is in practice used as rheological control agents to simultaneously modify the rheological,47,55,56 thermal and mechanical properties of PPG57–59 while the combined effects of Mw of PPG and ∅ of silica on the molecular dynamics have not been investigated thoroughly. Herein dynamics and rheological behaviors of hydrophilic fumed silica (A200) filled unentangled PPG matrices (Mw = 425, 1000, 2000, 3000, and 4000 g mol−1) are investigated thoroughly.
Experimental section
Materials and sample preparation
Hydroxyl-terminated polypropylene glycol (PPG) samples (dispersity index less than 1.02, and weight-averaged molecular weight, Mw, ranging from 425 to 4000 g mol−1) were supplied by Shandong Dongda Chem. Ind. Co., Zibo, China. Hydrophilic fumed silica (A200) of 12 nm in diameter of primary spherical particles (according to the provider) was provided by Evonik Degussa Co., Akron, OH, USA. A planetary mixer was used to mix A200 dehydrated at 110 °C for at least 24 h with PPG. Mixing was performed at 300 rpm for 60 min under vacuum to ensure a homogeneous dispersion quality.55 The resultant dispersions were extruded under pressure from the mixer to plastic cylinders (300 mL) and the cylinders were sealed and stored at room temperature.
Characterization
Rheological measurements were carried out on a stress-controlled rheometer (AR-G2, TA Instruments, US) with a cone-and-plate geometry (diameter 60 mm and cone angle 1°, diameter 40 mm and cone angle 2°, or diameter 20 mm and cone angle 2° depending on viscosity of the dispersions). A steady pre-shear at a shear rate of 0.1 s−1 for 180 s was applied to the samples to release extra normal force, following by a rest of 600 s before test.41,42 Dynamic frequency (ω)-sweeps were performed at a strain amplitude 0.01% located in the linearity regime at 25 °C.
Reversing heat capacities Cp of the nanocomposites during glass transition of PPG were detected by a differential scanning calorimeter (Q100, TA Instruments, US) under modulated mode. Samples (10–12 mg) cooled to −90 °C were tested at a heating rate of 1 °C min−1 with a superimposed temperature modulation of ±1 °C in amplitude and 120 s in period.56 A sapphire sample was used to calibrate the signal of capacity before measurement. Glass transition temperature (Tg) and the associated heat capacity increments (ΔCp) of the nanocomposites were quantified using the software package “Universal Analysis 2000” provided by TA Instruments.
Broadband dielectric spectra (BDS) were measured by a high resolution broadband dielectric spectrometer (Novocontrol GmbH Concept 40, Novocontrol Techn. Co., Germany). The samples were settled in between the two electrode plates and three Teflon spacers were used to control the thickness. The sample leaked out was removed and the electrode plates were placed in an anti-leaking cell. The measurements were carried out in the frequency range from 10−1 Hz to 107 Hz. Complex permittivity, ε*(ω), at angle frequency ω can be fitted by Havriliak–Negami (HN) equation60
| |
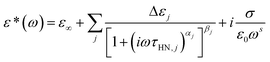 | (1) |
to determine characteristic relaxation time
τHN. Here
αj (0 ≤
αj ≤ 1) and
βj (0 ≤
βj ≤ 1) are shape factors, indicative of the breadth and asymmetry of a relaxation
j, respectively. Δ
ε =
ε0 −
ε∞ is dielectric strength, and
ε0 and
ε∞ are dielectric constants at limiting high and low angle frequencies that are determined by data fitting, respectively. The third term in
eqn (1) represents the contribution of DC conduction and
σ is conductivity and
s (0 <
s ≤ 1) is a fitting parameter responsible for the slope of the conductivity (
s = 1 for ohmic conductivity, and 1 <
s < 1 if there is an influence of electrode polarization).
61 The characteristic relaxation time
τHN is related to the time of maximum loss (
τmax) by
| |
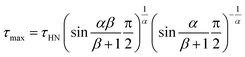 | (2) |
Results and discussion
To reveal the influence of silica on the glass transition of the PPG fraction in the nanocomposites, heat capacity of the nanocomposites (Cp) is normalized by weight fraction of PPG (1 − w). Fig. 1 shows normalized specific reversing heat capacity, Cp/(1 − w),42 as a function of temperature (T) for the nanocomposites with various ∅ and Mw and the inset shows Tg as a function of ∅. While Tg increases with Mw, it is nearly independent of ∅. It means that the nanoparticles do not necessarily affect the glass transition of the free PPG phase associated with a much small characteristic length scale typically covering only 3–5 monomers.62 Furthermore, the deviation of Tg (ΔTg ≈ 0) is not affected by Mw.63 On the other hand, C0p decreases with Mw and the increment of Cp/(1 − w) during the glass transition, ΔCp/(1 − w), decreases with ∅, proving that a fraction of PPG immobilized by silica does not undergo glass transition and forms glassy layers surrounding the nanoparticles. On the contrary, the chains beyond the glassy layer are as mobile as those in pure PPG,64 indicating that the confinement effects are thus mostly dominated by interfacial phenomena.62
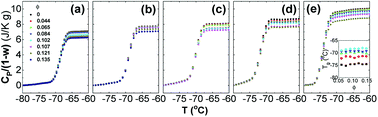 |
| | Fig. 1 Cp/(1 − w) as a function T for silica filled PPG with Mw = 4000 (a), 3000 (b), 2000 (c), 1000 (d) and 425 g mol−1 (e). The silica volume fraction (∅) is indicated in (a). Inset in (e) shows Tg as a function of ∅ for the nanocomposites with PPG of Mw = 4000 (diamond), 3000 (down-triangle), 2000 (up-triangle), 1000 (circle), and 425 g mol−1 (square). | |
In the silica filled PPG nanocomposites, the interfacial hydrogen bonding interaction facilitates the immobilization of PPG chains, which strongly reduces the chains mobility and forbids their segmental dynamics.47,55,56 Microscopic structures of dispersions may be described by a three-phase model that assumes that, beside the free phase, the polymer forms an inner glassy layer surrounding the hard nanoparticles.4,23,32,65,66 Assuming that density of PPG in the nanocomposites is constant everywhere, the fraction of the glassy layers (φg) is estimated according to φg = 1 − ΔCp/[(1− w)ΔC0p],37 from which the geometrical thickness of the glassy layers (ag) surrounding geometric ideal spheres of diameter r (6.8 nm) is determined by ag/r = [φg(1 − ∅)/∅ + 1]1/3 − 1.55,56 Fig. 2 shows φg and ag as a function of ∅. φg increases linearly against ∅ and the increment becomes faster at ∅ > 0.085. Concomitantly, ag keeps constant at about 0.4 nm and 1.2 nm at ∅ < 0.085 and ∅ > 0.085, respectively, which corresponds to about 5 and 15 monomer units being independent of Mw.20,31,32 The formed glassy layers are important for providing volume repulsive force for dispersing the nanoparticles stably.9,10,67
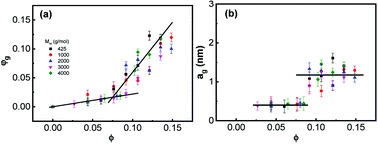 |
| | Fig. 2 (a) Fraction of glassy layer φg and (b) its thicknesses ag as a function of ∅. The lines are for guide of the eyes. | |
To reveal the influence of silica on the glass transition of the PPG fraction in the nanocomposites, dielectric loss of the nanocomposites (ε′′) is normalized by volume fraction of PPG (1 − ∅). Fig. 3 shows normalized dielectric loss ε′′/(1 − ∅) as a function of frequency f = ω/2π of the nanocomposites at −40 °C. Except for the DC conduction process in the low-f region, a strong ε′′ peak in the high-f region is related to α relaxation;32,60,68,69 another relaxation related to normal mode of molecular chains appears in the medium-f region for Mw ≥ 1000 g mol−1. The introduction of silica slight alters symmetry of the α relaxation, suggesting that there is possible a small fraction of chains at the interface with dynamics differing from the mobile phase. The HN function is used for distinguishing different relaxations by using the WinFIT Curve Fitting Software developed by NOVOCONTROL. However, due to the interference of the normal mode, it is hard to distinguish a fraction of dynamically retarded interfacial phase. Thus the fitting is performed using one HN function describing the segmental dynamics of the mobile polymer. The HN parameters are listed in Table 1. The nanocomposites of Mw = 1000, 2000 and 3000 g mol−1 have different shape factors αj and βj at different ∅, revealing the possibility of the dynamics modification in the close vicinity of silica nanoparticles. Especially, the presence of silica slightly influences the shape factors of the normal mode and α relaxation of the nanocomposites with Mw = 4000 g mol−1 and the α relaxation of those with Mw = 425 g mol−1. Nevertheless, the position and normalized dielectric strength of the α relaxation are independent of ∅, suggesting that the presence of silica does not significantly influence the segmental dynamics of the mobile PPG phase.68
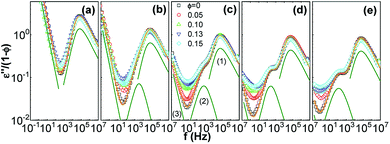 |
| | Fig. 3 ε′′/(1 − ∅) as a function of f for silica filled PPG of Mw = 425 (a), 1000 (b), 2000 (c), 3000 (d), and 4000 g mol−1 (e) at −40 °C. The dielectric spectra of PPG are fitted by HN equation (thick curves) composed by α relaxation (1), normal mode (2) and DC conduction processes (3). The distinguished individual processes are expressed as thin curves which are shifted downwards by a factor of 2. | |
Table 1 HN parameters for the dispersions
| Mw (g mol−1) |
∅ |
Normal mode |
α relaxation |
| εNM/(1 − ∅) |
αj |
βj |
εα/(1 − ∅) |
αj |
βj |
| 425 |
0 |
— |
— |
— |
9.37 |
0.93 |
0.44 |
| 0.11 |
— |
— |
— |
9.07 |
0.88 |
0.48 |
| 0.15 |
— |
— |
— |
8.42 |
0.87 |
0.49 |
| 1000 |
0 |
0.18 |
1.00 |
1.00 |
4.44 |
1.00 |
0.53 |
| 0.11 |
0.23 |
1.00 |
1.00 |
4.23 |
1.00 |
0.52 |
| 0.15 |
0.22 |
1.00 |
1.00 |
4.15 |
1.00 |
0.51 |
| 2000 |
0 |
0.28 |
1.00 |
1.00 |
3.48 |
1.00 |
0.49 |
| 0.11 |
0.33 |
0.94 |
0.99 |
3.50 |
1.00 |
0.48 |
| 0.15 |
0.32 |
0.97 |
1.00 |
3.21 |
1.00 |
0.48 |
| 3000 |
0 |
0.32 |
1.00 |
1.00 |
3.19 |
1.00 |
0.45 |
| 0.11 |
0.31 |
0.99 |
0.97 |
2.95 |
1.00 |
0.44 |
| 0.15 |
0.33 |
0.96 |
0.96 |
2.83 |
1.00 |
0.44 |
| 4000 |
0 |
0.28 |
1.00 |
1.00 |
2.97 |
1.00 |
0.48 |
| 0.11 |
0.30 |
0.86 |
0.99 |
2.82 |
1.00 |
0.44 |
| 0.15 |
0.30 |
0.88 |
0.69 |
2.70 |
1.00 |
0.42 |
The maximum relaxation times (τmax) of the α relaxation and normal mode are determined, as plotted in Fig. 4a as a function of 1/T for pure PPG. It is found that τmax of these two relaxations obeys Vogel–Fulcher–Tammann (VFT) equation
| |
 | (3) |
where
T0 is Vogel temperature,
τ0 is a characteristic time associated with vibration lifetimes, and
D is fragility parameter.
70 Tg(BDS) of PPG and it nanocomposites is estimated as the temperature at
τmax = 10
2 s for the α relaxation (as shown in
Table 2),
71,72 which is about 3–4 °C lower than that determined by DSC at 1 °C min
−1. The dynamic fragility (
m), referring to deviations from Arrhenius
T-dependence of α relaxation
73,74 is determined according to
75| |
 | (4) |
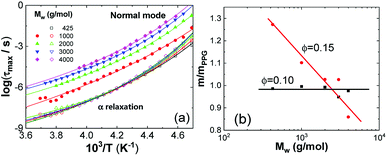 |
| | Fig. 4 (a) VFT fits to normal mode (solid symbols) and α relaxation (hollow symbols) of PPG of different Mw and (b) relative fragility m/mPPG as a function of Mw at ∅ = 0.10 and 0.15. | |
Table 2 VFT parameters for the dispersions
| Nanocomposites |
α relaxation |
Normal mode |
| Mw |
∅ |
Tg(BDS) (K) |
T0 (K) |
D |
m |
T0 (K) |
D |
| 425 |
0 |
195.3 |
160.1 |
7.7 |
84.4 |
— |
— |
| 0.10 |
196.2 |
160.4 |
7.8 |
83.2 |
— |
— |
| 0.15 |
195.7 |
163.9 |
7.8 |
107.4 |
— |
— |
| 1000 |
0 |
198.3 |
164.9 |
7.1 |
90.4 |
162.8 |
6.8 |
| 0.10 |
198.7 |
165.6 |
6.9 |
90.0 |
163.9 |
6.9 |
| 0.15 |
198.6 |
166.8 |
7.0 |
99.6 |
163.6 |
6.6 |
| 2000 |
0 |
200.3 |
167.3 |
6.9 |
92.2 |
162.7 |
7.7 |
| 0.10 |
200.2 |
167.1 |
6.9 |
91.5 |
161.8 |
7.3 |
| 0.15 |
200.5 |
168.3 |
6.7 |
94.7 |
161.9 |
7.4 |
| 3000 |
0 |
200.6 |
168.7 |
6.6 |
95.3 |
161.3 |
7.9 |
| 0.10 |
200.3 |
167.9 |
6.5 |
90.4 |
161.9 |
8.0 |
| 0.15 |
200.4 |
168.9 |
6.6 |
97.8 |
160.7 |
8.3 |
| 4000 |
0 |
200.9 |
168.6 |
6.5 |
91.6 |
167.8 |
8.1 |
| 0.10 |
201.1 |
168.4 |
6.5 |
89.4 |
166.5 |
8.2 |
| 0.15 |
201.5 |
166.3 |
6.7 |
78.7 |
168.4 |
8.2 |
The parameter m governing breadth of glass formation is related to chain packing ability and interactions.76,77 The values of m are listed in Table 2, the variation of the pure polymers with Mw being in consistence with previous observations.78 Filling at ∅ = 0.10 does not alter m and Tg (Table 2 and Fig. 4b), suggesting that the formed glassy layers totally shield the interactions between silica nanoparticles and the free PPG phase. At ∅ = 0.15, however, relative fragility (m/mPPG) decreases linearly with Mw in a semi-logarithmic plot (Fig. 4b), which tends to indicate a filling induced “more fragile” to “stronger” transition without interfering the glass transition. The behaviour at ∅ = 0.15 is different from the general trend that m and Tg vary proportionally in a variety of glass forming polymers and hydrogen bonding organic liquids,71 as well as some nanocomposites like C60 filled polystyrene.79 Many experiments80,81 and simulation investigations73,82 report an increase or decrease in m when attractive or repulsive nanoparticles are uniformly distributed in the polymer matrix. A filling induced fragile to strong transition under nanoconfinement83 in the absence of strong interfacial interactions, accompanying with reduction or nonvariation of Tg,84–86 has been generally rationalized as emerging from a finite-size truncation of the cooperative rearrangements that are posited to drive fragile (non-Arrhenius) relaxation dynamics.87–90 However, the role of fragility in nanoconfinement effects remains poorly understood in general. Nonproportional variations of m and Tg are frequently met, for examples, in ultrathin polymer films where interfacial effects dominate,91,92 or in nanocomposites with either plasticizing or antiplasticizing fillers.93 In the silica filled PPG nanocomposites at ∅ = 0.15, the breakdown of m and Tg proportionality for Mw = 4000 g mol−1 is similar to the behaviour of ultrathin polymer films and might be ascribed to the release of packing frustration. On the other hand, the abnormal m and Tg proportionality in the low-Mw nanocomposites might be related to elimination of chain ends by nanoparticles and their glassy layers. Unlike some other nanocomposites, for example, silica filled polyvinyl acetate4 and poly(2-vinylpyridine),32,65 the α′ relaxation assigned to restrained segmental dynamics of chains absorbed on the nanoparticles does not seem to be significant.
Fig. 5 shows influences of ∅ and Mw on storage and loss moduli (G′ and G′′) as a function of ω for the nanocomposites in the linear viscoelastic region. Unentangled PPG exhibits linear rheological response characterized by the classic terminal flow law (G′ ∼ ω2, G′′ ∼ ω1)94 in the ω range achieved. As φ and Mw increase, both G′ and G′′ increase and their ω-dependences become gradually lessened, implying the formation of stress-bearing filler backbones connected by adsorbed chains. All the nanocomposites at ∅ ≤ 0.15 are sol-like (G′ < G′′) except for that of Mw = 425 g mol−1 and ∅ = 0.15 that behaves gel-like (G′ > G′′). The highly filled PPG of higher-Mw, for example, the nanocomposite of ∅ = 0.16 and Mw = 3000 g mol−1, would also behave gel-like.
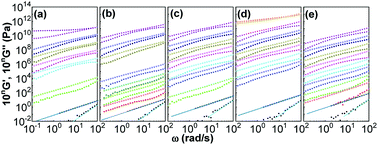 |
| | Fig. 5 ω-dependence of G′ (solid symbols) and G′′ (hollow symbols) for silica filled PPG of Mw = 425 (a), 1000 (b), 2000 (c), 3000 (d), and 4000 g mol−1 (e). The data are shifted by a factor of 10n for ∅ = 0 (n = 0, squares), 0.03 (n = 1, circles), 0.04 (n = 2, up-triangles), 0.06 (n = 3, pentagons), 0.08 (n = 4, down-triangles), 0.09 (n = 5, diamonds), 0.11 (n = 6, left-triangles), 0.12 (n = 7, right-triangles), 0.14 (n = 8, hexagons), 0.15 (n = 9, stars), and 0.16 (n = 10, spheres). The straight lines are drawn according to classic terminal flow law. | |
Fig. 6 shows influences of ∅ and Mw on ω-dependence of relative complex viscosity  defined as ratio of complex viscosity of the nanocomposites over the Newtonian viscosity of unentangled PPG. While
  increases with ∅, it decreases markedly with increasing Mw. Furthermore, the gel-like nanocomposite with ∅ = 0.15 and Mw = 425 g mol−1 demonstrates a shear-thinning behaviour being much more significant than that of the sol-like nanocomposites. It is suggested that nanoparticles reinforce the nanocomposites, enhance their nonlinearity and alter the dynamic fragility of the mobile PPG phase. The reinforcement and thinning behaviours are stronger in the lower-Mw nanocomposites with the “more fragile” mobile PPG phase.
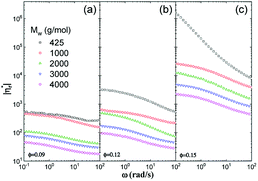 |
| | Fig. 6 ω-dependence of  for silica filled PPG at ∅ = 0.09 (a), 0.12 (b), and 0.15 (c). for silica filled PPG at ∅ = 0.09 (a), 0.12 (b), and 0.15 (c). | |
Conclusion
In silica filled PPG nanocomposites, Mw significantly influences the reinforcement without interfering the thickness of glassy layer and Tg and segmental dynamics of the mobile PPG phase. However, the mobile phase in the highly filled nanocomposite (∅ = 0.15) exhibits an abnormal “more fragile” to “stronger” transition with increasing Mw. Except for Mw = 425 g mol−1, the nanocomposites at ∅ ≤ 0.15 are sol-like. On the other hand, the one with Mw = 425 g mol−1 and ∅ = 0.15 are gel-like and exhibits a shear-thinning behaviour being much more significant than that of the sol-like ones.
Conflicts of interest
There are no conflicts to declare.
Acknowledgements
This work was supported by the National Natural Science Foundation of China (51573157, 51790503, and 51333004), and the Key Technology Program of Guizhou Province (2013-6016).
References
- D. F. Schmidt and E. P. Giannelis, Chem. Mater., 2010, 22, 167 CrossRef.
- M. Mortezaei, M. H. N. Famili and M. Kokabi, Compos. Sci. Technol., 2011, 71, 1039 CrossRef.
- Y. Yue, H. Zhang, Z. Zhang and Y. Chen, Compos. Sci. Technol., 2013, 86, 1 CrossRef.
- Y. Lin, L. P. Liu, G. M. Xu, D. G. Zhang, A. G. Guan and G. Z. Wu, J. Phys. Chem. C, 2015, 119, 12956 CrossRef.
- B. J. Anderson and C. F. Zukoski, Langmuir, 2010, 26, 8709–8720 CrossRef PubMed.
- S. Biggs, Langmuir, 1995, 11, 156 CrossRef.
- C. Buenviaje, S. R. Ge, M. Rafailovich, J. Sokolov, J. M. Drake and R. M. Overney, Langmuir, 1999, 15, 6446 CrossRef.
- J. Nordstrom, L. Aguilera and A. Matic, Langmuir, 2012, 28, 4080 CrossRef PubMed.
- S. R. Raghavan, H. J. Walls and S. A. Khan, Langmuir, 2000, 16, 7920 CrossRef.
- A. R. Studart, E. Amstad and L. J. Gauckler, Langmuir, 2007, 23, 1081 CrossRef PubMed.
- K. Ueno, S. Imaizumi, K. Hata and M. Watanabe, Langmuir, 2009, 25, 825 CrossRef PubMed.
- D. Fragiadakis and P. Pissis, J. Non-Cryst. Solids, 2007, 353, 4344 CrossRef.
- I. Dueramae, C. Jubsilp, T. Takeichi and S. Rimdusit, Composites, Part B, 2014, 56, 197 CrossRef.
- W. Zheng and S. L. Simon, J. Polym. Sci., Part B: Polym. Phys., 2008, 46, 418 CrossRef.
- P. Rittigstein and J. M. Torkelson, J. Polym. Sci., Part B: Polym. Phys., 2006, 44, 2935 CrossRef.
- G. Tsagaropoulos and A. Eisenberg, Macromolecules, 1995, 28, 6067 CrossRef.
- C. G. Robertson and M. Rackaitis, Macromolecules, 2011, 44, 1177 CrossRef.
- G. Tsagaropoulos and A. Eisenberg, Macromolecules, 1995, 28, 396 CrossRef.
- J. M. Hutchinson and S. Montserrat, Thermochim. Acta, 2001, 377, 63 CrossRef.
- P. Klonos, G. Dapei, I. Y. Sulym, S. Zidropoulos, D. Sternik, A. Derylo-Marczewska, M. V. Borysenko, V. M. Gun'ko, A. Kyritsis and P. Pissis, Eur. Polym. J., 2016, 74, 64 CrossRef.
- P. Klonos, C. Pandis, S. Kripotou, A. Kyritsis and P. Pissis, IEEE Trans. Dielectr. Electr. Insul., 2012, 19, 1283 Search PubMed.
- P. Klonos, A. Panagopoulou, A. Kyritsis, L. Bokobza and P. Pissis, J. Non-Cryst. Solids, 2011, 357, 610 CrossRef.
- M. Fullbrandt, P. J. Purohit and A. Schonhals, Macromolecules, 2013, 46, 4626 CrossRef.
- M. Geppi, S. Borsacchi, G. Mollica and C. A. Veracini, Appl. Spectrosc. Rev., 2008, 44, 1 CrossRef.
- J. Berriot, F. Lequeux, L. Monnerie, H. Montes, D. Long and P. Sotta, J. Non-Cryst. Solids, 2002, 307–310, 719 CrossRef.
- V. M. Litvinov, H. Barthel and J. Weis, Macromolecules, 2002, 35, 4356 CrossRef.
- J. W. ten Brinke, V. M. Litvinov, J. Wijnhoven and J. W. M. Noordermeer, Macromolecules, 2002, 35, 10026 CrossRef.
- A. Papon, K. Saalwachter, K. Schaler, L. Guy, F. Lequeux and H. Montes, Macromolecules, 2011, 44, 913–922 CrossRef.
- T. Cosgrove, M. J. Turner and D. R. Thomas, Polymer, 1997, 38, 3885 CrossRef.
- F. Saint-Michel, F. Pignon and A. Magnin, J. Colloid Interface Sci., 2003, 267, 314 CrossRef PubMed.
- S. Y. Kim, H. W. Meyer, K. Saalwachter and C. F. Zukoski, Macromolecules, 2012, 45, 4225 CrossRef.
- S. Cheng, A. P. Holt, H. Wang, F. Fan, V. Bocharova, H. Martin, T. Etampawala, B. T. White, T. Saito, N. G. Kang, M. D. Dadmun, J. W. Mays and A. P. Sokolov, Phys. Rev. Lett., 2016, 116, 038302 CrossRef PubMed.
- M. V. Galaburda, P. Klonos, V. M. Gun'ko, V. M. Bogatyrov, M. V. Borysenko and P. Pissis, Appl. Surf. Sci., 2014, 305, 67 CrossRef.
- A. P. Holt, J. R. Sangoro, Y. Y. Wang, A. L. Agapov and A. P. Sokolov, Macromolecules, 2013, 46, 4168 CrossRef.
- D. Fragiadakis, P. Pissis and L. Bokobza, J. Non-Cryst. Solids, 2006, 352, 4969 CrossRef.
- P. Klonos, A. Panagopoulou, L. Bokobza, A. Kyritsis, V. Peoglos and P. Pissis, Polymer, 2010, 51, 5490 CrossRef.
- A. Sargsyan, A. Tonoyan, S. Davtyan and C. Schick, Eur. Polym. J., 2007, 43, 3113 CrossRef.
- T. T. Ma, R. Q. Yang, Z. Zheng and Y. H. Song, J. Rheol., 2017, 61, 205 CrossRef.
- Y. Song, Y. Q. Tan and Q. Zheng, Polymer, 2017, 112, 35 CrossRef.
- J. P. C. Addad and L. Dujourdy, Polym. Bull., 1998, 41, 253 CrossRef.
- Z. Y. Zhu, T. Thompson, S. Q. Wang, E. D. von Meerwall and A. Halasa, Macromolecules, 2005, 38, 8816 CrossRef.
- S. S. Sternstein and A. J. Zhu, Macromolecules, 2002, 35, 7262 CrossRef.
- N. S. Jiang, M. K. Endoh, T. Koga, T. Masui, H. Kishimoto, M. Nagao, S. K. Satija and T. Taniguchi, ACS Macro Lett., 2015, 4, 838 CrossRef.
- P. Klonos, A. Kyritsis and P. Pissis, Polymer, 2015, 77, 10 CrossRef.
- B. J. Anderson and C. F. Zukoski, Macromolecules, 2009, 42, 8370 CrossRef.
- V. Geiser, Y. Leterrier and J. A. E. Manson, Macromolecules, 2010, 43, 7705 CrossRef.
- Z. Zheng, Y. H. Song, X. Wang and Q. Zheng, J. Rheol., 2015, 59, 971 CrossRef.
- C. Gainaru and R. Bohmer, Macromolecules, 2009, 42, 7616 CrossRef.
- B. A. Smith, E. T. Samulski, L. P. Yu and M. A. Winnik, Macromolecules, 1985, 18, 1901 CrossRef.
- D. K. Chattopadhyay and K. V. S. N. Raju, Prog. Polym. Sci., 2007, 32, 352–418 CrossRef.
- T. Lakshmipriya, Y. Horiguchi and Y. Nagasaki, Analyst, 2014, 139, 3977 RSC.
- H. Barthel, M. Dreyer, T. Gottschalk-Gaudig, V. Litvinov and E. Nikitina, Macromol. Symp., 2015, 187, 573 CrossRef.
- R. Chen, D. J. Pearce, S. Fortuna, D. L. Cheung and S. A. Bon, J. Am. Chem. Soc., 2011, 133, 2151 CrossRef PubMed.
- E. Glynos, L. Papoutsakis, W. Pan, E. P. Giannelis, A. D. Nega, E. Mygiakis, G. Sakellariou and S. H. Anastasiadis, Macromolecules, 2017, 50, 4699 CrossRef.
- Z. Zheng, Y. Song, H. L. Xu and Q. Zheng, Macromolecules, 2015, 48, 9015 CrossRef.
- Z. Zheng, Y. Song, R. Yang and Q. Zheng, Langmuir, 2015, 31, 13478 CrossRef PubMed.
- D. Kim, Y. Kim and J. Cho, Chem. Mater., 2013, 25, 3834 CrossRef.
- U. T. Gonzenbach, A. R. Studart, E. Tervoort and L. J. Gauckler, Langmuir, 2006, 22, 10983 CrossRef PubMed.
- F. Avilés, A. May-Pat, M. A. López-Manchado, R. Verdejo, A. Bachmatiuk and M. H. Rümmeli, Eur. Polym. J., 2018, 99, 394 CrossRef.
- F. Fan, Y. Y. Wang and A. P. Sokolov, Macromolecules, 2013, 46, 9380 CrossRef.
- K. Friedrich and S. Andreas. Broadband Dielectric Spectroscopy, Springer-Verlag Berlin Heidelberg, New York, 2003 Search PubMed.
- M. Tress, E. U. Mapesa, W. Kossack, W. K. Kipnusu, M. Reiche and F. Kremer, Science, 2013, 341, 1371 CrossRef PubMed.
- N. Simone, G. Emmanouil and B. T. Nicholas, Rep. Prog. Phys., 2017, 80, 036602 CrossRef PubMed.
- S. Srivastava, J. H. Shin and L. A. Archer, Soft Matter, 2012, 8, 4097 RSC.
- A. P. Holt, P. J. Griffin, V. Bocharova, A. L. Agapov, A. E. Imel, M. D. Dadmun, J. R. Sangoro and A. P. Sokolov, Macromolecules, 2014, 47, 1837 CrossRef.
- H. Mortazavian, C. J. Fennell and F. D. Blum, Macromolecules, 2016, 49, 298 CrossRef.
- F. J. Galindo-Rosales, F. J. Rubio-Hernandez and J. F. Velazquez-Navarro, Rheol. Acta, 2009, 48, 699 CrossRef.
- L. Zhang, B. Qiu, Y. Song and Q. Zheng, RSC Adv., 2016, 6, 66336 RSC.
- C. Gainaru, W. Hiller and R. Boehmer, Macromolecules, 2010, 43, 1907 CrossRef.
- R. Richert and C. A. Angell, J. Chem. Phys., 1998, 108, 9016 CrossRef.
- S. H. Zhang, P. C. Painter and J. Runt, Macromolecules, 2002, 35, 9403 CrossRef.
- B. D. Fitz and J. Mijovic, Macromolecules, 1999, 32, 3518 CrossRef.
- Q. Qin and G. B. McKenna, J. Non-Cryst. Solids, 2006, 352, 2977 CrossRef.
- F. W. Starr and J. F. Douglas, Phys. Rev. Lett., 2011, 106, 115702 CrossRef PubMed.
- R. Bohmer, K. L. Ngai, C. A. Angell and D. J. Plazek, J. Chem. Phys., 1993, 99, 4201 CrossRef.
- A. L. Agapov, Y. Y. Wang, K. Kunal, C. G. Robertson and A. P. Sokolov, Macromolecules, 2012, 45, 8430 CrossRef.
- W. S. Xu and K. F. Freed, Macromolecules, 2014, 47, 6990 CrossRef.
- S. Askar, L. Q. Li and J. M. Torkelson, Macromolecules, 2017, 50, 1589 CrossRef.
- A. Sanz, H. C. Wong, A. J. Nedoma, J. F. Douglas and J. T. Cabral, Polymer, 2015, 68, 47 CrossRef.
- Y. Ding, S. Pawlus, A. P. Sokolov, J. F. Douglas, A. Karim and C. L. Soles, Macromolecules, 2009, 42, 3201 CrossRef.
- H. C. Wong, A. Sanz, J. F. Douglas and J. T. Cabral, J. Mol. Liq., 2010, 153, 79 CrossRef.
- B. A. Betancourt, J. F. Douglas and F. W. Starr, Soft Matter, 2013, 9, 241 RSC.
- R. Mangal, Y. H. Wen, S. Choudhury and L. A. Archer, Macromolecules, 2016, 49, 5202 CrossRef.
- Y. P. Koh and S. L. Simon, J. Polym. Sci., Part B: Polym. Phys., 2008, 46, 2741 CrossRef.
- S. Napolitano and M. Wubbenhorst, Polymer, 2010, 51, 5309 CrossRef.
- N. T. Qazvini and E. Chehrazi, J. Macromol. Sci., Part B: Phys., 2011, 50, 2165 CrossRef.
- D. S. Simmons, Macromol. Chem. Phys., 2016, 217, 137 CrossRef.
- K. Fukao and Y. Miyamoto, Phys. Rev. E: Stat., Nonlinear, Soft Matter Phys., 2001, 64, 011803 CrossRef PubMed.
- R. A. Riggleman, K. Yoshimoto, J. F. Douglas and J. J. de Pablo, Phys. Rev. Lett., 2006, 97, 045502 CrossRef PubMed.
- H. J. Yin, S. Napolitano and A. Schonhals, Macromolecules, 2012, 45, 1652 CrossRef.
- P. Z. Hanakata, J. F. Douglas and F. W. Starr, J. Chem. Phys., 2012, 137, 244901 CrossRef PubMed.
- M. D. Marvin, R. J. Lang and D. S. Simmons, Soft Matter, 2014, 10, 3166 RSC.
- V. Pryamitsyn and V. Ganesan, Macromolecules, 2010, 43, 5851 CrossRef.
- J. C. Majeste, J. P. Montfort, A. Allal and G. Marin, Rheol. Acta, 1998, 37, 486 CrossRef.
|
| This journal is © The Royal Society of Chemistry 2018 |
Click here to see how this site uses Cookies. View our privacy policy here. 
 Open Access Article
 This Open Access Article is licensed under a Creative Commons Attribution-Non Commercial 3.0 Unported Licence
 * and
Qiang Zheng
* and
Qiang Zheng


 defined as ratio of complex viscosity of the nanocomposites over the Newtonian viscosity of unentangled PPG. While
  increases with ∅, it decreases markedly with increasing Mw. Furthermore, the gel-like nanocomposite with ∅ = 0.15 and Mw = 425 g mol−1 demonstrates a shear-thinning behaviour being much more significant than that of the sol-like nanocomposites. It is suggested that nanoparticles reinforce the nanocomposites, enhance their nonlinearity and alter the dynamic fragility of the mobile PPG phase. The reinforcement and thinning behaviours are stronger in the lower-Mw nanocomposites with the “more fragile” mobile PPG phase.
 for silica filled PPG at ∅ = 0.09 (a), 0.12 (b), and 0.15 (c).