 Open Access Article
Microstructure and characterization of aluminum-incorporated calcium silicate hydrates (C–S–H) under hydrothermal conditions†
Xiaoling
Qu
,
Zhiguang
Zhao
 * and
Xuguang
Zhao
School of Civil Engineering, Shaoguan University, Shaoguan 512005, PR China. E-mail: zhao_zhi_guang@126.com
First published on 7th August 2018
Abstract
The phase assembly and microstructure of the aluminum-incorporated CaO–SiO2–H2O system, which is technologically important in autoclaved building materials, catalysis and waste management, were investigated using XRD, SEM, FTIR and NMR depending on aluminum addition, reaction temperature and curing time. The content of each phase was obtained using the MAUD program based on the Rietveld refinement. The results revealed that the formation of the tobermorite phase was promoted at Al/(Al + Si) ≤ 0.03, and subsequently retarded by higher aluminum addition, which was corroborated by the presence of more low polymerized and cross-linked (alumino)silicate chains. The phase purity decreased with increasing aluminum addition. Aluminum changed the morphology of tobermorite from plate-like to lath-like and fibrous. About a quarter of the (alumino)silicate chains in the C–S–H structure were linked though a ![[triple bond, length as m-dash]](https://www.rsc.org/images/entities/char_e002.gif) Si–O–Al
Si–O–Al![[triple bond, length as m-dash]](https://www.rsc.org/images/entities/char_e002.gif) configuration, and this proportion was almost independent of aluminum addition. Furthermore, only Al[4] substituted for silicon in the aluminum incorporated C–S–H, while Al[6] just exited in the hydrogarnet phase. This work is beneficial for understanding the implication on micro-properties of by-products or admixtures containing aluminum in concrete.
configuration, and this proportion was almost independent of aluminum addition. Furthermore, only Al[4] substituted for silicon in the aluminum incorporated C–S–H, while Al[6] just exited in the hydrogarnet phase. This work is beneficial for understanding the implication on micro-properties of by-products or admixtures containing aluminum in concrete.
1. Introduction
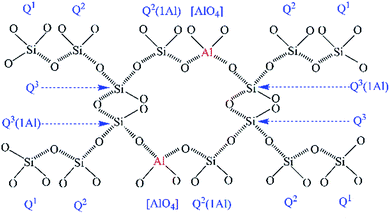
The hydrothermal products of the CaO–SiO2–H2O system are highly complex and are comprised of crystalline to amorphous phases, collectively denoted as C–S–H phases.1,2 Among the C–S–H phases, tobermorite is technologically important, not only as the main binder in autoclaved building materials, but also due to its essential roles as an adsorbent and ion exchanger, which relate to its multifarious applications in catalysis and waste management.3–6 Tobermorite is formed below 180 °C and undergoes a phase transition path: CaO + SiO2 → C–S–H gel → tobermorite.7,8 It always appears within the first 60 min, and its growth is completed within 5 h.9 Three types of tobermorite exist, namely 14 Å, 11 Å and 9 Å tobermorite, with their names relating to the d-spacing of (002) in their X-ray diffraction patterns, which depends on the number of water molecules per formula unit.7,10–12 The 11 Å tobermorite has a layered structure with a central layer of octahedral calcium accompanied by two infinite silicate chains on either side.7 The composite layers of one calcium and two silicate layers are bound together by an interlayer containing Ca2+, H+, Na+ and H2O.7,13Recently, research interest in the aluminum-incorporated CaO–SiO2–H2O system has become hot again due to the utilization of more aluminum-bearing raw materials (e.g. metakaolinite,8,11 kaolinite,1 zeolite,6 newsprint recycling residue12 and fly ash14–17) and the optimization of its ion exchange performance.4 It has also been reported that aluminum could influence the formation of tobermorite to form Al-substituted tobermorite, in which Al substitution occurred at the Q2 or Q3 sites (the symbol Q represents one SiO4 tetrahedron and the superscript indicates the number of other Q units to which it is bonded),7 as illustrated in Fig. 1.
The coordination number of Al in the tobermorite is getting more and more attention. Kalousek first demonstrated that Al substituted for Si in the SiO4 tetrahedral sites, which was confirmed by Black et al. using X-ray photoelectron spectroscopy.18,19 Komarneni et al. further illustrated that Al[4] primarily entered Q2 and Q3 silicate chain sites.4,17 Subsequently, others suggested that Al[5] and Al[6] also occurred in tobermorite. Stade and Müller proved that both Al[4] and Al[6] appeared in synthetic C–S–H.20 Faucon et al. refined these conclusions and proposed a model showing Al[4] on both the pairing and bridging SiO4 tetrahedral chains, Al[5] in the interlayer, and Al[6] substituting for Ca in the central Ca–O sheet.10 Andersen et al. denied that Al[6] occurred in the central layer of the octahedral calcium.21 More recently, Sun et al. experimentally supported the results of Andersen et al. and identified that only Al[4] occurred in the bridging SiO4 tetrahedra.14
Black et al. deduced that a charge imbalance existed in the tobermorite, based on the observation that no change occurred in the Ca/(Si + Al) ratio upon Al substitution.19 Therefore, a charge balance has to be achieved via a coupled substitution: □ + OH− → Ca2+ + O2−, whereby □ represents the so-called “empty” position. The most common form of “□” is Na+, and other metal ions such as Cd2+, Pb2+, Co2+, Ni2+ and Cs+ can also act as charge compensators. This characteristic gives tobermorite superior ion exchange performance.22–24 Meanwhile, Black et al. reported that Al substitution into the silicate structure led to a decrease in Si 2p binding energies, implying a weakening in the degree of silicate polymerization.19 On the other hand, a decreasing of the polymerization of the silicate chains was also demonstrated by a greater relative intensity of the Q1 site peak in the 29Si nuclear magnetic resonance spectra.14
Al substitution not only results in a deviation from the ideal structure of tobermorite, but also affects its growth and morphology, and even yields the hydrogarnet phase (C3AS3−xH2x, x = 0–3). In particular, the effects of aluminum on the acceleration or retardation of the formation of tobermorite are different, as has been reported. The lime-quartz reaction and the crystallization rate of tobermorite were retarded with increasing Al-bearing material (metakaolin) at 180 °C, as was observed by Klimesch and co-workers.11,17,25–27 They indicated that the presence of aluminum reduced the structural order and thermal stability of tobermorite, identified by the fact that 11 Å tobermorite transformed into 9 Å tobermorite at a lower temperature. This was due to the lower Al–O binding energy.14,19 In addition, hydrogarnet invariably appeared before tobermorite, but tended to deform as the reaction time increased. Noticeably, tobermorite changed from a plate-like morphology to fibrous, and hydrogarnet changed from octahedral single crystals to clusters. Mostafa et al. found that 2 mol% Al3+ additions resulted in a decrease in the degree of crystallinity of tobermorite within 4 h and then an increase in the crystallinity for 24 h in the stirred suspension at 175 °C. Consequently, the morphology of tobermorite changed from plate-shape to lath-shape.3 Shaw et al. confirmed that the rate constant k for the formation of tobermorite increased with increasing aluminum content from Al/(Al + Si) = 0 to 0.15, and the corresponding activation energy was calculated to increase from 19 to 37 kJ mol−1.7 Moreover, the authors reported that the presence of Al3+ accelerated the crystallization rate of tobermorite.8 Al substitution into the silicate structure led to a decrease in the Si 2p binding energies, implying a weakening in the degree of silicate polymerization, which was demonstrated by a greater relative intensity of the Q1 site peak in the 29Si nuclear magnetic resonance spectra.14,19 Therefore, tobermorite is readily formed from the shorter silicate chains.
It was confirmed that aluminum incorporation led to the formation of hydrogarnet and played a significant role in the formation of tobermorite.18,24,28 Serry et al. found that hydrogarnet crystallized at the early stage of hydration in the low-lime content mixtures of metakaolin and lime.29 Siauciunas and Baltusnikas determined that hydrogarnet always tended to form more rapidly than tobermorite in the CaO–quartz and CaO–amorphous SiO2 suspensions with Al/(Al + Si) = 0.1 at 175 °C, and that then about 50% of the hydrogarnet fractured to release CaO and Al3+ over 24 h. The CaO and Al3+ reacted with SiO2 and inserted into tobermorite, respectively. They also pointed out that both the chemical composition of hydrogarnet and the maximum content of Al3+ inserted into C–S–H depended on the SiO2 source used. Hydrogarnet was displayed in the form of Si-free hydrogrossular [Ca3Al2(O4H4)3] and katoite [Ca3Al2(SiO4)0,5(OH)10] when quartz and amorphous SiO2 were used as the SiO2 source, respectively. Due to the material’s lower solubility, the maximum content of Al3+ inserted into C–S–H with quartz as the SiO2 source could not reach 75% of that with amorphous SiO2 as the SiO2 source over 24 h at 175 °C.30
Studies analyzing the aluminum-incorporated CaO–SiO2–H2O system have identified that the as-synthesized products change and secondary phases form with the uptake of aluminum. However, the crystalline phases are hard to quantify due to the inevitable C–S–H gel in the CaO–SiO2–H2O system. Since its development in the 1960s, the Rietveld refinement of powder X-ray diffraction has been not only used to determine the crystalline phase fractions in cements and clinkers, but also to quantify the amorphous content of complex mixtures based on the weighed amount of a suitable standard.31,32 The motivation of this study is to better understand the effect of aluminum incorporation on the properties and microstructure of C–S–H and to clarify the phase transformation of the aluminum-incorporated CaO–SiO2–H2O system under hydrothermal conditions. The Rietveld refinement of the X-ray diffraction was employed to simultaneously determine the content of the amorphous phase and crystalline phases. The information about the types and structures of the silicate anions was provided from the FTIR spectra and NMR spectra. Moreover, changes in the micro-morphology of the hydrothermal products were observed using SEM.
2. Experimental
2.1 Hydrothermal synthesis
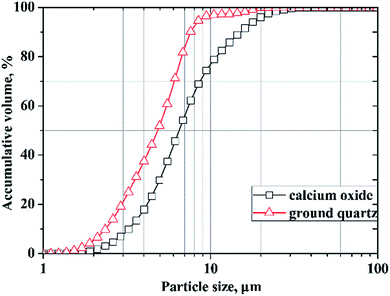
In this study, calcium oxide was prepared by burning pure grade calcium carbonate at 1000 °C for 6 h according to the literature.30 Finely ground quartz (SiO2 > 99.8%) was used as the silica source. The particle size distributions of the calcium oxide and ground quartz that were measured using laser diffraction technology (Mastersizer 2000) are shown in Fig. 2. Aluminum hydroxide of analytical purity was added as the Al-bearing compound, and the deionized water used was obtained via standard purification methods.Hydrothermal syntheses were carried out in a Teflon-lined steel autoclave equipped with a power driven stirrer and a heat controller. The molar ratios of the initial mixtures were in accord with the ideal composition of tobermorite (Ca5Si6O16(OH)2·4H2O). For all of the experiments, the designed molar ratio of Ca/(Si + Al) was fixed at 0.83, and the substitution molar ratio of Si by Al was calculated as the molar ratio of Al/(Al + Si). The Al/(Al + Si) molar ratios varied from 0 to 0.12. Dry primary mixtures were stirred with deionized water (water/solid ratio of the suspension = 15) for 30 min in advance to guarantee the starting materials were uniformly distributed. Then, the suspensions were quickly added into the autoclave. The autoclave was maintained at the predetermined temperature for different times and then allowed to cool naturally. The products were then collected, washed five times with distilled water and then dried at 80 °C overnight.
2.2 Characterization
X-ray diffraction (XRD) patterns were recorded using a PANalytical X’Pert Pro diffractometer equipped with CuKα radiation (40 kV and 40 mA), and a step size of 0.033°. The X’Pert Highscore Plus software involving the JCPDS-PDF database as a source of reference data was employed to identify the possible crystalline phases in the powdery samples. The peak positions and intensities were identified using the peak search finder feature in the software. The crystalline phases identified by the search match procedures were subsequently employed in the quantitative XRD phase analyses, which were extracted from the Rietveld refinements performed in the MAUD software program.33 The program applied the RITA/RISTA method as developed by Ferrari and Lutterotti34 to analyze the diffraction spectra. α-Al2O3 was used as the internal standard to simultaneously determine the content of the amorphous phase,31,32 and then the crystalline phases. The crystal structures used to calculate the powder patterns were taken from the Inorganic Crystal Structure Database (ICSD). The collection codes for the various structures were: α-Al2O3 160914, quartz 90145, tobermorite 92942 and hydrogarnet 202316. The parameters refined were: background coefficients, cell parameters, crystal structures, amount and microstructure of phase, and texture.35,36 A correction of the slight deformation caused by aluminum incorporation into the structure of tobermorite was applied to the cell parameters (a, b and c) if necessary during the refinement.22 The proportion of all of the phases and the goodness of fit were obtained after the program had finished running. The amorphous content was calculated from the difference in the known wt% content of the standard and the wt% calculated from the refinement, as described by eqn (1).31 Then, the content of the crystalline phases was calculated by dividing the rest by the relevant proportion. | (1) |
Scanning electron microscopy (Nova NanoSEM 430) coupled with energy-dispersive spectroscopy (EDS) was used to examine the morphology of the samples, as well as their elemental composition. All of the samples were coated with a thin film of gold.
FTIR spectra were recorded in the range of 400–4000 cm−1 on a VERTEX 70 FTIR spectrometer. For the measurements, 1 mg of the sample was diluted in 200 mg KBr, and was then pressed into disks suitable for FTIR measurement.
NMR spectra for 29Si and 27Al were acquired at 9.4 T using a Bruker Avance III HD-400M spectrometer. The spectra were recorded at 79.49 MHz and a spinning rate of 5 kHz with a 5 second relaxation delay for the 29Si NMR experiments, and at 104.26 MHz and a spinning rate of 12 kHz with a 1 second relaxation delay for the 27Al NMR experiments. The spectral deconvolutions carried out on the MestReNova software were referred to the Gaussian line-shape.37 The silicate chain configurations were evaluated using “mean chain length” (MCL) and “cross-linking quotient” (CLQ), which are the average number of (alumino)silicate tetrahedra per tobermorite-like chain in the C–(A–)S–H structure and the ratio of the bridging tetrahedra that link the interlayer relative to the total number of tetrahedra, respectively.38 Calculations are as follows:
 | (2) |
 | (3) |
3. Results and discussions
3.1 Analysis of the phase compositions
The XRD patterns of the synthesized products are presented in Fig. 3. For the products prepared at 180 °C for 7 h (see in Fig. 3a), it was determined that the crystalline C–S–H phase was the 11 Å tobermorite phase (JCPDS card no. 19-1364). This was identified by the fact that the basal spacing of the (002) lattice plane (2θ ∼ 7.8°) was around 11.5 Å for each product. The obvious peaks of the (002) lattice plane demonstrate a good layer-stacking structure. The XRD data shows almost no significant change in the (002) cell dimension, which thus precludes that Al substituted for Ca in the Ca–O sheet due to their very different ionic radii (0.99 Å for Ca and 0.50 Å for Al14). The constant (002) cell dimension also demonstrates that the fundamental Ca-silicate structure of tobermorite almost did not change when Al substituted for Si.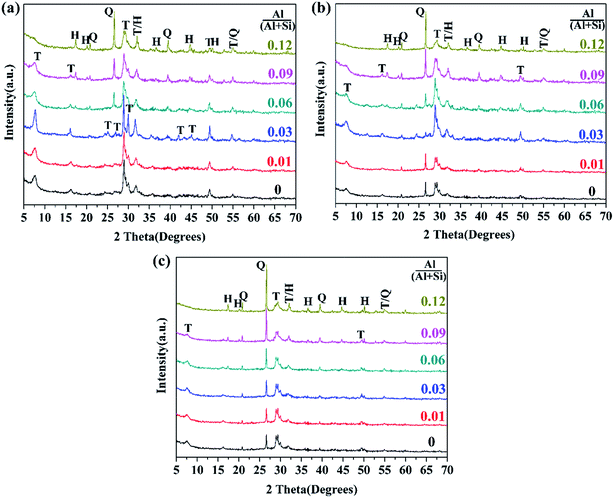 | ||
| Fig. 3 XRD patterns of the synthesized products with different aluminum additions: (a) 180 °C, 7 h; (b) 180 °C, 5 h; (c) 160 °C, 7 h. Indexes: T—tobermorite; Q—quartz; H—hydrogarnet. | ||
All of the XRD patterns were drawn with the same scale, and thus the tobermorite crystallinity of each product could be compared via the relative intensity and broadening of the XRD peaks. The main peaks at (002)/(2θ ∼ 7.8°), (220)/(2θ ∼ 28.9°) and (222)/(2θ ∼ 29.9°) that were assigned to 11 Å tobermorite became intensive and sharper at Al/(Al + Si) = 0.03, which demonstrates the high crystallinity of 11 Å tobermorite. The tobermorite crystallinity decreased with increasing aluminum addition when Al/(Al + Si) > 0.03, and at the same time, the diffraction peaks indexed to quartz (JCPDS card no. 70-3755) and hydrogarnet (JCPDS card no. 84-1354) appeared, and their intensities increased with increasing aluminum addition. The ease of tobermorite crystallization is known to be affected by the structure of the C–S–H precursor.27 The role of Al substitution on the crystallization of tobermorite depends on its influence on the structure of the C–S–H precursor. Reasonable Al substitution promotes the transformation of the C–S–H precursor structure into the tobermorite structure, but more Al substitution has an adverse effect. Klimesch et al. suggested that the crystallization of tobermorite decreased with increasing aluminum-bearing raw material (metakaolin) addition due to the influence on the nature of the C–S–H precursor.11,27
For the products prepared at 180 °C for 5 h (see in Fig. 3b), the tobermorite crystallinity was also significantly enhanced at Al/(Al + Si) = 0.03, and it then subsequently decreased with further increasing of the Al/(Al + Si) ratio. The diffraction intensities of the quartz peaks were at a minimum at Al/(Al + Si) = 0.03 and then gradually strengthened, displaying a contrary tendency compared with the peaks of tobermorite. This phenomenon indicates that more Al substitution retarded the reaction between CaO and SiO2 due to some changes in the structure of the C–S–H precursor.11,27 Hydrogarnet was always detected from Al/(Al + Si) = 0.06 at different reaction times. Al-Wakeel et al. indicated that excess Al2O3 appeared as the hydrogarnet phase in the hydrothermally treated CaO–SiO2–Al2O3–H2O system.28 Kalousek et al. also found that hydrogarnet was only detected when the Al2O3 content was above about 5%.18 In fact, hydrogarnet was metastable, was always among the first phases formed in the CaO–SiO2–Al2O3–H2O system under hydrothermal conditions, and appeared before tobermorite.11,17,25,27,30 However, this phase was decomposed and consumed with reaction time, and its final existence depended on the reaction time and the bulk composition. Klimesch et al. confirmed that hydrogarnet was no longer present in the metakaolin-lime-quartz slurries after 4 h of autoclaving at 180 °C when the Al2O3 content was less than 6.4%, while hydrogarnet remained with an Al2O3 content of 11.5%.27
For the products prepared at 160 °C for 7 h (see in Fig. 3c), the diffraction intensities of the tobermorite peaks did not change with Al substitution, suggesting that the positive role of aluminum on the tobermorite crystallization disappeared at lower reaction temperatures. This is meaningful for technological applications.
3.2 Rietveld refinement results
For the Rietveld refinement of the X-ray diffraction analyses, homogeneously mixed powders with α-Al2O3 and the products at a mass ratio of 15![[thin space (1/6-em)]](https://www.rsc.org/images/entities/char_2009.gif) :
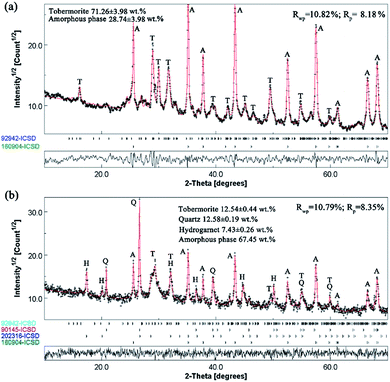
:![[thin space (1/6-em)]](https://www.rsc.org/images/entities/char_2009.gif) 85 were used as checked specimens, and some of the fitted patterns are shown in Fig. 4. The final values of the weighted profile R factors, Rwp and Rp, were all in the range 10 ± 5%, which are values that are generally accepted as valid in the literature.39 The refined phase compositions of all of the products are shown in Fig. 5.
85 were used as checked specimens, and some of the fitted patterns are shown in Fig. 4. The final values of the weighted profile R factors, Rwp and Rp, were all in the range 10 ± 5%, which are values that are generally accepted as valid in the literature.39 The refined phase compositions of all of the products are shown in Fig. 5.
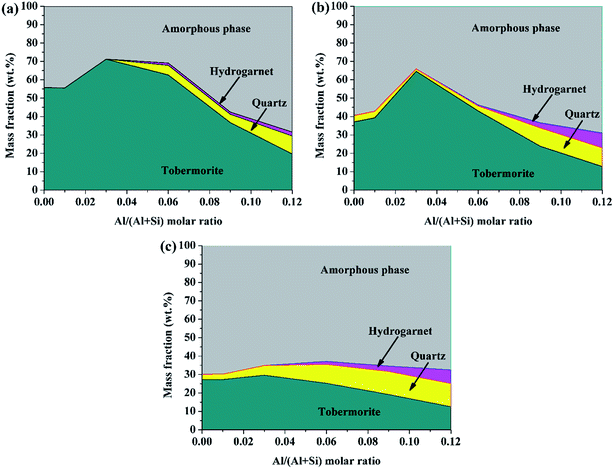 | ||
| Fig. 5 Solid phase compositions of the products determined using Rietveld refinement of the X-ray diffraction analyses: (a) 180 °C, 7 h; (b) 180 °C, 5 h; (c) 160 °C, 7 h. | ||
The content of tobermorite reached its maximum (71.2%) at Al/(Al + Si) = 0.03 in the product prepared at 180 °C for 7 h, and was increased by 27.9% compared with that of the product without aluminum incorporation, but was subsequently reduced to 19.6 wt% at Al/(Al + Si) = 0.12. The quantity of tobermorite was also at its maximum (64.6%) at Al/(Al + Si) = 0.03 in the product prepared at 180 °C for 5 h, and was increased by 42.6% compared with that of the product without aluminum incorporation. However, the maximum content of tobermorite in the product prepared at 160 °C for 7 h was less than half that of the products prepared at 180 °C. This indicates that the hydrothermal temperature is a critical factor for the formation of tobermorite. The content of quartz and hydrogarnet always increased with an increasing Al/(Al + Si) ratio. Thus, the phase purity decreased with increasing aluminum addition. Previous studies have indicated that the phase purity in the synthesized calcium (alumino)silicate hydrate specimens decreased as the Al/Si and Ca/(Al + Si) molar ratios of the solid phases increased.40 In the present study, relatively phase-pure tobermorite was formed at Al/(Al + Si) = 0.03 at 180 °C for 7 h. This also confirmed that the transformation of tobermorite from C–S–H gel was augmented in the presence of reasonable aluminum incorporation. The phase evolutions in the hydrothermally treated CaO–SiO2–H2O system with different aluminum additions are illustrated in Fig. 6.
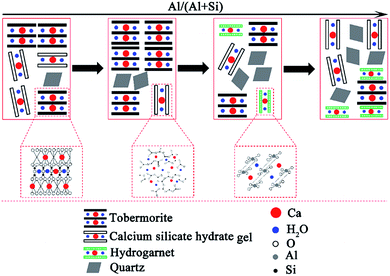 | ||
| Fig. 6 Schematic illustration of the phase evolutions in the hydrothermally treated CaO–SiO2–H2O system with different aluminum additions. | ||
In the process of C–S–H formation and crystallization, Ca2+ quickly forms in the suspension while the solubility of quartz is low, so Ca2+ is significantly excessive relative to the effective Si4+. Due to this reason, the C–S–H precursor with a higher Ca/Si ratio is formed. The formation of the initial C–S–H precursor is progressively followed by an ordering mechanism to crystallize and form tobermorite.7 The formation and crystallization processes of C–S–H are illustrated in Fig. 7. This ordering mainly involves an increase in the silicate chain length through the inclusion of tetrahedra into vacancies in the chains.7 The Ca-rich C–S–H has short chains and rearranges more easily to form crystalline tobermorite.3 The initial formation of the C–S–H precursor can be enhanced by Al substitution. A kinetic study carried out by Pardal et al.22 showed that the formation of aluminum-substituted C–S–H was a fast reaction that took typically less than a few hours. The existence of enough C–S–H precursor is favor for the formation of tobermorite. Apart from this nature of ordering, a suitable amount of aluminum leads to a higher degree of polymerization of the silica tetrahedral by taking up the bridging position with tetrahedral coordination, thus leading to a longer silicate chain length.19 Once the Al substitution is beyond the suitable value, hydrogarnet is formed in significant amounts, which retards the formation of tobermorite from the initial Ca-rich C–S–H due to a lack of available Ca2+ in sufficient quantity.41,42 According to the results of the EDS, the Ca/Si ratio of the hydrothermal products prepared at 180 °C for 7 h decreased from 0.79 to 0.52 as the Al/(Al + Si) ratio increased from 0 to 0.12.
3.3 Fourier transformed infrared spectroscopy
The FTIR spectra of the hydrothermal products prepared at varying reaction temperature and time are shown in Fig. 8. We will only discuss the 1300–400 cm−1 region, in which the spectra showed remarkable changes. The vibration spectra of all of the samples could be mainly divided into three groups of bands. The first group was due to the deformation or bending vibration of the SiO4 tetrahedra, which is represented by the intense bands between 400 and 530 cm−1;3,43 the second group (the bands at 1085, 800, and 780 cm−1) originated from quartz;1,28 the third group was assigned to the stretching vibration of the Si–O bands and ranged from 900 to 1200 cm−1, as well as at around 670 cm−1.1,3,28,43–45 In addition, the weak shoulder at around 870 cm−1 was attributed to CO32−, which probably resulted from a slight carbonation.3,45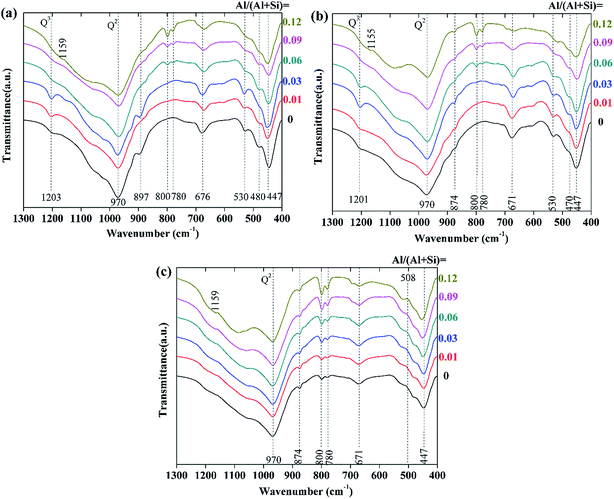 | ||
| Fig. 8 FTIR spectra of the synthesized products with different aluminum additions: (a) 180 °C, 7 h; (b) 180 °C, 5 h; (c) 160 °C, 7 h. | ||
For the products prepared at 180 °C (see in Fig. 8a and b), the intensity of the Si–O (Q3) stretching vibration at around 1200 cm−1 increased with increasing aluminum addition when Al/(Al + Si) ≤ 0.03, which indicates the increased polymerization degree of the (alumino)silicate chains. This is in agreement with the increased tobermorite crystallinity that was seen in the XRD analysis. When Al/(Al + Si) ≥ 0.06, the Si–O (Q3) stretching vibration was weak, and it faded with increasing aluminum addition. Besides this, the intensity of the Si–O (Q2) stretching vibration at round 970 cm−1 significantly decreased in the presence of higher aluminum addition, indicating that the polymerization degree of the (alumino)silicate chains decreased. The incorporation of aluminum had little effect on the deformation and bending vibration of the SiO4 tetrahedra, indicating that the fundamental Ca-silicate structure of tobermorite did not change when Al was substituted for Si. For the products prepared at 160 °C (see in Fig. 8c), the Si–O (Q3) stretching vibration disappeared, indicating a low polymerization degree of the (alumino)silicate chains. This also demonstrates the decreased tobermorite crystallinity and the very low content of tobermorite that was seen in the XRD and Rietveld refinement analyses.
3.4 Solid-state nuclear magnetic resonance
The 29Si and 27Al NMR spectra of the products prepared at 180 °C for 7 h with different aluminum additions are presented in Fig. 9. The results of the deconvolutions and the assignments of the 29Si NMR spectra are listed in Table 1.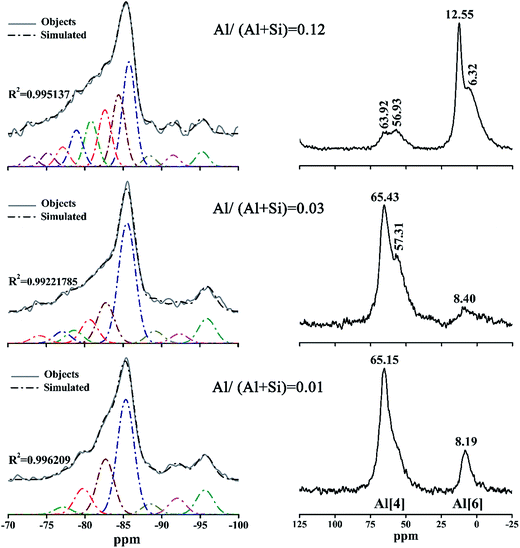 | ||
| Fig. 9 29Si NMR (left groups) and 27Al NMR (right groups) spectra of the products prepared at 180 °C for 7 h with different aluminum additions. | ||
| Al/(Al + Si) = 0.01, 180 °C, 7 h | Al/(Al + Si) = 0.03, 180 °C, 7 h | Al/(Al + Si) = 0.12, 180 °C, 7 h |
|---|---|---|
| MCL | MCL | MCL |
| 15.93 | 21.70 | 11.41 |
| CLQ | CLQ | CLQ |
| 0.27 | 0.25 | 0.13 |
| ppm | Unit | Area (%) | ppm | Unit | Area (%) | ppm | Unit | Area (%) |
|---|---|---|---|---|---|---|---|---|
| −77.15 | Q1 | 2.90 | −74.09 | Q0 | 2.93 | −72.98 | Q0 | 2.66 |
| −79.75 | Q1 | 10.17 | −77.07 | Q1 | 4.43 | −75.19 | Q1 | 3.45 |
| −82.68 | Q2(1Al) | 21.70 | −78.62 | Q1 | 4.94 | −77.12 | Q1 | 4.91 |
| −85.31 | Q2 | 45.16 | −80.61 | Q2(1Al) | 8.97 | −78.91 | Q1 | 9.18 |
| −88.51 | Q3(1Al) | 4.13 | −82.74 | Q2(1Al) | 15.42 | −80.81 | Q2(1Al) | 11.61 |
| −92.01 | Q3 | 6.34 | −85.51 | Q2 | 45.72 | −82.62 | Q2(1Al) | 14.27 |
| −95.59 | Q3 | 9.60 | −89.13 | Q3(1Al) | 4.62 | −84.40 | Q2 | 18.10 |
| −92.34 | Q3 | 3.58 | −85.76 | Q2 | 26.38 | |||
| −95.91 | Q3 | 9.36 | −88.42 | Q3(1Al) | 2.77 | |||
| −91.50 | Q3 | 2.91 | ||||||
| −95.28 | Q3 | 3.76 |
The resonances at −74.09 ppm and −72.98 ppm in the 29Si NMR spectra of the products with Al/(Al + Si) = 0.03 and 0.12 were attributed to isolated tetrahedra (Q0) in accord with previous studies.37 The signals that were centered at displacement values between −75.19 ppm and −79.75 ppm were attributed to Q1 silicon sites in C–S–H in accord with previous studies.4,37,46 It can be seen from Table 1 that the relative peak area of Q1 in the product with Al/(Al + Si) = 0.03 was at a minimum, indicating an increased polymerization of the (alumino)silicate chains.14
The well-resolved signals at around −85 ppm were due to the existence of Q2 silicon sites, which is in agreement with the 29Si NMR data varying from −85.7 to −83.8 ppm that was reported in previous studies.1,4,46,47 The relative intensity of the Q2 sites in the product with Al/(Al + Si) = 0.12 was significantly low, implying that the (alumino)silicate chains became progressively less polymerized. Some authors have reported that resonances at displacement values from −96.1 to −91.5 ppm1,4,46,47 were assigned to Q3 silicon sites, which can explain the peaks at −95.59/–92.01 ppm, at −95.91/92.34 ppm and at −95.28/–91.50 ppm for Al/(Al + Si) = 0.01, 0.03 and 0.12 in this study, respectively. It should be noted that Q3 silicon sites were barely detected in the infrared spectra, suggesting that NMR spectroscopy was much more sensitive than infrared spectroscopy for identifying the configuration of the (alumino)silicate chains.
After incorporation with aluminum, the resonances slightly deviated to higher frequencies for the Q2(1Al) and Q3(1Al) sites relative to the Q2 and Q3 sites, respectively.4 By comparison, Coleman identified that the Q2 and Q2(1Al) sites centered at −86.5 and −83.5 ppm, and the Q3 and Q3(1Al) sites corresponded with signals at −98.4 and −93.5 ppm, respectively.38 Meanwhile, Gabrovŝek et al.48 assigned the signals at −86 and −82.5 ppm to the Q2 and Q2(1Al) sites, and those at −96 and −92 ppm to the Q3 and Q3(1Al) sites. Thus, the resonances at −88.51 ppm, −89.13 ppm and −88.42 ppm in this study were assigned to the Q3(1Al) sites. The resonances at −82.68 ppm, −82.74/−80.61 ppm and −82.62/−80.81 ppm, attributed to the Q2(1Al) sites, unsmoothed the curves to form swelling shoulders shifting left compared with the Q2 sites, in full agreement with the investigation by Gabrovŝek et al.48
Quantitative characterization of the polymerization degree of the (alumino)silicate chains is based on the MCL value: a larger MCL value indicates that the chains have a greater polymerization degree. The tobermorite-like structures contain 3-repeat tetrahedral chains (drierkette) in which the bridging tetrahedra expose their two non-bridging oxygen atoms to the interlayer.7,14 These non-bridging oxygen atoms play a range of structural roles including cross-linking across the interlayer. A larger CLQ value shows that the (alumino)silicate chains have a greater cross-linking ability.
It is shown in Table 1 that the MCL values of the products prepared at 180 °C for 7 h with different aluminum additions were 11.41–21.70, and these are nearly consistent with the values of 7.4–17.5 from previous studies on tobermorite obtained via hydrothermal synthesis.38 The MCL value of 21.7 was at its maximum at Al/(Al + Si) = 0.03, indicating the formation of highly polymerized silicate chains. However, the MCL value at Al/(Al + Si) = 0.12 was just half that at 0.03, implying that the polymerization of the SiO4 tetrahedra was hindered by higher aluminum addition. By comparing the CLQ values of 0.27, 0.25 and 0.13 for Al/(Al + Si) = 0.01, 0.03, and 0.12 to the maximum theoretical CLQ value of 0.33, it can be seen that approximately 81.8%, 75.7% and 39.4% of all of the bridging tetrahedra were condensed across the interlayer. Thus, the cross-linking degree of the (alumino)silicate tetrahedral chains was remarkably reduced in the presence of higher aluminum addition. Furthermore, a comparison of the Q3 and Q3(1Al) signal integral intensities, represented by the ratio of Q3(1Al)/(Q3 + Q3(1Al)), showed that around 20.58–29.34% of the interlayer cross-linking was in the ![[triple bond, length as m-dash]](https://www.rsc.org/images/entities/char_e002.gif) Si–O–Al
Si–O–Al![[triple bond, length as m-dash]](https://www.rsc.org/images/entities/char_e002.gif) configuration, and the residual was in the
configuration, and the residual was in the ![[triple bond, length as m-dash]](https://www.rsc.org/images/entities/char_e002.gif) Si–O–Si
Si–O–Si![[triple bond, length as m-dash]](https://www.rsc.org/images/entities/char_e002.gif) configuration. Thus, the type of cross-linking was almost independent of aluminum addition.
configuration. Thus, the type of cross-linking was almost independent of aluminum addition.
All of the samples investigated via27Al NMR showed two different resonances, suggesting the presence of aluminum in two distinct local environments. The resonances shifting around 60 ppm were due to the Al[4],1,4,38 indicating an isomorphous replacement of silicon by aluminum in the (alumino)silicate tetrahedral chains.48 For Al/(Al + Si) = 0.03 and 0.12, the split of the resonances from Al[4] was associated with the substitution of Al for Si in two different environments: the bigger chemical shift corresponds to the substitution in the Q2 sites and the smaller one to the substitution in the Q3 sites.49 Therefore, Al substituted for Si just in the Q2 sites at Al/(Al + Si) = 0.01, but much substitution of Al for Si occurred in the Q3 sites at Al/(Al + Si) = 0.03, confirming that aluminum took up a bridging position to increase the silicate chain length. The resonances shifting from 5.19 to 12.55 ppm were attributed to Al[6], which is based on previous studies in which the resonance of Al[6] that was at 10–12 ppm when reported by Gabrovŝek et al.48 also occurred at 0–10 ppm when researched by Coleman and Komarneni et al.4,38
It is clear that the intensity and amplitude of the resonances due to Al[4] became weaker and broader with an increasing Al/(Al + Si) ratio, suggesting a decreasing content and disordered structure. Conversely, the intensity of Al[6] increased with a rising Al/(Al + Si) ratio. According to the MCL and CLQ results, it was impossible for the intensive resonances attributed to Al[6] to be caused by the incorporation of aluminum in the silicate chain sites with lower polymerization. In other words, only Al[4] occurred in the cross-linked silicate chains, which is in agreement with the results of Andersen et al.21 and Sun et al.,14 while Al[6] just exited in another Al-bearing phase—hydrogarnet.11
3.5 SEM analysis
Fig. 10 displays the changes in morphology of the products prepared at 180 °C for 7 h with an Al/(Al + Si) ratio of 0–0.12. Plate-like tobermorite with a size of approximately 1–2 μm (see in Fig. 10a), as observed in previous studies,11,44,49 intertwined with each other to form a porous structure without aluminum incorporation. The plates began to fracture into regular patches described as lath-like that were around 1 μm long and 300 nm wide (see in Fig. 10b and c) to form a dense microstructure at Al/(Al + Si) = 0.01 and 0.03. This difference was also mentioned in a previous investigation,3 and may prove the variations in tobermorite crystallinity that correlate to the XRD analysis. As the aluminum addition increased, the morphology of tobermorite transformed into needle-like deposits with lengths of around 1–2 μm that were covered on the surface of the laths (see in Fig. 10d). When the Al/(Al + Si) ratio increased to 0.09 and 0.12, the needle-like deposits were dominant (see in Fig. 10e and f).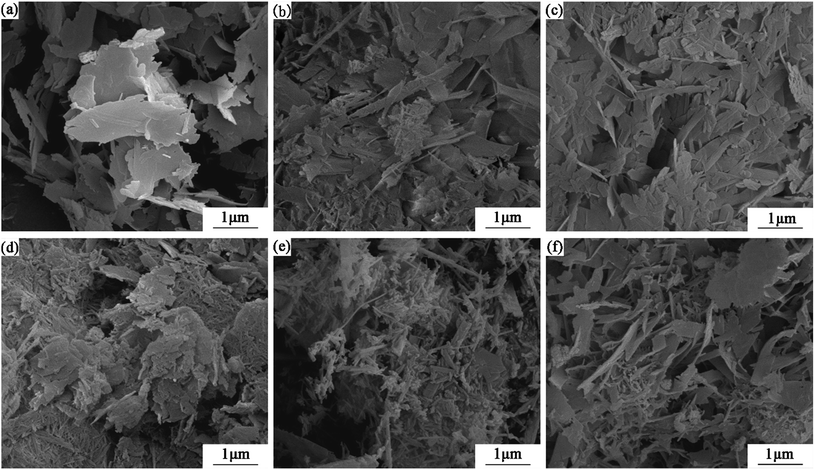 | ||
| Fig. 10 SEM images of the products prepared at 180 °C for 7 h with different aluminum additions, denoted as Al/(Al + Si) = 0 (a), 0.01 (b), 0.03 (c), 0.06 (d), 0.09 (e), and 0.12 (f). | ||
The changes in the tobermorite morphology indicate that aluminum had a strong influence on the crystal habit of C–S–H. According to Bell et al., the growth of plate tobermorite corresponds to the silicate chain structure, indicating the preference for growth by extending the existing layers of silicate tetrahedra and calcium ions.50 The increased length of the (alumino)silicate tetrahedral chains by aluminum incorporation resulted in relatively preferential growth along the b-axis, which caused the observed lath-like and needle-like morphology. Tan et al. observed that the lath-like crystalline C–S–H were thinner and longer as aluminum addition increased, until they finally changed into needles.51 Maeda et al. also found that tobermorite showed fiber-like and plate-like morphologies in the aluminum-incorporated CaO–SiO2–H2O system.52
4. Conclusions
The phase assembly and microstructure of the aluminum-incorporated CaO–SiO2–H2O system were explored using XRD, SEM, FTIR and NMR. It can be concluded that: (1) the XRD results indicate that the formation of C–S–H and the crystallization of the tobermorite phase were promoted at Al/(Al + Si) ≤ 0.03, and subsequently, the tobermorite crystallinity decreased with increasing aluminum addition. Excess aluminum appeared in the hydrogarnet phase. The tobermorite crystallinity was much lower at low reaction temperatures. The Rietveld refinement results show that the phase purity decreased with increasing aluminum addition; (2) the FTIR and NMR results demonstrate that with suitable aluminum incorporation, the polymerization degree of the (alumino)silicate chains was increased, and the chains had a longer mean length. In addition, the type of cross-linking in the tobermorite structure was almost independent of aluminum addition. Only Al[4] substituted for silicon in the aluminum incorporated C–S–H, while Al[6] just exited in the hydrogarnet phase; (3) aluminum incorporation had a strong influence on the morphology of tobermorite, which changed from plate-like to lath-like and then needle-like with increasing aluminum addition. These findings will be helpful for understanding more clearly the effects of aluminum on the CaO–SiO2–H2O system under hydrothermal conditions.Conflicts of interest
There are no conflicts to declare.Acknowledgements
This work is financially supported by the key platform and major scientific research project of Guangdong (No. 2016KQNCX151), the innovative research team project of Guangdong (No. 2014KZDXM067 & (2015)93-4) and the key teaching reform project of Shaoguan University (No. SYJY20141509).References
- C. A. Ríos, C. D. Williams and M. A. Fullen, Appl. Clay Sci., 2009, 43, 228–237 CrossRef.
- A. Hartmann, J.-C. Buhl and K. van Breugel, Cem. Concr. Res., 2007, 37, 21–31 CrossRef CAS.
- N. Y. Mostafa, A. A. Shaltout, H. Omar and S. A. Abo-El-Enein, J. Alloys Compd., 2009, 467, 332–337 CrossRef CAS.
- S. Komarneni, R. Roy, D. M. Roy, C. A. Fyfe, G. J. Kennedy, A. A. Bothner-By, J. Dadok and A. S. Chesnick, J. Mater. Sci., 1985, 20, 4209–4214 CrossRef CAS.
- O. P. Shrivastava and R. Shrivastava, Cem. Concr. Res., 2001, 31, 1251–1255 CrossRef CAS.
- S. Komarneni, J. S. Komarneni, B. Newalkar and S. Stout, Mater. Res. Bull., 2002, 37, 1025–1032 CrossRef CAS.
- S. Shaw, S. M. Clark and C. M. B. Henderson, Chem. Geol., 2000, 167, 129–140 CrossRef CAS.
- S. A. S. E-Hemaly, T. Mitsudab and H. F. W. Taylora, Cem. Concr. Res., 1977, 7, 429–438 CrossRef.
- H. Sato and M. W. Grutzeck, Proc. Mater. Res. Soc. Symp., Boston, M. A., 1991, pp. 235–240 Search PubMed.
- P. Faucon, A. Delagrave, J. C. Petit, C. Richet, J. M. Marchand and H. Zanni, J. Phys. Chem. B, 1999, 103, 7796–7802 CrossRef CAS.
- D. S. Klimesch and A. Ray, Cem. Concr. Res., 1998, 28, 1109–1117 CrossRef CAS.
- N. J. Coleman, Mater. Res. Bull., 2005, 40, 2000–2013 CrossRef CAS.
- N. J. Coleman and D. S. Brassington, Mater. Res. Bull., 2003, 38, 485–497 CrossRef CAS.
- G. K. Sun, J. F. Young and R. J. Kirkpatrick, Cem. Concr. Res., 2006, 36, 18–29 CrossRef CAS.
- M. Tsuji, S. Komarneni and P. Malla, J. Am. Ceram. Soc., 1991, 74, 274–279 CrossRef CAS.
- W. NocuÒ-Wczelik, Cem. Concr. Res., 1999, 29, 1759–1767 CrossRef.
- D. S. Klimesch and A. Ray, Cem. Concr. Res., 1998, 28, 1309–1316 CrossRef CAS.
- G. L. Kalousek, J. Am. Ceram. Soc., 1957, 40, 74–80 CrossRef CAS.
- L. Black, A. Stumm, K. Garbev, P. Stemmermann, K. R. Hallam and G. C. Allen, Cem. Concr. Res., 2005, 35, 51–55 CrossRef CAS.
- H. Stade and D. Müller, Cem. Concr. Res., 1987, 17, 553–561 CrossRef CAS.
- M. D. Andersen, H. J. Jakobsen and J. Skibsted, Inorg. Chem., 2003, 42, 2280–2287 CrossRef CAS PubMed.
- X. Pardal, I. Pochard and A. Nonat, Cem. Concr. Res., 2009, 39, 637–643 CrossRef CAS.
- S. Komarneni and D. M. Roy, J. Mater. Sci., 1985, 20, 2930–2936 CrossRef CAS.
- S. Komarneri, D. M. Roy and R. Roy, Cem. Concr. Res., 1982, 12, 773–780 CrossRef.
- D. S. Klimesch and A. Ray, J. Therm. Anal. Calorim., 1999, 56, 27–34 CrossRef CAS.
- D. S. Klimesch and A. Ray, Cem. Concr. Res., 1998, 28, 1317–1323 CrossRef CAS.
- D. S. Klimesch and A. Ray, Thermochim. Acta, 1998, 316, 149–154 CrossRef CAS.
- E. I. Al-Wakeel and S. A. El-Korashy, J. Mater. Sci., 1996, 31, 1909–1913 CrossRef CAS.
- M. A. Serry, A. S. Taha, S. A. S. El-Hemaly and H. El-Didamony, Thermochim. Acta, 1984, 79, 103–110 CrossRef CAS.
- R. Siauciunas and A. Baltusnikas, Cem. Concr. Res., 2003, 33, 1789–1793 CrossRef CAS.
- A. G. De La Torre, S. Bruque and M. A. G. Aranda, J. Appl. Crystallogr., 2001, 34, 196–202 CrossRef CAS.
- P. S. Whitfield and L. D. Mitchell, J. Mater. Sci., 2003, 38, 4415–4421 CrossRef CAS.
- J. F. Zhao, J. J. Zhao, J. H. Chena, X. H. Wang, Z. D. Han and Y. H. Li, Ceram. Int., 2014, 40, 3379–3388 CrossRef CAS.
- M. Ferrari and L. Lutterotti, J. Appl. Phys., 1994, 76, 7246–7255 CrossRef CAS.
- P. Sahu, M. De and M. Zdujić, Mater. Chem. Phys., 2003, 82, 864–876 CrossRef CAS.
- J. R. Martínez, S. P. Sánchez, G. O. Zarzosa, F. Ruiz and Y. Chumakov, Mater. Lett., 2006, 60, 3526–3529 CrossRef.
- G. Pérez, A. Guerrero, J. J. Gaitero and S. Goñi, J. Mater. Sci., 2014, 49, 142–152 CrossRef.
- N. J. Coleman, Sep. Purif. Technol., 2006, 48, 62–70 CrossRef CAS.
- A. G. De la Torre and M. A. G. Aranda, J. Appl. Crystallogr., 2003, 36, 1169–1176 CrossRef CAS.
- R. J. Myers, E. L’Hôpital, J. L. Provis and B. Lothenbach, Cem. Concr. Res., 2015, 68, 83–93 CrossRef CAS.
- N. Y. Mostafa, S. A. S. El-Hemaly, E. I. Al-Wakeel, S. A. El-Korashy and P. W. Brown, Cem. Concr. Res., 2001, 31, 905–911 CrossRef CAS.
- N. Y. Mostafa, Cem. Concr. Res., 2005, 35, 1349–1357 CrossRef CAS.
- S. Tränkle, D. Jahn, T. Neumann, L. Nicoleau, N. Hüsing and D. Volkmer, J. Mater. Chem. A, 2013, 35, 10318–10326 RSC.
- H. Maeda, E. H. Ishida and T. Kasuga, Mater. Lett., 2012, 68, 382–384 CrossRef CAS.
- S. P. Wang, X. Q. Peng, L. P. Tang, L. Zeng and C. Lan, Constr. Build. Mater., 2014, 60, 42–47 CrossRef.
- W. Wieker, A.-R. Grimmer and A. Winkler, Cem. Concr. Res., 1982, 12, 333–339 CrossRef CAS.
- T. Maeshima, H. Noma, M. Sakiyama and T. Mitsuda, Cem. Concr. Res., 2003, 33, 1515–1523 CrossRef CAS.
- R. Gabrovšek, B. Kurbus, D. Mueller and W. Wieker, Cem. Concr. Res., 1993, 23, 321–328 CrossRef.
- H. Youssef, D. Ibrahim, S. Komarneni and K. J. D. Mackenzie, Ceram. Int., 2010, 36, 203–209 CrossRef CAS.
- N. S. Bell, S. Venigalla, P. M. Gill and J. H. Adair, J. Am. Ceram. Soc., 1996, 79, 2175–2178 CrossRef CAS.
- W. Tan, G. R. Zhu, Y. Liu, Z. Z. Zhang and L. Y. Liu, Cem. Concr. Res., 2015, 72, 69–75 CrossRef CAS.
- H. Maeda, K. Abe and E. H. Ishida, J. Ceram. Soc. Jpn., 2011, 119, 375–377 CrossRef CAS.
Footnote |
| † Electronic supplementary information (ESI) available. See DOI: 10.1039/c8ra04423f |
| This journal is © The Royal Society of Chemistry 2018 |

