 Open Access Article
Spherical covalent organic frameworks as advanced adsorbents for preconcentration and separation of phenolic endocrine disruptors, followed by high performance liquid chromatography†
Jing-Min Liu a,
Jia-Li Haoc,
Xin-Yue Yuanb,
Hui-Lin Liub,
Guo-Zhen Fang
 c and
Shuo Wang*a
aTianjin Key Laboratory of Food Science and Health, School of Medicine, Nankai University, Tianjin, 300071, China. E-mail: elisasw2002@aliyun.com
bBeijing Advanced Innovation Center for Food Nutrition and Human Health, Beijing Technology & Business University (BTBU), Beijing, 100048, China
cKey Laboratory of Food Nutrition and Safety, Ministry of Education, Tianjin University of Science and Technology, Tianjin, 300457, China
First published on 27th July 2018
Abstract
As a promising generation of porous micro-materials, covalent organic frameworks (COFs) have great potentials for applications in separation and adsorption. In the present study, an advanced food-safety inspection method involving COFs as the adsorbents of solid phase extraction (SPE) is proposed for sensitive and accurate determination of target hazardous substances. Typical spherical TpBD COFs with large surface area and superior chemical stability were utilized as adsorbents for the preconcentration of phenolic endocrine disruptors (PEDs), followed by high performance liquid chromatography (HPLC) analysis. The well-prepared TpBD COFs were encapsulated in SPE cartridges and applied in food research, namely, for the separation and enrichment of four target endocrine disruptors in food samples. The possible factors influencing the SPE performance including the composition of the sample solvent, sample solution pH, sample flow rate, composition of the eluent, and the volume of the eluent were investigated and optimized. Due to the porous architecture and superior surface area of spherical TpBD, the enrichment of analytes via a COF-filled SPE column gave extremely low detection limits of 0.056–0.123 μg L−1 along with a wide linear range of 0.5–100 μg L−1 for all the analytes. Nine parallel determinations of the mixed standard with a concentration of 10 μg L−1 produced the relative standard deviations of 2.23–3.08%, indicating the excellent repeatability of the COF-SPE assay. This study can open up a new route for the employment of COFs as efficient SPE adsorbents for the enrichment and quantification of trace/ultra-trace hazardous materials in complex food samples.
1. Introduction
Phenolic endocrine disruptors (PEDs), namely, bisphenol A (BPA), bisphenol F (BPF), nonylphenol (NP) and octylphenol (OP) have attracted great attention as they may mimic endogenous hormone actions and thus interfere with the endocrine organ functions.1–3 Phenolic endocrine disruptors can cause serious threats to human health including reproductive dysfunction, birth defects, metabolic disorders, and certain malignancies.4,5 Due to good chemical stability and thermal stability as well as low cost, BPA and BPF are extensively utilized in the industry as important intermediates for the production of polycarbonate plastic and epoxy resins, whereas NP and OP are widely used in the production of plastic packages, elasticizers, abstergents and pesticide emulsifiers.6,7 It is worth noting that these phenolic endocrine disruptors widely exist in the environment around us, i.e., in the atmosphere, sediments, soil, environmental water, and food, which can consequently harm human health. Therefore, there is a great demand for rapid, simple, accurate, and sensitive analytical techniques for the monitoring of PEDs in different sample matrices.5,8–12 Owing to their trace levels in food and water sample matrices, direct qualification and quantification of PEDs are challenging; hence, an efficient and sensitive sample pre-treatment is urgently required to extract and enrich target PEDs as well as to remove the major interferences prior to instrumental analysis.As one of the most widely used sample pre-treatment techniques, solid phase extraction (SPE) is favourable for the determination of trace levels of analytes against complex sample matrices due to its rapid phase separation, simplicity, high enrichment factor, low cost, and the variety of efficient adsorbents. With the ability of handling large sample volumes, SPE can be easily coupled with diverse analytical instruments via on-line or off-line manner. Generally, the SPE performance largely depends on the employed adsorbent, which is the core and the foundation of preconcentration and enrichment of target analytes. Recently, various SPE adsorbents, usually with large surface areas and porous architectures, such as carbon nanotubes,13,14 graphene oxide,15,16 metal organic frameworks (MOFs),17 mesoporous silica,18 and TiO2 nanoparticles19 have been developed for specific applications.
As an interesting novel type of porous material, covalent organic frameworks (COFs) possess high-ordered crystalline porous architectures, offering significant potentials for diverse applications in photoelectric, gas storage, separation, and catalysis fields.20–24 Unlike MOFs, which have coordinated structures, COFs are solely fabricated with organic constructing units via strong covalent bonding; therefore, they possess superior chemical stability in acidic media and organic solvents, thus interacting with targets in a wide pH range.25–27 Moreover, due to uniform-sized nanopores and large surface area, COFs exhibit high capacity, fast adsorption, and good regenerability and accessibility.28–31 In virtue of the above-mentioned observations, we infer that COFs possess great potential as ideal adsorbents for the enrichment of organic compounds via SPE pre-treatment.32–36 Very recently, several remarkable studies have well demonstrated COFs as effective adsorbents for polar phenols37–39 and other organic pollutants.29,32
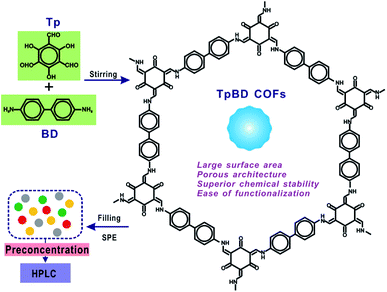
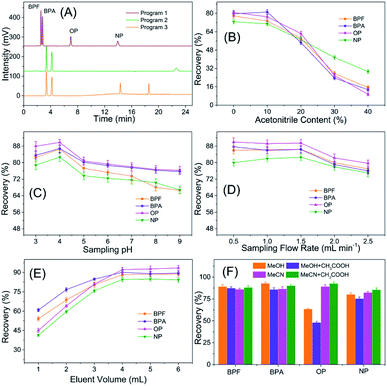
Herein, typical spherical TpBD COFs, with the advantageous features of large surface area, superior chemical stability, ease of preparation and good dispersity, were utilized as sorbents for the preconcentration of phenolic endocrine disruptors (PEDs), followed by high performance liquid chromatography (HPLC) analysis. The well-prepared TpBD COFs were encapsulated in SPE cartridges and applied in food research, namely, for the separation and enrichment of four target endocrine disruptors in food samples, followed by HPLC measurements. The possible factors influencing the SPE performance including the composition of the sample solvent, sample solution pH, sample flow rate, composition of the eluent, and the volume of the eluent were investigated and optimized. Owing to the porous architecture and superior surface area of spherical TpBD, the enrichment of the analytes via a COF-filled SPE column gave extremely low detection limits of 0.056–0.123 μg L−1 along with a wide linear range of 0.5–100 μg L−1 for all the analytes. Nine parallel determinations of the mixed standard with a concentration of 10 μg L−1 produced the relative standard deviations of 2.23–3.08%, indicating the excellent repeatability of the COF-SPE assay. The developed SPE-HPLC method was finally employed for PEDs in food samples.
2. Experimental section
2.1 Chemicals and materials
All reagents were at least analytical reagent-grade and were used as received. BPA, BPF, OP and NP were purchased from Sigma (Shanghai, China). HPLC-grade acetonitrile and HPLC-grade methanol were obtained from Sinopharm Chemical Reagent Co., Ltd. (Shanghai, China). 1,3,5-Triformylphloroglucinol (Tp) was purchased from Aladdin (Shanghai, China), and benzidine (BD) was purchased from J&K (Beijing, China). Ethanol and N,N-dimethylformamide (DMF) were obtained from Sinopharm Chemical Reagent Co., Ltd. (Shanghai, China). Formic acid and acetic acid were purchased from Aladdin (Shanghai, China). Ultrapure water (18.2 MΩ cm−1) was generated by the Sartorius Milli-Q system (Aubagne, France) and was used throughout the experiments. All the glassware was cleaned with diluted HNO3 (10%) and thoroughly rinsed with ultrapure water prior to use. Mixed standard stock solutions (1000 mg L−1) were prepared by dissolving appropriate amounts of four targets in acetonitrile and storing in dark at 4 °C. Working solutions were obtained daily by diluting the stock solutions with ultrapure water before experiments.2.2 Instrumentation
The microstructure and the morphology of the as-synthesized TpBD were characterized by scanning electron microscopy (SEM) using a LEO 1530VP microscope (LEO, Germany) operated at 10.0 kV and transmission electron microscopy (TEM) using a JEM-2100F field emission transmission electron (JEOL, Japan) microscope at an accelerating voltage of 200 kV. The surface area and the porosity of the as-prepared TpBD were measured by nitrogen adsorption–desorption analysis. XRD patterns were acquired on a D/max-2500 diffractometer (Rigaku, Japan) equipped with Cu Kα radiation (λ = 1.5418 Å). The contents of the targets were determined with high performance liquid chromatography (HPLC, Shimadzu LC-10, Japan). The standard curve was built according to the target concentrations and the response values.2.3 Synthesis of TpBD
Referring to a previously reported method,32 15 mL of ethanol containing 0.30 mmol of Tp and 5 mL of ethanol containing 0.45 mmol of BD were mixed in a 100 mL flask; the solution was continuously stirred for 15 min at room temperature to obtain a homogenous yellow solution. After evacuation and filling with N2, the reaction system was heated to 80 °C to reflux under N2 protection, during which the mixed solution demonstrated a clear colour change from yellow to light brown. Then, the reaction mixture was refluxed for another 3 h under vigorous stirring, and the resultant solution was collected by centrifugation (10![[thin space (1/6-em)]](https://www.rsc.org/images/entities/char_2009.gif) 000 rpm, 5 min). Excess Tp and BD contents were removed by refluxing the obtained solution with DMF for 50 min, followed by refluxing with ethanol for 50 min to exchange DMF. The resulting products were collected by centrifugation and evacuated under vacuum at 30 °C overnight to eliminate ethanol. The dried TpBD COFs were finally collected in an agate mortar and ground into a powder to ensure well-dispersion prior to use.
000 rpm, 5 min). Excess Tp and BD contents were removed by refluxing the obtained solution with DMF for 50 min, followed by refluxing with ethanol for 50 min to exchange DMF. The resulting products were collected by centrifugation and evacuated under vacuum at 30 °C overnight to eliminate ethanol. The dried TpBD COFs were finally collected in an agate mortar and ground into a powder to ensure well-dispersion prior to use.
2.4 SPE procedure
We used 3 mL empty SPE cartridges with 2 frits (8 mm in diameter, 2 μm of pore size) per column as the SPE column; 30 mg of the as-synthesized TpBD powder was weighed accurately and added into the SPE column. To avoid collapse, the 2 frits were put on the two sides of the filler.SPE assay was performed on an SPE vacuum manifold. Three group parallel tests were set for each condition. First, the SPE column was conditioned with 5 mL of acetonitrile (10% acetic acid) and 5 mL of water. Then, 10 mL of the working solution was added into the column separately while controlling the flow via a vacuum pump to ensure that the liquid flows slowly through the adsorbent. After loading the sample, the entrapped targets were eluted with 4 mL of acetonitrile containing 10% acetic acid. The pooled eluate was evaporated under a gentle stream of nitrogen and reconstituted in 1 mL of acetonitrile. The solution was filtered through 0.22 μm nylon membranes before HPLC analysis.
2.5 HPLC conditions
HPLC analysis was performed using Shimadzu LC-10 equipped with a UV-detector. The detection wavelength was 228 nm. Chromatography was performed on an Agilent XDB-C18 (4.6 mm × 250 mm, 5 μm) column at 35 °C with an injection volume of 20 μL. The mobile phase consisting of a solvent A (acetonitrile) and solvent B (water) was delivered at a flow rate of 1 mL min−1.The program was run in a linear gradient:
0–3 min, the proportion of A in the mobile phase was 60%;
3–15 min, the proportion of A in the mobile phase increased to 100%, held for 15–17 min;
17–20 min, the proportion of A in the mobile phase decreased to 60%, held for 20–30 min.
2.6 Sample pretreatment
The samples were purchased from a local super-market and stored at 4 °C before use.For the beverage samples, certain amounts of standard stock solutions containing the four targets were separately added into the sample solutions to obtain fortified concentrations of the targets as 0, 5, 10, 20 μg L−1. The samples were filtered using 0.22 μm pore-size membrane filters before undergoing further analysis. Prior to the TpBD-SPE procedure, the sample solution pH was adjusted to 4.0 by using 0.1 M formic acid and 0.1 M ammonium hydroxide. The carbonate beverage sample was degassed by ultrasonication for 1 min in advance.
For the milk sample, the mixtures were spiked using the same procedure as above and were extracted by ultrasonication for 20 min and centrifugation for 5 min at 9500 rpm. The supernatant was collected and transferred to a flask. The rest was extracted using 20 mL of acetonitrile again. A rotavapor was used to evaporate the extracted solution to a volume less than 10 mL, which was then evaporated under a gentle stream of nitrogen. Next, it was reconstituted in 1 mL of acetonitrile and diluted to a fixed volume of 50 mL. The sample solution pH was also adjusted to 4.0 prior to the SPE-HPLC assay (Fig. 1).
3. Results and discussion
3.1 Synthesis and characterization of TpBD COFs
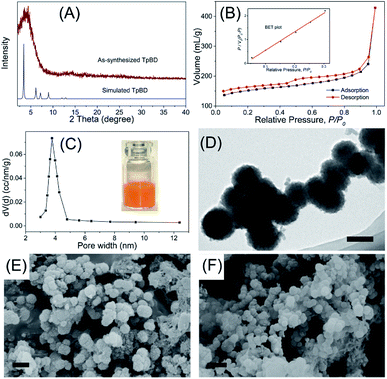
As a new generation of porous micro-materials with large surface area and π–π stacked architecture, TpBD COFs hold great potential for adsorption and separation applications. The key features that qualify TpBD as an outstanding adsorbent are superior chemical stability and unique porous architectures. The XRD pattern (Fig. 2A) revealed the typical crystallinity with a 2θ peak around the low angle of 3°, which was consistent with the simulated pattern, proving the successful preparation of TpBD. SEM and TEM analyses showed spherical morphology of TpBD with an average particle size of 205 ± 7 nm. Nitrogen adsorption–desorption experiments were performed to evaluate the adsorption properties of TpBD. The Brunauer–Emmett–Teller (BET) surface area for the as-prepared TpBD was measured to be 474.48 m2 g−1 with a pore size of 3.8 nm. The large specific surface area demonstrated that the as-prepared TpBD has great potential as an adsorbent for food-borne hazardous substances. SEM results also showed slight changes in the micro-structure of TpBD before and after the SPE-HPLC assay for the preconcentration of target analytes (Fig. 2). Furthermore, slight changes in the surface area and the particle size were observed after 10 cycles of adsorption/elution, indicating good chemical stability of TpBD as an effective adsorbent (Fig. 3).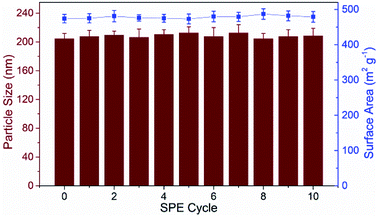 | ||
| Fig. 3 Continuous monitoring of the surface area and the particle size change of TpBD during the 10 cycles of adsorption/elution. | ||
3.2 Optimization of TpBD-involved SPE-HPLC assay
3.3 Adsorption mechanism study
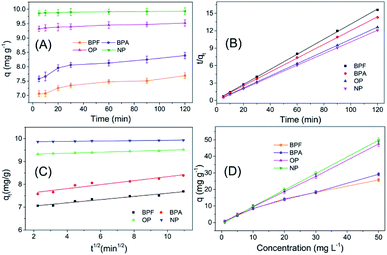
The adsorption behaviour of TpBD with the four target analytes was systemically studied to probe the possible mechanism of adsorption. The adsorption kinetic curves exhibited a relatively rapid adsorption process, and all the adsorptions reached equilibrium within 30 min, along with a satisfactory adsorption capacity, which was suitable for SPE application (Fig. 5A).For the purpose of probing the possible mechanism of adsorption behaviours in this assay, pseudo-second-order and intra-particle diffusion models have been introduced to interpret the experimental data. The rate constants for the two models have been determined, and the correlation coefficients have been calculated to assess the model providing the best fit of the predicted data with the experimental results. It is found that the pseudo-second-order equation provides a better R2 value for the linear fitting and a good agreement between the calculated qc values and the experimental qe values, whereas the intra-particle diffusion equations do not give a good fit to the experimental data for the adsorption (Fig. 5B and C, Table 1).
| Target analytes | BPF | BPA | OP | NP | |
|---|---|---|---|---|---|
| Pseudo-second-order kinetics | K1 (min−1) | 0.120 | 0.089 | 0.385 | 1.326 |
| qe (mg g−1) | 7.691 | 8.423 | 9.520 | 9.935 | |
| qc (mg g−1) | 7.584 | 8.346 | 9.433 | 9.784 | |
| R2 | 0.9996 | 0.9996 | 0.9999 | 1.0000 | |
| Intra-particle diffusion | K2 (mg g−1 min−1/2) | 0.070 | 0.087 | 0.022 | 0.008 |
| C | 6.910 | 7.462 | 9.277 | 9.846 | |
| R2 | 0.951 | 0.908 | 0.987 | 0.959 | |
In the following adsorption equilibrium experiment, the adsorption capacities of the four targets continually increased as the concentration increased in the range of 1–50 mg L−1, demonstrating that TpBD COFs possessed robust adsorption capability for the targets. The adsorption process was interpreted with both Freundlich and Langmuir isotherm models, and the comparison results showed that the calculated data were better fitted with the Freundlich model than with the Langmuir model, revealing that the adsorption was a multiple process rather than a monolayer adsorption process. The Freundlich constant (n) values of the four target PBDs were all >1, which indicated the favorable adsorption of the analytes by TpBD.
The adsorption capability has been compared with that of a commercial SPE column (Cleanert PEP, Bonna-Agela Technologies, Tianjin, China) filled with polyethylene vinyl benzene microspheres (40–60 μm) and the other two types of COFs TpPa-1 and TpPa-2. The results in Fig. S1† indicate that the SPE performance of TpBD to the four targets was better than that of the commercial PEP column and comparable with those of TpPa-1 and TpPa-2 in terms of the adsorption capacity.
3.4 Analytical performance of the COF-SPE-HPLC assay
Using the optimized experimental conditions, calibration curves of the analytes were obtained at concentrations between 0.5 and 100 μg L−1. The equations of linear regression, correlation coefficients (R2) and detection limits were obtained from the calibration curves. The relative standard deviation (RSD) values were obtained using nine determinations and seven determinations of 10 μg L−1 target solutions for intra-day and inter-day precision, respectively. As can be seen from Table 2, the R2 values of all the analytes were greater than 0.99, and those of BPA and BPF were even higher than 0.999. RSDs of the analytes ranged from 2.23 to 3.08%. The results showed that the method has good stability and precision, which indicated that the enrichment column with TpBD-SPE was suitable for the determination of BPA, BPF, OP, and NP. The detection limits of BPA, BPF, OP, and NP were 0.056, 0.063, 0.103, and 0.123 μg L−1, respectively, which were far less than the prescriptive quantity or the transfer quantity values, demonstrating that the proposed method can satisfy the examination requirement of trace PEDs in food.| PEDs | Linear range (μg L−1) | R2 | LOD (μg L−1) | LOQ (μg L−1) | RSD (%) | |
|---|---|---|---|---|---|---|
| intra n = 9 | inter n = 7 | |||||
| BPF | 0.25–100 | 0.9993 | 0.056 | 0.185 | 2.33 | 4.35 |
| BPA | 0.25–100 | 0.9993 | 0.063 | 0.208 | 2.82 | 4.86 |
| OP | 0.5–100 | 0.9909 | 0.103 | 0.340 | 3.08 | 3.97 |
| NP | 0.5–100 | 0.9954 | 0.122 | 0.403 | 2.23 | 4.62 |
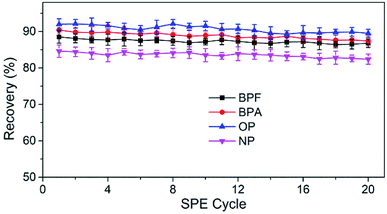
The reusability and stability of TpBD were tested by spacing and non-spacing adsorption and elution cycles, and the column efficiency was evaluated by observing the changes in the capacities of the analytes. Although there was a declining trend for the recovery of analytes with the increase in extraction times, the change was slight, and the recoveries of the analytes were all above 80% after 20 adsorption–elution cycles, proving the stability of TpBD COFs in the SPE cycle tests and good reusability of the developed TpBD-packed SPE columns for HPLC methods (Fig. 6).
3.5 Real sample analysis
To validate the suitability of the presented COF-SPE-HPLC assay, it was applied to analyze the targets in beverage and milk samples. Low concentrations of BPA and BPF were found in all samples, and trace levels of NP were detected in the milk sample. Fifty mL of three samples spiked with 5, 10 and 20 μg L−1 of each analyte was extracted by the TpBD-SPE assay. The recoveries of the spiked samples (Table 3) were obtained in the range of 85.0–94.1% for carbonate beverage samples, 83.4–93.4% for regular beverage samples and 82.0–96.3% for milk samples. The precision (RSD) was in the range of 0.5–6.6%. Fig. 7 shows the chromatograms of the three samples spiked with 5 μg L−1 mixed standards. All of these results confirmed the applicability of the proposed TpBD-SPE-HPLC method for food sample analysis.| Targets | Spiked (μg L−1) | Detection value (mean ± SD) (μg L−1) | Recovery (%) | |
|---|---|---|---|---|
| Carbonate beverage | BPF | 0 | 1.35 ± 0.07 | — |
| 5 | 5.86 ± 0.24 | 90.2 | ||
| 10 | 10.17 ± 0.11 | 88.2 | ||
| 20 | 19.62 ± 0.10 | 91.4 | ||
| BPA | 0 | 1.89 ± 0.06 | — | |
| 5 | 6.33 ± 0.07 | 88.8 | ||
| 10 | 11.17 ± 0.14 | 92.8 | ||
| 20 | 19.91 ± 0.11 | 90.1 | ||
| OP | 0 | — | — | |
| 5 | 4.63 ± 0.13 | 92.6 | ||
| 10 | 9.41 ± 0.16 | 94.1 | ||
| 20 | 18.08 ± 0.12 | 90.4 | ||
| NP | 0 | — | — | |
| 5 | 4.25 ± 0.08 | 85.0 | ||
| 10 | 8.74 ± 0.24 | 87.4 | ||
| 20 | 17.98 ± 0.15 | 89.9 | ||
| Beverage | BPF | 0 | 1.21 ± 0.08 | — |
| 5 | 5.46 ± 0.10 | 85.0 | ||
| 10 | 9.92 ± 0.07 | 87.1 | ||
| 20 | 19.19 ± 0.19 | 89.9 | ||
| BPA | 0 | 2.15 ± 0.07 | — | |
| 5 | 6.61 ± 0.04 | 89.2 | ||
| 10 | 11.27 ± 0.18 | 91.2 | ||
| 20 | 20.83 ± 0.20 | 93.4 | ||
| OP | 0 | — | — | |
| 5 | 4.62 ± 0.09 | 92.4 | ||
| 10 | 9.04 ± 0.13 | 90.4 | ||
| 20 | 17.98 ± 0.18 | 89.9 | ||
| NP | 0 | — | — | |
| 5 | 4.17 ± 0.12 | 83.4 | ||
| 10 | 8.61 ± 0.10 | 86.1 | ||
| 20 | 17.44 ± 0.05 | 87.2 | ||
| Milk | BPF | 0 | 2.09 ± 0.04 | — |
| 5 | 6.60 ± 0.13 | 90.2 | ||
| 10 | 11.45 ± 0.09 | 93.6 | ||
| 20 | 20.45 ± 0.11 | 91.8 | ||
| BPA | 0 | 2.36 ± 0.07 | — | |
| 5 | 6.94 ± 0.05 | 91.6 | ||
| 10 | 11.59 ± 0.12 | 92.3 | ||
| 20 | 20.04 ± 0.16 | 88.4 | ||
| OP | 0 | — | — | |
| 5 | 4.58 ± 0.10 | 91.6 | ||
| 10 | 9.63 ± 0.13 | 96.3 | ||
| 20 | 18.96 ± 0.09 | 94.8 | ||
| NP | 0 | 1.45 ± 0.02 | — | |
| 5 | 5.55 ± 0.06 | 82.0 | ||
| 10 | 9.81 ± 0.10 | 83.6 | ||
| 20 | 18.73 ± 0.09 | 86.4 | ||
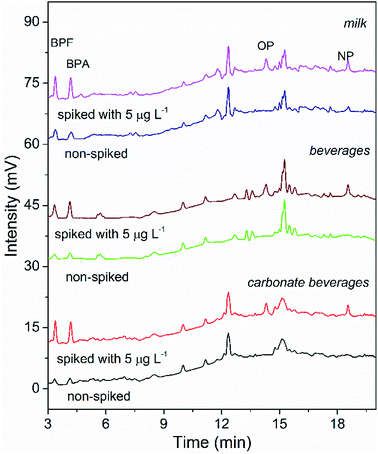 | ||
| Fig. 7 HPLC chromatograms of the real sample analysis using the developed COF-SPE method (non-spiked and spiked with 5 μg L−1 target analytes). | ||
4. Conclusions
In the present study, a novel spherical TpBD COF was successfully prepared and employed as the adsorbent and preconcentration material for SPE, followed by HPLC for the separation and quantification of PEDs. The superior chemical stability and excellent dispersity of TpBD guaranteed more than 20 adsorption–elution cycles with acceptable recoveries. The proposed method was proven to be rapid, reliable and highly sensitive. This study can open up a new route for the introduction of COFs as efficient SPE adsorbents for the preconcentration and determination of trace/ultra-trace hazardous substances in complex food samples.Conflicts of interest
There are no conflicts to declare.Acknowledgements
This work was supported by National Key R&D Program of China (No. 2018YFD0400703), the Fundamental Research Funds for the Central Universities, the Science and Technology Program of Tianjin, China (project No. 17ZYPTJC00050), and China Postdoctoral Science Foundation (No. 2017M621059).Notes and references
- M. Wu, X. Guo, F. Zhao and B. Zeng, Sci. Rep., 2017, 7, 8912 CrossRef PubMed.
- S. Ehrlich, P. L. Williams, S. A. Missmer, J. A. Flaws, K. F. Berry, A. M. Calafat, X. Ye, J. C. Petrozza, D. Wright and R. Hauser, Environ. Health Perspect., 2012, 120, 978–983 CrossRef PubMed.
- L. Yang, Z. Li, L. Zou and H. Gao, Chemosphere, 2011, 83, 233–239 CrossRef PubMed.
- M. K. R. Mudiam, R. Jain and R. Singh, Anal. Methods, 2014, 6, 1802–1810 RSC.
- L. Liu, T. Xia, X. Zhang, D. B. Barr, A. Alamdar, J. Zhang, M. Tian, Q. Huang and H. Shen, Anal. Bioanal. Chem., 2014, 406, 5049–5054 CrossRef PubMed.
- Y.-n. Dai, A. Dan, Y. Yang, N. F.-y. Tam, Y.-P. Tai and X.-Y. Tang, Environ. Sci. Technol., 2016, 50, 11844–11852 CrossRef PubMed.
- Z. Li, H. Zhang, M. Gibson and J. Li, Toxicol. In Vitro, 2012, 26, 769–774 CrossRef PubMed.
- R. Penu, A. C. Obreja, D. Patroi, M. Diaconu and G. L. Radu, Microchem. J., 2015, 121, 130–135 CrossRef.
- H. Gallart-Ayala, E. Moyano and M. T. Galceran, Mass Spectrom. Rev., 2010, 29, 776–805 CrossRef PubMed.
- L. Aguei, V. Serafin, P. Yanez-Sedeno and J. M. Pingarron, Anal. Methods, 2010, 2, 499–506 RSC.
- Y. C. Fiamegos and C. D. Stalikas, Anal. Chim. Acta, 2007, 597, 32–40 CrossRef PubMed.
- R. B. Pellegrino Vidal, G. A. Ibanez and G. M. Escandar, RSC Adv., 2015, 5, 20914–20923 RSC.
- H. Peng, N. Zhang, M. He, B. Chen and B. Hu, Talanta, 2015, 131, 266–272 CrossRef PubMed.
- P. Liang, Y. Liu, L. Guo, J. Zeng and H. Lu, J. Anal. At. Spectrom., 2004, 19, 1489–1492 RSC.
- K. Pytlakowska, V. Kozik, M. Matussek, M. Pilch, B. Hachula and K. Kocot, RSC Adv., 2016, 6, 42836–42844 RSC.
- A. Islam and S. Kumar, RSC Adv., 2016, 6, 77629–77635 RSC.
- Z.-Y. Gu, C.-X. Yang, N. Chang and X.-P. Yan, Acc. Chem. Res., 2012, 45, 734–745 CrossRef PubMed.
- P. Li, X.-q. Zhang, Y.-j. Chen, T.-y. Bai, H.-z. Lian and X. Hu, RSC Adv., 2014, 4, 49421–49428 RSC.
- Y. Zhang, C. Zhong, Q. Zhang, B. Chen, M. He and B. Hu, RSC Adv., 2015, 5, 5996–6005 RSC.
- N. Huang, X. Chen, R. Krishna and D. Jiang, Angew. Chem., Int. Ed., 2015, 54, 2986–2990 CrossRef PubMed.
- W. Li, C.-X. Yang and X.-P. Yan, Chem. Commun., 2017, 53, 11469–11471 RSC.
- H.-L. Qian, C.-X. Yang and X.-P. Yan, Nat. Commun., 2016, 7, 12104 CrossRef PubMed.
- C. Mongin, S. Garakyaraghi, N. Razgoniaeva, M. Zamkov and F. N. Castellano, Science, 2016, 351, 369–372 CrossRef PubMed.
- Y. Zeng, R. Zou, Z. Luo, H. Zhang, X. Yao, X. Ma, R. Zou and Y. Zhao, J. Am. Chem. Soc., 2015, 137, 1020–1023 CrossRef PubMed.
- S. He, T. Zeng, S. Wang, H. Niu and Y. Cai, ACS Appl. Mater. Interfaces, 2017, 9, 2959–2965 CrossRef PubMed.
- W. Xuan and Y. Nengsheng, Electrophoresis, 2017, 38, 3059–3078 CrossRef PubMed.
- Y. Wen, L. Chen, J. Li, D. Liu and L. Chen, TrAC, Trends Anal. Chem., 2014, 59, 26–41 CrossRef.
- F. L. Zhao, H. M. Liu, S. D. R. Mathe, A. J. Dong and J. H. Zhang, Nanomaterials, 2018, 8, 15 CrossRef PubMed.
- H. L. Qian, C. X. Yang, W. L. Wang, C. Yang and X. P. Yan, J. Chromatogr. A, 2018, 1542, 1–18 CrossRef PubMed.
- J. L. Segura, M. J. Mancheno and F. Zamora, Chem. Soc. Rev., 2016, 45, 5635–5671 RSC.
- N. Huang, P. Wang and D. L. Jiang, Nat. Rev. Mater., 2016, 1, 16068 CrossRef.
- C.-X. Yang, C. Liu, Y.-M. Cao and X.-P. Yan, Chem. Commun., 2015, 51, 12254–12257 RSC.
- B. Yang, J. Bjork, H. Lin, X. Zhang, H. Zhang, Y. Li, J. Fan, Q. Li and L. Chi, J. Am. Chem. Soc., 2015, 137, 4904–4907 CrossRef PubMed.
- S.-Y. Ding and W. Wang, Chem. Soc. Rev., 2013, 42, 548–568 RSC.
- X. Feng, X. Ding and D. Jiang, Chem. Soc. Rev., 2012, 41, 6010–6022 RSC.
- A. P. Cote, A. I. Benin, N. W. Ockwig, M. O'Keeffe, A. J. Matzger and O. M. Yaghi, Science, 2005, 310, 1166–1170 CrossRef PubMed.
- J.-Y. Ren, X.-L. Wang, X.-L. Li, M.-L. Wang, R.-S. Zhao and J.-M. Lin, Anal. Bioanal. Chem., 2018, 410, 1657–1665 CrossRef PubMed.
- Q.-L. Li, F. Huang, X.-L. Wang, X. Wang and R.-S. Zhao, Microchim. Acta, 2017, 184, 1817–1825 CrossRef.
- W.-K. Meng, L. Liu, X. Wang, R.-S. Zhao, M.-L. Wang and J.-M. Lin, Anal. Chim. Acta, 2018, 1015, 27–34 CrossRef PubMed.
Footnote |
| † Electronic supplementary information (ESI) available: Experimental details and additional figures. See DOI: 10.1039/c8ra04321c |
| This journal is © The Royal Society of Chemistry 2018 |

