 Open Access Article
Coherent nanoscale cobalt/cobalt oxide heterostructures embedded in porous carbon for the oxygen reduction reaction†
Xue-Cheng Lia,
Fa-Shuang Shea,
Dong Shenc,
Chao-Ping Liud,
Li-Hua Chen a,
Yu Li
 a,
Zhao Deng
 *a,
Zhen-Hua Chen*b and
Hong-En Wang
 *a
*a
aState Key Laboratory of Advanced Technology for Materials Synthesis and Processing, Wuhan University of Technology, 122 Luoshi Road, Hongshan District, Wuhan 430070, China. E-mail: dengzhao@whut.edu.cn; hongenwang@whut.edu.cn
bShanghai Synchrotron Radiation Facility (SSRF), Shanghai Institute of Applied Physics, Chinese Academy of Sciences, Shanghai 201800, China. E-mail: chenzhenhua@sinap.ac.cn
cDepartment of Chemistry and Center of Diamond and Advanced Films (COSDAF), City University of Hong Kong, HKSAR, China
dDepartment of Physics, City University of Hong Kong, HKSAR, China
First published on 10th August 2018
Abstract
Cost-effective and efficient electrocatalysts for the oxygen reduction reaction (ORR) are crucial for fuel cells and metal–air batteries. Herein, we report the facile synthesis of a Co/CoO/Co3O4 heterostructure embedded in a porous carbon matrix by refluxing and annealing. This composite exhibits several structural merits for catalyzing the ORR: (1) the existence of metallic Co and graphitic carbon enhanced the electrical conduction; (2) the porous, loose carbon network facilitated the electrolyte permeation and mass transport; (3) more importantly, the nanosized coherent CoO/Co3O4 heterojunctions with structural defects and oxygen vacancies enhanced the charge transport/separation at the interface and adsorption affinity to O2, thus promoting the ORR kinetics and lowering the reaction barrier. Consequently, the composite electrode manifests high electrocatalytic activity, attaining a current density of 6.7 mA cm−2 at −0.8 V (vs. Ag/AgCl), which is superior to pure CoO nanoparticles (4.7 mA cm−2), and has good methanol tolerance. The present strategy based on heterostructure and vacancy engineering may pave the way for the exploration of more advanced, low-cost electrocatalysts for electrochemical reduction and evolution processes.
Introduction
Exploring new electrocatalyst materials to enhance the sluggish oxygen reduction reaction (ORR) kinetics is key to various renewable energy conversion and storage applications such as fuel cells and rechargeable metal–air batteries.1 Pt- and Pd-based materials have been considered the most efficient electrocatalysts for the ORR so far due to their high activity.2–7 However, the high cost, scarcity and poor stability/durability of Pt have hindered its widespread applications. Various non-precious metal catalysts with comparable catalytic activity and high durability have been extensively sought to substitute Pt in recent years.8–16 Among them, cobalt-based materials (Co,17,18 Co3O4,19–21 CoO22 and their composites23–27) have been intensively studied as promising alternatives to Pt-based electrocatalysts for the ORR due to their tunable composition, morphology, microstructures and rich active sites. Nonetheless, Co-based nanomaterials still have some disadvantages, such as easy aggregation and low electronic conductivity, leading to decreased active surface area and poor charge transfer/transport kinetics during electrochemical redox reactions. Encapsulating Co or cobalt oxides into porous carbon frameworks can in principle boost the electrical conduction and form strong interfacial electron coupling, resulting in enhanced electrocatalytic activity and stability.28,29 In addition, intentional and rational design and fabrication of Co/CoOx heterojunctions could potentially further improve the interfacial charge transfer and electron transport, featuring better electrocatalytic property than single Co/CoOx components.30–32 However, the effective synthesis of such composite materials that can combine all structural advantages remains challenging and deserves further study.In this paper, we report the designed synthesis of Co/CoO/Co3O4 heterostructure (denoted as CoOx) embedded in porous carbon matrix as efficient catalyst for ORR. The composite was obtained by a simple refluxing followed by annealing treatment. The synergic coupling of coherent CoO/Co3O4 heterojunctions and presence of metallic Co and conductive amorphous carbon enable the material a high and stable electrocatalytic performance. Our work presented herein can provide new insights into the rational design and synthesis of new heterostructure-type transition metal compounds for electrochemical energy conversion and storage applications.
Experimental section
All the chemicals were of analytical pure grade and used as received without further purification.Material synthesis
Synthesis of CoO nanoparticles
Pure CoO nanoparticles were prepared by a mild refluxing process in oleylamine under Ar protection referring our previous work33 with little modifications. In a typical procedure, a mixture of Co(acetylacetonate)3 (1.6 mmol) and oleylamine (80 mmol) was heated to 135 °C and maintained at this temperature for 90 min with magnetic stirring. The resulting solution was then heated to 200 °C within 5 min and refluxed at this temperature for another 60 min, finally cooled to room temperature naturally. During this process, the Co(acetylacetonate)3 was decomposed into nanosized CoO in situ capped with oleylamine. After reaction, excess ethanol was added to the resulting mixture to precipitate the brown product. The resultant CoO nanoparticles were thoroughly washed with ethanol to remove the residual oleylamine adsorbed on their surface, and were dried under Ar protection before being dispersed in hexane again for further use.Synthesis of CoOx/C composite
CoOx/C composite sample was prepared by annealing the refluxed CoO product before removing oleylamine (without rinsing) in a tube furnace at setting temperatures (400–800 °C) for 2 h under purged Ar. For simplicity, the samples obtained after thermal treatment at 400 °C, 600 °C and 800 °C were donated as CoOx-400, CoOx-600 and CoOx-800, respectively.Characterizations
X-ray diffraction (XRD) patterns were recorded on a Bruker diffractometer with Cu Kα radiation (λ = 1.54056 Å) at 40 kV mA−1. The morphology of the samples was observed by a scanning electron microscope (SEM, Hitachi S-4800) equipped with an energy-dispersive X-ray (EDX) analyzer. Transmission electron microscopy (TEM) and high-resolution TEM (HRTEM) micrographs were acquired on a JEOL JEM-2100F microscope at 200 kV. Raman measurement was performed at room temperature by an Invia Raman microscope (Renishaw, UK) using 633 nm excitation wavelength. The electronic states and surface composition of the sample were analyzed by X-ray photoelectron spectroscope (XPS, Thermo fisher, Alpha). The binding energies (BE) for the sample were calibrated using C 1s peak from a carbon tape at 284.8 eV.Electrochemical tests
Electrochemical measurements were recorded on a CHI 660D electrochemical workstation in a three-electrode system at room temperature. The glassy carbon electrode with a diameter of 5 mm, Pt foil and Ag/AgCl were used as working electrode, counter electrode and reference electrode, respectively. The electrochemical experiments were carried out in an O2-saturated 0.1 M KOH aqueous solution electrolyte. To prepare the working electrode, 5 mg sample and 15 μL Nafion solution (5 wt%) was thoroughly dispersed in 1 mL water and isopropanol (volume ratio of 3![[thin space (1/6-em)]](https://www.rsc.org/images/entities/char_2009.gif) :
:![[thin space (1/6-em)]](https://www.rsc.org/images/entities/char_2009.gif) 1) by sonication for 30 min to form a homogeneous ink. Then 4 μL of catalyst ink (containing ∼20 μg catalyst) was cast on the surface of the glassy carbon electrode and dried in air. The rotating-disk electrode (RDE) measurements were carried out at a sweep rate of 5 mV s−1 with varied rotation speeds from 400 to 2025 rpm. To evaluate the methanol resistance capability of the electrode, cyclic voltammetry (CV) sweep was recorded in an O2-saturated 0.1 M KOH electrolyte with and without addition of 3 M methanol for comparison.
1) by sonication for 30 min to form a homogeneous ink. Then 4 μL of catalyst ink (containing ∼20 μg catalyst) was cast on the surface of the glassy carbon electrode and dried in air. The rotating-disk electrode (RDE) measurements were carried out at a sweep rate of 5 mV s−1 with varied rotation speeds from 400 to 2025 rpm. To evaluate the methanol resistance capability of the electrode, cyclic voltammetry (CV) sweep was recorded in an O2-saturated 0.1 M KOH electrolyte with and without addition of 3 M methanol for comparison.
Results and discussion
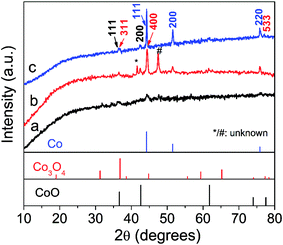
The crystal structure of the as-prepared samples was first studied by XRD analysis. As shown in Fig. 1, the crystallinity of the samples increases along with the increase of annealing temperature as reflected by sharp diffraction peaks. All the three samples contain cubic CoO (space group Fm3m, JCPDS 01-1227)30 and cubic metallic Co (space group Fm3m, JCPDS 15-0806),17 suggesting the CoO can be easily reduced to Co species by surface residual oleylamine under inert atmosphere. In addition, two additional peaks (marked by “*” and “#”) are noted in CoOx-600 and cannot be indexed to known cobalt-based compounds, which may be related to the formation of some unknown intermediate products. Another interesting feature is that cubic Co3O4 (space group Fd3m, JCPDS 01-1152)20a can also exist in the CoOx-800 and CoOx-600 sample because at high annealing temperatures some exposed Co species formed by the removal of most adjacent carbon species (in form of CO or CO2) may be re-oxidized into Co3O4.20b However, from Fig. 1 the strong diffraction peak of (311) plane (red) for Co3O4 at 2θ = ∼37° (Note that it may also be (111) plane (black) for CoO) has a much weaker intensity compared to the strong diffraction peak of (111) plane (blue) for Co, suggesting the low content of Co3O4 (CoO) relative to Co species in the composite. However, the low content of Co3O4 and the superimposition of major diffraction peaks position between Co3O4 and CoO make the identification of Co3O4 difficult and challenging. For this, its presence has been further confirmed by the existence of Co3+ species in XPS and HRTEM analyses in the following.The crystal and carbon structure of the CoOx was further analyzed by Raman spectra, as shown in Fig. 2. The noticeable peaks can be indexed to the F2g (196.5 cm−1), Eg (480.9 cm−1), F2g (517.7 and 617.7 cm−1) and A1g (686.2 cm−1) modes of Co3O4,34 further evidencing the existence of Co3O4 phase localized mainly at surface. Compared to literature,34 all the Raman peaks for Co3O4 in the composite shifted to lower wavenumbers possibly caused by the presence of oxygen vacancies35,36 as further discussed in the XPS analyses in the following. Another two strong Raman peaks centering around 1357 cm−1 and 1605 cm−1 can be assigned to the D-band (vibrations of sp3-hybridized carbon atoms with dangling bonds) and G-band (sp2-bonded carbon atoms) of graphitic carbon, respectively,37,38 formed by carbonization of residual oleylamine. It is found that the intensity of D and G bands of the products increased first with increasing temperature, while it decreased with further increasing temperature. Generally, the D and G bands represent the degree of graphitization and content of the graphitized carbon in the composite. Therefore, the enhancement of D and G band intensity of CoOx-600 relative to CoOx-400 can signify an increase of the graphitized carbon in the composite because the annealing temperature of 400 °C is still low for carbonization process. This can also be reflected in the following SEM characterization, which reveals that the morphology of CoOx-400 doesn't alter much compared to CoO. Instead, the CoOx-600 product contains some 1D nanostructures (probably carbon nanotubes) that are formed by carbonization catalyzed by the metallic Co species. However, further increasing annealing temperature to 800 °C, the carbon species can further reduce CoO into Co; meantime, some carbon substances are converted into CO or CO2 and thus consumed, giving rise to reduced total graphitized carbon in the composite and a lowered D and G band intensity in Raman as well. In addition, the slight increase of intensity for ID relative to IG in CoOx-800 compared to CoOx-400 and CoOx-600 can be mainly ascribed to the possible presence of some strain at the Co/CoO/Co3O4 and carbon interface in the composite as revealed by the fusion of most nanoparticles together in the CoOx-800 product from SEM observation.
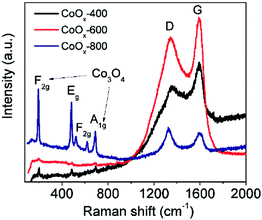 | ||
| Fig. 2 Raman spectra of the samples prepared by refluxing and annealing for 2 h in Ar at 400 °C (CoOx-400), 600 °C (CoOx-600) and 800 °C (CoOx-800). | ||
The surface valence electronic states and element composition in the CoOx-800 sample were investigated by XPS. The survey XPS spectrum in Fig. 3a validates the existence of Co, O and C elements in the sample. The deconvolution of Co 2p core level XPS reveals the presence of three pairs of peaks (Fig. 3b). The first pair of peaks with lower binding energies (BE) centered at 779.4 eV and 794.4 eV can be ascribed to Co 2p3/2 and Co 2p1/2 of metallic Co.26 Another pair of peaks with BE at 780.4 and 795.9 eV can be assigned to the 2p3/2 and 2p1/2 of Co3+ in Co3O4.20 The two bands at higher BE of 781.8 and 797.3 eV correspond to the 2p3/2 and 2p1/2 of Co2+ in CoO/Co3O4.20,39 Additionally, two broad bands centering at 784 eV and 803 eV are noted for shakeup satellite peaks of Co2+ and Co3+.39 A rough estimation from the area ratio of Co3+ (for Co3O4) to Co0 in metallic Co species reveals the content of Co3O4 is comparable to that of Co on the surface. This result does not violate the XRD result because XPS is a surface-sensitive characterization. On the contrary, these XPS data further support that the Co3O4 species mainly localize on the composite surface and prevent further oxidation of Co underneath. Fig. 3c depicts the O 1s XPS spectrum, which can be deconvoluted into three bands: O–Co bond (529.6 eV),39 oxygen vacancy (Vo, 531 eV),35 and O–C bond (532.1 eV).40 Note that the Vo can be ascribed to the incomplete reduction from CoO to Co during carbonization of organics. The deconvolution of C 1s spectrum in Fig. 3d indicates the presence of C–C/C![[double bond, length as m-dash]](https://www.rsc.org/images/entities/char_e001.gif) C bonds for graphite carbon (284.4 eV), C–O bond (285.8 eV) and C
C bonds for graphite carbon (284.4 eV), C–O bond (285.8 eV) and C![[double bond, length as m-dash]](https://www.rsc.org/images/entities/char_e001.gif) O bond (288 eV) for surface functional groups.40,41
O bond (288 eV) for surface functional groups.40,41
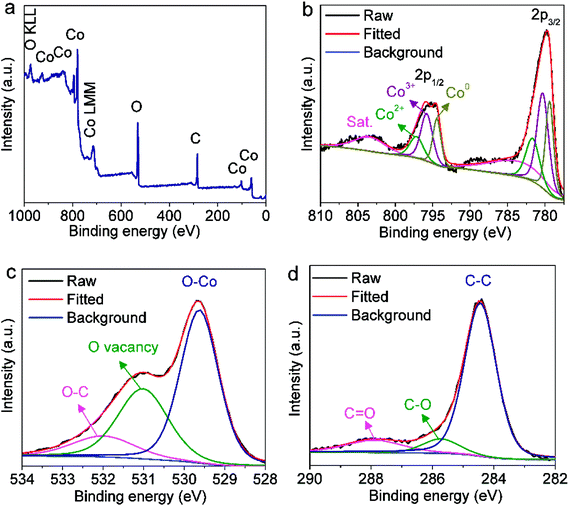 | ||
| Fig. 3 (a) XPS survey spectrum and high-resolution XPS spectra of (b) Co 2p, (c) O 1s and (d) C 1s core levels in CoOx-800 sample. | ||
The surface morphologies of the prepared CoOx samples were first observed by SEM. In Fig. 4a, the CoO sample synthesized by refluxing alone contains spherical nanoparticles with sizes of 20–30 nm, which is in consistent with previous work.33 After annealing the refluxed CoO at 400 °C for 2 h in Ar, the resultant sample (CoOx-400) is composed of some larger particles with sizes of 40–60 nm that are fused together (Fig. 4b). In CoOx-600 sample, some large aggregates (∼400 nm) and copious 1D carbon nanostructures are observed (marked by white arrows). The formation of such 1D carbon nanomaterials can be probably due to the catalytic effect of Co species. That is, metallic Co formed during the carbonized process in turn catalyzed the production of 1D nanostructured carbon.42 For the CoOx-800 sample, it mainly comprises larger aggregates with few 1D carbon nanostructures (Fig. 4d). The formation of such aggregates suggests the fusion of most CoOx particles mediated by carbon species to minimize the total surface energy of the whole system during annealing process. Fig. 5 shows the SEM micrograph of the CoOx-800 sample and corresponding EDX map of C, O and Co elements, proving their relatively uniform distribution.
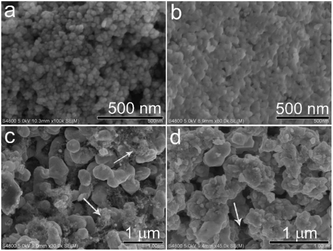 | ||
| Fig. 4 SEM images of the samples synthesized by refluxing (a), and annealing in Ar at 400 °C (CoOx-400) (b), 600 °C (CoOx-600) (c) and 800 °C (CoOx-800) (d), respectively. | ||
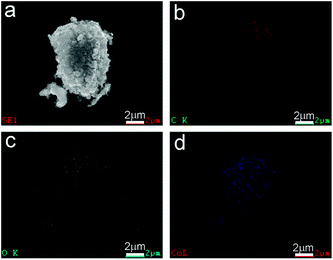 | ||
| Fig. 5 (a) SEM image and EDX mappings of (b) C, (c) O, and (d) Co elements in the CoOx-800 sample, evidencing their relatively uniform distribution. | ||
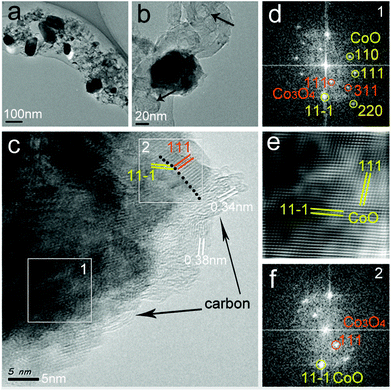
Fig. 6 presents the TEM and HRTEM micrographs of the CoOx-800 sample. The TEM in Fig. 6a shows several CoOx particles with sizes of ∼100 nm that are embedded in a porous carbon matrix. In addition, few CoOx particles have exposed surface (without coating with carbon layer) possibly due to the complete removal of organics surrounding them. In Fig. 6b, some ring-like carbon nanostructures are observed as indicated by black arrows. The formation of such carbon nanostructure can be ascribed to the carbonization of organics into carbon nanotubes catalyzed by Co species, which agrees with the SEM result (Fig. 4d). Fig. 6c displays the HRTEM micrograph of a portion of a single CoOx particle capped by thin carbon layers (∼5 nm thick as marked by black arrows). Fast Fourier Transform (FFT) image in Fig. 6d taken from area 1 in Fig. 6c (marked by white square at the bottom left) clearly reveals the coexistence of cubic CoO (JCPDS 01-1227) and Co3O4 (JCPDS 01-1152) phases, suggesting the formation of nanoscale coherent CoO/Co3O4 heterojunctions in the composite. The inverse FFT (IFFT) image in Fig. 6e obtained from (111) and (11−1) planes in Fig. 6d (labelled by yellow color) after applying a filter depicts a 2D lattice image of CoO with some distortions, suggesting the presence of some defects (e.g., edge dislocations and oxygen vacancy).35 The HRTEM image of the area 2 in Fig. 6c (white square on the top right) and corresponding FFT image (Fig. 6f) further confirm the coexistence of CoO/Co3O4 phases with a sharp interface (marked by the black dotted line in Fig. 6c). Note that both domains 1 and 2 in Fig. 6c contain Co3O4 phase. Careful inspection indicates that these two domains are both located at the (thin) edge regions with incomplete carbon encapsulation, meaning that Co3O4 can be formed by the re-oxidation of the exposed Co species upon exposure to air.
Based on the above characterizations, we deduce that during the carbonization process some newly formed Co species can migrate, fuse and segregate together with exposed surface accompanied by the removal of some carbonaceous substances (CO, CO2 etc.). The exposed Co surface can then be easily re-oxidized into Co3O4 upon exposure to air. Once oxidation, the newly formed Co3O4 layer as well as the carbon encapsulation can prevent the complete oxidation of all Co species. Therefore, a composite of CoO/Co/Co3O4 with carbon was produced in the end.
It should be stressed that the finding of coexistence of Co3O4 at surface due to spontaneous oxidation of Co is important for catalysis-related research because most of these reactions are surface-involved/sensitive process involving O2. Therefore, the surface composition, (micro) structure and chemical states of Co and Co-based compounds will undoubted exert a crucial role on the catalytic property of this class of electrocatalyst materials.
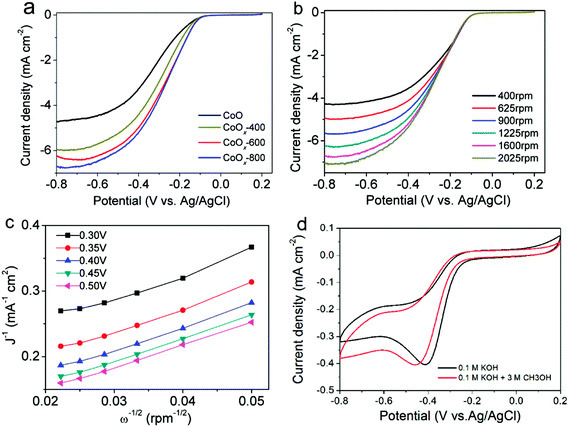
Fig. 7a shows the ORR polarization curves of CoO, CoOx-400, CoOx-600 and CoOx-800 obtained at a rotation rate of 1600 rpm in an O2-saturated 0.1 M KOH electrolyte. It is clear that CoOx-800 electrode exhibits a higher current of 6.7 mA cm−2 at −0.8 V, which is superior to that of CoO (4.7 mA cm−2), CoOx-400 (5.9 mA cm−2), and CoOx-600 (6.2 mA cm−2) electrodes as well as the electrodes comprised of commercial Co3O4 (2.25 mA cm−2) and CoO (1.8 mA cm−2) nanoparticles (Fig. S1†) at the same applied potential. Besides, CoOx-800 sample shows a halfwave potential of ca. −0.28 V (vs. Ag/AgCl), which is 50 mV more positive than that of pristine CoO (−0.33 V). These results suggest that the CoOx-800 material exhibits better electrocatalytic activity toward ORR process. Note that our CoOx-800 electrode also exhibits better or comparable electrocatalytic activity to that of some other Co-based compounds in previous literatures, such as Co/CoO nanoparticles assembled on graphene,23 Co/CoO nanoparticles immobilized on Co–N doped carbon,25 Co–N–C framework,43 and N-doped carbon nanofibers encapsulating Co nanoparticles.17
The reaction kinetics of the CoOx-800 electrode were further studied by rotating-disk electrode (RDE) voltammetry tests. Linear sweep voltammetry (LSV) profiles in an O2-saturated 0.1 M KOH electrolyte show that the current response increases with increasing rotation rates from 400 to 2025 rpm (Fig. 7b). The onset potential of CoOx-800 electrode for the ORR process initiates at ca. −0.10 V. The corresponding Koutecky–Levich (K–L) plots in Fig. 7c further exhibit good linearity. The slopes remain approximately constant over the potential range from −0.10 to −0.50 V, suggesting a similar electron-transfer number per O2 molecule involved in ORR within the scanned potential range. Linearity and parallelism of the plots usually imply first-order reaction kinetics with respect to the concentration of dissolved O2. The kinetic parameters have been further analyzed using K–L equations following eqn (1)–(3):
 | (1) |
| B = 0.62nFC0D02/3v−1/6 | (2) |
| Jk = nFkC0 | (3) |
![[thin space (1/6-em)]](https://www.rsc.org/images/entities/char_2009.gif) 485 C mol−1), C0 is bulk concentration of O2 dissolved in the electrolyte (1.2 × 10⁻³ mol L−1), D0 is diffusion coefficient of O2 in electrolyte (1.9 × 10⁻⁵ cm2 s−1), v is kinetic viscosity of the electrode (0.1 m2 s−1), and k is electron-transfer rate constant. According to eqn (1) and (2), n and JK can be obtained from the slope and intercept of the K–L plots, respectively.
485 C mol−1), C0 is bulk concentration of O2 dissolved in the electrolyte (1.2 × 10⁻³ mol L−1), D0 is diffusion coefficient of O2 in electrolyte (1.9 × 10⁻⁵ cm2 s−1), v is kinetic viscosity of the electrode (0.1 m2 s−1), and k is electron-transfer rate constant. According to eqn (1) and (2), n and JK can be obtained from the slope and intercept of the K–L plots, respectively.
The average electron transfer numbers of CoOx-800 sample were calculated to be ∼3.9 at −0.3 to −0.5 V (vs. Ag/AgCl), indicating that CoOx-800 can efficiently catalyze ORR process via a four-electron pathway. In addition, the electrochemical stability and methanol tolerance capability are also important performance indicators for ORR electrocatalysts. As seen from Fig. 7d, it is noted that the two curves have comparable peak current (∼0.4 mA cm−2) during cathodic process albeit with the more negative potential for the one with addition of methanol, suggesting the addition of methanol only has a slight influence on the ORR process and CoOx-800 exhibits a relatively robust catalytic capability.
The cycling performance of the CoOx-800 electrode was further evaluated. As shown in Fig. S2,† the CV curves of the CoOx-800 electrode in the 1st, 50th, and 1000th cycles almost overlap, suggesting its superior cyclability during the long-term ORR process.
The superior electrocatalytic property of the CoOx-800 electrode can be mainly attributed to the effective synergy of its unique structural merits in terms of structural defects, phase heterostructure and porous architecture: (1) the presence of metallic Co and graphitic carbon species can significantly enhance the electrical transport within the composite electrode, thus leading to reduced polarization and boosted ORR kinetics; (2) the coherent nanosized CoO/Co3O4 heterostructure can further boost the electron transport at interface and propel the O2 reduction process; (3) the existence of oxygen vacancy (Vo) in CoO can enhance its binding energy towards O2 and lower the activation energy barrier for O2 electroreduction; (4) the porous and loose carbon framework can facilitate the electrolyte transport and diffusion of O2 and reaction intermediates. The synergetic function of the above enables the CoOx-800 electrode to deliver a superior electrocatalytic performance for ORR process.
Conclusions
In summary, we have demonstrated a facile route for synthesis of a coherent nanoscale Co/CoO/Co3O4 heterojunction encapsulated in a porous carbon framework. Benefiting from the introduction of graphitized carbon matrix and metallic Co species as well as formation of nanoscale CoO/Co3O4 heterostructure with oxygen vacancies, the composite catalyst shows outstanding ORR catalytic activity compared to pure CoO and high methanol tolerance. The present strategy may be extended to the design and fabrication of other heterostructure composite electrocatalysts for electrochemical oxygen reduction and evolution processes.Conflicts of interest
There are no conflicts to declare.Acknowledgements
This work is funded by the National Natural Science Foundation of China (Grant No. 51302204). H.-E. Wang thanks the Hubei Provincial Department of Education for the “Chutian Scholar” program. The authors also thank Prof. Bao-Lian Su (University of Namur), Guozhong Cao (University of Washington) and Wenjun Zhang (City University of Hong Kong) for kind support.References
- J. L. Liu, D. D. Zhu, C. X. Guo, A. Vasileff and S. Z. Qiao, Adv. Energy Mater., 2017, 7, 26 Search PubMed.
- Z. X. Yan, H. E. Wang, M. P. Zhang, Z. F. Jiang, T. S. Jiang and J. M. Xie, Electrochim. Acta, 2013, 95, 218–224 CrossRef.
- Z. X. Yan, M. M. Zhang, J. M. Xie, H. E. Wang and W. Wei, J. Power Sources, 2013, 243, 48–53 CrossRef.
- J. Ying, J. Li, G. P. Jiang, Z. P. Cano, Z. Ma, C. Zhong, D. Su and Z. W. Chen, Appl. Catal., B, 2018, 225, 496–503 CrossRef.
- Z. X. Yan, L. N. Gao, C. J. Dai, M. M. Zhang, X. M. Lv and P. K. Shen, Int. J. Hydrogen Energy, 2018, 43, 3705–3715 CrossRef.
- J. Ying, G. P. Jiang, Z. P. Cano, L. Han, X. Y. Yang and Z. W. Chen, Nano Energy, 2017, 40, 88–94 CrossRef.
- (a) H. Xu, P. P. Song, F. Gao, Y. Shiraishi and Y. K. Du, Nanoscale, 2018, 10, 8246–8252 RSC; (b) J. B. Ding, L. Z. Bu, S. J. Guo, Z. P. Zhao, E. B. Zhu, Y. Huang and X. Q. Huang, Nano Lett., 2016, 16, 2762–2767 CrossRef PubMed; (c) L. Z. Bu, C. Y. Tang, Q. Shao, X. Zhu and X. Q. Huang, ACS Catal., 2018, 8, 4569–4575 CrossRef.
- H. Xu, B. Yan, J. Wang, K. Zhang, S. M. Li, Z. P. Xiong, C. Q. Wang, Y. Shiraishi, Y. K. Du and P. Yang, J. Mater. Chem. A, 2017, 5, 15932–15939 RSC.
- S. Wu, Y. Zhu, Y. Huo, Y. Luo, L. Zhang, Y. Wan, B. Nan, L. Cao, Z. Wang, M. Li, M. Yang, H. Cheng and Z. Lu, Sci. China Mater., 2017, 60, 654–663 CrossRef.
- Y. Zhou, R. G. Ma, S. L. Candelaria, J. C. Wang, Q. Liu, E. Uchaker, P. X. Li, Y. F. Chen and G. Z. Cao, J. Power Sources, 2016, 314, 39–48 CrossRef.
- R. G. Ma, Y. Zhou, P. X. Li, Y. F. Chen, J. C. Wang and Q. Liu, Electrochim. Acta, 2016, 216, 347–354 CrossRef.
- R. G. Ma, B. Y. Xia, Y. Zhou, P. X. Li, Y. F. Chen, Q. Liu and J. C. Wang, Carbon, 2016, 102, 58–65 CrossRef.
- R. G. Ma, X. D. Ren, B. Y. Xia, Y. Zhou, C. Sun, Q. Liu, J. J. Liu and J. C. Wang, Nano Res., 2016, 9, 808–819 CrossRef.
- R. G. Ma, X. D. Ren, B. Y. Xia, Y. Zhou, C. Sun, Q. Liu, J. J. Liu and J. C. Wang, Nano Res., 2017, 10, 2332–2343 CrossRef.
- Q. C. Wang, Z. Y. Chen, N. Wu, B. Wang, W. He, Y. P. Lei and Y. D. Wang, ChemElectroChem, 2017, 4, 514–520 CrossRef.
- Y. P. Lei, Q. Shi, C. Han, B. Wang, N. Wu, H. Wang and Y. D. Wang, Nano Res., 2016, 9, 2498–2509 CrossRef.
- C. Q. Shang, M. C. Li, Z. Y. Wang, S. F. Wu and Z. G. Lu, ChemElectroChem, 2016, 3, 1437–1445 CrossRef.
- R. Li, X. Z. Wang, Y. F. Dong, X. Pan, X. G. Liu, Z. B. Zhao and J. S. Qiu, Carbon, 2018, 132, 580–588 CrossRef.
- Y. Y. Liang, Y. G. Li, H. L. Wang, J. G. Zhou, J. Wang, T. Regier and H. J. Dai, Nat. Mater., 2011, 10, 780–786 CrossRef PubMed.
- (a) X. Han, G. He, Y. He, J. Zhang, X. Zheng, L. Li, C. Zhong, W. Hu, Y. Deng and T.-Y. Ma, Adv. Energy Mater., 2018, 1702222 CrossRef; (b) H. Lee, J. Lim, C. Lee, S. Back, K. An, J. W. Shin, R. Ryoo, Y. Jung and J. Y. Park, Nat. Commun., 2018, 9, 2235 CrossRef PubMed.
- B. Y. Li, Y. H. Zhang, R. F. Du, L. Liu and X. L. Yu, Nanotechnology, 2018, 29, 8 Search PubMed.
- Q. S. Huang, P. J. Zhou, H. Yang, L. L. Zhu and H. Y. Wu, Electrochim. Acta, 2017, 232, 339–347 CrossRef.
- S. J. Guo, S. Zhang, L. H. Wu and S. H. Sun, Angew. Chem., Int. Ed., 2012, 51, 11770–11773 CrossRef PubMed.
- Y. Liu, Y. Liu, S. H.-S. Cheng, S. Yu, B. Nan, H. Bian, K. Md, M. Wang, C. Y. Chung and Z.-G. Lu, Electrochim. Acta, 2016, 219, 560–567 CrossRef.
- X. Zhang, R. R. Liu, Y. P. Zang, G. Q. Liu, G. Z. Wang, Y. X. Zhang, H. M. Zhang and H. J. Zhao, Chem. Commun., 2016, 52, 5946–5949 RSC.
- C. D. Bai, S. S. Wei, D. R. Deng, X. D. Lin, M. S. Zheng and Q. F. Dong, J. Mater. Chem. A, 2017, 5, 9533–9536 RSC.
- Z. Zeng, T. Zhang, Y. Y. Liu, W. D. Zhang, Z. Y. Yin, Z. W. Ji and J. J. Wei, ChemSusChem, 2018, 11, 580–588 CrossRef PubMed.
- I. A. Khan, A. Badshah and M. A. Nadeem, Catal. Commun., 2017, 99, 10–14 CrossRef.
- H. Kim, Y. Kim, Y. Noh, S. Lee, J. Sung and W. B. Kim, ChemCatChem, 2017, 9, 1503–1510 CrossRef.
- J. Li, Q. F. Wang, K. Liu, J. B. Jiang, D. Qian, J. H. Li and Z. H. Chen, Mater. Lett., 2017, 186, 189–192 CrossRef.
- M. Liu, J. J. Liu, Z. L. Li and F. Wang, ACS Appl. Mater. Interfaces, 2018, 10, 7052–7060 CrossRef PubMed.
- L. Lv, D. Zha, Y. Ruan, Z. Li, X. Ao, J. Zheng, J. Jiang, H. M. Chen, W.-H. Chiang, J. Chen and C. Wang, ACS Nano, 2018, 12, 3042–3051 CrossRef PubMed.
- X. F. Zheng, G. F. Shen, Y. Li, H. N. Duan, X. Y. Yang, S. Z. Huang, H. E. Wang, C. Wang, Z. Deng and B. L. Su, J. Mater. Chem. A, 2013, 1, 1394–1400 RSC.
- V. G. Hadjiev, M. N. Iliev and I. V. Vergilov, J. Phys. C: Solid State Phys., 1988, 21, L199–L201 CrossRef.
- (a) R. Gao, Z. Y. Li, X. L. Zhang, J. C. Zhang, Z. B. Hu and X. F. Liu, ACS Catal., 2016, 6, 400–406 CrossRef; (b) C. Y. Zhao, Y. Cai, K. L. Yin, H. Z. Li, D. Shen, N. Qin, Z. G. Lu, C. P. Liu and H. E. Wang, Chem. Eng. J., 2018, 350, 201–208 CrossRef.
- R. Gao, L. Liu, Z. B. Hu, P. Zhang, X. Z. Cao, B. Y. Wang and X. F. Liu, J. Mater. Chem. A, 2015, 3, 17598–17605 RSC.
- H. E. Wang, X. Zhao, X. C. Li, Z. Y. Wang, C. F. Liu, Z. G. Lu, W. J. Zhang and G. Z. Cao, J. Mater. Chem. A, 2017, 5, 25056–25063 RSC.
- H. K. Wang, X. M. Yang, Q. Z. Wu, Q. B. Zhang, H. X. Chen, H. M. Jing, J. K. Wang, S. B. Mi, A. L. Rogach and C. M. Niu, ACS Nano, 2018, 12, 3406–3416 CrossRef PubMed.
- T. Liu, Y. F. Guo, Y. M. Yan, F. Wang, C. Deng, D. Rooney and K. N. Sun, Carbon, 2016, 106, 84–92 CrossRef.
- H. E. Wang, X. Zhao, K. L. Yin, Y. Li, L. H. Chen, X. Y. Yang, W. J. Zhang, B. L. Su and G. Z. Cao, ACS Appl. Mater. Interfaces, 2017, 9, 43665–43673 CrossRef PubMed.
- Y. Cai, H. E. Wang, X. Zhao, F. Huang, C. Wang, Z. Deng, Y. Li, G. Z. Cao and B. L. Su, ACS Appl. Mater. Interfaces, 2017, 9, 10652–10663 CrossRef PubMed.
- B. Y. Xia, Y. Yan, N. Li, H. B. Wu, X. W. Lou and X. Wang, Nat. Energy, 2016, 1, 15006 CrossRef.
- S. Gadipelli, T. T. Zhao, S. A. Shevlin and Z. X. Guo, Energy Environ. Sci., 2016, 9, 1661–1667 RSC.
Footnote |
| † Electronic supplementary information (ESI) available. See DOI: 10.1039/c8ra04256j |
| This journal is © The Royal Society of Chemistry 2018 |

