 Open Access Article
Improvement of sylvite flotation from halite by starvation feeding the collector octadecylamine
Shoujiang Lia,
Bo Xua,
Peng Chena,
Yunliang Zhao*ab,
Guihua Niea and
Shaoxian Song *b
*b
aSchool of Resources and Environmental Engineering, Wuhan University of Technology, Luoshi Road 122, Wuhan, Hubei 430070, China. E-mail: zyl286@whut.edu.cn
bHubei Key Laboratory of Mineral Resources Processing and Environment, Wuhan University of Technology, Luoshi Road 122, Wuhan, Hubei 430070, China. E-mail: ssx851215@whut.edu.cn
First published on 3rd July 2018
Abstract
In order to improve the separation of sylvite and halite in SDIC Xinjiang Lop Nur potash Co. Ltd. (SLNP), in this work, the flotation kinetics of sylvite and halite under different collector dosages were investigated. It was observed that the increased speed of halite was much faster than sylvite in terms of flotation rate with an increase in octadecylamine hydrochloride (ODA) dosage. The reason for the upward floating of halite explored by SEM-EDS was that sylvite was locked with halite, thus it can float up along with sylvite. According to the analysis results, a strategy of starvation feeding the collector was employed to increase the flotation rate difference between sylvite and halite, and consequently improve the separation of sylvite and halite. It has been demonstrated that starvation feeding the collector is an efficient method for obtaining high grade sylvite, because it can not only improve the separation of sylvite and halite but also decrease the consumption of ODA in the flotation process.
1. Introduction
SDIC Xinjiang Lop Nur potash Co. Ltd. (SLNP) is the biggest K2SO4 production company in the world with a K2SO4 yield of 1.6 million ton per year.1 The K2SO4 of SLNP is obtained by the conversion of sylvite (KCl) and schoenite (K2SO4·MgSO4·6H2O) with the addition of water,2 among which sylvite is gained from a carnallite (KCl·MgCl2·6H2O)/halite (NaCl) mixed crystal product by a combination process of cold decomposition and flotation.3,4 With regard to the flotation process, the main purpose is to separate sylvite from halite and obtain high grade sylvite. However, in the production process of SLNP, there is a serious problem that the Na+ grade (7–9%) in sylvite concentrate is much higher than the requirement of 6%, resulting in mirabilite (Na2SO4·10H2O) being easily generated when the conversion of sylvite and schoenite to K2SO4 is carried out,5 which seriously decreases the quality of K2SO4. Therefore, in order to improve the quality of K2SO4, the separation of sylvite and halite urgently needs to be improved in SLNP.However, there are only a few methods for improving the separation of sylvite and halite at present. The quality of sylvite concentrate can be improved by controlling the decomposition process of carnallite, based on the quaternary diagram of the NaCl–KCl–MgCl2–H2O system.6,7 However, the decomposition process of carnallite is hard to control, because it is influenced easily by many factors such as temperature and the amount of mother liquor (K+ saturated but Mg2+ unsaturated solution). Wang et al.8 showed that the grade of sylvite concentrate in Qinghai Avic Resources Company was improved by a combination process of de-brining and washing to remove the magnesium chloride and halite particles in sylvite concentrate. Although the performance of this method is good, it greatly increases the cost of production. Moreover, this process needs a large amount of fresh water, but the Lop Nur region is one of the driest regions in the world, thus it is inapplicable to remove halite from sylvite concentrate with the washing process in SLNP. Those methods only focus on the decomposition and washing process to improve the quality of sylvite concentrate without any other investigations on the flotation process.
As a flow that can obtain a high grade product, due to its high selectivity with a decrease in dosage, a starvation fed reagent is often applied to separate particles with similar floatability.9 In this study, we paid more attention to the flotation process, and attempted to improve the separation of sylvite and halite with a strategy of starvation feeding the collector, due to some of the halite particles having a similar floatability to sylvite. The objectives were to investigate the flotation behavior of the sylvite and halite particles with different ODA dosages through flotation kinetic experiments and the reason for the upward floating of halite and the feasibility of improving the separation of sylvite and halite through a strategy of starvation feeding the collector.
2. Experimental
2.1 Materials
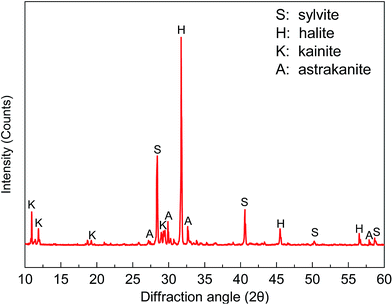
A sample of carnallite after cold decomposition was obtained from SDIC Xinjiang Lop Nur potash Co. Ltd., China. In order to ensure that the physical and chemical properties of the sample were unchanged, the sample was pretreated by vacuum filtrating on a rotary vacuum filter (SHB-III, Shanghai Kang Road Equipment Co., Ltd.). The XRD analysis results of the sample are presented in Fig. 1. It is clear that the main mineral compositions of this sample are halite (NaCl), sylvite (KCl), kainite (KCl·MgSO4·3H2O), and astrakanite (Na2SO4·MgSO4·4H2O).The particle size distribution of the sample was obtained using a conventional wet sieving method with alcohol as the medium. The Na+ and K+ distributions in different size fractions in terms of the sample are presented in Table 1. It can be seen that the particle sizes of the sample were relatively coarse since the samples with a particle size more than 0.15 mm account for 65%. The K+ grade increased remarkably with a decrease in particle size. However, the Na+ grade firstly climbed up and then declined and the distribution of Na+ possessed the same tendency. The impurities of halite were distributed dispersedly in each of the size fractions, which made it impossible for us to adopt sieve pretreatment or classification before feeding ore to the flotation process.
| Size Fraction (mm) | Yield (%) | Cumulative yield (%) | Grade (%) | Distribution (%) | ||
|---|---|---|---|---|---|---|
| Na+ | K+ | Na+ | K+ | |||
| >0.42 | 29.61 | 29.61 | 5.50 | 8.18 | 18.18 | 14.88 |
| 0.42–0.25 | 20.32 | 49.93 | 9.16 | 14.92 | 20.78 | 18.64 |
| 0.25–0.15 | 15.54 | 65.47 | 11.18 | 16.58 | 19.39 | 15.84 |
| 0.15–0.104 | 9.85 | 75.32 | 15.24 | 20.77 | 16.75 | 12.57 |
| 0.104–0.074 | 8.93 | 84.25 | 14.13 | 24.94 | 14.09 | 13.69 |
| <0.074 | 15.75 | 100.00 | 6.15 | 25.19 | 10.81 | 24.39 |
| Total | 100.00 | — | 8.96 | 16.27 | 100.00 | 100.00 |
Octadecylamine hydrochloride (ODA) which was used as collector in this research was supplied by Sichuan Tianyu fat chemical Co., Ltd. A 2 wt% dispersion of ODA was prepared by melting ODA by heating at 70 °C, then it was mixed with a certain amount of diluted HCl solution with a molar ratio of 2![[thin space (1/6-em)]](https://www.rsc.org/images/entities/char_2009.gif) :
:![[thin space (1/6-em)]](https://www.rsc.org/images/entities/char_2009.gif) 1.10,11 Moreover, in order to maintain the dispersion stability of ODA, the ODA solution was kept in a thermostat water bath (HH-4D, Shanghai Leiyin Scientific Instrument Co., Ltd.) at 70 °C. Terpenic oil which was used in this work was purchased from Dongying Shengdou Oil Co., Ltd. Hydrochloric acid (HCl, 36%) and all of the other reagents used in this work were of analytical grade and purchased from Sinopharm Chemical Reagent Co., Ltd (China).
1.10,11 Moreover, in order to maintain the dispersion stability of ODA, the ODA solution was kept in a thermostat water bath (HH-4D, Shanghai Leiyin Scientific Instrument Co., Ltd.) at 70 °C. Terpenic oil which was used in this work was purchased from Dongying Shengdou Oil Co., Ltd. Hydrochloric acid (HCl, 36%) and all of the other reagents used in this work were of analytical grade and purchased from Sinopharm Chemical Reagent Co., Ltd (China).
2.2 Flotation experiments
Batch flotation tests were conducted in an XFD 500 cm3 laboratory flotation machine (Wuhan Prospecting Machinery Factory, China) at pH 6. The flowsheet of the flotation kinetic test based on the current flotation flowsheet in SLNP is shown in Fig. 2a. For each experiment, 200 g of sample and 514 g of saturated solution were filled into the flotation cell, and the impeller rotation was kept constant at 2000 rpm. Subsequently, ODA was added and the mixture was stirred for 2 min. Then, terpenic oil was added and the mixture was stirred for 2 min. Finally, the concentrate was removed from the top of the flotation cell every 2 s with a gas filled volume of 800 mL min−1, and collected at 0.5, 1, 1.5, 2, 3, 4 and 7 min. The flotation flowsheet of starvation feeding the collector is shown in Fig. 2b, and the operating process of the flowsheet is the same as the current flotation flowsheet in SLNP.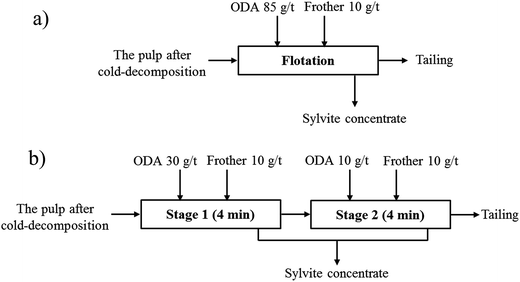 | ||
| Fig. 2 The flotation flowsheet of sylvite: (a) current flotation flowsheet in SLNP; (b) flotation flowsheet of starvation feeding the collector. | ||
2.3 Characterization
The mineral composition of the sample was determined using the X-ray diffraction technique (D-MAX2500/PC, Japan), and the 2θ of the sample was swept from 10° to 60°.A JSM-IT300 scanning electron microscope built by Japan Electronics Co., Ltd. and equipped with an energy dispersive X-ray spectrometer (X-MAX50, UK) was used to determine the mineral composition of the concentrate, and observe the micro-morphology of the mineral particles.
3. Results and discussion
Fig. 3 illustrates the recovery of sylvite and halite as a function of flotation time with different ODA dosages. It can be seen that the recovery of both sylvite and halite significantly increases with an increase in ODA dosage for every flotation period, indicating that the flotation rates of both sylvite and halite markedly rise along with the increase in ODA dosage. Moreover, the rate ratios of the recovery curve for both sylvite and halite progressively increase with an increase in ODA dosage, which also demonstrates that the flotation rate of sylvite and halite would rise with the increase in ODA dosage. This result suggests that ODA dosage has a significant influence on the flotation rate of sylvite and halite.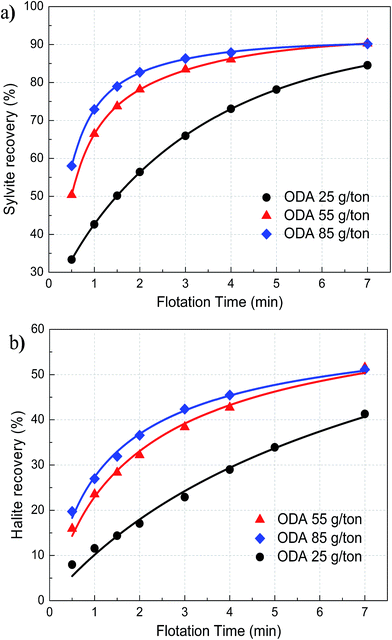 | ||
| Fig. 3 The recovery of sylvite (a) and halite (b) as a function of flotation time with different ODA dosages. | ||
The froth flotation was used for separating valuable minerals from their associated gangue,12 which could be considered as a time-rate recovery process.13 Flotation kinetic models are often used to investigate the flotation results and to estimate the effects of some parameters such as reagent dosages and operating conditions.14 In order to investigate the change in flotation rate of sylvite and halite with different ODA dosages in detail, 5 common flotation kinetic models were employed in this study. According to the fitting results, it was found that the flotation kinetic results of sylvite and halite were well-described by the modified Kelsall model (eqn (1))10,15 and the Second-order model with a rectangular distribution of flotabilities (eqn (2)),16–18 respectively
| ε = ε∞ − ε1∞e−k1t − ε2∞e−k2t | (1) |
| ε = ε∞[1 − ln(1 + kt)/kt] | (2) |
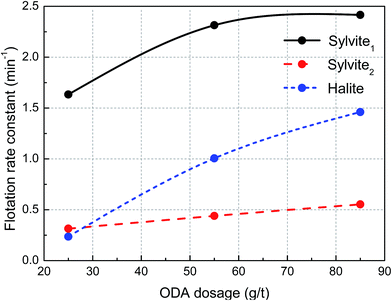
According to the parameters of the flotation kinetics model for the recovery of sylvite (Table 2) and halite (Table 3), the flotation rate constant of sylvite and halite as a function of ODA dosage is illustrated in Fig. 4. It shows that the flotation rate constant of easy-floating sylvite gradually increases with an increase in ODA dosage until it reaches 70 g t−1 and then it flattens out, and the flotation rate constant of hard-floating sylvite increases slowly, whereas the flotation rate constant of halite progressively increases. Furthermore, the flotation rate constant of halite was smaller than both easy-floating and hard-floating sylvite at a low ODA dosage, but the flotation rate constant of halite increased to a level between easy-floating and hard-floating sylvite with an increase in ODA dosage. These results suggest that increasing the ODA dosage can significantly improve the flotation rate of both sylvite and halite. Moreover, the incremental speed of halite was much faster than sylvite in terms of flotation rate with an increase in ODA dosage, observably enhancing the content of Na+ in sylvite concentrate. Thence, increasing the ODA dosage greatly harmed the ability to obtain high-grade sylvite in the flotation process.
| ODA dosage (g t−1) | ε∞ (%) | ε1∞ (%) | k1 (min−1) | ε2∞ (%) | k2 (min−1) | R2 |
|---|---|---|---|---|---|---|
| 25 | 85.81 | 9.243 | 1.633 | 76.567 | 0.314 | 0.999 |
| 55 | 91.072 | 58.783 | 2.314 | 32.289 | 0.440 | 0.999 |
| 85 | 91.024 | 66.360 | 2.416 | 24.664 | 0.554 | 0.999 |
| ODA dosage (g t−1) | ε∞ (%) | k (min−1) | R2 |
|---|---|---|---|
| 25 | 65.372 | 0.236 | 0.986 |
| 55 | 69.546 | 1.005 | 0.991 |
| 85 | 72.045 | 1.461 | 0.994 |
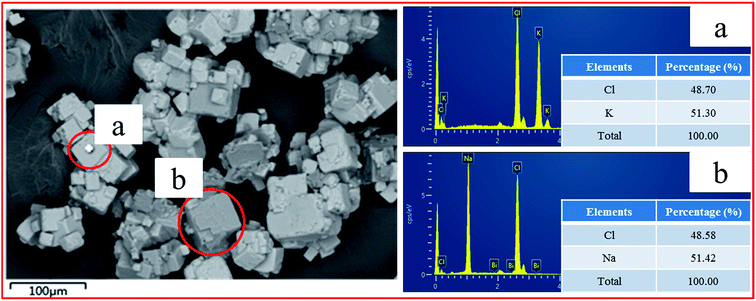
As an interfacial water structure maker, halite particles can’t be collected by ODA in theory as a result of the hydration shell of the halite surface,19–21 whereas the Na+ content of the concentrate was relatively high in the batch experiments. In order to analyze the reason why halite particles can be floated in the batch experiments, SEM-EDS was utilized in this study. The mineral composition and micro-morphology of the concentrate are shown in Fig. 5. It can be seen that the particle size distribution of the concentrate was relatively wide from 10 μm to 70 μm. Moreover, the white particles were locked by the gray particles. According to the analysis results of EDS, it can be determined that the white particles were sylvite and the gray particles were halite. Consequently, on the basis of SEM-EDS analysis and interfacial water structure theory, it was judged that the part of halite particles can be floated to concentrate, due primarily to the locking of sylvite and halite, making the halite particles locked with sylvite float upward.
Based on the analysis results of the flotation kinetics and SEM-EDS, a schematic diagram was utilized to intuitively demonstrate the flotation behavior of the sylvite and halite particles at different ODA dosages, which is presented in Fig. 6. According to the interfacial water structure theory, molecular ODA can only be adsorbed to the sylvite surface.22 It can be seen that only the particles dominated by sylvite can be floated upward at a low ODA dosage, leading to a big difference in flotation rate between sylvite and halite and thus obtaining a high grade concentrate. However, the amount of molecular ODA adsorbed on the sylvite surface gradually increased with an increase in ODA dosage, leading to more and more halite floating upward along with unliberated sylvite, then the difference in flotation rate markedly decreased between sylvite and halite and caused a high Na+ grade in the sylvite concentrate. Thus, a high ODA dosage is detrimental to the availability of a high-grade sylvite concentrate.
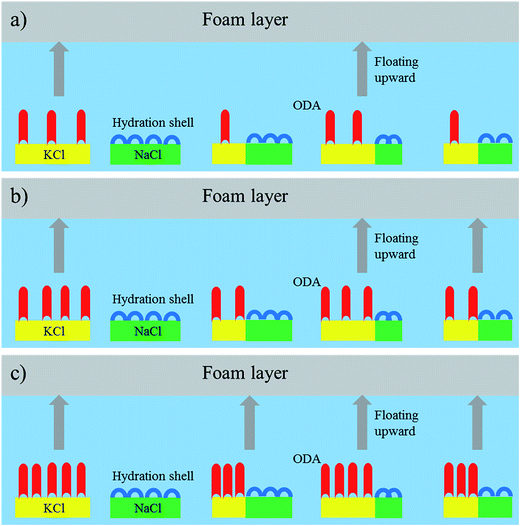 | ||
| Fig. 6 The flotation behavior of sylvite and halite particles at different ODA dosages: (a) low ODA dosage; (b) medium ODA dosage; (c) high ODA dosage. | ||
Although sylvite locked with halite was the primary reason for the high Na+ grade in the sylvite concentrate, grinding mills can’t be utilized to improve the liberation degree of raw ore, because both sylvite and halite are soluble salts whose physicochemical properties may change by inputting kinetic energy.23 Therefore, reducing the halite grade in sylvite concentrate by changing the flotation process was attempted. Furthermore, a novel flotation flowsheet with a strategy of starvation feeding the collector including two stages was proposed, in which we didn’t require a high recovery of sylvite at once. In the first stage, a low ODA dosage was used to obtain a high-grade concentrate due to the big difference in flotation rate between sylvite and halite. In the second stage, ODA was added again to improve the recovery of sylvite.
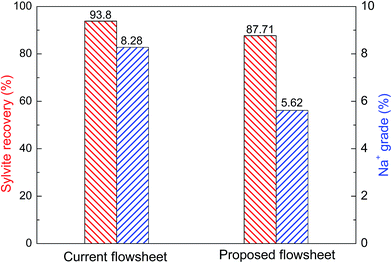
The proposed flotation flowsheet was compared with the current flotation flowsheet of SLNP in terms of the flotation results, which are illustrated in Fig. 7. It can be seen that compared with the current flotation flowsheet in SLNP, an Na+ grade of 8.28 in the concentrate decreased to 5.62 in the proposed flowsheet, observably improving the separation of sylvite and halite. Furthermore, although the sylvite recovery of the proposed flowsheet was a little lower than that of the current flowsheet, the total consumption of ODA in the proposed flowsheet was 40 g t−1, which was less than half of the ODA in the current flotation flowsheet. In the proposed flowsheet, the particles dominated by sylvite with a strong floatability can be floated at the first stage, and thus those particles will not continue to consume ODA. These results indicate that the novel flowsheet with the strategy of starvation feeding the collector can not only improve the separation of sylvite and halite but also decreased the consumption of ODA compared with the current flotation flowsheet in SLNP.
4. Conclusions
The flotation rate difference between sylvite and halite decreased with an increase in the collector dosage, leading to a high Na+ grade in the sylvite concentrate. It has been found that sylvite locked with halite is the primary reason for the upward floating of halite according to flotation kinetic tests and SEM-EDS analysis. A novel flotation flowsheet with a strategy of starvation feeding the collector was proposed to increase the flotation rate difference between sylvite and halite, which is an effective method to decrease the Na+ content in the sylvite concentrate. Compared with the current flotation flowsheet in SLNP, it can not only improve the separation of sylvite and halite but also decrease the consumption of ODA in the flotation process.Conflicts of interest
There are no conflicts of interest to declare.Acknowledgements
The financial support for this work from the Natural Science Foundation of Hubei Province of China (2016CFA013) and the Wuhan Science and Technology Bureau (2016070204020156) is gratefully acknowledged.References
- Z. Mianping, Z. Yongsheng, L. Xifang, Q. Wen, K. Fanjing, N. Zhen, P. Linzhong, H. Xianhua, W. Hailei and Z. Zhen, Acta Geol. Sin., 2016, 90, 1195–1235 CrossRef
.
- I. I. Goncharik, V. V Shevchuk, N. P. Krut’Ko, A. D. Smychnik and O. A. Kudina, Russ. J. Appl. Chem., 2014, 87, 1804–1809 CrossRef
.
- H. Li, Z. Chen and G. Y. Lei, Adv. Mater. Res., 2012, 518–523, 1831–1836 Search PubMed
.
- X. F. Zhao, Z. Q. Wang, J. T. Qiu and Y. Song, Minerals, 2016, 6, 55 CrossRef
.
- J. Xie, X. Liu, W. Pan, C. Cai and Y. Ren, J. Chem. Thermodyn., 2017, 112, 155–165 CrossRef
.
- H. Cheng, H. Ma, Q. Hai, Z. Zhang, L. Xu and G. Ran, Int. J. Miner. Process., 2015, 139, 36–42 CrossRef
.
- H. De Cheng, Q. Y. Hai, H. Z. Ma, X. Y. Zhang, Q. L. Tang, Q. S. Fan, Y. S. Li and W. L. Miao, J. Geochem. Explor., 2016, 165, 189–198 CrossRef
.
- X. Wang, J. D. Miller, F. Cheng and H. Cheng, Miner. Eng., 2014, 66–68, 33–39 CrossRef
.
- G. V. Rao, Encycl. Sep. Sci., 2000, pp. 3491–3500 Search PubMed
.
- E. Li, Z. Du, D. Li and F. Cheng, J. Surfactants Deterg., 2017, 20, 483–491 CrossRef
.
- J. Wang and T. K. Lowenstein, Minerals, 2017, 7, 245 CrossRef
.
- P. Chen, H. Li, H. Yi, F. Jia, L. Yang and S. Song, Sep. Purif. Technol, 2018, 202, 27–33 CrossRef
.
- C. Li and Z. Gao, Powder Technol., 2017, 322, 386–392 CrossRef
.
- J. Wang, Z. Gao, Y. Gao, Y. Hu and W. Sun, Miner. Eng., 2016, 98, 261–263 CrossRef
.
- X. Bu, G. Xie, Y. Peng and Y. Chen, Int. J. Miner. Process., 2016, 157, 175–183 CrossRef
.
- B. Albijanic, N. Subasinghe and C. H. Park, Miner. Eng., 2015, 78, 66–68 CrossRef
.
- S. Kouachi, B. V. Hassas, A. Hassanzadeh, M. S. Çelik and M. Bouhenguel, Colloids Surf., A, 2017, 517, 72–83 CrossRef
.
- P. B. Kowalczuk and J. Zawala, Colloids Surf., A, 2016, 506, 371–377 CrossRef
.
- M. Hancer, M. S. Celik and J. D. Miller, J. Colloid Interface Sci., 2001, 235, 150 CrossRef PubMed
.
- H. Peng and M. Firouzi, Colloids Surf., A, 2018, 538, 703–710 CrossRef
.
- E. Burdukova, J. S. Laskowski and G. R. Forbes, Int. J. Miner. Process, 2009, 93, 34–40 CrossRef
.
- J. S. Laskowski, Miner. Eng., 2013, 45, 170–179 CrossRef
.
- Q. Cao, H. Du, J. D. Miller, X. Wang and F. Cheng, Miner. Eng., 2010, 23, 365–373 CrossRef
.
| This journal is © The Royal Society of Chemistry 2018 |

