DOI:
10.1039/C8RA04164D
(Review Article)
RSC Adv., 2018,
8, 28095-28130
Skin cancer detection using non-invasive techniques
Received
16th May 2018
, Accepted 22nd July 2018
First published on 6th August 2018
Abstract
Skin cancer is the most common form of cancer and is globally rising. Historically, the diagnosis of skin cancers has depended on various conventional techniques which are of an invasive manner. A variety of commercial diagnostic tools and auxiliary techniques are available to detect skin cancer. This article explains in detail the principles and approaches involved for non-invasive skin cancer diagnostic methods such as photography, dermoscopy, sonography, confocal microscopy, Raman spectroscopy, fluorescence spectroscopy, terahertz spectroscopy, optical coherence tomography, the multispectral imaging technique, thermography, electrical bio-impedance, tape stripping and computer-aided analysis. The characteristics of an ideal screening test are outlined, and the authors pose several points for clinicians and scientists to consider in the evaluation of current and future studies of skin cancer detection and diagnosis. This comprehensive review critically analyses the literature associated with the field and summarises the recent updates along with their merits and demerits.
Introduction
Skin cancer is a common type of cancer that emerges from the skin. It is extended due to the development of abnormal growth of cells. These cells can invade other parts of the body. More than 90% of cases occur due to the exposure of UV radiation. The UV radiation wavelength ranges from 100 nm to 400 nm. Cancer occurs due to unrepaired DNA damage to skin cells which is caused mostly due to UV radiation. In melanoma, cancer cells arise from moles on the skin which causes inflammation around the epidermal layer which in turn increases the temperature around it.1
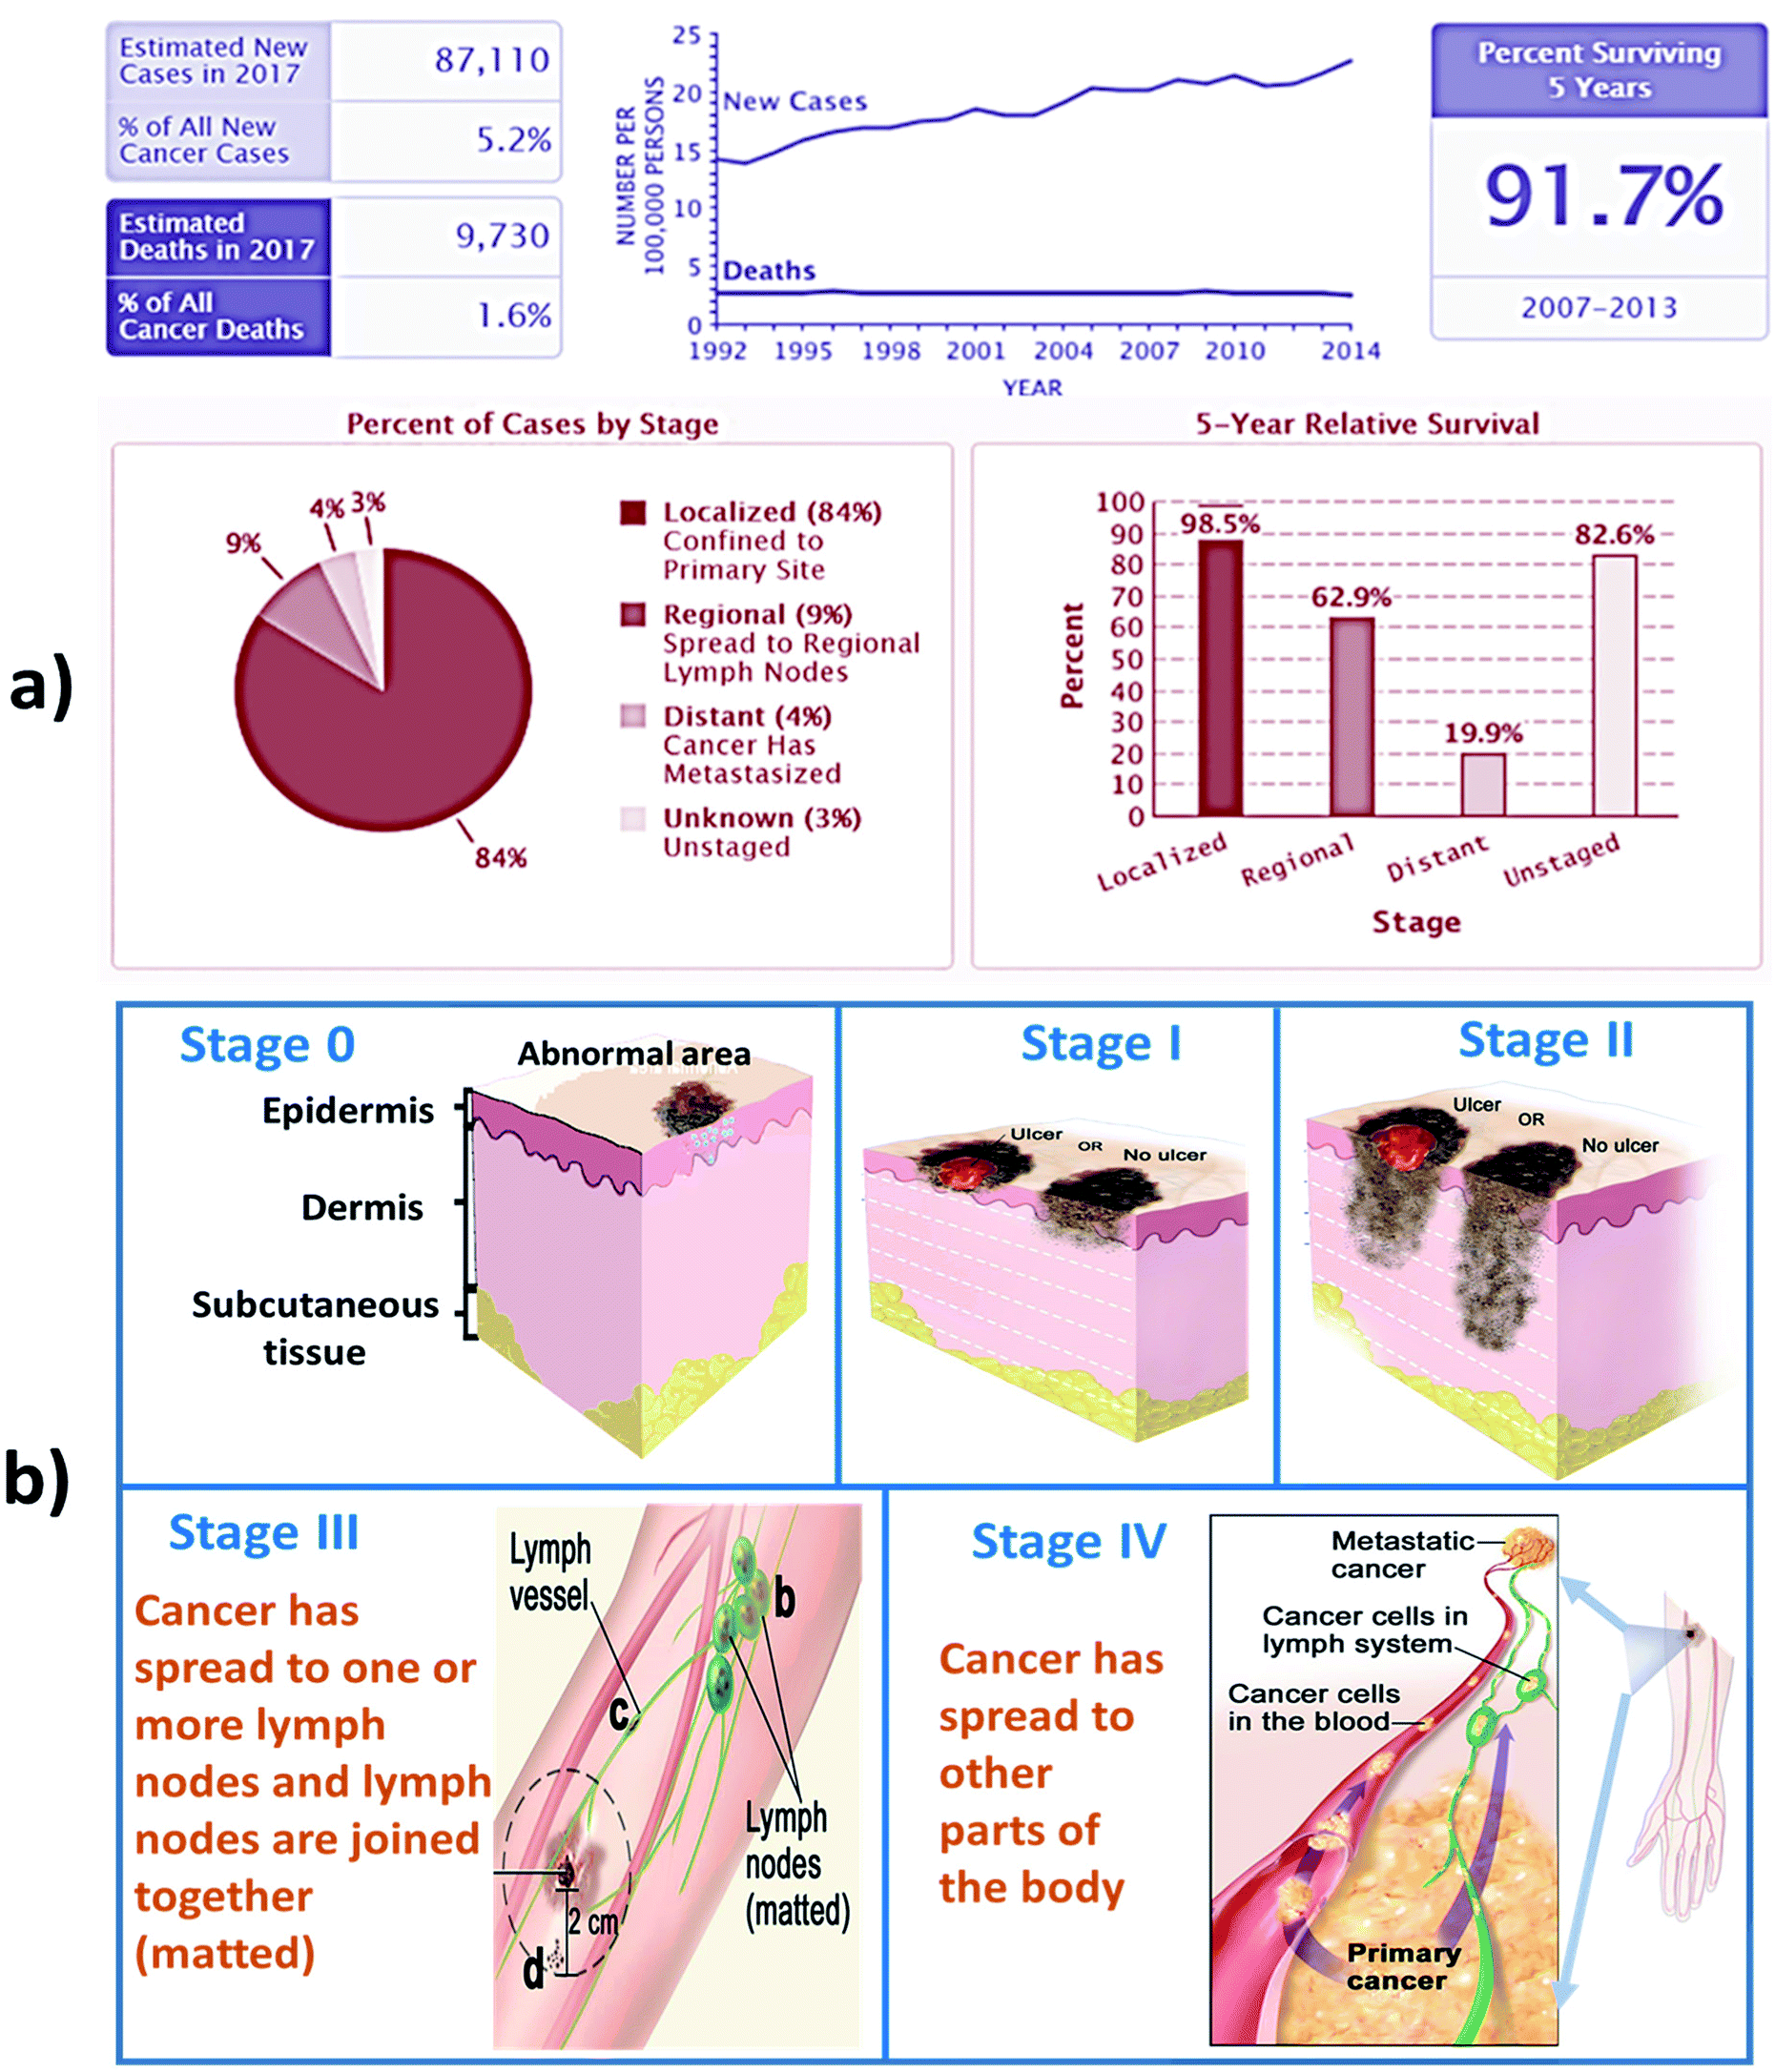
A survey in 2015 found about 17.5 million cancer cases worldwide and 8.7 million deaths occurred due to cancer. As part of the epidemiological transition, cancer incidence is expected to increase in the future, considering limited health care resources. Past statistics and trends are shown in Fig. 1. In 2017, out of 5.4 million cases of non-melanoma skin cancer, only 3.3 million people were treated in the US. Over 87![[thin space (1/6-em)]](https://www.rsc.org/images/entities/char_2009.gif) 110 new cases of melanoma will be diagnosed in the US, but estimation found that 9730 people will die of melanoma due to lack of healthcare resources. About 2 to 4% cases of people are suffering from melanoma skin cancer in India.1 In a report published ten years ago, skin cancer ranked 10th as the most common cancer in Malaysia and accounted for 2.6% of all cancer cases in the country. Melanoma is not very prevalent in Malaysia and occurred in only 5.4% of the patients who attended the dermatology clinic in Hospital Kuala Lumpur, but awareness among them is very less.2 At present, between two and three million non-melanoma skin cancers and 132000 melanoma skin cancers happen globally every year. According to the recent research on skin cancer trends in Asia, it was found that skin cancer rates among the fairer-skinned were approximately three times higher than those who generally have darker complexions. Prevalence rates of skin cancer in Singapore increased from 1968 to 2006, especially among older Chinese.3
110 new cases of melanoma will be diagnosed in the US, but estimation found that 9730 people will die of melanoma due to lack of healthcare resources. About 2 to 4% cases of people are suffering from melanoma skin cancer in India.1 In a report published ten years ago, skin cancer ranked 10th as the most common cancer in Malaysia and accounted for 2.6% of all cancer cases in the country. Melanoma is not very prevalent in Malaysia and occurred in only 5.4% of the patients who attended the dermatology clinic in Hospital Kuala Lumpur, but awareness among them is very less.2 At present, between two and three million non-melanoma skin cancers and 132000 melanoma skin cancers happen globally every year. According to the recent research on skin cancer trends in Asia, it was found that skin cancer rates among the fairer-skinned were approximately three times higher than those who generally have darker complexions. Prevalence rates of skin cancer in Singapore increased from 1968 to 2006, especially among older Chinese.3
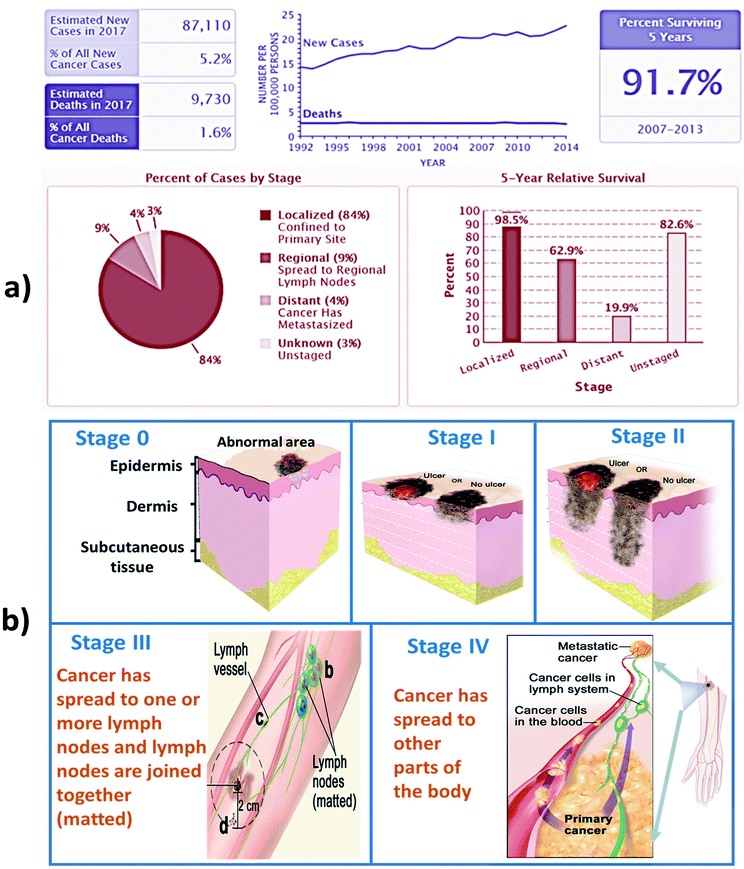 |
| | Fig. 1 shows (a) recent stats and (b) stages of skin cancer. (Data Source: NCI SEER Cancer Stat Facts).7 | |
Classifications of skin cancer
Skin cancer is categorized into three types which are basal cell skin cancer, squamous skin cancer and malignant skin cancer. The first two skin cancers are grouped together as non-melanoma skin cancers. The stages of skin cancer is shown in Fig. 1.4 The features and the treatment involved in each type of cancers are discussed below.
Basal cell skin cancer
Basal cancer cell (BCC) is the least aggressive of non-melanoma skin cancer derived from keratinocytes that resemble epidermal basal cells.5 BCC appears like a flesh coloured pearl likes a bump or a pinkish patch of skin. BCC is due to skin exposure especially found in the sun exposed areas such as the face, head, neck, arms, legs, and abdomen. BCC can spread over the body and grows in nerves and bones. BCC is often known as non-melanoma cancer.6 BCC occurs in at least 2–3 millions of people per year. BCC has low death rate. It can be cured by simple treatment like radiation therapy and tropical medications such as fluorouracil.
Squamous cell carcinoma
Squamous cancer cell (SCC) is the cancer of keratinocyte cells found on the outer surface of the skin. It appears like a red firm bumps scaly patches. It is caused due to over sun exposure. It is more commonly found in people who have pale light skin. It is mainly found in the regions like ear, face, neck, chest, and back. More than 1 million of people were affected due to SCC and 80000 people died. In past three decades, there is huge increase in SCC among the US. The death rate of SCC is higher than BCC but comparatively lower than melanoma. BCC and SCC carry the ultraviolet radiation and damage the DNA directly. SCC results in ulceration and ends up with bleeding disorders. It should be treated at the earlier stage else it will grow in the dense amount in the body. SCC is characterized by proliferation of invasive squamous cells which are able to invade other tissues. It can be treated by photodynamic therapy, tropical chemotherapy, and curettage and electrodessication. SCC is the second common cancer in the world. It is not dangerous than that of melanoma.4,8
Malignant melanoma
Melanoma arises from melanocytes, specialized pigmented cells that are found abundantly in basal layer of epidermis.9 Malignant melanoma consist of four major histological subtypes frequently reported namely superficial spreading melanoma (70%), nodular melanoma (15%), lentigo maligna melanoma (13%), and acral lentiginous melanoma (2–3%).10 Melanoma is usually observed as a dark spot on the epidermal (outer) layer of the skin. It is the fast-growing cancer cells that have the ability to spread over the surrounding tissue of the body. The malignant melanoma is caused due to UV radiation and damages the DNA indirectly. The free radical and the reactive oxygen species are the two leading causes of DNA damage. Research indicates that intentness of sunscreen components into the skin, conjugate with 60 min exposure to UV leads to the increase of free radical in the skin.8 Globally in 2012 malignant melanoma occurred among 232000 people, and 55000 people have died.11 Malignant melanoma is the deadliest cancer, but it can be cured at early stages of cancer. It is normally treated with chemotherapy, targeted therapy, and radiation therapy.
Detection of skin cancer in the early stage is useful in treating the condition very quickly. Detection systems pave the way for the diagnosis, but the result was not that precise comparing to biopsy test which is an invasive method. Along with the cost involved, the after-effects of biopsy include severe infectious problem around the punctured area. If the condition found to be more severe in the biopsy test, then surgery is performed, this adds to the cost along with the complexities. Other methods like radiotherapy, chemotherapy and drug therapy can be given, but the loss of hair and sittings often makes the patient to the worst condition. By taking into account all these points, many sensors are fabricated and designed to detect the skin cancer in a non-invasive manner, unlike biopsy. In this comprehensive review article, the recent non-invasive approaches involved in skin cancer detections are summarised.
Literature search performed
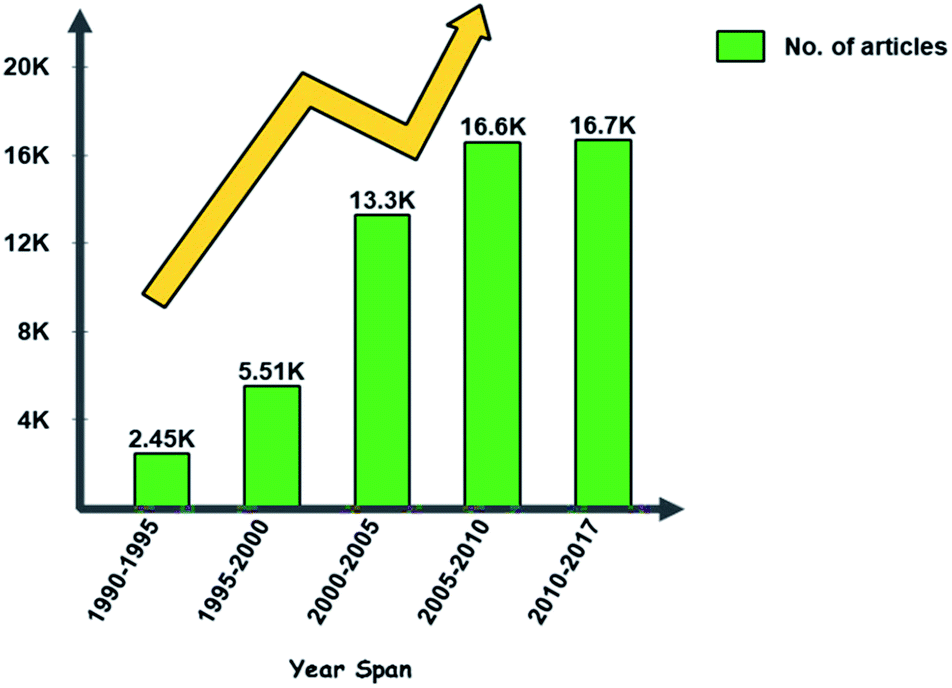
The literature search was performed using Google Scholar. The search was carried out for the keywords “Skin cancer, detection techniques, diagnosis, non-invasive” for the time span of 1990–2017. From the search, relevant articles were presented, and some articles were chosen based on the pertinence. Publication trends over the years are shown in Fig. 2. This review article will be promising for researchers who plan to explore further this field.
 |
| | Fig. 2 Publication trends over the years for skin cancer articles. | |
Skin cancer detection and diagnosis
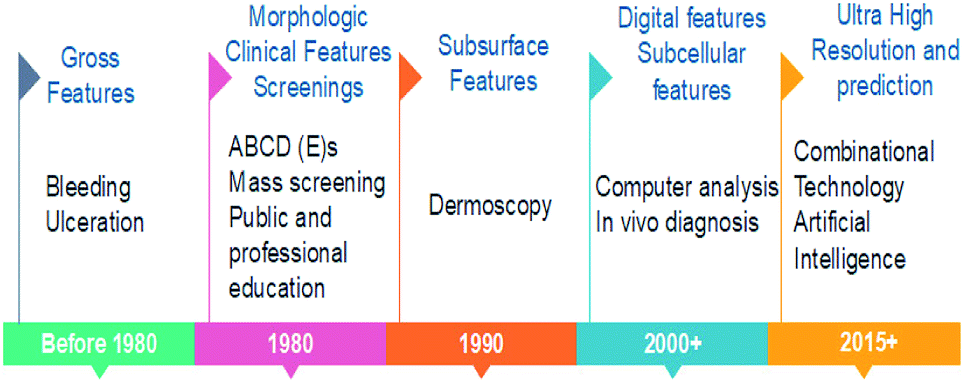
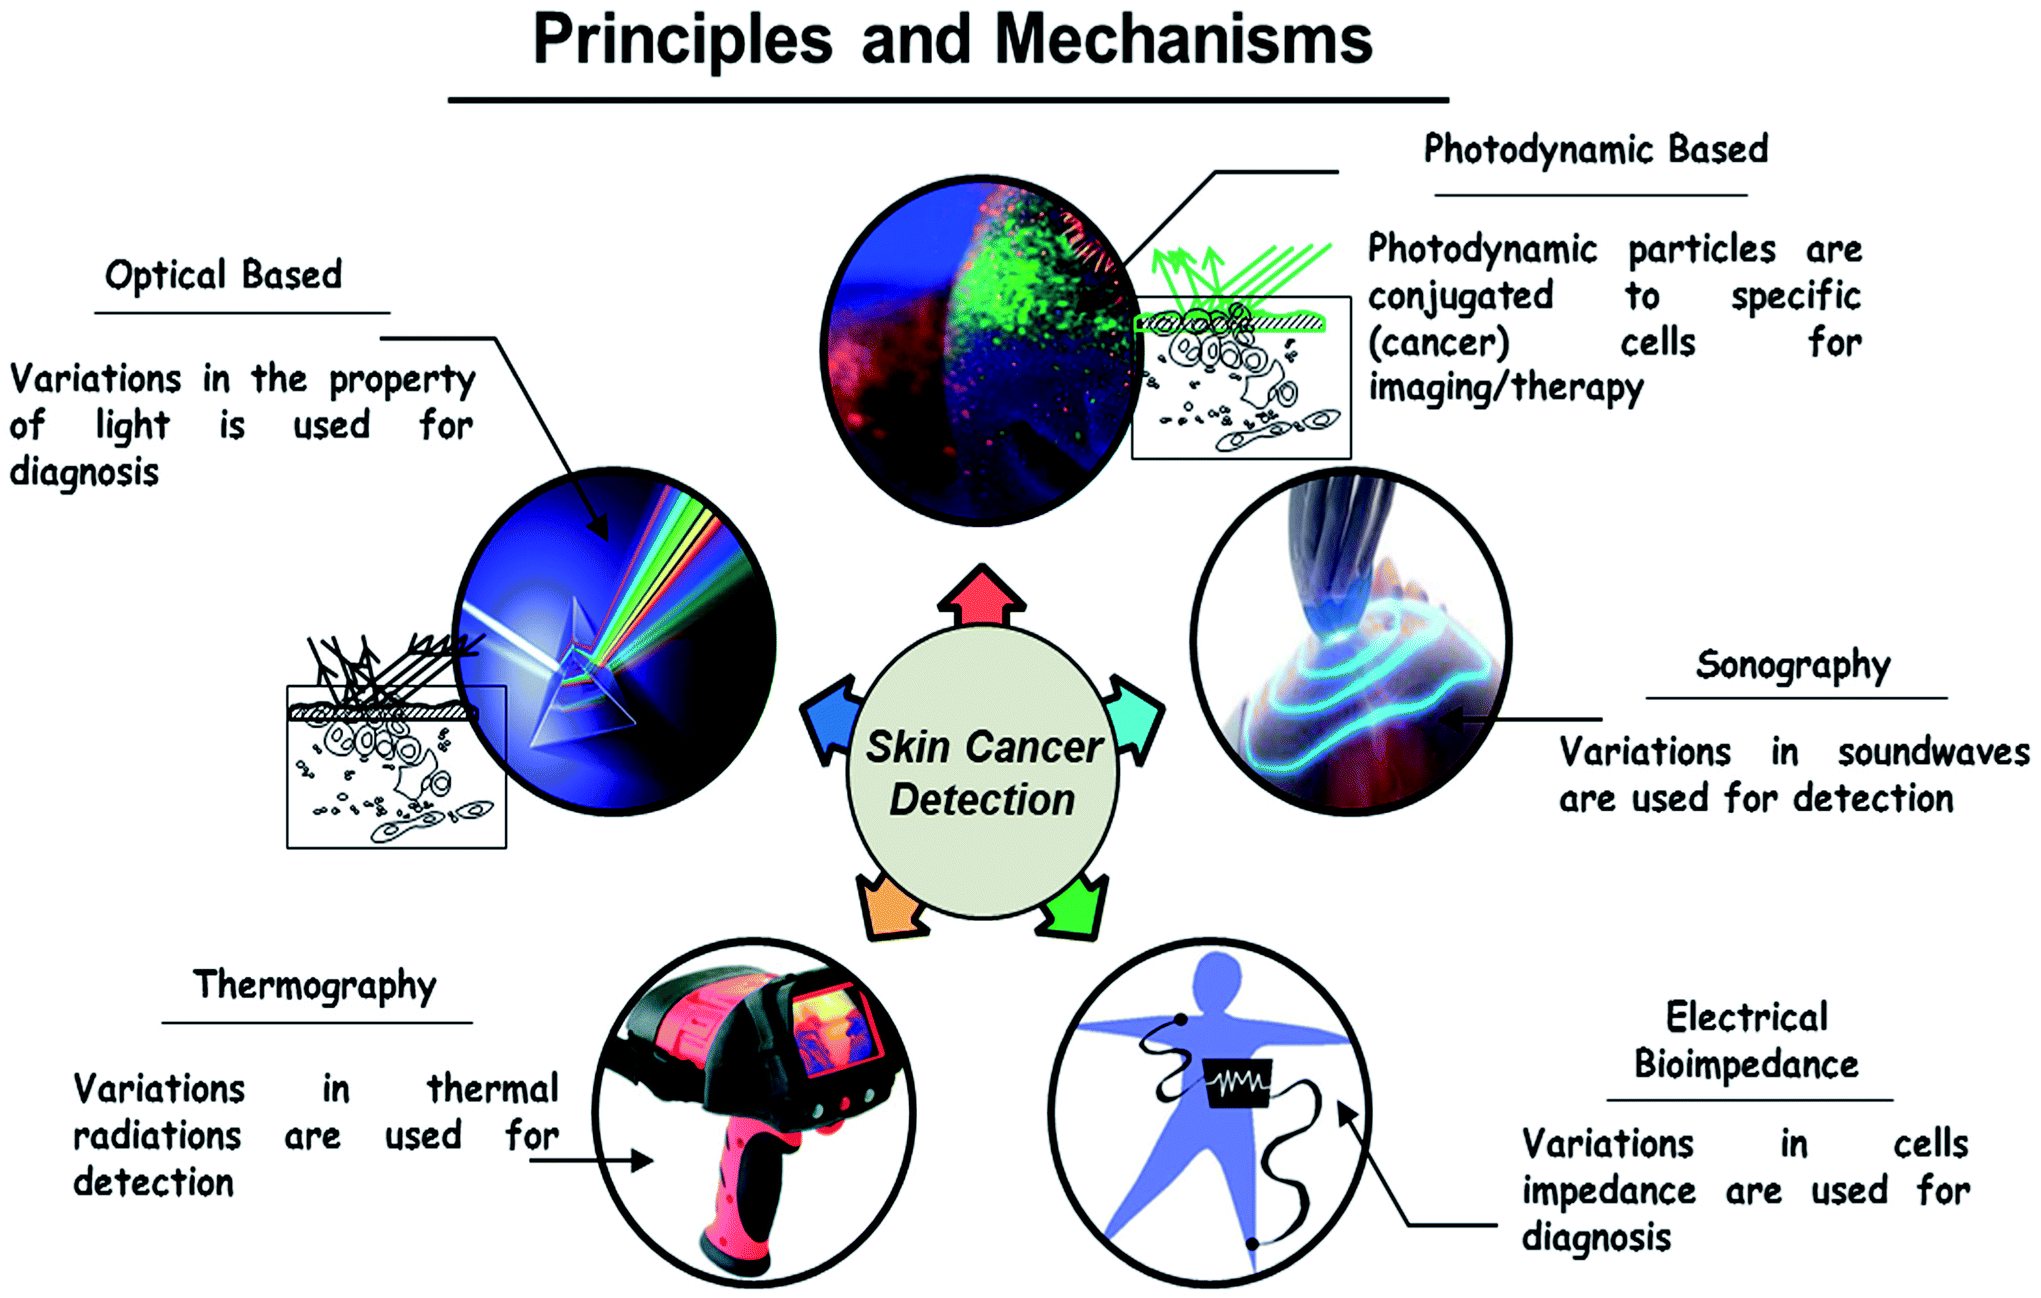
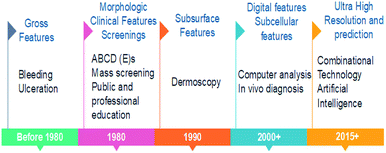
Fig. 3 shows the road map of skin cancer diagnosis over the years. In this section briefly explained about the principle and detection mechanisms involved in skin cancer diagnosis as shown in Fig. 4. Along with that presented the currently practiced skin cancer diagnosis methods and techniques.12
 |
| | Fig. 3 Roadmap of skin cancer diagnosis. | |
 |
| | Fig. 4 Principles and mechanisms for skin cancer detection. | |
Principles and mechanisms involved
Optical.
When the light is passed into the tissues, the light gets scattered within the tissues of the skin. The change in the property of the reflected light is used for diagnosis.13 Advanced biochemical markers are also developed with respect to cancerous tissue and specific wavelengths are used to enhance the contrast of the tissue by absorbing light.14,15
Photodynamic based.
In order to detect the presence of tumor cells, a photosensitive marker is introduced into the particular area. Protoporphyrin IX is formed as a result of chemical reactions inside the body, which is absorbed by the healthy cells but gets accumulated in the tumour cells. When the resectoscope is introduced into the area, under blue illumination the accumulated pigment in the tumour cells emit red fluorescence and normal cells will be in blue. To provide contrast for photodynamic diagnosis (PDD) yellow-light filter is specially designed which enhances the red fluorescence. Skin lesions using photodynamic diagnosis are based on the fluorescent properties of an exogenous and endogenous compound in response to illumination. Stimulation of photosensitizers is made to produce the photodynamic effect when a certain wavelength of light is exposed to it.12,16
Sonography.
Sound waves are used in this approach. After transmitting sound pulses into the body, some of the sound waves get reflected back to the probe, while some travel on farther until they arrive another boundary and get reflected. The reflected waves are sensed by the probe and relayed to the machine. The changes in the property of sound waves are used in this technique. Sonography is used to assess skin lesion depth and margins before doing the biopsy and also used to classify adjacent lymph nodes whether it has become cancerous or not. This is added to a patient's protocol to clarify lesion depth, identify margins for excision, and determine lymph node. It has the ability to differentiate benign from malignant skin cancer. It is used to identify metastatic lymph nodes visually, which avoids unnecessary removal of lymph nodes. The main advantage is that it gives the accurate results of measuring skin cancer lesion thickness.17
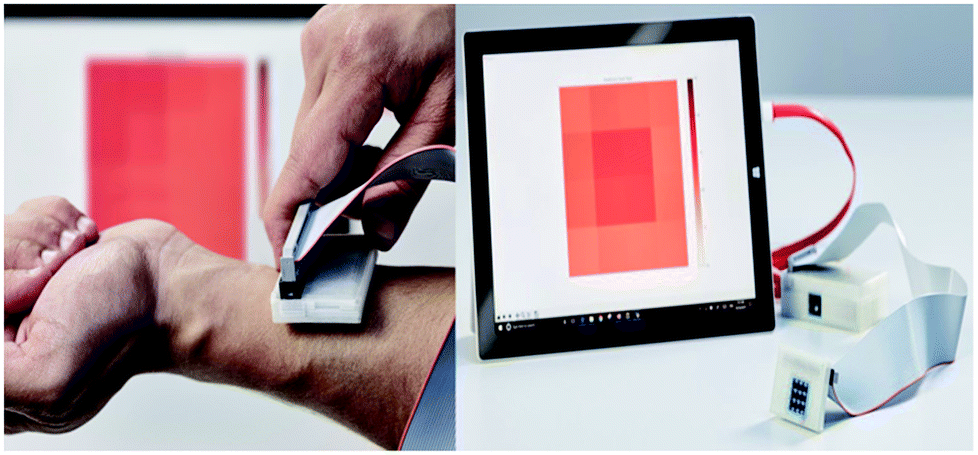
Electrical bio-impedance.
The electrical impedance of skin, when measured by topical application of electrodes, is dominated by the high resistance of the stratum corneum. Changes in stratum corneum hydration or structure can be followed by electrical measurements at low frequency. Stratum corneum must be bypassed to measure the living epidermis and dermis. Direct contacts of microneedles on stratum corneum penetrate and measure the electrical activity underlying the skin.18
Thermal imaging.
Thermography is based on the phenomenon that any object of a temperature above absolute zero emits electromagnetic radiation. There is a definite relationship between the surface of a body and the intensity and spectral composition of its emitted radiation. By determining its radiation intensity, the temperature of an object can thereby be determined in a non-contact way. The human skin is a thermal interface with the human environment. Temperature distribution on the skin will be emitted in the infrared band that is useful in imaging the thermal distribution. Infrared cameras are used in clinical medicine to map the thermal distribution in the human body. Stress is applied to the imaging region so that the liquid crystal plate directly over the body make useful in capturing the image. Thermal imaging can also be performed in a non-contact manner through the infrared camera of high sensitivity. Comparing to other techniques which have false negative reports at a high probability, thermography provides high accuracy.19
Techniques and methods
Photography
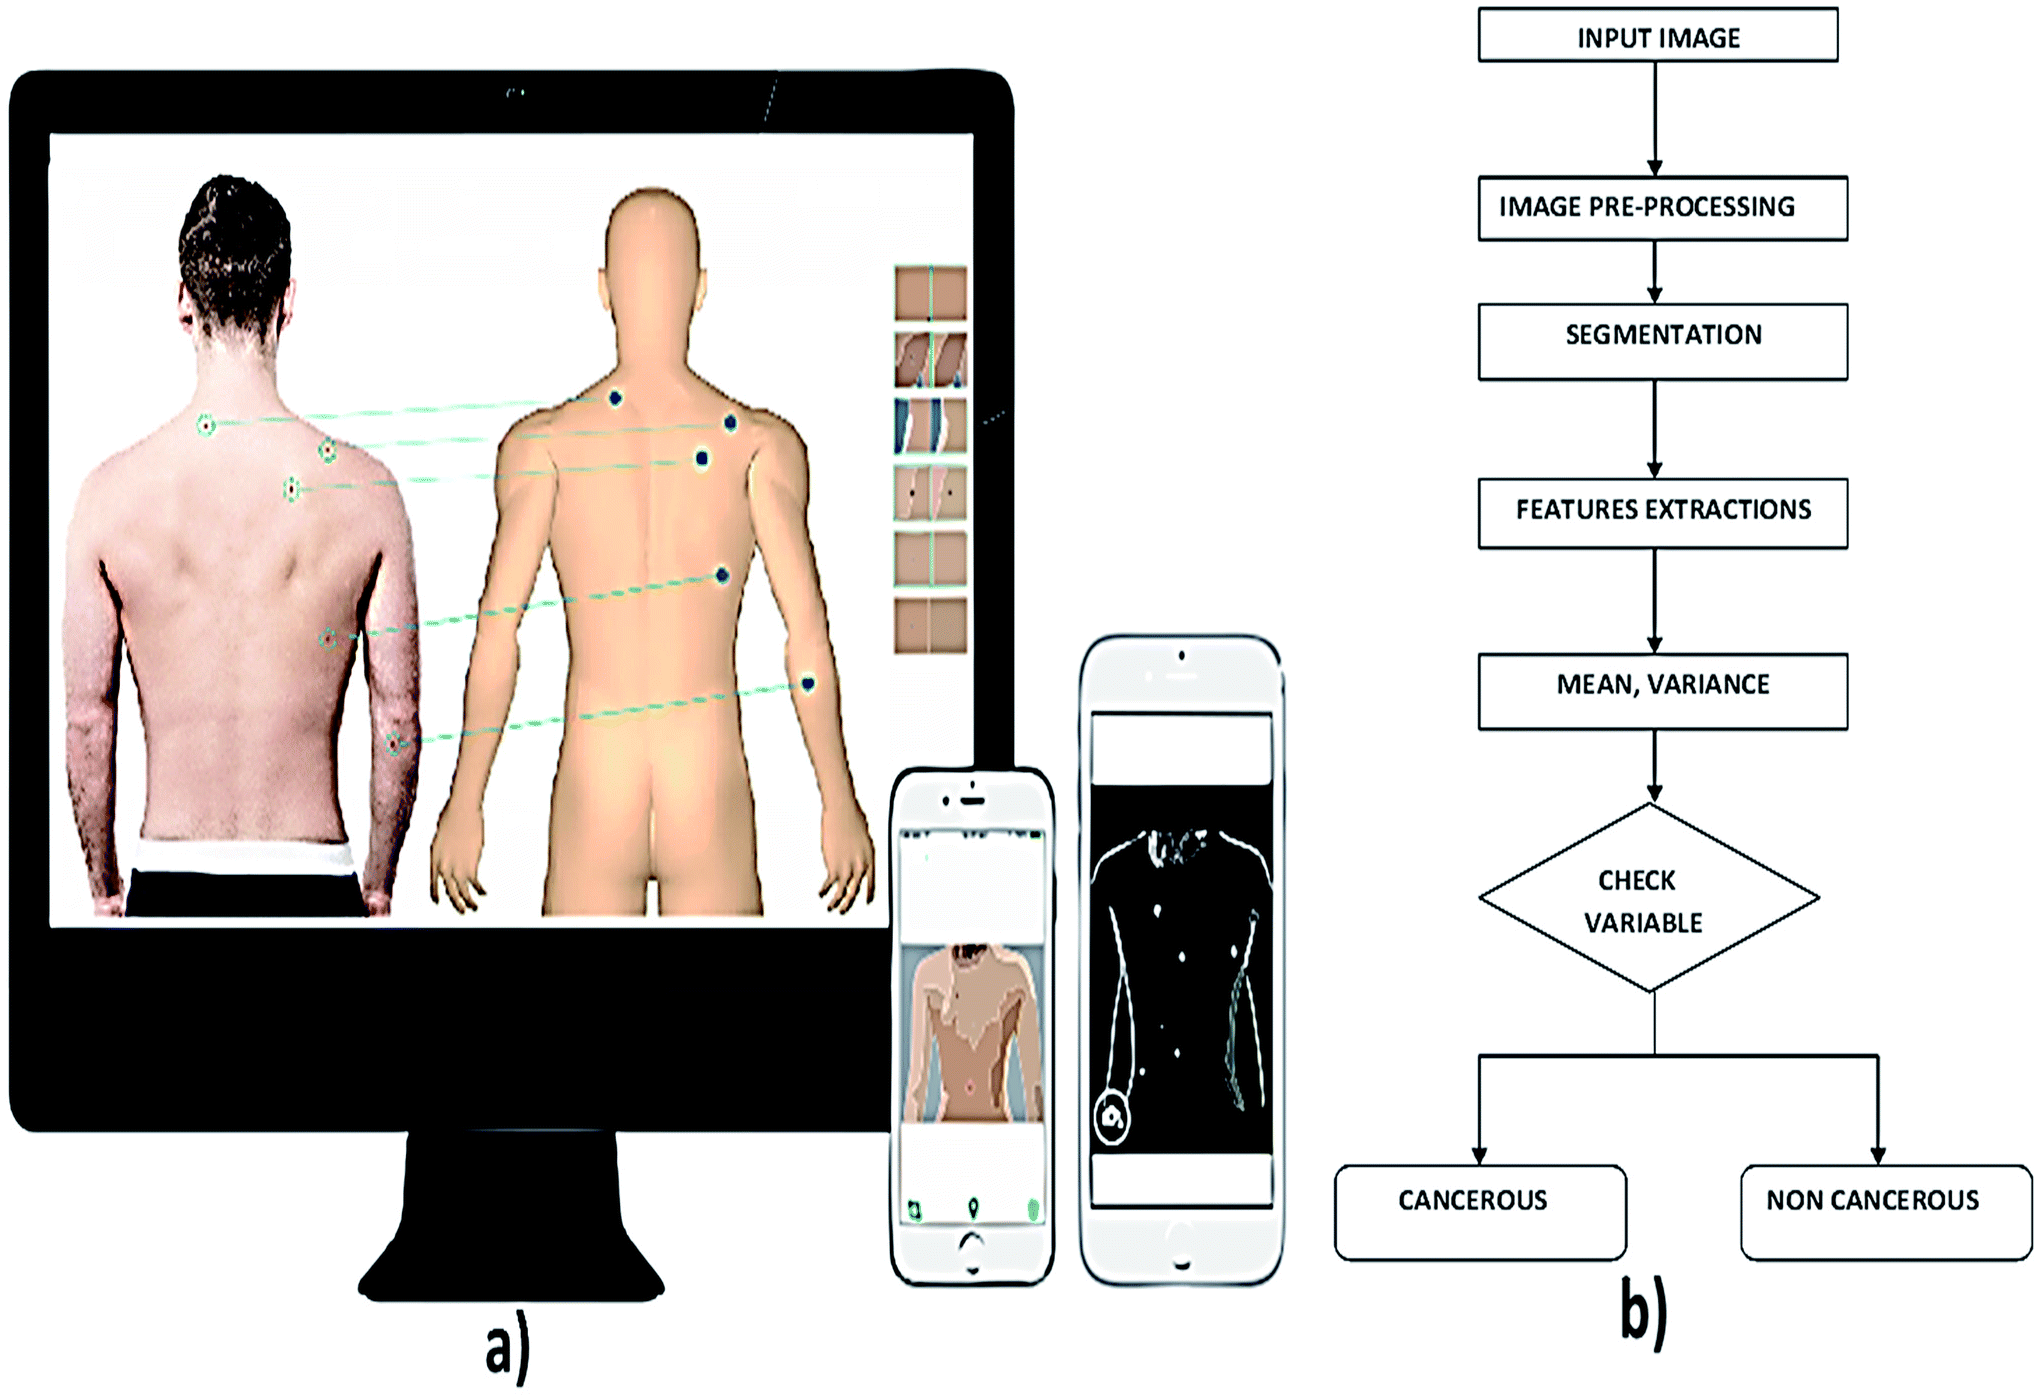
Total Body Photography (TBP) is also known as mole mapping which is used to identify patients with numerous nevi and changes in the lesions during regular skin examinations.20 TBP uses the digital camera for recording and storing the images as shown in Fig. 5. Using a high-resolution, professional medium-format camera, images are taken from the subjects by implementing the camera at different poses and position of the subject to get accurate results.21 Once the image is taken, it is digitally processed using mirror body mapping software. Sum of all the images is analyzed using this software. The software later generates an interactive, stand-alone program (DermaGraphix)22 containing the patient's body map. This stand-alone DermaGraphix body map, which is given to the patient using USB 2.0, tier 1 thumb drive.23 This system can also be performed at home by oneself, but the cost of equipment is high.24
 |
| | Fig. 5 (a) Illustrates the total body imaging using photographic devices and (b) shows general steps in image processing technique for skin cancer diagnosis. Reproduced under CC license form ref. 43. | |
Lynn T. Dengel, Gina R. Petroni and Craig L. Slingluff et al. had a significant finding of photography method in screening of skin cancer, but it is not used widely used due to time and cost.20 In this technique, captured the surface images of the skin to identify suspicious and pigmented lesions in high-risk patients primarily. Image processing algorithms are applied to the captured images for detecting any abnormalities in the skin. The segmentation technique which is used to detect the skin lesion is classified as region-based segmentation and neural edge detection. In region-based segmentation method, the optimal threshold is determined iteratively by an isodata algorithm. In neural network edge detection, an approximate closed elastic curve between the recognized neural network edge patterns is fitted.25
Computer-aided decision tools are essential in medical imaging for diagnosis and evaluation of various diseases.26 The acquired image from the subject using high-resolution camera is pre-processed to reduce the artefacts. To overcome the artefacts like the presence of hair in the image, mean, median, Gaussian and anisotropic filters are employed. It is followed by the detection of the lesion by image segmentation technique that partition the image into disjoint areas that are homogeneous concerning a chosen property such as luminance, colour, and texture. Next process is feature extraction.27 The extraction process takes by ABCD rule that checks the symmetrical, border, colour, and the diameter of the acquired image. Once the lesion is localized, different chromatic and morphological features can be quantified and used for classification.28 In the classification part, bringing out the algorithm in the examination process combines visual processing with deep learning.29 In deep learning, the computer is trained to figure out a problem rather than having the answers programmed into it.
The computer-aided technique is used to segment the melanocytes in the images taken from the skin. This segmentation is made mostly to reduce the local intensity variant. The mean-shift algorithm is adapted.30 The digital images of melanoma skin lesions can provide information about the skin cancer at an early stage without performing any skin biopsies.31 The mathematical morphology has been used for segmentation for proper identification of skin lesion area. Using TBP, different shape, texture and colour features are extracted and malignant melanomas have been classified sensitively.32 Delaunay triangulation is a technique used to extract a binary mask of the lesion region, which doesn't require any training. This is highly accurate when dealing with benign lesions, while the segmentation accuracy significantly decreases when melanoma images are processed. Geometrical and colour features were extracted from the binary masks generated by the algorithm for classification, which gives accurate results for melanoma detection.33
Computer-aided diagnosis extended its framework for the detection of skin cancer in recent years. The detection of melanoma skin cancer in the early stage will be very useful to cure it and safeguard the life of the affected individuals. Authors Abdul Jaleel, Sibi Salim, R. B. Aswin et al. found that based on imaging techniques and artificial intelligence the result of computer-aided detection of skin cancer is based.34 Computer vision plays a vital role in medical image diagnosis. Reported the computer-aided diagnosis for the pigmentations of skin lesions to determine the presence of skin cancer by performing the boundary detection.35 Skin lesions can also be analysed by qualification of degree of symmetry. The other paper explains that melanoma can be diagnosed by wavelet and texture analysis.36 The texture features were derived from the wavelet decomposition and the border features were collected from the lesions borders and the selections of such features were collected by using the gain-ratio method. That was computationally efficient for the melanoma diagnosis. In recent years, computer-aided diagnosis extended its framework in mobile technologies and in cloud platforms. By this method, the system can able to classify the lesions by identifying the moles in skin images and classify them accordingly as melanoma, benign and nevus lesions.37 Computer diagnosis can also be used as a preventive tool in the detection of skin cancer via mobile phone applications. By using this technique, the melanocytes can be separated from the histopathological images.38
Smartphone plays an active role in medical diagnostic of skin cancer by considering the sensitivity, specificity etc. The non-clinician users can easily differentiate the malignant and benign tumours.39 Through the computer-aided method, the patients can identify the skin cancer without going to the hospital.40 Computer-aided diagnosis can be carried out in the field of image processing, pre-processing, feature extraction, segmentation and classification of demographics images.34 Computer-aided melanoma diagnosis is used to provide the support to the physicians in enhancing the sensitivity and specificity in the diagnosis of melanoma condition. To capture the images of skin lesions, optoelectronic probe were used.41 One of the articles reveals that computer-aided diagnosis can be used to detect the early stage of melanoma by applying the image processing technique. Images can be analysed based on ABCD technique which involves asymmetry, border, colour, diameter etc. From the skin lesion images, the above parameters were collected by considering the texture, size and shape of the image.26 These features were extracted from the images and it was further processed for image segmentation. The extracted features were used to distinguish the normal skin and the melanoma cancer lesions as shown in Fig. 5b. The other methods deal with the image processing in which the images of the affected areas are captured by using the camera of the mobile phone by moving the diffraction grating. Thus the skin cancer can be diagnosed.42 Recent updates on photography techniques for skin cancer diagnosis are summarised in Table 1.
Table 1 Recent reports on photography based techniques for skin cancer diagnosis
| S. no. |
Description |
Upside |
Downside |
Accuracy, sensitivity, specificity |
Ref. |
| 1 |
Optical threshold is determined in region based segmentation, whereas an approximate closed elastic curve between the recognized neural network edge patterns is determined in neural network edge detection |
Best performance for lesions with a range of different border irregularity |
Iterative thresholding technique is required |
— |
25
|
| 2 |
Different digital images have been analyzed based on unsupervised segmentation techniques followed by feature extraction techniques |
— |
Provides erroneous results if not all analysis carried out accordingly |
Accuracy (Acc): 0.9748, sensitivity (Se): 0.8624, specificity (Sp): 0.9857 |
31
|
| 3 |
The mathematical morphology is used for segmenting the skin lesion in this method |
Identification of skin lesion is clear |
High cost and consume more time |
Se: 85.71% |
32
|
| 4 |
Delaunay triangulation is an accurate process for detecting the benign lesions, doesn't require training. Extraction of binary mask of the lesion is made |
Accuracy level is high |
Time consumption is more |
Se: 93.5%, Sp: 87.1% |
33
|
| 5 |
Polarized light is used for illumination and found that if plane of polarization is parallel then enhanced image is obtained if the plane of polarization is perpendicular then wrinkles or surface details disappear |
Patient worry is reduced |
Consumes more time |
—
|
44
|
| 6 |
Smallest lesion of 1 mm is detected using photography technique and differentiation of melanoma and non-melanoma is detected using high resolution camera |
Thinner melanomas are detected |
Cost is high |
—
|
24
|
| 7 |
Lower melanoma site region is detected using digital photography |
Patient self-screening can be done |
Cost is high |
—
|
45
|
| 8 |
Pigmented lesion in the human body is detected using TBP which is useful in detecting the early stages of melanoma |
Minute lesions can be differentiated using this technique |
Instrumentation set up covers larger area |
—
|
46
|
| 9 |
Incipient melanoma is detected using combination of both dermoscopy and photography in which accuracy of result is obtained |
Not only detects the macroscopic changes and also the detection of dermatoscopic changes over time |
Considerable proportion of melanomas misclassified as benign |
—
|
47
|
| 10 |
Melanoma is detected in the initial growth stage itself with diameter of >6 mm and baseline images were obtained |
— |
Cost is high |
—
|
48
|
| 11 |
Found that combination of total body examination, TBP and dermoscopy provides accurate result in detecting the early stage of melanoma |
High resolution and sensitivity |
Cost is high |
—
|
49
|
Dermoscopy
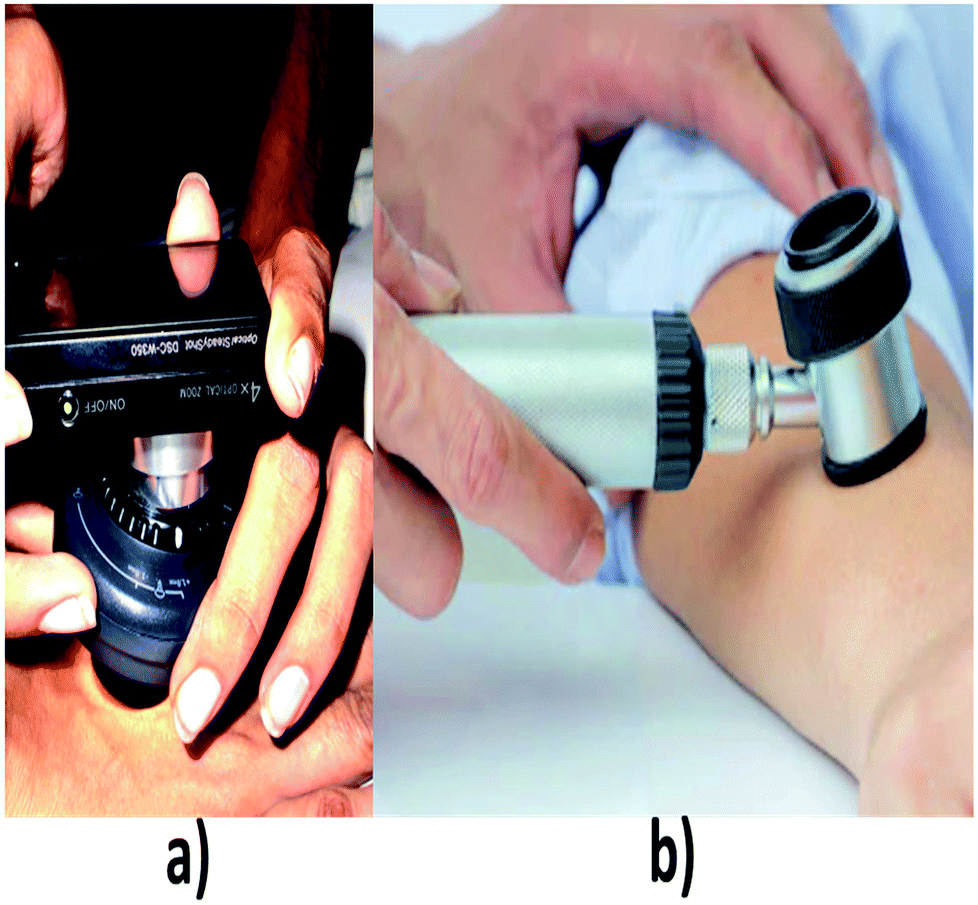
Dermoscopy is also known as dermatoscopy or epiluminescence microscopy that is useful in examining the skin lesions.50 Conventional instrumental set up for dermatoscopy includes a magnifier (×10), a non-polarised light source, a transparent plate and a liquid medium between the device and the skin so that skin reflections can be avoided. Modern dermoscope as shown in Fig. 6, do not use this liquid medium; instead, it uses polarised light that eliminates the skin reflection.51 From this method, the non-cancerous and cancerous condition can be known. Basically, this dermoscope operates under three modes, first is, non-polarised in a contact manner, second is polarised light in a contact manner then the third mode is polarised light in a non-contact manner. The main advantage of using polarized light is, it provides better visualization in deeper skin structures whereas for non-polarized the information will be only on the superficial layer of skin.52 In this system, the accuracy level is increased based on the experience of the clinician.53
 |
| | Fig. 6 (a) and (b) shows different types of dermoscopes. (a) Reproduced under CC license from ref. 71. | |
Dermoscopy shows subsurface structures of the skin with the use of handheld devices that extend optical light ray penetration beyond the skin surface and minimize surface reflection. In contrast, naked eye examination limits visualization of certain skin structures because the stratum corneum has reflective properties. Dermoscopy plays an important role in the diagnosis of skin cancer. It has higher discriminating power than a clinical analysis. The report made by Marie-Lise Bafounta, Alain Beauchet, Philippe Aegerter, on the diagnosis of melanoma skin cancer shown that sensitivity and the specificity54 obtained by dermoscopy techniques were comparatively higher than clinical analysis. Skin lesion on the face was usually diagnosed by comparing the dermoscopic features of lentigo senilis and lentigo malinga55 based on logistic regression method. Dermoscopy plays a crucial role in distinguishing the melanoma cells from benign cells with the help of various diagnostic tools56 such as pattern analysis, ABCD rule, Menzies method, and 7-point checklist. The dermoscopic studies were made on 20 pigmented skin lesions57 based on the pattern analysis and the results were found to be more accurate. Dermoscopy techniques are used to analyze the vascular structure58 of melanocytic and non-melanocytic tumors based on their morphological behaviour of the skin. Dermoscopy extends its application in early diagnosis of malignant melanoma and differential59 diagnosis of pigmented lesions of the skin by in vivo methods. The study was made on 2522 skin cancer subjects60 based upon the accuracy rate, dermoscopy techniques showed better results than conventional technique, but the main drawback of this technique is that it requires a high-resolution camera to capture the images of skin lesions.
Boundary detection technique which uses gradient vector flow for detecting the boundary is explained. The initialization method is automatic which makes the skin lesion border determination fully automated.61 The unsupervised approach for skin lesion images based on modified version of JSEG algorithm for detecting the border is used. The border detection error is quantified by a metric which uses manually determined borders by the dermatologist.62 An approach which is based on detecting the border using statistical region merging algorithm is reported. The border detection error is quantified by a metric which has three sets of dermatologist determined border as the base. This method is compared with four states of automated methods.63 A new method to detect and visualize the pigment network structures in the images already extracted has been reported. This detection is based on the automatic detection of the edges of pigment network structure which forms cyclic graphs. The extracted image is first pre-processed which gives the binary image; the binary image is then converted into graph and cyclic subgraphs which corresponds to the skin texture. These cyclic subgraphs are filtered to remove round structures.64 The mobile application uses the image processing technique for the prevention of melanoma. This system comprises of a microscope and a smartphone. The microscope is to image the area of skin, whereas smartphone is to get the output.65 The artefact is removed, and the borders of the lesion are detected by using border detection technique in the captured images.39
Dermoscopy also employed in the diagnosis of melanoma condition in pregnant women. The study was made on 35 pregnant women66 and the results showed that the pregnancy leads to significant modifications in pigmented skin lesions. Border detection67 method was used in dermoscopy techniques to enhance the accuracy level of the diagnosis of skin cancer. Mostly for non-melanoma68 skin cancer such as SCC and BCC are diagnosed by dermoscopic methods due to its high resolution. Using dermoscopy, the irregular streaks in melanoma can be detected by performing a three-way classification of streaks which involves regular, absent and irregular in a pigmented skin lesions.69 Esteva et al., employed the deep convolutional neural network to classify melanoma and non-melanoma skin cancer.70 Latest reports on dermoscopy techniques for skin cancer diagnosis are summarised in Table 2.
Table 2 Recent reports on dermoscopy techniques for skin cancer diagnosis
| S. no. |
Description |
Upside |
Downside |
Acc, Se, Sp |
Ref. |
| 1 |
Dermoscopy significantly has higher discriminating power than the clinical analysis. The sensitivity and the specificity ranges obtained from diagnosis of melanoma were found to be 0.75 to 0.96 and 0.79 to 0.98 respectively |
More accurate than clinical examination for the diagnosis of melanoma in a pigmented skin lesion |
Requires experience for better diagnosis |
Se: 0.75–0.96 and Sp: 0.79–0.9 |
54
|
| 2 |
Compared the dermatoscopic features of lento senilis and lentigo malinga on the face by using logistic regression analysis |
Analysis is easy |
Resolution is low |
Se: 93.8% and Sp: 52.3% |
55
|
| 3 |
Dermoscopic images of the skin lesions were analyzed using 2-step diagnostic methods |
Good computational capability |
Various algorithms are needed |
Se: 64.8% and Sp: 72.8% |
56
|
| 4 |
Dermoscopic images of 20 pigmented skin lesions were evaluated based upon the menzie's method and ABCD rule and pattern analysis. It was found that results of pattern analysis were comparatively more accurate than any other methods |
Web-based training is an effective tool for teaching dermoscopy |
Involves training of practioners |
Acc: 62.8% |
57
|
| 5 |
The vascular structure of melanocytic and non-melanocytic skin tumours were evaluated based upon the morphological features |
High resolution |
Analysis of distinctive vascular structures is required |
Se: 81.1% |
58
|
| 6 |
Dermoscopy helps in early diagnosis of melanoma cancer by in vivo methods |
Early diagnosis of melanoma |
Resolution is low |
Acc: 5% to 30% |
59
|
| 7 |
Primary physicians made study on 2522 skin cancer subjects and the accuracy level were compared with the existing system |
Improves the ability of physicians to triage lesions suggestive of skin cancer |
Involves physician training, algorithm and expert consultation |
Se: 54.1%, Sp: 71.3% |
60
|
| 8 |
The studies were made on 35 healthy pregnant women and 35 age-matched female controls. The analysis showed that the pregnancy leads to significant modifications in PSL, especially with respect to globules, pigment network, and architectural order or disorder |
Local intensity variant is done |
Consumes more time to diagnosis the cancer |
Se: 79.3%, Sp: 93.18% |
66
|
| 9 |
In this method, the dermoscopic images obtained from the subject were analyzed based on border detection |
Fast and accurate border detection |
Requires a series of process algorithms |
— |
62
|
| 10 |
Through the dermosccpy technique the non-melanoma skin cancer were detected and the accuracy was high |
Identification of skin lesion is clear |
Only detects the non-melanoma cancer. |
— |
68
|
| 11 |
In dermoscopic images, the diagnosis of melanoma can be easily identified by irregular streaks |
Accuracy level is high |
Only includes the analysis of irregular streaks |
Acc: 76.1% |
69
|
| 12 |
Demonstrated the classification of skin lesions using a single deep convolutional neural network (CNN), trained end-to-end from images directly, using only pixels and disease labels as inputs |
The CNN achieves performance on par with all tested experts |
Involves CNN computing platform |
Acc: 72.1 ± 0.9% |
70
|
Ultrasound
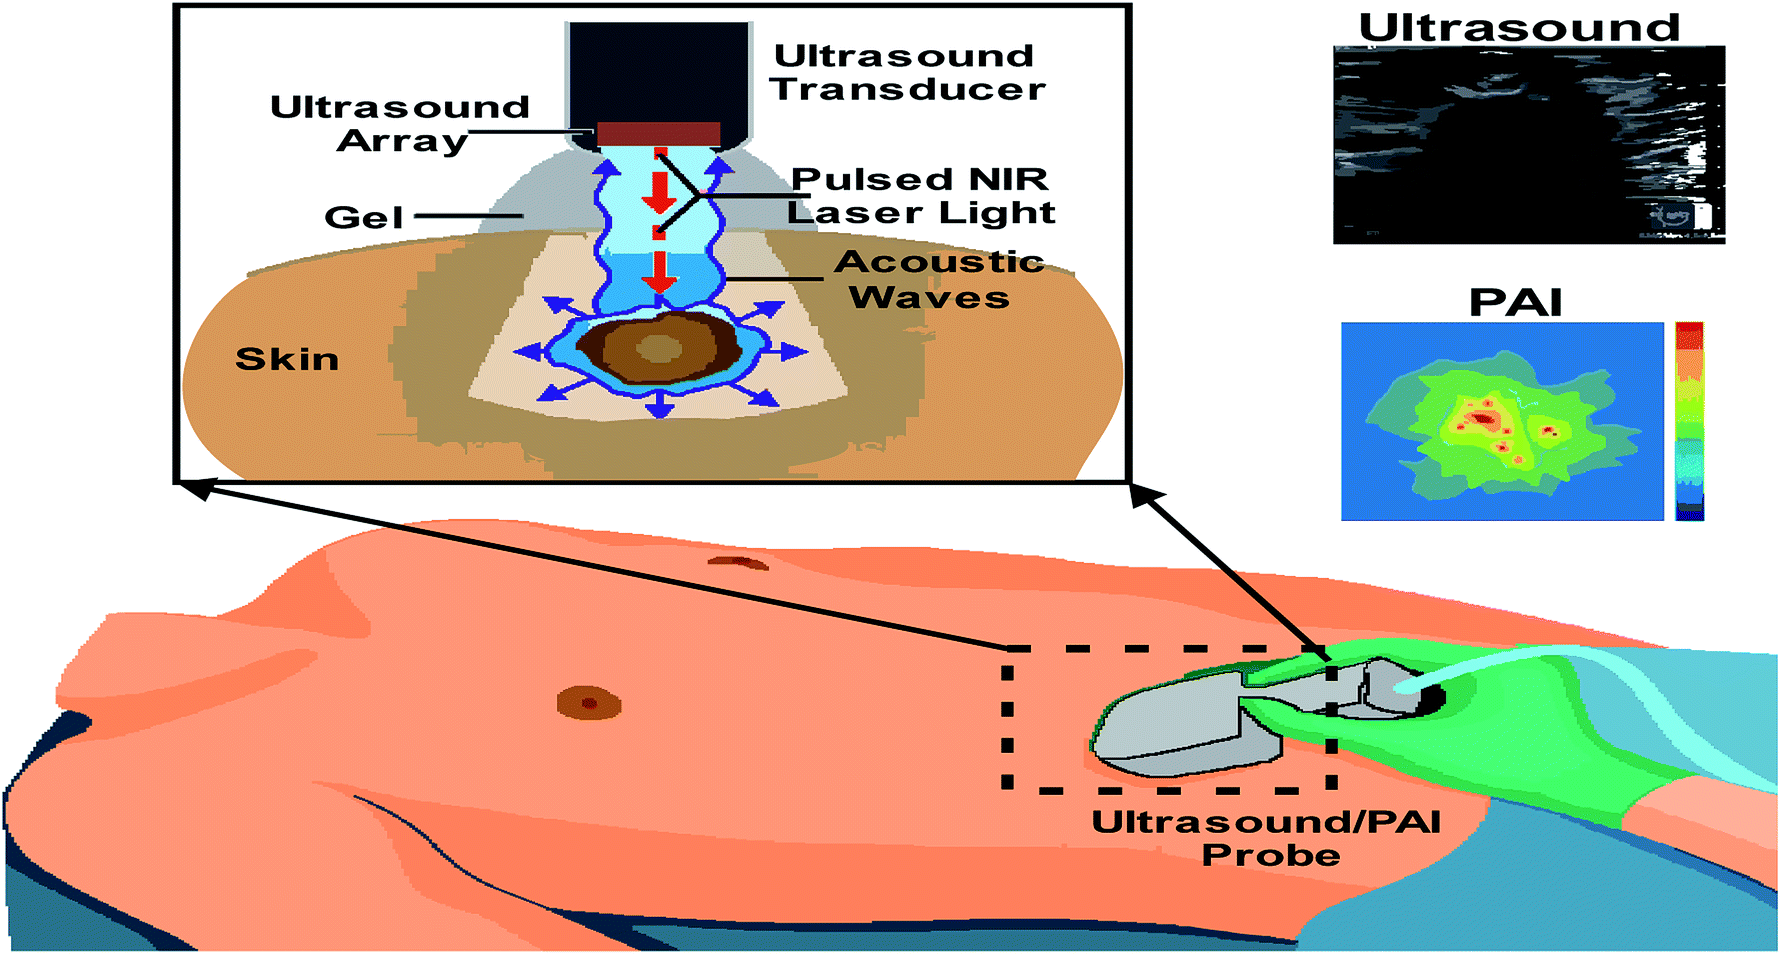
The ultrasound signal originates from the mechanical oscillations of many crystals in a transducer, which is excited by electrical pulses, this effect is called as the piezoelectric effect. Piezoelectric materials are ideal for this.72 The typical transducer consists of a disk-shaped piezoelectric element that is made vibrating by applying an electrical impulse via an electrode on each side of the disc. Likewise, the echo returning to the disk makes it vibrate, creating a small electrical potential across the same two electrodes that can be amplified and recorded.73 In modern clinical scanners, the transducer consists of hundreds of small piezoelectric elements arranged in a 1D array packed into a small enclosure.74 Thus the generated acoustic waves propagate in the fluid or surrounding tissues, from where these structures reflect the echoes which are collected back in the transducer which then transforms into electrical energy.75 This signal is then processed to get the image of the tumours in a required dimensional form. Photoacoustic imaging (PAI), or optoacoustic imaging, is insensitive to photon scattering in the biological tissue and, unlike conventional optical imaging techniques, this technique makes high-resolution optical visualization.76–79
Multi-spectral optoacoustic tomography (MSOT) is an imaging method that produces high-resolution optical images in scattering media, including biological tissues. This technique is also known as functional photoacoustic tomography. MSOT illuminates tissue with light of transient energy, typically light pulses lasting 1–100 nanoseconds. The tissue absorbs the light pulses, and as a result undergoes thermo-elastic expansion, a phenomenon known as the optoacoustic or photoacoustic effect. This expansion gives rise to ultrasound waves (photo echoes) that are detected and formed into an image as shown in Fig. 7.80–82 The process is carried out with the help of computer where the image displayed on the screen is useful in diagnosing the lesions.83 The images are obtained in vertical sections are both the resolution and penetration vary according to the frequency. A retrospective study examined the usefulness of high-frequency ultrasound in the diagnosis of BCC through the identification of hyper-sonographic spots. This study concludes the conflicts between hyper-sonographic spots versus hypersonic spots in differentiating BCC and melanoma.12
 |
| | Fig. 7 Integrated real-time photoacoustic/ultrasound imaging. | |
Sonography is the pre-operative studies which measures the thickness of the tumor and internal echo density.17,84 Ultrasound of B-scan technique is interfaced with the computer which uses 20 MHz frequency transducer in acquiring the image.74 40 MHz ultrasound gives higher resolution than 20 MHz.85 El Gammal et al. demonstrated the detection of melanoma using 100 MHz frequency which provided higher resolution and detailed visualization of skin layers.86 High-frequency sonography which is coupled with color Doppler gives 100% specificity and 100% sensitivity in detection of melanoma.87,88 Ultrasonography is used to produce 3-dimensional imaging and detects the border of the lesions.89 White light digital photography in combination with reflex transmission imaging, which is a form of high-resolution ultrasound used to classify the pigmented lesions.90 Contrast-enhanced ultrasound is used to study the primary lesion and gives information about the non-surgical treatment. Sonoelastography is used to study the mechanical behaviour of the skin lesions.91,92 Melanoma appears as hypoechoic or as heterogeneous oval structure under ultrasound detection.93 Detailed anatomic data about the primary tumor is provided by sonography.94 Retrospective analysis is done by ultrasound for pre-surgical examinations.95 Fine-needle aspiration cytology is also used as a minimally invasive technique of ultrasound in detecting melanoma.96–98 Recent summarization of ultrasound techniques for skin cancer diagnosis is presented in Table 3.
Table 3 Recent reports on ultrasound based techniques for skin cancer diagnosis
| S. no. |
Signal used |
Description |
Upside |
Downside |
Acc, Se, Sp |
Ref. |
| 1 |
20 MHz |
Sonography with 20 MHz frequency is used as an pre-operative diagnosis of malignant melanoma |
Hypo-echoic is identified easily with greater tumour thickness |
Definite differential diagnosis is not possible |
— |
17
|
| 2 |
40 MHz |
It is the superior, non-invasive method for the detection of BCC |
High resolution |
Microscopic examination is still required |
— |
85
|
| 3 |
7.5–20 MHz |
The probe which is used has a high frequency which can detect the three layers of the skin |
It is used to find the depth of melanoma |
Resolution is less |
— |
84
|
| 4 |
100 MHz |
It uses imaging technique which uses the transducer of frequency 95 MHz, whose resolution is high |
Detailed visualization of the upper skin layers as compared with 20–40 MHz sonography |
Image acquisition takes much time |
Resolution (res): 8.5 μm |
86
|
| 5 |
20 MHz |
B-scanning ultrasound with 20 MHz frequency is interfaced to the computer and assessed acoustic shadowing and entry echo line enhancement for 29 basal cell papillomas (BCPs) and 25 melanomas |
High-performance screening tool to assist in the discrimination between BCP |
Not good in discriminating between benign naevi, and melanoma. Accuracy of detecting melanoma is not that accurate |
Se: 100%, Sp: 93% |
74
|
| 6 |
7.5 MHz |
Fine-needle aspiration cytology procedures were performed in melanoma patients with palpable tumors or non-palpable, ultrasonically suspicious lesions. Device was interposed between needle and syringe which was vacuum valued |
The procedure is painless and well tolerated by patients |
Ultrasound guides the process and is minimally invasive |
Se: 94.6% and Sp: 100.0% |
96
|
| 7 |
7.5–15 MHz |
Ultrasound B-scan is a technique used for detection of regional melanoma |
Quick and reliable |
Only in combination with cytologic examination of fine-needle aspirates, allows definite diagnosis |
Se: 89.2%, Sp: 99.7% |
97
|
| 8 |
13 and 20 MHz |
Intralesional vascularization is assessed by the use of coupled high-frequency sonography and color Doppler |
Simple and reliable. |
Requires experienced operators |
Se: 100% and Sp: 100% |
87
|
| 9 |
Less than 15 MHz |
Ultrasound is used as an imaging technique which uses transducer of superior designs |
Parameters are quantified. |
Photo damage occurs |
— |
83
|
| 10 |
7.5–10 MHz |
Ultrasonography is used to produce a 3-dimensional size and outline of the lesions |
Used to distinguish benign and malignant tumors |
The quality of information depends heavily on the examiner's skill and experience |
Se: 99.2%, Sp: 99.7% |
89
|
| 11 |
7.5–13 MHz |
Evaluated the distribution of metastases from scar of primary to the regional lymph node with subjects of cutaneous melanoma |
— |
Suitable only for follow up cases |
— |
99
|
| 12 |
20 MHz |
Ultrasound technique distinguishes the nevi from melanoma using probes of different frequencies |
— |
Frequency of probes differs for various types of lesions |
Se: 100%, Sp: 79% |
90
|
| |
| 13 |
20, 75, 100 MHz |
Thickness of melanoma is assessed using different frequency in the transducer probe. Among all the frequency, using 7.5 MHz in transducer proves to be more versatile in detecting the thickness of melanoma |
Information about the dermatology is provided completely |
Sometimes may be overestimated due to infiltrate process |
Se: 99%, Sp: 100% |
88
|
| 14 |
10–100 MHz |
Asymmetry of the tumour is determined by applying the gel on the skin surface and examining with the ultrasound with different frequencies |
Deepest tissues are also analysed. |
Pigments (melanin) of the skin cannot be detected |
Se:92% |
91
|
| 15 |
20–100 MHz |
The sonographic findings in common benign and malignant skin tumors, inflammatory dermatologic diseases, and ungual and cosmetic conditions, among others, are considered and compared with various systems |
Discrimination is better for different cutaneous layers |
Visualization problem arises |
— |
93
|
| 16 |
15–22 MHz |
Demonstrated use of sonography in facial BCC diagnosis. A comparative discussion was reported with other methods of assessing tumours and invasion besides sonography |
Doesn't have any radiations |
Provides only preliminary detection |
— |
94
|
| 17 |
20 MHz |
High resolution ultrasound is used to detect metastases in melanoma subject by monitoring lymph nodes. |
Early detection of recurrences can be made. |
Not clinically used due to high cost |
Se: 65%, Sp: 99% |
98
|
| 18 |
20 MHz |
Hyperechoic spots of BCC tumors are analysed using retrospective analysis of ultrasound examinations |
Less expensive |
Quality depends upon operator's skill |
Se: 79%, Sp: 53% |
95
|
| 19 |
7.5–100 MHz |
Reported that sonography was effective at determining lesion thickness, defining lesion borders, and aids to identify whether lymph nodes are metastatic |
Can be used to obtain measurements of skin cancer lesion thickness and can define lesion boarders. It can further delineate metastatic lymph nodes |
Applicable only for screening method and not used widely by physicians due to lack of data's proving its accuracy level |
Se: 90.74%, Sp: 98.89% |
92
|
The laser transmits nanosecond pulses of NIR light through the transducer into the tissue. This light is then absorbed inside the tissue producing a localized temporary thermoelastic expansion. This expansion leads to the emission of ultrasound, which is detected by the transducer. Finally, a photoacoustic image is generated and displayed in real-time.
Confocal microscopy
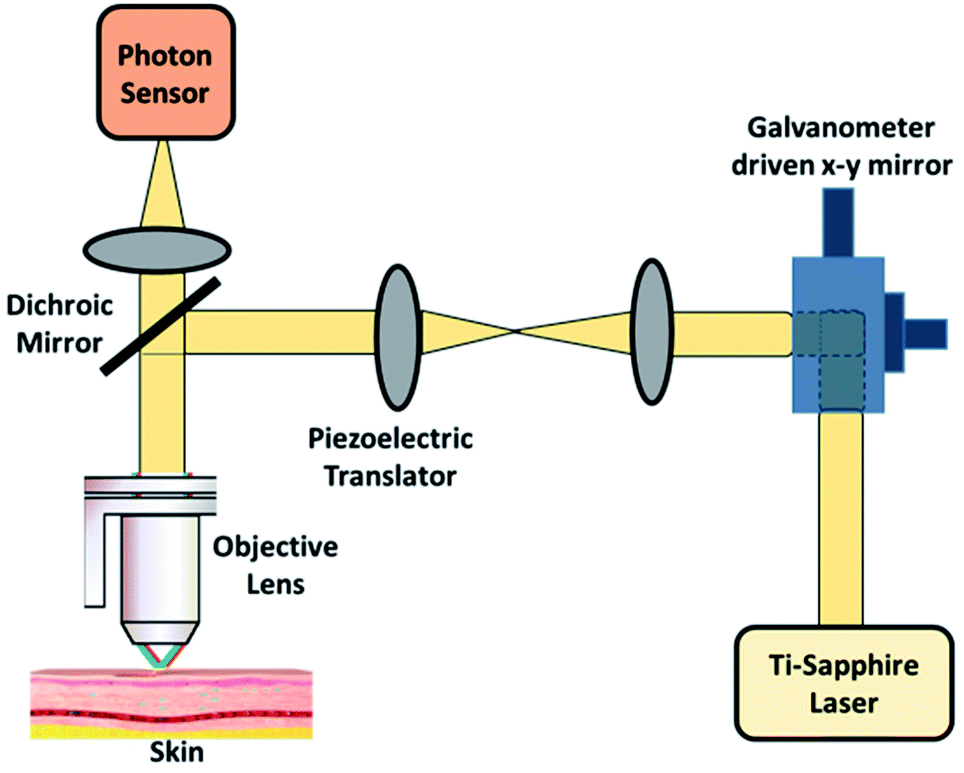
Confocal microscopy is a non-invasive technique that allows examination of the skin with cellular resolution. It uses a focused laser beam to illuminate a specific point within the skin and measures the reflection of light from that point as shown in Fig. 8. Multiple points are scanned across an area parallel to the skin surface to construct a grayscale image.100 Different depths can also be imaged to form optical sections. A confocal microscope includes a light source, a condenser, an objective lens and a detector. A confocal microscope uses point illumination and a pinhole in an optically conjugate plane in front of the detector to avoid out-of-focus signal – the name “confocal”.101 This configuration permits the collection of light from the single in-focus plane and dismissal of light from all out-of-focus planes. The light source illuminates a small 3-D spot (voxel) within a sample, such as skin, from which mirrored light is collected to produce a pixel.102 The illuminated spot is then scanned horizontally over a 2-D grid to obtain a horizontal microscopic section. This process is known as “optical sectioning” of the image in a series of horizontal planes stacked vertically to produce an image pixel by pixel, with an axial thickness of 2–5 μm.103 This property enables a confocal microscope to look at a slice in the body of a thick semi-transparent sample, whereas, conventional microscopes visualize all the planes contemporarily.
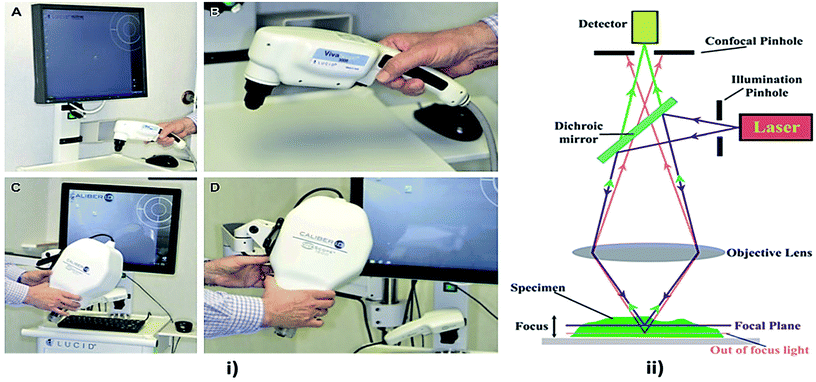 |
| | Fig. 8 Confocal microscopy imaging technique. In image (i) (A and B) showing hand held RCM probes and (C and D) showing wide probe RCM, reprinted from ref. 110 with permission from Elsevier, and (ii) showing its mechanism, reproduced under CC license from ref. 111. | |
Confocal microscopy provides the capacity for direct, non-invasive, serial optical screening for thick, living specimens with least of sample preparation as well as a minimal improvement in lateral resolution, commonly called reflectance confocal microscopy (RCM). In vivo RCM is a non-invasive technique that allows examination of the skin with cellular resolution. Resolution is almost comparable to the conventional histology. It has the advantage of allowing the clinician to do a “virtual biopsy” of the skin and obtain diagnostic clues while minimizing unnecessary skin biopsies.104
Various skin disorders of which both hyper-pigmentary and hypo-pigmentary lesions can be detected using confocal microscopy.105 Also in combination with Raman spectroscopy at various wavelength, confocal microscopy provide better cellular details.106 The recent study involves the usage of vivascope107 with the extended version which offers better imaging. From 488 to 700 nm, the laser source can be used to illuminate the tissue non-invasively to know the depth nature of tissues and its complications.108 Multispectral polarized light imaging (MSPLI) and confocal microscopy combination provide better accuracy details in results rather an individual system.109 Recent progress in confocal microscopy techniques for skin cancer diagnosis is presented in Table 4.
Table 4 Recent updates on confocal microscopy techniques for skin cancer diagnosis
| S. no. |
Signal used |
Description |
Merits |
Demerits |
Acc, Se, Sp |
Ref. |
| 1 |
633 nm |
Imaging is based on the detection of singly backscattered photons from the optical section and contrast is due to the relative variations in refractive indices and sizes of organelles and microstructures |
RCM imaging with optical sectioning of 2–5 μm and resolution of 0.5–1.0 μm can be performed |
Results vary according to the expertise in the clinical field |
For melanoma, Se: 93% and Sp: 78% and for BCC, Se: 92% and Sp: 91% |
112
|
| 2 |
820 nm |
Light emitted by a laser diode (a safe wavelength for patient and operator) is reflected, directed through a small pinhole, and arrives at the detector, where an image is formed of horizontal sections of the different layers of an area of the skin depicting intracellular structures |
Used in combination as complementary imaging tools, all those techniques will provide detailed, higher sensitivity, information about field cancerization, with increased specificity for higher accuracy of diagnosis and delivery of optimal treatment |
High cost |
— |
101
|
| 3 |
450–650 nm |
Testing the feasibility of a new mosaicing algorithm for perioperative RCM imaging of non-melanoma skin cancer margins on patients during Mohs micrographic surgery (MMS) |
Video acquisition and video-mosaicing have improved RCM as an emerging tool |
Cost is high |
— |
113
|
| 4 |
450 nm |
Described dermoscopic and confocal features of 2 couples of similar lesions in order to achieve the correct diagnosis and the best therapeutic approach |
Simple technique to implement |
Difficult to diagnose lesions such as pink tumors |
— |
114
|
| 5 |
— |
Reported that in three children RCM examination of cutaneous lesions of Langerhans cell histiocytosis showed specific signs correlated to histopathology |
Aids in decision making for biopsy |
Cost is high |
— |
115
|
| 6 |
— |
Confocal microscopy a non-invasive tool for detection of various skin disorders such as melasma and vitiligo or melanocytic lesions such nevi and melanoma |
Both hypopigmentary and hyperpigmentary disorders can be evaluated using confocal microscopy |
Cost of equipment is expensive |
— |
105
|
| 7 |
720–950 nm |
Development of integrated system of both confocal microscopy and Raman spectroscopy in the evaluation of melanoma |
In depth microstructure analysis is performed using this microscopic technique |
Integration of this system cost is high |
— |
106
|
| 8 |
830 nm |
Multimodality imaging technique using high resolution microscope, different cellular level features are observed |
Among the non-invasive techniques, reflectance confocal microscopy imaging is unique to provide cellular details |
Difficulty in distinguishing dendritic melanocytes in pagetoid pattern from Langerhans cells |
Se: 96.6% Sp: 89.2% |
107
|
| 9 |
488 to 700 nm |
Point source of light emitted by laser chamber falls on the tissue layer to provide the refractive property of normal and melanocytic skin |
Real time imaging can be performed |
Detection of tumor in the superficial layer with RCM is limited |
Se: 97.3%, Sp: 72.3% |
108
|
| 10 |
630, 660 and 830 nm |
Combination of confocal microscopy and multispectral polarized light imaging (MSPLI) provide imaging in cellular level |
Good correlation of result equal to histology |
Small field of view |
— |
109
|
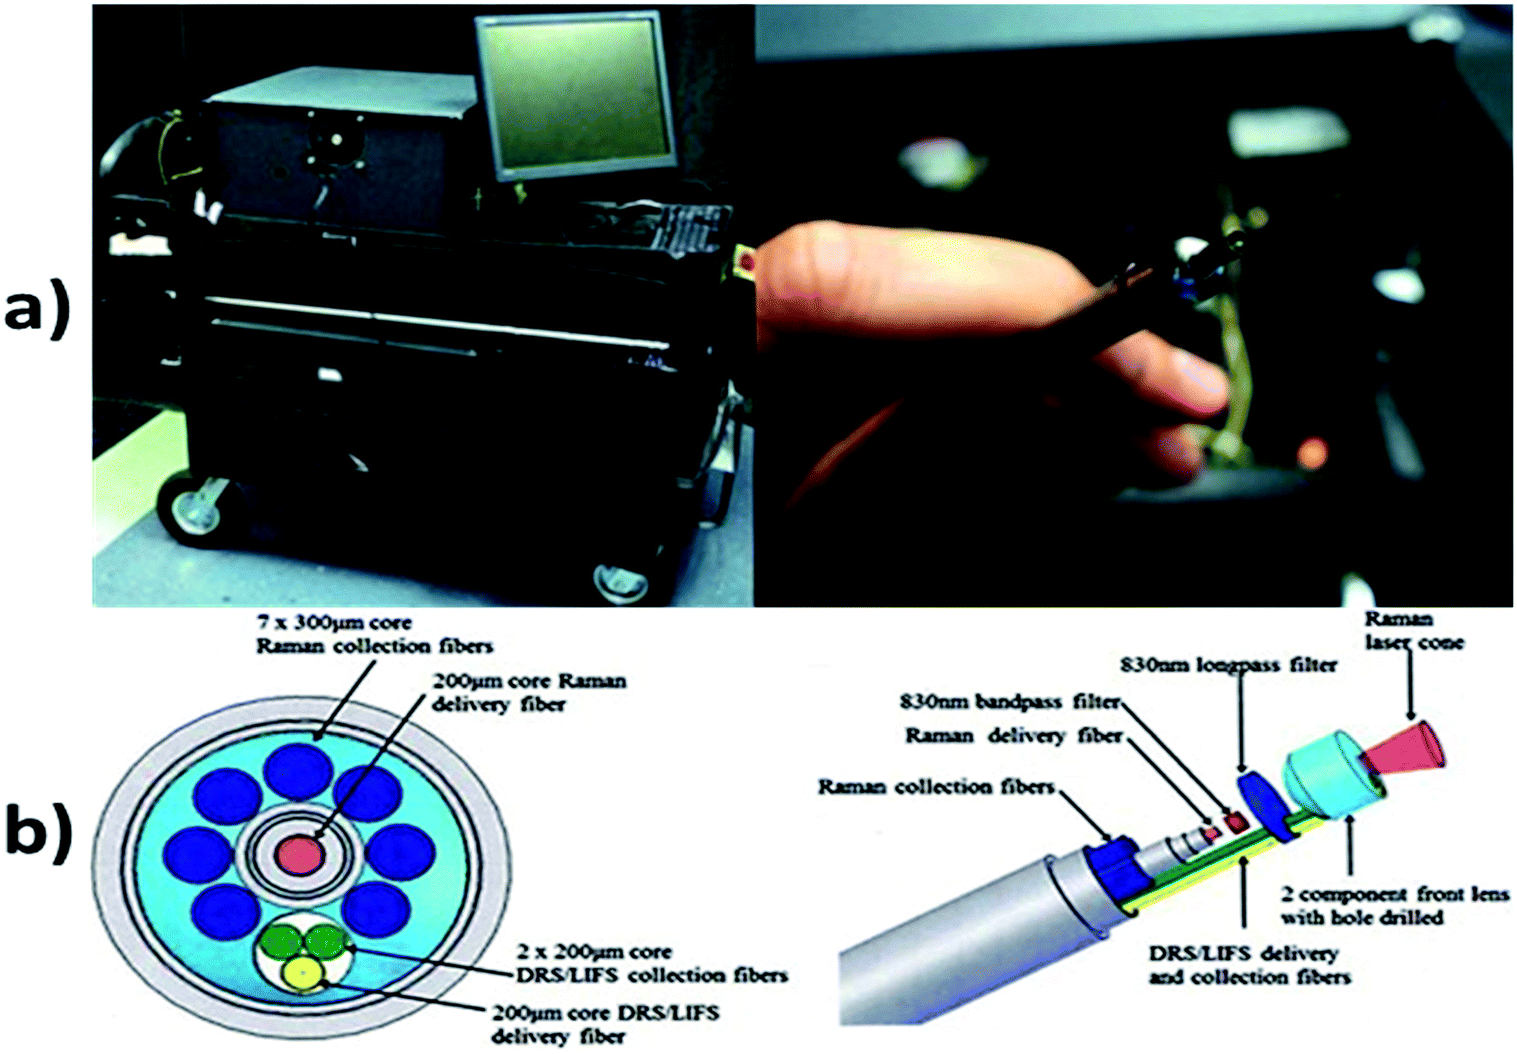
Raman spectroscopy
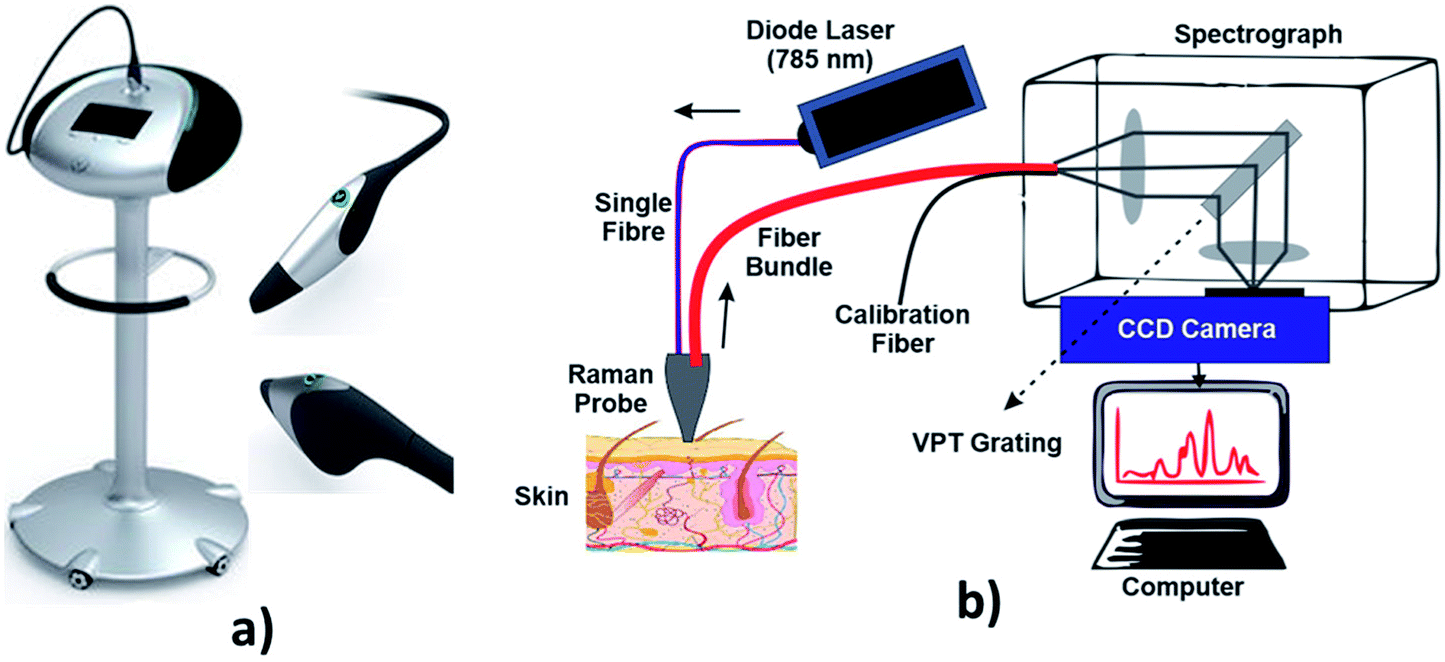
Raman spectroscopy is a technique which is used to discover various modes in a system which involves vibrational, rotational and other low–frequency modes. The detailed setup of Raman spectroscopy is as shown in Fig. 9. It depends on Raman scattering of monochromatic radiations, usually from a laser in the visible, near infrared and near UV rays.116 In Raman scattering, inelastic collisions take place between the photons of an irradiating laser beam and the sample (or tissue) molecules.117 The obtained spectra can be processed and analyzed in order to provide automated feedback at the time of measurement.118 This system provides better sensitivity in differentiating the tissues.119
 |
| | Fig. 9 Raman spectroscopy technique. In image (a) showing hand held probe, (Courtesy of Verisante Technology Inc., Canada; with permission) and (b) showing the Raman spectroscopy mechanism. | |
One of the article deals with the classification of skin lesion using Raman spectra by a non-linear neural classifier.120 The classification model is highly probabilistic and automated. This model involves the feature extraction for Raman spectra and a fully adaptive robust feed-forward neural classifier. The component analysis of Fourier transform Raman spectra of ex vivo basal carcinoma can be diagnosed by using the Nd:Yag laser at the wavelength of 1064 nm acting as an excited source in FT Raman RFS100/s spectrometer.121 Thirty-nine set of human skin samples were collected. Among the 39 samples, 18 samples were found to be histopathologically diagnosed as non-diseased and 21 samples were found to be BCC. Raman microspectroscopy is mostly done on in vivo method. It is a non-invasive, automated and real-time application to diagnosis the non-melanoma skin cancer which includes both BCC and SCC which can calibrate the sample within less than 1 second.122 By using the confocal Raman system1 with a handheld probe, the Raman spectra of 21 suspected non-melanoma skin cancers in 19 subjects with matched normal skin spectra were collected to analyse the pathological condition. Small distinctive bands corresponding to specified Raman spectra of lipids and proteins are used to distinguish the skin lesions. Raman Spectra of various compounds can be analysed by using the partial least regression and discriminate analysis.123 Raman spectroscopy plays a major role in the study of static and dynamic properties of the biologically significant molecule in solution, living cells and cell culture etc. The contribution of various bio-compounds such as lipids and proteins in the tissue can be estimated by providing a linear least square fitting model, to analysis the skin cancer in the tissue regions.119 Raman spectroscopy can also be used as a developmental tool in medical diagnosis. By shifting the excitation energy of Raman spectroscopy from the visible to NIR regions, the fluorescence components present within the normal cells can be minimized. The software tools have been developed to interpret the spectra of the tissue to diagnose the affected areas of the tissues regions.124 Cluster analysis plays a significant role in the classification of Raman spectra of malignant tumours from normal cells.125 Latest updates on Raman spectroscopy techniques for skin cancer diagnosis are summed in Table 5.
Table 5 Recent reports on Raman spectroscopy techniques for skin cancer diagnosis
| S. no. |
Signal used |
Description |
Merits |
Demerits |
Acc, Se, Sp |
Ref. |
| 1 |
1064 nm |
Using the near infrared Raman spectroscopy, the molecular structures of normal and abnormal tissues are analysed |
Skin lesions produced reproducible and unique spectra |
Spectra are complex and an objective method for their interpretation remains to be developed |
Acc: 94.8% |
120
|
| 2 |
1064 nm |
Near-infrared Fourier transform (NIR-FT) Raman spectroscopy was used to study the molecular alterations in the most common skin cancer, BCC |
Can differentiate the normal cells from BCC |
Needs neural network for classification |
Acc: 95% |
121
|
| 3 |
1064 nm |
Raman spectra of normal tissues from benign and malignant can be differentiated by cluster analysis |
Can differentiate the normal and abnormal tissues |
Complex analysis is required |
— |
123
|
| 4 |
1064 nm |
Nonlinear neural network is used to perform the Raman Spectra on the skin lesions to classify the cancer cell |
The framework is highly automated |
Complex algorithms are used |
Acc: 80–95% |
119
|
| 5 |
1064 nm |
Basal carcinoma can be diagnosed by using the Nd:Yag laser at the wavelength of 1064 nm |
This technique is applied to all types of tissues |
Only analysis the non-melanoma cancer |
Se: 83% |
124
|
| Sp: 100% |
| 6 |
785 nm |
Demonstrated an integrated real-time Raman spectroscopy system for skin evaluation and characterization, which combines customized hardware features and software implementation |
Improved the signal-to-noise ratio by 16-fold |
Involves a series of processing stages |
Acc: 100% |
125
|
| 7 |
825 nm |
Demonstrated the capability of Raman micro spectroscopy to provide differential diagnosis of BCC, SCC, inflamed scar tissue, and normal tissue in vivo |
High accuracy |
Only diagnosis the non-melanoma skin cancer |
Acc: 95% |
126
|
| 8 |
1064 nm |
Discriminate analysis and partial least square method is used to classify the cancer tissue |
Good diagnostic accuracy |
Detection needs optimum instrumentation setup |
Se: 95–99%, Sp: 15–54% |
116
|
| 9 |
830 nm |
Linear least square fitting models is used to determine the biomolecules contributions |
The distribution of lipids, protein, elastin, collagen compounds in normal and the abnormal tissues can be diagnosed |
Samples becomes over heat due to high intense laser |
Acc: 91.7% (actin vs. nucleic acid), Acc: 93.1% (collagen vs. elastin vs. melanin) |
127
|
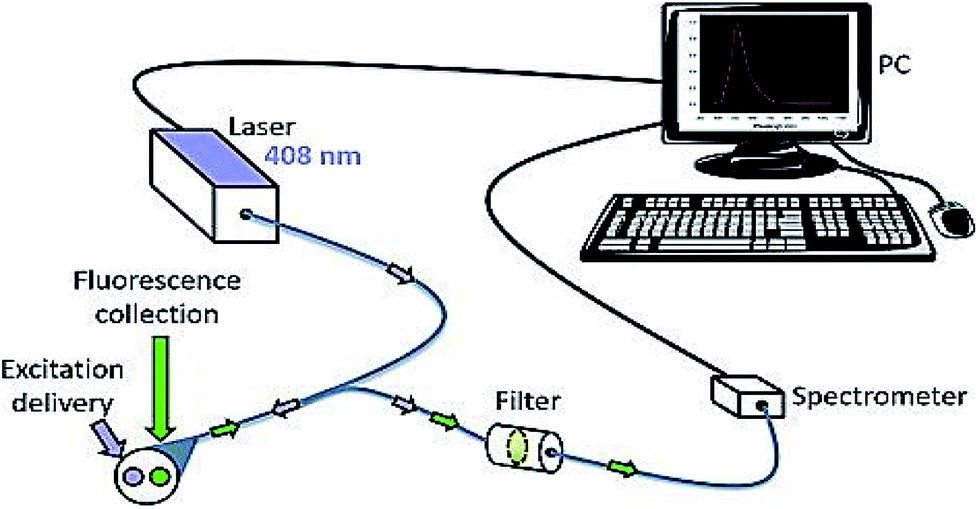
Fluorescence spectroscopy
Fluorescence spectroscopy is electromagnetic spectroscopy also known as fluorometry or spectrofluorometry that analyses the fluorescence from the sample.128 The light source used in this technique excites the electrons in the molecules, and the fluorescence is analyzed from the samples as shown in Fig. 10.129 This method has been employed in many biological, biochemical and environmental applications.130,131 Laser-induced fluorescence spectroscopy is used to detect the skin cancer by in vivo methods.
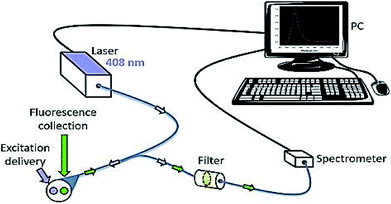 |
| | Fig. 10 Fluorescence spectroscopy. It is used to detect the skin cancer with the help of fluorophores. Reprinted from ref. 145 with permission from Elsevier. | |
A study was conducted by E. Borisova and his team on fluorescence spectroscopy; they noticed that excitation spectrum are usually identical to the absorption spectrum, as the fluorescence intensity is directly proportional to the absorption.132 The non-melanoma skin cancer can be diagnosed by the fluorescence polarization imaging technique, in which the tunable monochromatic light source along with CCD camera is employed to detect the tumour cells.133 As a result, two fluorophores were retained in tumours. Hyperspectral fluorescence is the one of the technique used to diagnosis the skin cancer in which the two ultrafast lasers were used operating at the wavelength of 355 nm that excites the auto-fluorescence between the bio-molecules that resides in the skin tissue.134 Auto-fluorescence technique is used to capture the images of the pigmented skin lesions, in which both the fluorescence and reflectance were studied.135 The excitation source used in this method is fibre coupled laser operated at the wavelength of 785 nm and the illumination of a light source is filtered by bandpass filter in order to acquire the fluorescence imaging and the reflectance imaging were obtained by the selection of components of the long pass filter. Auto-fluorescence technique is used to select the sampling points for the Raman spectroscopy, based on that the classification of various skin lesions was performed.136 Fluorescence spectroscopy is used to determine the distribution of biological substances by employing the fluorescent agent.137 The excitation source that causes fluorescence has been integrated with fiber optic probes to examine the tissue and it was recorded by using spectrograph. Fluorescence spectroscopy technique can also be used to classify the benign from malignant tumors with the help of fluorescence spectra by in vivo method. As a result, the normal tissues were found to be the wavelength of 440 nm and the non-melanoma tissues were found to be at the wavelength of 436 nm.138 Fluorescence spectroscopy has the ability to distinguish the cancerous cells from the non-cancerous cells.139 The monochromatic radiation is used as an excitation source at the wavelength of 300 nm. From the tissue two sets of fluorescence were emitted at the wavelength of 340 nm and 440 nm. The difference in intensity between the two fluorescence will decide whether the tissue is a malignant or a benign tumour.140
PDD of doubtful skin lesions relies on the fluorescent properties of an exogenous drug or endogenous compound in response to a light source. Topical agents are utilized to stimulate the reproduction of endogenous photosensitizers that produce a photodynamic effect when exposed to the light of specific wavelengths and energy. Photodynamic therapy (PDT) is the combination of absorption light and the photosensitizer.141 This technique also helps prior to surgery to detect the cancerous cells by using the photosensitizer. Fluorescence spectroscopy is performed on the tissues by using the photo sensitizer.142 Non-melanoma skin cancer can be diagnosed by fluorescence spectroscopy by both in vivo and ex vivo method. Auto-fluorescence is used to detect the presence of an abnormality in malignancy. The fluorescence intensity of dermal collagen is generally lower in tumour than in the normal tissues.143 Synchronous fluorescence method with time-resolved fluorescence technique can also be used for this applications.144 Modern reports on fluorescence spectroscopy methods for skin cancer diagnosis are summarised in Table 6.
Table 6 Recent reports on fluorescence spectroscopy techniques for skin cancer diagnosis
| S. no. |
Signal used |
Description |
Merits |
Demerits |
Acc, Se, Sp |
Ref. |
| 1 |
300 nm |
The tumours are differentiated by the fluorescence intensity |
High sensitivity |
Samples become darker if proper dying agent is not provided |
— |
133
|
| 2 |
442 nm |
Fluorescent agent is employed to analyze the bio molecule distribution |
Distribution of bio molecule can be analyzed easily |
Applicable only for detecting non-melanoma |
Se: 96.6% |
134
|
| 3 |
360–600 nm |
Fluorescence spectra is used to classify the tumors at the wavelength of 436 nm and 440 nm |
Short excitation source is enough |
Less feasible |
— |
135
|
| 4 |
630 nm |
Suppression of cytokine production is recorded |
Cytokine production can be analysed |
Two common side effects of PDT are cutaneous photosensitization and systemic immunosuppression |
Acc: 83% |
136
|
| 5 |
442 nm |
A non-invasive diagnostic tool to identify diseased tissue and normal tissue from the absorption property of the chromophores |
High resolution |
Need high and optimum level of instrumentation setup |
— |
137
|
| 6 |
410 nm |
Laser-induced fluorescence spectroscopies are used to detect the skin cancer by in vivo methods without biopsy |
Can able to differentiate the normal tissue from malignant tissue |
Highly engaged to external noise that disturbs the measurement |
— |
138
|
| 7 |
300 nm for epidermal tryptophan and 330 to 400 nm for dermal collagen crosslink |
The fluorescence intensity of dermal collagen is generally lower in tumour than in the normal tissues |
Abnormality in malignancy condition can be estimated easily |
It requires endogenous fluorescence for diagnosis |
— |
139
|
| 8 |
650–750 nm |
The tumours can be detected by using a tunable light source along with CCD camera |
Fluorophore can be retained between the normal and tumour cells |
High cost |
— |
140
|
| 9 |
355 nm and 440 nm |
Two ultrafast lasers were used at 355 nm that excites the auto fluorescence |
High resolution |
External probe is required |
— |
141
|
| 10 |
785 nm |
From the images of the pigmented skin lesions, both the fluorescence and reflectance were studied |
High sensitivity |
Cost is high |
— |
142
|
| 11 |
292 nm for tryptophan and 377 nm for collagen |
The sampling points for Raman spectroscopy were chosen by auto fluorescence segmentation. It's function is to diagnose the BCC in sampled tissue during the Mohs micrographic surgery which is much faster than frozen section histopathology |
Classification of skin lesions can be made easy |
Segmentation is required to analyse whether the surgery is needed or not |
Se: 100%, Sp: 92% |
143
|
| 12 |
400 and 2400 nm |
Cancer tissue can be diagnosed by synchronous fluorescence (SF) imaging |
Highly efficient |
It is a weekly emitting component. |
Se: 82–97% |
144
|
Tetrahertz spectroscopy
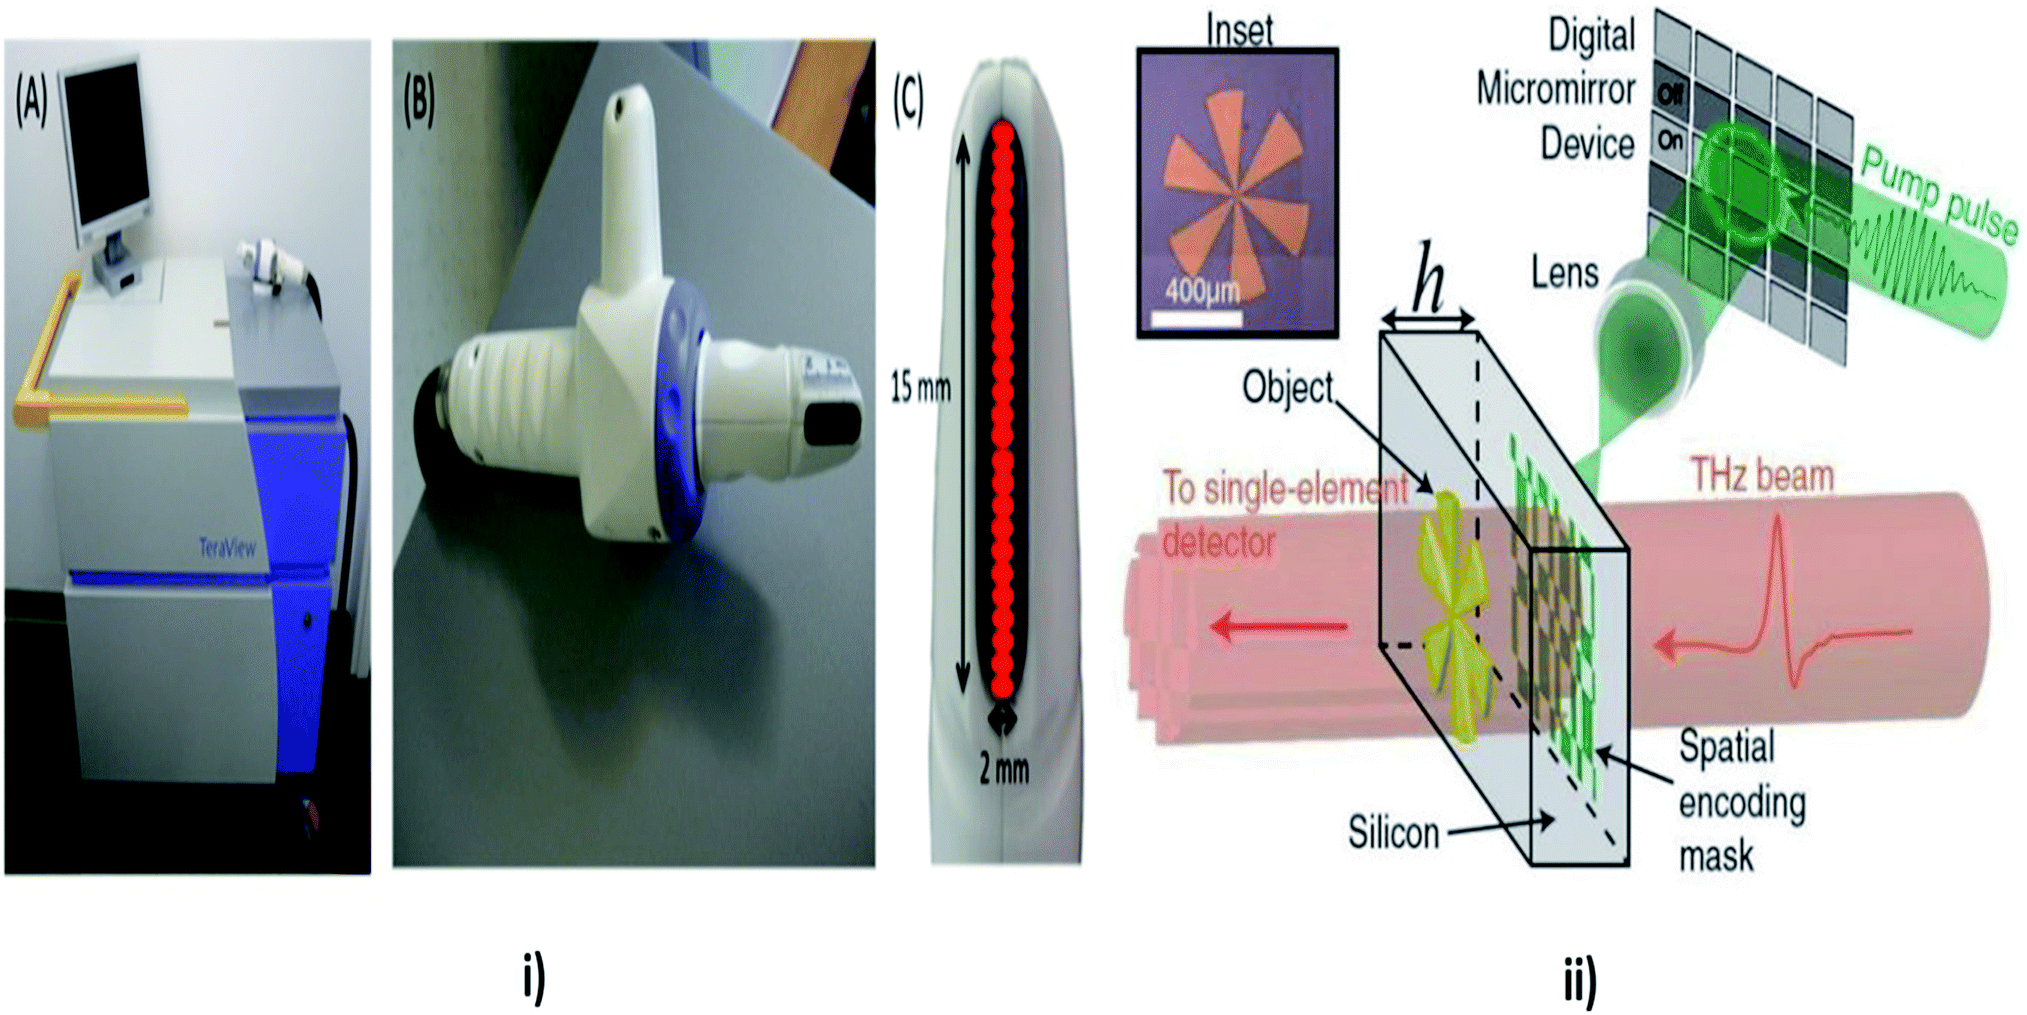
Tetrahertz (THz) spectroscopy as shown in Fig. 11 comes under the spectroscopy technique which is used to detect and controls the properties of matter with the electromagnetic domain that are in the frequency range between a few hundred GHz to several THz. It is an imaging technique, which is used to detect the epithelial cancers. Time domain analysis is used to differentiate between diseased and healthy tissues, which are significant statistically. The location of a tumour is well correlated and increased in terahertz absorption. Diagnosis of skin cancer using frequency domain analysis in terahertz spectroscopy is by using in vitro techniques and by using tetrahertz pulsed imaging (TPI). Then data manipulation is done to determine the spectral information which is related to depth.146
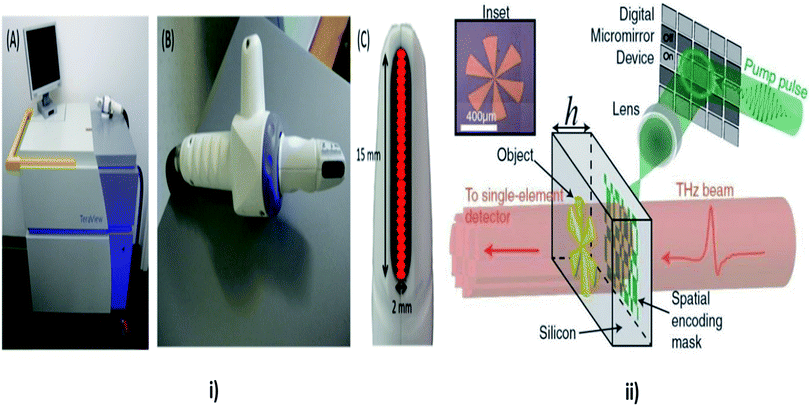 |
| | Fig. 11 Tetrahertz Spectroscopy. In this technique the properties of matters are probed with short pulses of THz radiations. In the above image (i) showing TPI handheld probe system, (A) main unit with computer monitor, handheld imaging probe and black umbilical cord (visible on the right), (B) close up of the handheld imaging probe, (C) close up of the head of the imaging probe showing the black quartz window. The probe scans an area of 15 × 2 mm, and acquires data from 26 pixels (red), reproduced under CC license from ref. 156; and (ii) showing the THz mechanism, reproduced under CC license from ref. 157. | |
The pulsed THz spectrometry is used to analyse the dielectric properties of the human skin.147 Using this technique, the contrast between the BCC and normal healthy skin was found. The THz material parameter can encounter the dysplastic and non-dysplastic nevi pigmentation and it was compared with the normal healthy skin. A skin tissue model has been developed for the THz wavelength and has been estimated for a Monte Carlo simulation of the polarized light and scattering. The studies were made based upon the Mueller matrices in order to diagnosis the skin cancer.148 In accordance with the novel optic system, it is used to capture the images of the neoplastic and the non-neoplastic colon tissue with close to the wavelength – limited spatial resolution at the spatial resolution of 584 GHz frequency were employed to study the carcinoma tissues.149 THz technology plays an important role in medical diagnosis.
T waves also extends its application in both electrical and optical method to diagnose the skin cancer by means of plamonic photoconductive antenna of high sensitivity.150,151 THz spectroscopy also used to analyse the biological tissues by integrating the IR camera with IR detector.152 Using the THz imaging at the range of 1.39–1.63 THz the non-cancerous and cancerous cells can be differentiated.153 It also extended its application in the domain of biomedical which ranges from the bio-molecules includes lipids, proteins, amino acids to cells and tissues.154 It is used in sensing applications, involves detection of concealed objects, explosive detection of identifications, space exploration and THz cancer detections.155 Contemporary updates on THz spectroscopy approaches for skin cancer diagnosis are compiled in Table 7.
Table 7 Recent reports on Tetrahertz spectroscopy for skin cancer diagnosis
| S. no. |
Signal used |
Description |
Merits |
Demerits |
Ref. |
| 1 |
0.1 to 2.5 THz |
Dielectric properties of the human skin is analysed to differentiate the normal cell from abnormal cells |
Acts as on effective tool to diagnose the skin neoplasm |
Longer acquisition time |
147
|
| 2 |
14 THz |
Monte Carlo simulation and Mueller matrices are used to diagnosis the skin cancer based upon the polarization property of the skin |
Sensitivity is high |
Injection of nano particles is required |
148
|
| 3 |
0.1–10 THz |
Applied in the field of bio molecules of the cells and tissues |
Cutting edge technology is addressed |
It uses less lens array which results in less accuracy |
154
|
| 4 |
0.1–2.5 THz |
Involves the detection of tumours for skin cancer diagnosis |
Sensing application can be done easily |
It requires less lens array |
155
|
| 5 |
0.3–4.3 THz |
Used to image the neo plastic and the non-neo plastic colon tissue |
Resolution is high |
— |
149
|
| 6 |
0.1–1.1 THz |
Plasmonic photoconductive antenna uses the T wave to diagnose the skin cancer in both electrical and optical methods |
Plasmonic photoconductive antenna element are available in single component with optical frequency |
Cost is high |
150
|
| 7 |
0.1–2.7 THz |
Using the TPI technique the contrast between normal and tumour cells can be examined by time domain and frequency domain analysis |
It requires only minimum impulse function |
Consume more time |
146
|
| 8 |
76 MHz |
High sensitive of THz detection of nanoparticles can be provided by plasmonic photoconductive antenna |
High resolution |
High cost |
151
|
| 9 |
4.2 THz |
The biological tissue can be visualized by integrating the IR camera with the IR detector by exposing the human skin 4.2 THz |
High resolution |
Very expensive |
152
|
| 10 |
1.39–1.63 THz |
The contrast between the normal and cancerous cells are demonstrated using THz imaging technique |
Easily differentiate the cells |
Consume more time |
153
|
Optical coherence tomography
The backscattering of near-infrared light by tissue is measured by the technique called optical coherence tomography (OCT) shown in Fig. 12. OCT is a non-invasive method that allows 2 or 3-dimensional cross-sectional visualization of the microstructural morphology of tissues.158 It provides better depth resolved image than ultrasound imaging. OCT is an in vivo technique which works on the principle of interference (Michelson interferometry) of infrared radiation and living tissues which is the major reason for high resolution. The interferometer in an OCT scanner splits a broadband source field into a reference field and sample field. The sample field focuses through the scanning optics and the objective lens to some point below the surface of the tissue. The back scattered beam from the tissue combines with the reflected beam from the reference mirror, forming an interference pattern which is detected by the photodetector.159 Structures of normal skin, including the epidermis, dermo-epidermal junction, dermis, hair follicles, blood vessels and sweat ducts can be clearly visualized by this method. This technique allows the differentiation between the benign and malignant epithelial tissue by the qualitative and quantitative assessment of OCT images. It enables the optical biopsy of epithelial lesions.160
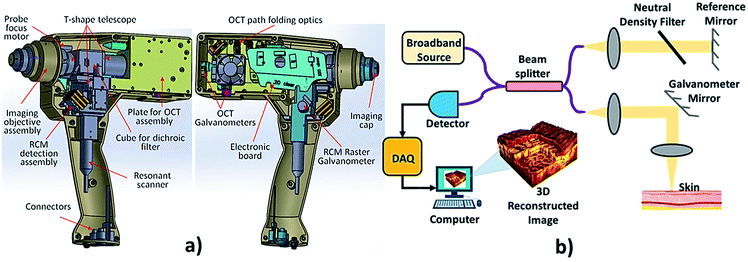 |
| | Fig. 12 Optical coherence tomography. In the above image (a) showing a hand held OCT device, reproduced under CC license from ref. 176 and (b) showing the OCT mechanism. | |
A report was made by Michael R. Hee, Joseph A. Izatt, Joseph M. Jacobson, James G. Fujimoto, and Eric A. Swanson, who made a significant finding on OCT by introducing a trans-illuminance property in femtosecond laser.161 Famous authors Alexander M. Sergeev and Valentin M. Gelikonov found that longitudinal scanning of human tissue has good accuracy comparing to transverse scanning.162 Authors also used CCD camera to detect the photons but failed in showing the wider field of view.163 Cross-sectional image of human skin is obtained with higher accuracy.164 It has been proved that longer wavelength can minimize the influence of multiple scattering on image contrast and resolution; thus increase the effective penetration depth of OCT.165 Combination of both OCT and optical Doppler tomography (ODT) shows better results in scanning speed of acquiring the image.166 Even for detecting the inflammation on the skin, lesions on the skin and other infection over skin apart from tumour detection can also be performed by OCT.167 Heterogeneous property of tissue shows that collagen level in tissue can also rate the tumor growth.168 Later researchers like Aneesh Alex, Jessika Weingast and Martin Weinigel, reported that the combination of multi photon tomography (MPT) and OCT showed better resolution and high penetration depth.169 To overcome the conflicts in differentiating the non-tumour and tumour, deep margins are detected in the region of interest using the OCT.170 Increased thermal property of tissue shows various dysfunction of metabolic activity. The epidermal region shows higher thermal coefficient in the cancer patient.171 Also, the density of normal skin and tumour occurred in the skin varies.172 OCT reduces the Mohs micrographic surgery.173 Measurement of epithelial density can also be performed by OCT directly.174 Currently; precise tumour depth is performed by three methods combination namely, OCT, optoacoustic and Raman spectroscopy which shows the better results.175 Recent updates on OCT approaches for skin cancer diagnosis are compiled in Table 8.
Table 8 Recent reports on OCT techniques for skin cancer diagnosis
| S. no. |
Signal used |
Description |
Merits |
Demerits |
Acc, Se, Sp |
Ref. |
| 1 |
830 nm |
With the help of fiber optic interferometer which releases a femtosecond pulses and coherent heterodyne detection to attain 130 dB dynamic range and time gating is performed to attain the image. Time gating is performed with the scattering medium |
Monochromatic and coherent in nature |
Cost is high |
— |
161
|
| 2 |
830 nm |
A compactible OCT system is presented which uses fiber interferometer with integrated longitudinal scanning of tissue. The dynamic range 60 dB allows observing structure of human skin in vivo up to 1.5 mm in depth |
Non-contact method |
Consumes more time to analyse the structure |
— |
162
|
| 3 |
10 MHz |
A slow-scan CCD-camera is able to detect very little numbers of photons. First measurements were made on models consisting of very small glass spheres embedded in polyester resin. It was possible to prove coherent photons from a depth of 2 mm |
Accuracy is high in the obtained image |
Consumes time since the measurement is performed with little number of photons so the field of view is less |
— |
163
|
| 4 |
830 nm |
Based on the principle of low-coherence interferometry, cross-sectional images of the human skin can be obtained in vivo with a high spatial resolution of about 15 μm |
In vivo investigation of pharmacologic effects |
Detection depth is much lower |
— |
164
|
| 5 |
830 nm and 1285 nm |
The effects of both instrumentation parameters and the dynamic characteristics of living tissue on image contrast and resolution and on speckle reduction are discussed. Both theoretical predictions and experimental results in human skin imaging show that longer wavelength can minimize the influence of multiple scattering on image contrast and resolution and thus increase the effective penetration depth of OCT |
High resolution |
Very expensive |
— |
165
|
| 6 |
1300 nm |
OCT and ODT system that uses phase information derived from a Hilbert transformation to image blood flow in human skin with fast scanning speed and high velocity sensitivity. This technique decouples spatial resolution and velocity sensitivity in low images and increases imaging speed by more than 2 orders of magnitude |
High scanning speed |
Cost is high |
— |
166
|
| 7 |
1300 nm |
A review was made on OCT method in a healthy skin, tumor region and inflammatory regions of skin and concluded that because of its non-invasive character, the technique allows monitoring of inflammatory diseases over time easily |
Resolution is high |
Data analysis takes times for investigating various skin disease conditions |
— |
167
|
| 8 |
1310 nm |
Here polarization-sensitive OCT images of human skin in vivo, demonstrating the ability of the technique to visualize and quantify the birefringent properties of skin |
Used to determine the polarization properties of the skin in real time |
Results show poor categorization |
— |
168
|
| 9 |
1300 nm |
Study demonstrates the clinical diagnostic potential of MPT/OCT for pre-screening relatively to obtain sub-cellular level information of the respective regions. |
System design is simple and high speed image acquisition. |
Cost is high |
— |
169
|
| 10 |
1318 nm |
Deep margins of skin tumors are greatly assessed using OCT. Inflammatory skin diseases can also be detected |
Differentiates premalignant from malignant lesions |
Resolution is low |
Sp: 83–100%, Se: 79–86% |
170
|
| 11 |
1300 nm |
The magnitude of the thermal coefficient of attenuation coefficient is greater in epidermis than in dermis. Thus it can be used to detect the optical attenuation using optical probe with the help of temperature control module |
Can be used as a confirmation technique without physicians |
Lack large scale clinical trials |
— |
171
|
| 12 |
1305 nm |
While considering OCT base on density of the skin for detecting BCC, normal skin has higher densities whereas the lesion cells have lower densities than the normal skin |
Non-contact approach |
It requires much time for imaging |
Se: 79–94%, Sp: 85–96% |
172
|
| 13 |
— |
To determine the margins of BCCs with OCT, prior to MMS (Mohs micrographic surgery), to reduce the number of surgical steps. Scans of the center and entire margin were performed. If parts of the BCC were visible outside the margin, another 2 mm were added and the scan was repeated until the tissue outside the labelling looked tumor free |
Stages of MMS were reduced by OCT method |
Expensive set up |
— |
173
|
| 14 |
1310 nm |
To perform epithelialization of suction blister lesions by OCT and to find epidermal thickness (ET) easily as the primary outcome from histology test takes time. Results at earlier shows discrimination for neoepithelization but later shows better result |
Fast speed scanning of image |
This method not able to distinguish blood vessels from dilated lymphatic vessels. 20 experienced similar difficulties when evaluating OCT images of normal human skin |
— |
174
|
| 15 |
1300 nm |
Combining OCT and optoacoustic modalities to provide precise tumor depth determination also with Raman spectroscopy to determine the tumor depth, volumetric imaging. Results found penetration depth is high in optoacoustic method |
High resolution |
Consume more time |
— |
175
|
Multispectral imaging technique
In multi-modal spectroscopy (MMS) or multispectral imaging, various linear polarizers of different wavelengths are used. The spectral and spatial information of the samples are simultaneously recorded by the multispectral image spectrometer, in which the acquired images from a monochrome camera is processed using spectral and polarization filtering that provides high contrasting images which is useful in identifying the pathological and morphological features of the suspicious skin lesions.177–179 Refer to Fig. 13 shows the multimodal spectroscopy setup for skin cancer diagnosis. The report was made by Hagen Nathan, Kudenov Michael on multispectral imaging based on spectral bands. In this, the image analysis is done automatically and pattern recognition is used to identify lesions which in turns help in further biopsy. It plays an important role in the diagnosis of skin cancer by considering the parameters such as texture, asymmetry, border irregularities etc.180 The images are obtained from the affected regions of the skin using the charge coupled camera along with eight narrow band filters ranging from 450 nm to 800 nm at the interval of 50 nm.181 The features are extracted from the image using the principal components analysis. The characterizations of malignant and benign tumors are separated by spatial gray level co-occurrence matrix.182
 |
| | Fig. 13 Multi-modal spectroscopy. In image (a) showing the setup of MMS and hand held probe and (b) showing exploded view with optical elements such as the filters and front lens identified along with the collection and delivery fibers for all three modalities. Reprinted from ref. 193 with the permission of AIP publishing. | |
Multispectral imaging technique includes in vivo methods in which the images were analyzed at the wavelength between 483 nm and 950 nm at equal wavelength intervals.183 Multispectral imaging employs the automated diagnosis of skin cancer using the neural network classifier. The neural network has the ability to discriminate the malignant and benign tumor with the sensitivity of 80.4%. In the multispectral imaging system, the pigmented skin lesions are separated by using the automatic segmentation algorithm.184 Usually, in multispectral imaging technique, the images of the skin lesions are analyzed as 2-dimensional and 3-dimensional images at the wavelength range from visible to the infrared spectrum.185 Multispectral imaging technique facilitates the analysis of skin lesions, vascular depth and sub-cellular pigmentations.76 It uses the radiometric measurement to analysis the malignant and benign tumors.186 A multispectral imaging technique employs the multispectral camera to capture the skin lesions images. The images are analyzed based on the spectral ranges between 450 nm to 950 nm which is used to discriminate the melanoma from nevus cells.187 The self-developed software is used in multispectral imaging technique to analyze the skin chromophores which is a non-contact method.188 Multispectral imaging method finds its applications in the detection of melanoma skin cancer by considering the parameters such as melanin index and erythema index.189 It also provides the decision of undergoing biopsy from the pigmented lesion using multispectral digital skin lesion analysis (MSDSLA) device.190 Multispectral imaging technique enhances the diagnosis by analyzing the vascular depth of the skin lesion.191 The vascular depth can be interpreted with the help of 6 layered skin models. Reported the multispectral imaging techniques combined with 3-dimensional imaging sensor to detect the skin cancer.192 Contemporary reports on MMS methods for skin cancer diagnosis are summarised in Table 9.
Table 9 Recent reports on multispectral imaging technique for skin cancer diagnosis
| S. no. |
Signal used |
Description |
Merits |
Demerits |
Acc, Se, Sp |
Ref. |
| 1 |
430–950 nm |
In this technique the skin tissue are characterized by texture, asymmetry, blotchiness and boarder |
Easily differentiate the malignant and benign tumors |
High cost |
Se: 100%, Sp: 97% |
181
|
| 2 |
430–950 nm |
The images of the moles are collected using charge coupled camera and the classifications of tumors are made by spatial gray co-occurrence matrix |
Have high potential to classify the skin cancer |
Texture information is needed |
— |
182
|
| 3 |
483–950 nm |
The skin lesions were imaged by in vivo imaging system operated at the wavelength between 483 nm and 959 nm at the equal wavelength intervals |
High sensitivity |
Classifier is required. |
Se: 80.4% Sp: 75.6% |
183
|
| 4 |
483–951 nm |
The pigmented lesions are categorized by automatic segmentation algorithm |
Applicable only for non-melanoma skin cancer |
Cost is high |
Acc: 97.1% |
184
|
| 5 |
405–910 nm |
In this method, the 2-dimensional and 3-dimensional images were analyzed at the wavelength ranges from visible to infrared spectrum |
High resolution |
Only for the particular wavelength results were optimum |
— |
185
|
| 6 |
510–610 nm |
In this method, the multispectral nevoscope trans illumination technique is used to compare the radiometric measurement of malignant and benign tumors |
Differentiate the malignant and benign tumor |
Vascular depth of the skin is hard to interpret |
— |
186
|
| 7 |
450–950 nm |
Using the multi spectral camera the images of the skin lesions were captured and analyzed based upon the spectral ranges |
Novel image processing algorithm to differentiate of melanoma from pigmented nevi |
High cost |
— |
187
|
| 8 |
450–950 nm |
The clinical trials were made on 266 pigmented lesions and 49 vascular lesions. The software system was used to mapping the skin chromophores |
High clinical information from the image |
Various algorithms are required for mapping process |
— |
188
|
| 9 |
450–950 nm |
The melanoma images were analyzed based upon the melanin index and erythema index |
High resolution images are obtained |
Cost of instrumentation set up is high |
— |
189
|
| 10 |
400–720 nm and 650–1100 nm |
MSDLA device is used to determine whether the biopsy is required or not |
High resolution |
High cost |
Se: 94% |
190
|
| 11 |
400–720 nm and 650–1100 nm |
The six layered skin model was made to analyze the optical parameters |
Accuracy level is high. |
Doesn't classify the melanoma and non-melanoma skin cancer |
— |
191
|
| 12 |
414–995 nm |
The skin cancer can be detected based on the spectral parameters which involve the reflectance and the color of skin lesions |
High quality |
High cost |
Se: 93%, Sp: 54% |
192
|
Thermography
Infrared radiation is emitted by every object which possesses the temperature absolute zero point.194 The thermal imager determines the temperature of the object's surface based on the intensity of infrared radiation making it visible to the human eye with the thermal image. This process is referred as thermography. Thermal imager translates the wavelength from the infrared to the wavelength which is visible to human eye as shown in Fig. 14.195 This is the principle which is used to detect the skin cancer using thermography.196 Thermography has been employed in medicine for various applications.197 However, thermography overcomes all the shortcomings that other methods had.
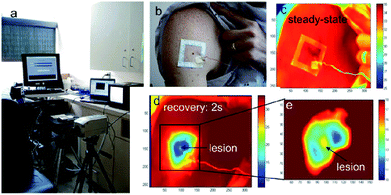 |
| | Fig. 14 (a) The infrared imaging system, (b) photograph of the body surface area with a cluster of pigmented lesions, (c) reference infrared image of the region at ambient temperature, (d) the same area after cooling and (e) magnified section of the melanoma lesion and surroundings. Reproduced under CC license from ref. 19. | |
A study performed by Cila Herman198 found a significant finding on recently introduced quantitative dynamic infrared system QUAINT which measures differences in the infrared emission between healthy tissue and lesion during the thermal recovery process after removal of cooling stress. Thermistors, thermocouple and other advanced sensors are used to detect the variation in temperature.199 The rise in temperature is a significant symptom in the skin cancer patient. Nano type sensors are involved in detecting the changes in the biological analyses and the obtained information is processed to the local server in the hospital which is directed to the medical professionals in the hospital.200,201 Prateek Mathur et al. studied on temperature variation of thermal images obtained from skin cancer patient and introduced a device named sKan as shown in Fig. 15. It is a new technique which maps the affected area with the help of sensor and monitors the patient's stage in the skin cancer.202,203 This is achieved by having a template of temperature values on which the obtained value is mapped and the data are sent to the doctor for the analysis.201 Viktor Gruev et al. made a report on an imaging sensor capable of recording the optical properties of partially polarized light by monolithically integrating aluminium nanowire optical filters with a CCD imaging array. The imaging sensor consists of 1000 by 1000 imaging elements with 7.4 μm pixel pitch. The polarization imaging sensor captures intensity, angle, and degree of linear polarization in the visible spectrum.204 Current updates on thermography techniques for skin cancer diagnosis are presented in Table 10.
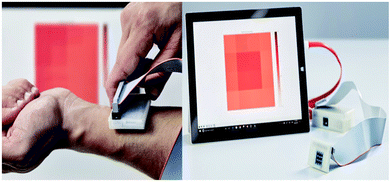 |
| | Fig. 15 sKan device. This device detects skin cancer using thermal images that are obtained from affected areas of the skin surface using thermistors. Reproduced from ref. 202. | |
Table 10 Recent reports on thermography based techniques for skin cancer diagnosis
| S. no |
Device used |
Description |
Merits |
Demerits |
Acc, Se, Sp |
Ref. |
| 1 |
Image sensing device 340–380 nm |
Using image sensing device illumination of ultraviolet light in the wavelength range of 340–380 nm, fluorescence property of the different skin anomalies were detected |
Real time recording can be done and non-invasive |
Highly expensive |
— |
205
|
| 2 |
Infrared camera |
Infrared imaging takes place in different region of the tissues, which is caused due to micro calcification or calcification in the benign lesion |
High resolution |
Skin temperature varies for external noise that affects the result |
— |
206
|
| 3 |
Infrared thermometer |
Thermal sensor that detect the affected area in a thermal map and calibrated using the processor (30) and corresponding output signals taken over a predetermined range of ambient temperatures |
High resolution |
Cost is high |
— |
207
|
| 4 |
Infrared detectors |
Temperature distribution of the body surface is performed using infrared thermography which produces thermogram that further used for diagnosing procedure |
High resolution |
Emission from other surfaces affects the measurement accuracy |
— |
208
|
| 5 |
Amber radiance 1 T IR camera |
Differentiation of melanoma and benign cutaneous lesions is performed using infrared thermography and found the sensitivity and specificity for different depths of the lesion |
Real time recording and non-invasive |
Need optimal instrumentation setup |
Se: 39% Sp: 100% (0–5 mm lesions), Se: 58% Sp: 98% (lesions >5–15 mm), Se: 95% Sp: 100% (lesions >15–30 mm), Se: 78% Sp: 89% (lesions >30 mm) |
209
|
| 6 |
Infrared thermal camera operated at 3 μm −5 μm |
Thermal responses for healthy and malignant tissue were compared and concluded that increased metabolic activity of melanoma lesion can be detected using infrared imaging |
High resolution |
Camera has only 2% of accuracy |
— |
19
|
| 7 |
Infrared thermal camera operated at 14000 nm |
Symptoms of illness are detected using embedded devices which can be in the form of watch, glass, camera etc. Communication interface is attached to the embedded device so that the captured data is transferred into the local server of the hospital or other healthcare station |
Automatically the captured data's are transmitted. |
Cost is high. |
— |
203
|
| 8 |
Infrared camera |
Thermal imaging for early stage detection of cutaneous melanoma is performed and resulting surface temperature oscillations were recorded using infrared camera |
Real time recording |
Lower rate transmission |
— |
210
|
| 9 |
Electrochemical sensor, optical sensor |
Biosensors are used to detect specific biological analyze later by converting a biological entity into an electrical signal and analyzed. Biosensor has vast potential in detecting the cancer cells |
Have more resolution comparing to other application sensor |
Specific chemical analyzer is random in nature so difficult to interpret |
— |
201
|
| 10 |
Nd:YAG laser at 532 nm |
The imaging sensor is use to capture the affected area which has 7.4 μm pixel pitch, composed of 1000 by 1000 imaging elements with a nanowire optical filter |
The signal to noise ratio is high and consume less power |
Cost is high since nanowire fabrication is implemented |
— |
204
|
| 11 |
Anon contact IR temperature sensor at 8–14 μm |
The emitted IR range extends from 800 nm to few hundred micrometers which are detected for the temperature variation |
Mapping of temperature variation is perfect |
Resolution is less |
— |
211
|
| 12 |
Infrared detectors |
The surface the sample is sensed with the small change in the motion. This motion is detected by bending of cantilever in the sensor system. Such system provides information about the position of the subject and the temperature value during displacement |
Nanoparticles are synthesized in the sensor which makes the accuracy to be good |
Cost is high |
— |
212
|
| 13 |
IR absorbance sensor at 3300 nm and 3570 nm |
Infrared absorbance sensor used to detect the malignant cells in the biopsy. It takes 8 seconds to identify whether it is tumor or normal cell |
This sensor is used in diagnosing the melanoma during histopathological analysis and also decreases the wrong interpretation |
Supports shorter range and its performance degrade with longer distances |
— |
213
|
Electrical bio-impedance
The living cells membrane act as an electrochemical membrane, which is a semi-permeable membrane allows only certain entities to pass through and does not allows the certain size of entities to pass through. The leaky capacitor acts as a semi-permeable membrane. It mainly consists of electrolytes and resistive properties. Biological tissues and cell suspensions have both capacitive and resistive properties. The impedance of biological tissues is highly frequency dependent. They travel in the extracellular due to high capacitance, high-frequency currents. Study of electrical bio-impedance of tumors was done way back in 1980's by Morimoto et al.214,215
Electrical impedance tomography (EIT)216 is being used for various biomedical applications. A report given by Beetner D. G. et al. shows the difference in electrical impedance with the frequency range of 1 KHz to 1 MHz for the lesion which has a diameter of 2–15 mm.217 The measurement was done by using electrodes of a two-point measurement.218 The measurement of electrical impedance shows the morphological changes which relate to the growth of skin cancer lesion.219 The multifrequency impedance spectra are used to detect the electrical bio-impedance for different skin lesions.220,221 The non-invasive probe separates the nevi from BCC with 96% sensitivity and 86% specificity.222 The impedance is measured by use of impedance spectrometer between 1 kHz and 1 MHz of various types of skin cancers including melanoma. This improves the signal to noise ratio. By applying small alternating voltage and comparing the measured current with voltage, the impedance between two electrodes is measured.218 The change in impedance is used to detect the skin cancer by using the information about cell shape, structure and orientation, integrity of cell membranes, relative properties of intra and extra-cellular fluids and ionic composition. This device consists of the system on chip impedance converter, AD5933, an ultra-low power MCU, MSP430F6638, and electrodes. The electrode used is Ag/AgCl electrodes, which is non-toxic and low cost.18 A smart phone based early cancer detection using EIT patch electrodes has been demonstrated.223 Electrical impedance spectroscopy (EIS) algorithm is used in detecting the lesions which have high sensitivity in the detection of malignant melanoma.224 Electrical impedance helps in differentiating the cancerous cell from non-cancerous cell at the range of 1 KHz to 2.5 MHz.225 Bio-impedance spectroscopy also available in portable form which is used to monitor the physiological system.226 Latest progress on electrical bio-impedance approaches for skin cancer diagnosis are compiled in Table 11. Fig. 16 shows the different devices used for electrical bio-impedance measurement.
Table 11 Recent reports on electrical bio-impedance techniques for skin cancer diagnosis
| S. no. |
Signal used |
Description |
Merits |
Demerits |
Acc, Se, Sp |
Ref. |
| 1 |
1 kHz to 1 MHz |
Used to distinguish BCC from benign lesions based on magnitude, phase, real part and imaginary part of the impedance calculated |
It provides the rapid differentiation of tumors |
High cost |
Se: 90%, Sp: 50% |
217
|
| 2 |
2 MHz with a sampling rate of 50 Hz |
To determine the state of accuracy to distinguish benign from malignant lesions by measuring with electrical impedance |
Reflects morphological changes when there is a growth in tumor cells |
This method is not applicable for humans |
Se: 92%, Sp: 67% |
219
|
| 3 |
1 kHz and 1000 kHz |
Distinguishes the skin cancer from the benign lesions using multi-frequency impedance spectra |
The result obtained is better accurate than conventional methods |
Distinguishing the tumors takes more time and false result may also be obtained |
Se: 75–87%, Sp: 100% |
220
|
| 4 |
1–1000 kHz |
Compares the detection of skin cancer by non-invasive probe and micro invasive electrode system, whose surface is furnished with tiny spikes which gets penetrated to the stratum corneum |
Electrode system produces better result |
Minimally invasive technique |
Se: 92–96%, Sp: 80–86% |
222
|
| 5 |
1 kHz and 1 MHz |
Describes the method for detecting the skin cancer using electric impedance. Electric impedance of the biological system decreases with the increase in frequency |
High resolution |
Multivariate and the impedance is complex |
— |
218
|
| 6 |
1 kHz to 2.5 MHz |
Accuracy of electrical impedance to classify malignant melanoma from benign tumour by automated classification algorithm |
Accuracy is high |
Various algorithm is needed for classification of skin cancer |
Se: 95%, Sp: 49% |
221
|
| 7 |
1–100 kHz |
Non-invasive approach for detecting the presence of skin lesions by measuring the impedance change |
Low cost and portable |
Electrodes are used which cause discomforts |
— |
18
|
| 8 |
1 kHz to 2.5 MHz |
EIS algorithm is used on lesions to differentiate normal skin from the abnormal lesions |
High resolution |
Experienced physician is required |
Se: 100% (non-melanoma cancer) |
224
|
| 9 |
1 kHz to 2.5 MHz |
1300 lesions were collected from multi centre and examined by EIS at 1 kHz to 2.5 MHz in order to differentiate the melanoma from non-melanoma cancer |
Classification is easy |
High cost |
Se: 98.1% (melanoma), Se: 100% (non-melanoma) |
225
|
| 10 |
20 kHz to 1 MHz |
Portable bio-impedance system is used to diagnose the skin cancer based upon the magnitude ratio and phase detection method. |
Act as a great tool for monitoring the physiological conditions of the biological system |
High cost |
— |
226
|
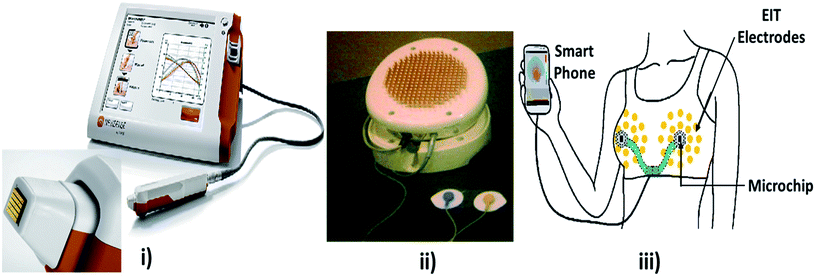 |
| | Fig. 16 Electrical bio-impedance measurement setup. In the above image shown (i) Nevisense device including hand piece and touch screen monitor. (Courtesy of SciBase, Stockholm, Sweden; with permission); (ii) Electrical impedance mammograph meik, reproduced under CC license from ref. 227; (iii) Smart phone based diagnosis using EIT patch. | |
Tape stripping
Tape stripping is the removal stratum corneum layers as demonstrated in Fig. 17. Adhesive tape is used to remove the cell layers of the stratum cornea from the skin area. The number of corneocytes and a considerable amount of penetrated formulation will be present in the tape strips.228 Tape stripping is also known as Epidermal Genetic Information Retrieval (EGIR).90 The sample cells from the stratum corneum by the use of adhesive tape stripping from which RNA is isolated, amplified and gene expression is noted.229 This adhesive tape has the RNA genetic expression profile which is useful in differentiating melanoma from nevi.230 With the help of 17-gene genomic biomarker, the presence of melanoma is detected from the harvested specimens. This analysis is carried out using ribonuclease protection assay (RPA). This analysis is used to differentiate malignancies on the basis of gene expression profiles. DermTech's Epidermal Genetic Information Retrieval (EGIRTM) uses a custom adhesives film to collect surface skin samples. This method is painless and it can also be virtually applied to the skin surface. Also, this method has 100% sensitivity and 88% of specificity.231,232 It is a rapid and convenient method233 to contrast various changes in the cancerous patients. It also differentiate lentigo maligna melanoma from solar lentigo, which is sometimes difficult with histology.234 This method is widely used as a robust bedside system for subject with numerous dysplastic nevi.235 Can be performed from the extracted RNA only by freezing it up to −80 °C. Only then the frozen sample is treated.236 Early detection can be achieved if tape stripping toluidine blue (TSTB)237 is combined with ABCDE rule. In 2011, Wachsman and colleagues showed that EGIR performed on 202 melanocytic lesions identified 312 genes that were capable of differentiating normal skin, nevi and melanoma.229 Recent progress on tape stripping techniques for skin cancer diagnosis is compiled in Table 12.
 |
| | Fig. 17 Tape stripping technique. Method of tape stripping (a) application of the formulation on a marked skin area; (b) homogeneous distribution; (c) the adhesive tape is pressed with a roller on the skin, an empty sheet of paper avoids the transfer of the formulation onto the back side of the tape; (d) removal of the tape. Reprinted from ref. 228, with permission from Elsevier. | |
Table 12 Recent reports on tape stripping methods
| S. no |
Description |
Merits |
Demerits |
Acc, Se, Sp |
Ref. |
| 1 |
mRNA from the cells attached with tapes are collected for gene investigation towards the differentiation of melanoma and non-melanoma |
Rapid and easy to perform |
Test results need large genetic profile for differentiation process |
Se: 69%, Sp: 75% |
90
|
| 2 |
Cells from the stratum corneum is taken by means of tape stripping and detects the melanoma from nevi |
Less resource consumption procedure |
Produce itching effect after the procedure |
Se: 100%, Sp: 88% |
229
|
| 3 |
Different non-invasive techniques involved in detecting melanoma in which tape stripping act as excellent clinical information provider for melanoma detection using mRNA profiles |
Easy procedure to perform |
Investigation needs large set gene profile datasets |
— |
230
|
| 4 |
The best condition for tape stripping procedure was validated through the evaluation of the distribution of corneocytes, mass of stratum corneum (SC) removed and amount of protein removed using finger pressure, a 2 kg weight and a roller |
Cost is less |
Not used clinically due to conflicts in testing results |
— |
232
|
| 5 |
RNA from the stratum corneum is isolated to give 312 gene expressions for the detection of melanoma |
Rapid and convenient method and patient friendly |
Lack of standardized protocol and heterogeneous sampling |
Se: 100%, Sp: 88% |
233
|
| 6 |
Differentiation between lentigo maligna and lentigo maligna melanoma from solar lentigo, which is sometimes difficult with histology is easily performed by the extracted genetic information |
Sensitive and specific for melanoma and can be able to detect genomic changes before morphological changes appear |
Only few studies are available to prove the accuracy, sensitivity and specificity features of this technique |
Se: 100%, Sp: 88% |
234
|
| 7 |
RNA isolation, RNA amplification and array hybridization were performed to differentiate melanoma from dysplastic nevi |
Accurate results are obtained at the preliminary stage of the tests |
Need extra 15 to 20 melanoma sample for robust operation which causes local irritation to the patient |
Acc: 100% |
235
|
| 8 |
RNA extraction, synthesis of cDNA, probe labelling, array hybridization, quantitation of hybridization signals, reverse transcription polymerase chain reaction (RT-PCR), confirmation of markers were performed to differentiate the types of skin cancer |
Earlier diagnosis of melanoma is performed |
Can be performed only when the extracted particles are frozen deeply |
— |
236
|
| 9 |
One hundred and fifty pigmented lesions were tested using tape stripping toluidine blue (TSTB) method in the diagnosis of malignant melanoma and found the sensitivity and specificity |
Early detection of malignant melanoma is performed in addition with ABCDE rule |
This investigation takes time to collect data |
Se: 68.7%, Sp: 74.5% |
237
|
| 10 |
Preliminary investigation was designed to compare the gene expression profiles of melanoma and benign nevi |
Epidermal genetic information retrieval (EGIR) has the potential to identify future biomarkers which would be useful in targeted therapy |
Only few studies are available to prove the accuracy level |
Se: 100%, Sp: 88% |
238
|
| |
Multi photon scanning
Multiphoton scanning is also known as two-photon excitation microscopy, non-linear or two-photon laser scanning microscopy which is an alternative to confocal and deconvolution microscopy that provides distinct advantages for three-dimensional imaging.239 The principle of multiphoton scanning is the nonlinear interactions between photons and matter. Interaction of two photons with the same molecule at the same time occurs in two-photon excitation. This two-photon excitation causes fluorescence. Then, the single photon is required to process the fluorescence of right energy to interact with the molecule. Excitation is not produced when the two-photon excitation is used through the specimen, as the photon density is adequately high to cause two-photon absorption. Excitation occurs in the focal spot of the microscope.240 The complete setup is shown in Fig. 18. In particular, two-photon excitation excels at imaging of living cells, especially within intact tissues such as brain slices, embryos, whole organs, and even entire animals. Two-photon excitation microscopy provides great utility for dynamic imaging of living cells in thick specimens, such as intact tissue. The technique does many possible experiments in which conventional imaging cannot be performed.241
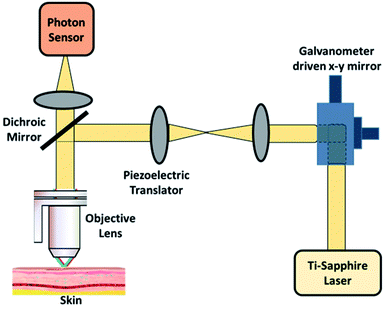 |
| | Fig. 18 Multiphoton scanning technique. In the above image shown setup used two-photon excitation that allows imaging of living tissue up to one millimetre in depth. | |
Researchers like Barry R. Masters, Peter T., C. Enrico Gratton, who worked on multiphoton laser scanning microscopy (MPLSM) demonstrated that the power entering the microscope can be controlled by Glan-Thompson polarizer which reduces power dissipation and increases the efficiency.242 In order to find the difference in accuracy for confocal laser scanning microscopy (CLSM) method and multiphoton microscopy, various histological tests were undertaken by Barry et al. and inferred that both methods have similar accuracy.243 However, resolution in terms of three-dimensional gene expressions and depths of tumor are more accurate in MPLSM.244 Later, Timothy P. Padera and colleagues found that epiluminescence property in MPLSM showed the better result in terms of gene expression.245 The major cause of skin cancer is UV rays which makes the skin to lose the collagen and elastin material in the skin are widely affected.246 Morphological altering due to skin aging is investigated by pathological characterization.247 Morphological features in 14 people who are non-melanoma are performed with MPLSM.248 Later 83 person were tested considering the morphological features of non-melanoma and melanoma skin cancer subjects, which showed a major difference and useful in diagnosis.249 Further to prove the accuracy of both CLSM and MPLCM in differentiating skin layer tumour, Martin Johannes Koehler and his colleagues performed pathological tests.250 MPLSM provides high-resolution fluorescence imaging, allowing visualization of cellular and subcellular structures of the epidermis and upper dermis.251,252 MPLSM based morphologic features of skin cancer images are comparable to traditional histopathology.252 Latest updates on multiphoton scanning for skin cancer diagnosis are summed in Table 13.
Table 13 Recent reports on multiphoton laser scanning microscopy techniques for skin cancer diagnosis
| S. no |
Signal used |
Description |
Merits |
Demerits |
Acc |
Ref. |
| 1 |
730 nm and 960 nm |
Multiphoton excitation microscopy was used to image in vivo human skin auto fluorescence from the surface to a depth of −200 μm |
Deepest layer of the tissue is observed and displayed in a 3D image |
Photo damage occurs |
— |
242
|
| 2 |
80 MHz at 780 nm |
Compared the tandem scanning reflected light confocal microscopy and multi-photon excitation microscopy for the observation of human skin in vivo. Both techniques gave similar results from the skin surface to the epidermal–dermal junction |
Excitation can only occur in the focal plane, so out-of-focus bleaching is avoided |
Minimal photo damage occurs |
— |
243
|
| 3 |
810–850 nm |
Presented that the multiphoton laser-scanning microscope can provide high three dimensional resolution of gene expression and function in deeper regions of tumors |
Lower photo toxicity due to the longer wavelengths |
Cell damage occur due to three-photon excitation |
— |
244
|
| 4 |
780 nm |
Intravital epifluorescence microscopy has provided powerful insight into gene expression, tissue pH, tissue pO2, angiogenesis, blood vessel permeability, leukocyte–endothelial interaction, molecular diffusion, convection and binding |
1. Depth of imaging is increased |
Cost is high |
— |
245
|
| 2. Projection of three-dimensional structures onto a two-dimensional plane |
| 3. Photo toxicity is reduced |
| 5 |
820 nm |
Major features of aged skin include dryness, flaccidness, wrinkling, multiple, mostly benign neoplasms, signs of chronic UV damage, carcinogenesis, and functional deficiency. Based on collagen and elastin content in the skin, skin aging is defined |
Second harmonic finding correlated with the histological findings in an ex vivo manner |
Movement artefacts occur which affects the resulting image |
— |
246
|
| 6 |
750 nm and 850 nm |
Pathological and physiological characterization conditions by MPLSM in vivo are performed to investigate and identify skin morphological alterations related to ageing |
Useful for diagnostics of pathological conditions and their differentiation from ageing effects |
Consumes time for cellular differentiation |
— |
247
|
| 7 |
Femtosecond pulsed laser at 780 nm |
Describes about the morphologic features of human non-melanoma skin cancer obtained using MPLSM on freshly excised specimens from 14 patients. Emission from the skin was detected in the range of 450–530 nm, corresponding to the auto fluorescence of nicotinamide adenine dinucleotide, NADPH, keratin, elastin, collagen, and melanin, allowing us to visualize the cellular structures within the epidermis and upper dermis of the specimens |
Deeper biological tissue can be viewed |
Cost is high |
— |
248
|
| 8 |
Mode lock at 80 MHz, and tuning range at 750–850 nm |
Laser radiation in the near infrared spectrum was used to image endogenous fluorophores by multiphoton excitation. Eighty-three melanocytic skin lesions have been investigated. The results showed distinct morphological differences in melanoma compared with melanocytic nevi |
High accuracy |
Cost is high |
Acc: 97% |
249
|
| 9 |
Tunable range at 750–850 nm and excited at 760 nm |
Comparison of confocal microscopy and multiphoton tomography were performed. Both methods, CLSM and MPT, were found to be suitable for in vivo imaging of superficial skin layers |
Both methods have high resolution and near-real time acquisition speed of the image |
It was not possible to use same optical medium for all the methods |
— |
250
|
| 10 |
532 nm |
Multimodal imaging, the combination of two-photon excited fluorescence (TPEF), and second harmonic generation (SHG), which have high diagnostic potential. Multimodal imaging generates molecular contrast, but to use this technique in clinical practice, the optical signals must be translated into diagnostic relevant information |
Increased reliability |
Cost is high |
— |
251
|
| 11 |
Femtosecond pulsed laser at 780 nm |
Demonstrated MPLSM as a diagnostic tool for superficial skin cancers, such as BCC, SCC in situ, and skin. The morphologic features observed in MPLSM images of skin tumors are comparable to traditional histopathology |
Imaging depth is increased here |
Loss of signal occur during focusing |
— |
252
|
Conclusion
This article briefly summarizes the techniques which deal with the non-invasive approach towards the detection of skin cancer. The different techniques that use various modalities to diagnose the skin cancer are demonstrated with recent updates. However, every system equally shares the advantages and disadvantages in all aspects. We found that the use of TBP surveillance is must in skin lesions and dysplastic nevi which show the result but these results vary according to the experience of the doctor that lead to misinterpretation in some cases while differentiating BCC and melanoma. Also, the age of onset and frequency at which it should be performed remains unclear. This makes limited data to diagnose. Some studies show that there was no evidence in practicing photography as a screening tool in the United States by the dermatologists; instead, they prefer a dermoscopy. A handheld dermoscope is implemented in dermoscopy that provides at least 10-fold magnification of the skin lesions, and almost all primary cares adopt this mode of diagnosing. And no study reported that the survival of melanoma has increased due to dermoscopy evolution. This is mainly due to the same fact that the result varies according to the experience of physician that makes less trust in public towards the clinical screening. As far as the reviews from several abstracts, this could be changed by using a combination of both photography and dermoscopy in heterogeneous aspects that resolves all cons of the conventional techniques and provide an accurate result. The efficiency of the results is based on the usage of algorithms, devices, training and practitioner's experience.
Nowadays to avoid false positive results dermatologist use confocal laser scanning microscopy which aid in the assessment of skin lesions by providing high resolution, high sensitivity, high specificity images that are similar to the histopathological images. The only downside of this technique is the high cost that could not be undertaken or affordable by economically backward people. Unlike other techniques, this is unique which is not engaged in comparison with other techniques (dermoscopy) trials to prove the accuracy of results. However, the reported outcomes were mainly focused on the lesion characterizations of CSLM and its test accuracy. Also, imaging modalities like high-frequency sonography, confocal microscopy and OCT have limited availability and are usually found in research units and selected dermatology departments. They are predominantly practiced on an experimental and research basis. Despite their limitations, these high-resolution techniques can give us valuable information on superficial BCC. Nevertheless, awareness of their penetration intricacies must be kept in mind because they may leave cancerous lesions that affect the lower dermis and deeper layers out of their fields of view. Many other modalities like high-frequency ultrasound sonography, PDD, Raman spectroscopy, fluorescence spectroscopy and THz spectroscopy are still in limited practice in case of skin cancer detection. Techniques like thermography which needs optimum instrumentation for the recording purpose and widely affected by the external noise though it provides a thermogram at high resolution. In case of MPLSM, bio-electrical impedance, OCT, tape stripping, multispectral imaging and fully automated computer-based analysis are considered as investigational that need clinical approval in different usage modalities. Also there are not much evidences or trials undertaken to prove the accuracy with conventional histological determination.
Future directions
The delay of implementing dermoscopy widely in the hospital and other healthcare is due to the lack of training among the physicians. This made an adverse impact in getting such product to the market field. However, usage of higher end resolution camera and instrumentation set up must provide a better result that is indirectly failed to achieve due to insufficient training. Thus proper training, knowledge and experience sharing of practitioners are must for better diagnosis. The use of computer-aided diagnosis in finding the skin lesions could be furtherly enhanced using various pre-processing techniques and segmentation method that would be more informative and satisfying the needs. It is the need for analyzing various attributes and can also be included in dermoscopic techniques so that it is easier to link with computer-aided analysis. The optical methods like OCT and PDD are still under investigation stages; this could be improved by defining the borders of suspicious lesions particularly in non-melanoma skin cancer and the common skin disorders. Further exploration is required in using the laser for detecting melanoma.
The features of the future systems should be (i) low cost, (ii) compact and portable, (iii) less diagnosis time, (iv) comfortable (no biopsy), (v) high sensitivity and accuracy. Combination of multiple techniques should be explored for high-quality output and accuracy. Clinicians, researchers and practitioners should step forward towards arriving at a standard protocol and knowledge sharing database, thus help in providing better healthcare relating to skin cancer.
Conflicts of interest
There are no conflicts to declare.
Abbreviations
| Acc | Accuracy |
| BCC | Basal cell skin cancer |
| CNN | Convolutional neural network |
| MSOT | Multi-spectral optoacoustic tomography |
| MPT | Multi photon tomography |
| OCT | Optical coherence tomography |
| ODT | Optical doppler tomography |
| PDT | Photodynamic therapy |
| PAI | Photoacoustic imaging |
| PDD | Photodynamic diagnosis |
| RCM | Reflectance confocal microscopy |
| Res | Resolution |
| Se | Sensitivity |
| Sp | Specificity |
| SCC | Squamous cell carcinoma |
| THz | Tetrahertz |
| TBP | Total body photography |
| TPI | Tetrahertz pulsed imaging |
Acknowledgements
PDF scholarship conferred to V. N. by University Malaysia Pahang is gratefully acknowledged.
References
- American Academy of Dermatology, www.aad.org.
-
G. C. C. Lim, S. Rampal and H. Yahaya, Cancer Incidence in Peninsular Malaysia, 2003–2005: The Third Report of the National Cancer Registry, Malaysia, National Cancer Registry, 2008 Search PubMed.
- J. Sng, D. Koh, W. C. Siong and T. B. Choo, J. Am. Acad. Dermatol., 2009, 61, 426–432 CrossRef.
-
G. Jemec, Dermatologic ultrasound with clinical and histologic correlations, Springer Science & Business Media, 2013 Search PubMed.
- D. Didona, G. Paolino, U. Bottoni and C. Cantisani, Biomedicines, 2018, 6, 6 CrossRef.
- A. I. Rubin, E. H. Chen and D. Ratner, N. Engl. J. Med., 2005, 353, 2262–2269 CrossRef CAS.
-
Cancer Stat Facts, Melanoma of the Skin, https://seer.cancer.gov/statfacts/html/melan.html, (accessed 28/03/2018, 2018) Search PubMed.
-
Skin Cancer, https://www.webmd.com/melanoma-skin-cancer/guide/skin-cancer#1, (accessed 02/03/2018, 2018).
- V. Gray-Schopfer, C. Wellbrock and R. Marais, Nature, 2007, 445, 851 CrossRef CAS.
- S. Bellew, J. Q. Del Rosso and G. K. Kim, J. Clin. Aesthet. Dermatol., 2009, 2, 34 Search PubMed.
- B. Stewart and C. P. Wild, Health, 2017, 496 Search PubMed.
-
S. K. Parsons, J. A. Chan, W. Y. Winifred, N. Obadan, S. J. Ratichek, J. Lee, S. Sen and S. Ip, Noninvasive Diagnostic Techniques for the Detection of Skin Cancers, Comparative Effectiveness Technical Briefs, No. 11, Tufts University Evidence-based Practice Center, Rockville (MD): Agency for Healthcare Research and Quality (US), 2011, report no.: 11-EHC085-EF Search PubMed.
- R. R. Anderson and J. A. Parrish, J. Invest. Dermatol., 1981, 77, 13–19 CrossRef CAS.
-
R. R. Alfano, US5042494A, 1991.
- R. Richards-Kortum and E. Sevick-Muraca, Annu. Rev. Phys. Chem., 1996, 47, 555–606 CrossRef CAS.
- C. Fritsch, K. Lang, W. Neuse, T. Ruzicka and P. Lehmann, Skin Pharmacol. Physiol., 1998, 11, 358–373 CrossRef CAS.
- K. Hoffmann, J. Jung, S. El Gammal and P. Altmeyer, Dermatology, 1992, 185, 49–55 CrossRef CAS.
- D. Kamat, A. P. Chavan and P. Patil, International Journal of Application or Innovation in Engineering & Management, 2014, 3(2), 92 Search PubMed.
- C. Herman and M. P. Cetingul, J. Visualized Exp., 2011, e2679 Search PubMed.
- L. T. Dengel, G. R. Petroni, J. Judge, D. Chen, S. T. Acton, A. T. Schroen and C. L. Slingluff, Int. J. Dermatol., 2015, 54, 1250–1254 CrossRef.
- J. F. Altman, S. A. Oliveria, P. J. Christos and A. C. Halpern, Archives of family medicine, 2000, 9, 1022 CrossRef CAS.
- D. L. Phelan, S. A. Oliveria, P. J. Christos, S. W. Dusza and A. C. Halpern, Oncol. Nurs. Forum, 2003, 30(6), 1029–1036 CrossRef.
- R. J. Drugge, C. Nguyen, E. D. Drugge, L. Gliga, P. A. Broderick, S. A. McClain and C. C. Brown, Dermatol. Online J., 2009, 15, 1 Search PubMed.
- N. E. Feit, S. W. Dusza and A. A. Marghoob, Br. J. Dermatol., 2004, 150, 706–714 CrossRef CAS.
- M. Rajab, M. Woolfson and S. Morgan, Comput. Med. Imag. Grap., 2004, 28, 61–68 CrossRef CAS.
- S. Jain and N. Pise, Procedia. Comput. Sci., 2015, 48, 735–740 CrossRef.
- A. N. Hoshyar, A. Al-Jumaily and A. N. Hoshyar, Procedia. Comput. Sci., 2014, 42, 25–31 CrossRef.
- R. Sumithra, M. Suhil and D. Guru, Procedia. Comput. Sci., 2015, 45, 76–85 CrossRef.
- P. Mehta and B. Shah, Procedia. Comput. Sci., 2016, 85, 309–316 CrossRef.
- C. Lu, M. Mahmood, N. Jha and M. Mandal, IEEE J. Biomed. Health Inform., 2013, 17, 284–296 Search PubMed.
- M. A. H. Bhuiyan, I. Azad and M. K. Uddin, Int. J. Sci. Eng. Res., 2013, 4, 1–6 Search PubMed.
-
S. Chatterjee, D. Dey and S. Munshi, Mathematical morphology aided shape, texture and colour feature extraction from skin lesion for identification of malignant melanoma, International Conference on Condition Assessment Techniques in Electrical Systems (CATCON), 2013 Search PubMed.
- A. Pennisi, D. D. Bloisi, D. Nardi, A. R. Giampetruzzi, C. Mondino and A. Facchiano, Comput. Med. Imag. Grap., 2016, 52, 89–103 CrossRef.
-
J. A. Jaleel, S. Salim and R. Aswin, Computer Aided Detection of Skin Cancer, International Conference on Circuits, Power and Computing Technologies (ICCPCT), 2013 Search PubMed.
- M. Elbaum, Dermatol. Clin., 2002, 20, 735–747 CrossRef.
- P. Schmid-Saugeona, J. Guillodb and J.-P. Thirana, Comput. Med. Imag. Grap., 2003, 27, 65–78 CrossRef.
- R. Garnavi, M. Aldeen and J. Bailey, IEEE Trans. Inf. Technol. Biomed., 2012, 16, 1239–1252 Search PubMed.
-
C. Doukas, P. Stagkopoulos, C. T. Kiranoudis and I. Maglogiannis, Automated skin lesion assessment using mobile technologies and cloud platforms, Annual International Conference of the IEEE Engineering in Medicine and Biology Society, 2012 Search PubMed.
-
A. Karargyris, O. Karargyris and A. Pantelopoulos, DERMA/Care: An Advanced image-Processing Mobile Application for Monitoring Skin Cancer, IEEE 24th International Conference on Tools with Artificial Intelligence, 2012 Search PubMed.
- J. A. Wolf, J. F. Moreau, O. Akilov, T. Patton, J. C. English, J. Ho and L. K. Ferris, JAMA Dermatol., 2013, 149, 422–426 CrossRef.
- A. Masood and A. Ali Al-Jumaily, Int. J. Biomed. Imaging, 2013, 2013, 1–22 CrossRef.
-
A. Das, T. Swedish, A. Wahi, M. Moufarrej, M. Noland, T. Gurry, E. Aranda-Michel, D. Aksel, S. Wagh and V. Sadashivaiah, Mobile phone based mini-spectrometer for rapid screening of skin cancer, Next-Generation Spectroscopic Technologies VIII, 2015, Proceedings vol. 9482, 94820M Search PubMed.
- P. Giri and K. Saravanakumar, Oriental Journal of Computer Science and Technology, 2017, 10, 391–399 CrossRef.
- R. R. Anderson, Arch. Dermatol., 1991, 127, 1000–1005 CrossRef CAS.
- S. W. Menzies, Dermatol. Ther., 2006, 19, 32–39 CrossRef.
- J. Risser, Z. Pressley, E. Veledar, C. Washington and S. C. Chen, J. Am. Acad. Dermatol., 2007, 57, 428–434 CrossRef.
- G. Salerni, C. Carrera, L. Lovatto, R. M. Martí-Laborda, G. Isern, J. Palou, L. Alós, S. Puig and J. Malvehy, J. Am. Acad. Dermatol., 2012, 67, 836–845 CrossRef.
- E. D. Drugge, E. R. Volpicelli, R. M. Sarac, S. R. Strang, D. M. Elston and R. J. Drugge, J. Am. Acad. Dermatol., 2018, 78, 182–183 CrossRef.
- W. H. Green, S. Q. Wang and A. B. Cognetta, Arch. Dermatol., 2009, 145, 910–915 Search PubMed.
- A. Steiner, H. Pehamberger and K. Wolff, J. Am. Acad. Dermatol., 1987, 17, 584–591 CrossRef CAS.
- H. Lorentzen, K. Weismann, C. S. Petersen, F. Grønhøj Larsen, L. Secher and V. Skødt, Acta Derm.-Venereol., 1999, 79, 301–304 CrossRef CAS.
- G. Argenziano and H. P. Soyer, Lancet Oncol., 2001, 2, 443–449 CrossRef CAS.
- A. Herschorn, Can. Fam. Physician, 2012, 58, 740–745 Search PubMed.
- M.-L. Bafounta, A. Beauchet, P. Aegerter and P. Saiag, Arch. Dermatol., 2001, 137, 1343–1350 CAS.
- W. Stolz, R. Schiffner and W. H. Burgdorf, Clin. Dermatol., 2002, 20, 276–278 CrossRef.
- H. P. Soyer, G. Argenziano, S. Chimenti and V. Ruocco, Eur. J. Dermatol., 2001, 11, 270–276 CAS.
- G. Pagnanelli, H. Soyer, G. Argenziano, R. Talamini, R. Barbati, L. Bianchi, E. Campione, I. Carboni, A. Carrozzo and M. Chimenti, Br. J. Dermatol., 2003, 148, 698–702 CrossRef CAS.
- G. Argenziano, I. Zalaudek, R. Corona, F. Sera, L. Cicale, G. Petrillo, E. Ruocco, R. Hofmann-Wellenhof and H. P. Soyer, Arch. Dermatol., 2004, 140, 1485–1489 Search PubMed.
- R. P. Braun, H. S. Rabinovitz, M. Oliviero, A. W. Kopf and J.-H. Saurat, J. Am. Acad. Dermatol., 2005, 52, 109–121 CrossRef PubMed.
- G. Argenziano, S. Puig, I. Zalaudek, F. Sera, R. Corona, M. Alsina, F. Barbato, C. Carrera, G. Ferrara and A. Guilabert, J. Clin. Oncol., 2006, 24, 1877–1882 CrossRef.
- B. Erkol, R. H. Moss, R. Joe Stanley, W. V. Stoecker and E. Hvatum, Skin. Res. Technol., 2005, 11, 17–26 CrossRef.
- M. Emre Celebi, Y. Alp Aslandogan, W. V. Stoecker, H. Iyatomi, H. Oka and X. Chen, Skin. Res. Technol., 2007, 13, 454–462 CrossRef CAS.
- M. Emre Celebi, H. A. Kingravi, H. Iyatomi, Y. Alp Aslandogan, W. V. Stoecker, R. H. Moss, J. M. Malters, J. M. Grichnik, A. A. Marghoob and H. S. Rabinovitz, Skin. Res. Technol., 2008, 14, 347–353 CrossRef.
- M. Sadeghi, M. Razmara, T. K. Lee and M. S. Atkins, Comput. Med. Imag. Grap., 2011, 35, 137–143 CrossRef.
- Q. Abbas, M. E. Celebi, I. Fondón García and M. Rashid, Skin. Res. Technol., 2011, 17, 91–100 CrossRef PubMed.
- P. Rubegni, P. Sbano, M. Burroni, G. Cevenini, C. Bocchi, F. M. Severi, M. Risulo, F. Petraglia, G. Dell'Eva and M. Fimiani, Skin. Res. Technol., 2007, 13, 143–147 CrossRef.
- M. E. Celebi, H. Iyatomi, G. Schaefer and W. V. Stoecker, Comput. Med. Imag. Grap., 2009, 33, 148–153 CrossRef.
- M. C. Fargnoli, D. Kostaki, A. Piccioni, T. Micantonio and K. Peris, Eur. J. Dermatol., 2012, 22, 456–463 Search PubMed.
- M. Sadeghi, T. K. Lee, D. McLean, H. Lui and M. S. Atkins, IEEE Trans. Med. Imaging., 2013, 32, 849–861 Search PubMed.
- A. Esteva, B. Kuprel, R. A. Novoa, J. Ko, S. M. Swetter, H. M. Blau and S. Thrun, Nature, 2017, 542, 115 CrossRef CAS.
- F. Kaliyadan, Indian Dermatol. Online. J., 2016, 7, 359 CrossRef PubMed.
- A. Srivastava, B. Hughes, L. Hughes and J. Woodcock, Br. J. Surg., 1986, 73, 790–792 CrossRef CAS.
- L. Serrone, F. Solivetti, M. Thorel, L. Eibenschutz, P. Donati and C. Catricala, Melanoma Res., 2002, 12, 287–290 CrossRef CAS.
- C. Harland, S. Kale, P. Jackson, P. Mortimer and J. Bamber, Br. J. Dermatol., 2000, 143, 281–289 CrossRef CAS.
- C. Speed, Rheumatology, 2001, 40, 1331–1336 CrossRef CAS.
- A. Taruttis and V. Ntziachristos, Nat. Photonics, 2015, 9, 219 CrossRef CAS.
- K. S. Valluru, K. E. Wilson and J. K. Willmann, Radiology, 2016, 280, 332–349 CrossRef.
- M. Xu and L. V. Wang, Rev. Sci. Instrum., 2006, 77, 041101 CrossRef.
- S. Mallidi, G. P. Luke and S. Emelianov, Trends Biotechnol., 2011, 29, 213–221 CrossRef CAS.
- V. Ntziachristos and D. Razansky, Chem. Rev., 2010, 110, 2783–2794 CrossRef CAS.
- L. V. Wang and S. Hu, science, 2012, 335, 1458–1462 CrossRef CAS.
- S. Zackrisson, S. Van De Ven and S. Gambhir, Cancer Res., 2014, 74, 979–1004 CrossRef CAS.
- D. Rallan and C. Harland, Clin. Exp. Dermatol., 2003, 28, 632–638 CrossRef CAS.
- T. Cammarota, F. Pinto, A. Magliaro and A. Sarno, Eur. J. Radiol., 1998, 27, S215–S223 CrossRef.
- A. K. Gupta, D. H. Turnbull, F. S. Foster, K. A. Harasiewicz, D. T. Shum, R. Prussick, G. N. Watteel, L. N. Hurst and D. N. Sauder, Dermatol. Surg., 1996, 22, 131–136 CAS.
- S. El Gammal, C. El Gammal, K. Kaspar, C. Pieck, P. Altmeyer, M. Vogt and H. Ermert, J. Invest. Dermatol., 1999, 113, 821–829 CrossRef CAS.
- B. Bessoud, N. Lassau, S. Koscielny, C. Longvert, M.-F. Avril, P. Duvillard, V. Rouffiac, J. Leclère and A. Roche, Ultrasound Med. Biol., 2003, 29, 875–879 CrossRef.
- D. Jasaitiene, S. Valiukeviciene, G. Linkeviciute, R. Raisutis, E. Jasiuniene and R. Kazys, J. Eur. Acad. Dermatol. Venereol., 2011, 25, 375–382 CrossRef CAS.
- M.-H. Schmid-Wendtner and W. Burgdorf, Arch. Dermatol., 2005, 141, 217–224 Search PubMed.
- D. S. Rigel, J. Russak and R. Friedman, Ca-Cancer J. Clin., 2010, 60, 301–316 CrossRef.
- X. Wortsman, Radiology Research and Practice, 2012, 2012, 814396 CrossRef.
- D. DiGiacinto, J. Bagley and A. M. Goldsbury, Journal of Diagnostic Medical Sonography, 2016, 32, 140–146 CrossRef.
- X. Wortsman, J. Ultrasound Med., 2012, 31, 97–111 CrossRef.
- X. Wortsman, J. Ultrasound Med., 2013, 32, 567–572 CrossRef.
- X. Wortsman, P. Vergara, A. Castro, D. Saavedra, F. Bobadilla, I. Sazunic, V. Zemelman and J. Wortsman, J. Eur. Acad. Dermatol. Venereol., 2015, 29, 702–707 CrossRef CAS.
- C. Voit, T. Mayer, T. M. Proebstle, L. Weber, M. Kron, M. Krupienski, U. Zeelen, W. Sterry and A. Schoengen, Cancer Cytopathology, 2000, 90, 186–193 CrossRef CAS.
- C. Voit, A. Schoengen, M. Schwürzer-Voit, L. Weber, J. Ulrich, W. Sterry and T. M. Proebstle, Semin. Oncol., 2002, 29(4), 353–360 CrossRef.
- G. Schäfer-Hesterberg, A. Schoengen, W. Sterry and C. Voit, Expert. Rev. Anticancer. Ther., 2007, 7, 1707–1716 CrossRef.
- A. Blum, M.-H. Schmid-Wendtner, V. Mauss-Kiefer, J. Y. Eberle, C. Kuchelmeister and D. Dill-Müller, Dermatology, 2006, 212, 47–52 CrossRef.
- A. Gerger, S. Koller, W. Weger, E. Richtig, H. Kerl, H. Samonigg, P. Krippl and J. Smolle, Cancer, 2006, 107, 193–200 CrossRef.
- J. Malvehy and G. Pellacani, Acta Derm.-Venereol., 2017, 97, 22–30 Search PubMed.
- G. Pellacani, P. Pepe, A. Casari and C. Longo, Br. J. Dermatol., 2014, 171, 1044–1051 CrossRef CAS.
- G. Pellacani, A. M. Cesinaro and S. Seidenari, Modern pathology, 2005, 18, 469 CrossRef.
- H. Y. Kang, P. Bahadoran, I. Suzuki, D. Zugaj, A. Khemis, T. Passeron, P. Andres and J. P. Ortonne, Experimental dermatology, 2010, 19, e228–e233 CrossRef.
-
N. Brahimi and P. Guitera, in Pigmentary Skin Disorders, Springer, 2018, pp. 93–106 Search PubMed.
-
H. Zeng, Z. Wu, Y. Tian, H. Wang, A. Lee, J. Zhao, S. Tang, D. McLean, S. Kalia and H. Lui, Microscopy Histopathology and Analytics, in Proceedings Biophotonics Congress: Biomedical Optics Congress 2018 (Microscopy/Translational/Brain/OTS), Part of OSA Biophotonics Congress: Biomedical Optics, Hollywood, Florida, United States, 3–6 April 2018 Search PubMed.
- V. Ahlgrimm-Siess, M. Laimer, H. S. Rabinovitz, M. Oliviero, R. Hofmann-Wellenhof, A. A. Marghoob and A. Scope, Current Dermatology Reports, 2018, 7(2), 105–118 CrossRef.
-
N. Iftimia, W. R. Brugge and D. X. Hammer, Advances in Optical Imaging for Clinical Medicine, John Wiley & Sons, 2011 Search PubMed.
- A. N. Yaroslavsky, J. G. Barbosa, V. Neel, C. A. DiMarzio and R. R. Anderson, J. Biomed. Opt., 2005, 10, 014011 CrossRef PubMed.
- S. K. T. Que, J. M. Grant-Kels, H. S. Rabinovitz, M. Oliviero and A. Scope, Dermatol. Clin., 2016, 34, 469–475 CrossRef CAS.
-
Confocal microscopy
https://www.jic.ac.uk/microscopy/more/T5_8.htm, (accessed 28/03/2018, 2018).
- M. Rajadhyaksha, A. Marghoob, A. Rossi, A. C. Halpern and K. S. Nehal, Lasers Surg. Med., 2017, 49, 7–19 CrossRef.
-
E. Flores, O. Yelamos, M. Cordova, K. Kose, W. Phillips, A. Rossi, K. Nehal and M. Rajadhyaksha, 2017.
- F. Ferrari, S. Bassoli, G. Pellacani, G. Argenziano, A. M. Cesinaro and C. Longo, Dermatology, 2017, 233 CrossRef PubMed.
-
C. Chiaverini, F. Le Duff, A. Deville, N. Cardot-Leccia, J. Lacour and P. Bahadoran, Br. J. Dermatol., 2018 Search PubMed.
- H. Lui, J. Zhao, D. McLean and H. Zeng, Cancer Res., 2012, 72, 2491–2500 CrossRef CAS PubMed.
- I. A. Bratchenko, V. P. Sherendak, O. O. Myakinin, D. N. Artemyev, A. A. Moryatov, E. Borisova, L. Avramov, L. A. Zherdeva, A. E. Orlov and S. V. Kozlov, J. Biomed. Photonics. Eng., 2018, 010301 CrossRef.
-
E. Borisova, T. Genova-Hristova, P. Troyanova, E. Pavlova, I. Terziev, O. Semyachkina-Glushkovskaya, M. Lomova, E. Genina, G. Stanciu and D. Tranca, Multispectral detection of cutaneous lesions using spectroscopy and microscopy approaches, Photonics in Dermatology and Plastic Surgery 2018, SPIE BiOS, San Francisco, California, United States, 2018, Proceedings vol. 10467, 104670M, DOI:10.1117/12.2289119.
- S. Sigurdsson, P. A. Philipsen, L. K. Hansen, J. Larsen, M. Gniadecka and H.-C. Wulf, IEEE Trans. Biomed. Eng., 2004, 51, 1784–1793 CrossRef.
- M. Gniadecka, H. C. Wulf, O. F. Nielsen, D. H. Christensen and J. Hercogova, Photochem. Photobiol., 1997, 66, 418–423 CrossRef CAS.
- M. Gniadecka, H. Wulf, N. N. Mortensen, O. F. Nielsen and D. H. Christensen, J. Raman Spectrosc., 1997, 28, 125–129 CrossRef CAS.
- B. Schrader, B. Dippel, S. Fendel, S. Keller, T. Löchte, M. Riedl, R. Schulte and E. Tatsch, J. Mol. Struct., 1997, 408, 23–31 CrossRef.
- S. Fendel and B. Schrader, Fresenius' J. Anal. Chem., 1998, 360, 609–613 CrossRef CAS.
-
A. A. Martin, R. A. B. Carter, L. de Oliveira Nunes, E. A. L. Arisawa and L. Silveira, Principal components analysis of FT-Raman spectra of ex vivo basal cell carcinoma, Biomedical Vibrational Spectroscopy and Biohazard Detection Technologies, Biomedical Optics 2004, San Jose, CA, United States, 2004, Proceedings vol. 5321, DOI:10.1117/12.528239.
-
J. Zhao, H. Lui, D. I. McLean and H. Zeng, Real-time raman spectroscopy for non-invasive skin cancer detection – preliminary results, 30th Annual International Conference of the IEEE Engineering in Medicine and Biology Society, 2008 Search PubMed.
- C. A. Lieber, S. K. Majumder, D. L. Ellis, D. D. Billheimer and A. Mahadevan-Jansen, Lasers Surg. Med., 2008, 40, 461–467 CrossRef.
- L. Silveira, F. L. Silveira, R. A. Zângaro, M. T. Pacheco and B. Bodanese, J. Biomed. Opt., 2012, 17, 077003 CrossRef.
- D. J. Carpenter, M. B. Sajisevi, N. Chapurin, C. S. Brown, T. Cheng, G. M. Palmer, D. S. Stevenson, C. L. Rao, R. P. Hall and C. R. Woodard, Lasers Surg. Med., 2018, 1–7 Search PubMed.
- J. Sandby-Møller, T. Poulsen and H. C. Wulf, Photochem. Photobiol., 2003, 77, 616–620 CrossRef.
- J. Sandby-Møller, E. Thieden, P. Philipsen, J. Heydenreich and H. Wulf, Photodermatol., Photoimmunol. Photomed., 2004, 20, 33–40 CrossRef.
-
I. Bratchenko, Y. A. Kristoforova, O. Myakinin, D. Artemyev, S. Kozlov, A. Moryatov and V. Zakharov, Fluorescence spectroscopy for neoplasms control, Biophotonics: Photonic Solutions for Better Health Care V, SPIE Photonics Europe, Brussels, Belgium, 2016, Proceedings vol. 9887, 98870Y, DOI:10.1117/12.2227610.
-
E. Borisova, A. Zhelyazkova, T. Genova, P. Troyanova, E. Pavlova, N. Penkov and L. Avramov, Autofluorescence spectroscopy techniques for skin cancer diagnostics, 2016 International Conference Laser Optics (LO), IEEE, St. Petersburg, Russia, 2016 Search PubMed.
-
R. R. Alfano, B. Das and G. Tang, Method and apparatus for distinguishing cancerous tissue from benign tumor tissue, benign tissue or normal tissue using native fluorescence, US5131398A, 1992.
-
S. G. Vari and W. S. Grundfest, Method for determining the biodistribution of substances using fluorescence spectroscopy, US5377676A, 1995.
- H. Sterenborg, M. Motamedi, R. Wagner, M. Duvic, S. Thomsen and S. Jacques, Lasers. Med. Sci., 1994, 9, 191–201 CrossRef.
- W.-H. Boehncke, K. König, R. Kaufmann, W. Scheffold, O. Prümmer and W. Sterry, Arch. Dermatol. Res., 1994, 286, 300–303 CrossRef CAS.
-
S. G. Vari, T. Papazoglou and W. S. Grundfest, Apparatus and method of use for a photosensitizer enhanced fluorescence based biopsy needle, US5318023A, 1994.
-
T. Vo-Dinh, M. Panjehpour and B. F. Overholt, Laser-induced differential normalized fluorescence method for cancer diagnosis, US5579773A, 1996.
- L. Brancaleon, A. J. Durkin, J. H. Tu, G. Menaker, J. D. Fallon and N. Kollias, Photochem. Photobiol., 2001, 73, 178–183 CrossRef CAS.
- A. Yaroslavsky, V. Neel and R. Anderson, Opt. Lett., 2004, 29, 2010–2012 CrossRef CAS.
- P. De Beule, C. Dunsby, N. Galletly, G. Stamp, A. Chu, U. Anand, P. Anand, C. Benham, A. Naylor and P. French, Rev. Sci. Instrum., 2007, 78, 123101 CrossRef CAS.
- S. Wang, J. Zhao, H. Lui, Q. He and H. Zeng, Skin. Res. Technol., 2013, 19, 20–26 CrossRef.
- K. Kong, C. J. Rowlands, S. Varma, W. Perkins, I. H. Leach, A. A. Koloydenko, H. C. Williams and I. Notingher, Proc. Natl. Acad. Sci., 2013, 110, 15189–15194 CrossRef CAS.
- X. Zhang, A. Fales and T. Vo-Dinh, Sensors, 2015, 15, 21746–21759 CrossRef CAS PubMed.
- C. de Paula Campos, D. A. Camila de Paula, M. S. Nogueira, L. T. Moriyama, S. Pratavieira and C. Kurachi, Photodiagn. Photodyn. Ther., 2017, 20, 21–27 CrossRef PubMed.
- R. Woodward, V. Wallace, D. Arnone, E. Linfield and M. Pepper, J. Biol. Phys., 2003, 29, 257–259 CrossRef CAS.
- K. I. Zaytsev, K. G. Kudrin, I. V. Reshetov, A. A. Gavdush, N. V. Chernomyrdin, V. E. Karasik and S. O. Yurchenko, J. Phys.: Conf. Ser., 2015, 584, 012023 CrossRef.
- M. Ney and I. Abdulhalim, J. Biomed. Opt., 2015, 20, 125007 CrossRef.
- I. Kašalynas, R. Venckevičius, L. Minkevičius, A. Sešek, F. Wahaia, V. Tamošiūnas, B. Voisiat, D. Seliuta, G. Valušis and A. Švigelj, Sensors, 2016, 16, 432 CrossRef.
- S.-G. Park, K. H. Jin, M. Yi, J. C. Ye, J. Ahn and K.-H. Jeong, ACS Nano, 2012, 6, 2026–2031 CrossRef CAS.
- N. T. Yardimci, S. Cakmakyapan, S. Hemmati and M. Jarrahi, Sci. Rep., 2017, 7, 4166 CrossRef.
- K. Moldosanov, A. Postnikov, V. Lelevkin and N. Kairyev, Ferroelectrics, 2017, 509, 158–166 CrossRef CAS.
- C. S. Joseph, A. N. Yaroslavsky, V. A. Neel, T. M. Goyette and R. H. Giles, Lasers Surg. Med., 2011, 43, 457–462 CrossRef.
- X. Yang, X. Zhao, K. Yang, Y. Liu, Y. Liu, W. Fu and Y. Luo, Trends Biotechnol., 2016, 34, 810–824 CrossRef CAS PubMed.
-
M. Shur, Fundamental & Applied Problems of Terahertz Devices and Technologies: Selected Papers from the Russia-Japan-USA Symposium (RJUS TeraTech-2014) 17–21 June 2014, New York, USA, World Scientific, 2015 Search PubMed.
- M. R. Grootendorst, A. J. Fitzgerald, S. G. B. de Koning, A. Santaolalla, A. Portieri, M. Van Hemelrijck, M. R. Young, J. Owen, M. Cariati and M. Pepper, Biomed. Opt. Express, 2017, 8, 2932–2945 CrossRef.
- R. I. Stantchev, D. B. Phillips, P. Hobson, S. M. Hornett, M. J. Padgett and E. Hendry, Optica, 2017, 4, 989–992 CrossRef.
- J. M. Schmitt, IEEE J. Sel. Top. Quantum Electron., 1999, 5, 1205–1215 CrossRef CAS.
- M. Ibne Mokbul, J. Med. Eng., 2017, 2017, 1–20 CrossRef.
- R. Wessels, D. De Bruin, D. Faber, T. Van Leeuwen, M. Van Beurden and T. J. Ruers, Lasers Med. Sci., 2014, 29, 1297–1305 CAS.
- M. R. Hee, E. A. Swanson, J. A. Izatt, J. M. Jacobson and J. G. Fujimoto, Opt. Lett., 1993, 18, 950–952 CrossRef CAS.
-
A. M. Sergeev, V. M. Gelikonov, G. V. Gelikonov, F. I. Feldchtein, K. I. Pravdenko, D. V. Shabanov, N. D. Gladkova, V. Pochinko, V. Zhegalov and G. Dmitriev, In vivo optical coherence tomography of human skin microstructure, Biomedical Optoelectronic Devices and Systems II, International Symposium on Biomedical Optics Europe '94, Lille, France, 1994, Proceedings vol. 2328, DOI:10.1117/12.197520.
-
H. Brunner, J. Strohm, M. Hassel and R. W. Steiner, Optical coherence tomography (OCT) of human skin with a slow-scan CCD camera, Photon Propagation in Tissues, Barcelona, Spain, BiOS Europe '95, 1995, Proceedings vol. 2626, DOI:10.1117/12.228675.
- J. Welzel, E. Lankenau, R. Birngruber and R. Engelhardt, J. Am. Acad. Dermatol., 1997, 37, 958–963 CrossRef CAS.
- Y. Pan and D. L. Farkas, J. Biomed. Opt., 1998, 3, 446–456 CrossRef CAS.
- Y. Zhao, Z. Chen, C. Saxer, S. Xiang, J. F. de Boer and J. S. Nelson, Opt. Lett., 2000, 25, 114–116 CrossRef CAS.
- J. Welzel, Skin. Res. Technol., 2001, 7, 1–9 CrossRef CAS.
- M. C. Pierce, J. Strasswimmer, H. Park, B. Cense and J. F. de Boer, J. Biomed. Opt., 2004, 9, 287–292 CrossRef.
- A. Alex, J. Weingast, M. Weinigel, M. Kellner-Höfer, R. Nemecek, M. Binder, H. Pehamberger, K. König and W. Drexler, J. Biophotonics, 2013, 6, 352–362 CrossRef.
- M. A. Calin, S. V. Parasca, R. Savastru, M. R. Calin and S. Dontu, J. Cancer Res. Clin. Oncol., 2013, 139, 1083–1104 CrossRef CAS.
- Y. Su, X. S. Yao, Z. Li, Z. Meng, T. Liu and L. Wang, Biomed. Opt. Express, 2015, 6, 500–513 CrossRef.
- D. Yücel, L. Themstrup, M. Manfredi and G. Jemec, Skin. Res. Technol., 2016, 22, 497–504 CrossRef.
- N. De Carvalho, S. Schuh, N. Kindermann, R. Kästle, J. Holmes and J. Welzel, Skin. Res. Technol., 2018, 24, 145–151 CrossRef CAS.
- M. Ahlström, L. Gjerdrum, H. Larsen, C. Fuchs, A. Sørensen, J. Forman, M. Ågren and M. Mogensen, Skin. Res. Technol., 2018, 24, 65–72 CrossRef.
- A. Varkentin, M. Mazurenka, E. Blumenröther, L. Behrendt, S. Emmert, U. Morgner, M. Meinhardt-Wollweber, M. Rahlves and B. Roth, J. Biophotonics, 2018, e201700288 CrossRef PubMed.
- N. Iftimia, O. Yélamos, C.-S. J. Chen, G. Maguluri, M. A. Cordova, A. Sahu, J. Park, W. Fox, C. Alessi-Fox and M. Rajadhyaksha, J. Biomed. Opt., 2017, 22, 076006 CrossRef.
- D. Kapsokalyvas, N. Bruscino, D. Alfieri, V. de Giorgi, G. Cannarozzo, R. Cicchi, D. Massi, N. Pimpinelli and F. S. Pavone, Opt. Express, 2013, 21, 4826–4840 CrossRef.
- R. M. Levenson and J. R. Mansfield, Cytometry, Part A, 2006, 69, 748–758 CrossRef.
- J. Mansfield, Vet. Pathol., 2014, 51, 185–210 CrossRef CAS.
- N. A. Hagen and M. W. Kudenov, Opt. Eng., 2013, 52, 090901 CrossRef.
-
D. Gutkowicz-Krusin, M. Elbaum, M. Greenebaum, A. Jacobs and A. Bogdan, Systems and methods for the multispectral imaging and characterization of skin tissue, US6081612A, 2000.
- J. Zhang, C.-I. Chang, S. J. Miller and K. A. Kang, Biomed. Instrum. Technol., 2000, 34, 275–282 CAS.
- S. Tomatis, M. Carrara, A. Bono, C. Bartoli, M. Lualdi, G. Tragni, A. Colombo and R. Marchesini, Phys. Med. Biol., 2005, 50, 1675 CrossRef.
- M. Carrara, S. Tomatis, A. Bono, C. Bartoli, D. Moglia, M. Lualdi, A. Colombo, M. Santinami and R. Marchesini, Phys. Med. Biol., 2005, 50, N345 CrossRef.
-
A. P. Dhawan, Method and apparatus for multi-spectral imaging and analysis of skin lesions and biological tissues, US9572494B2, 2017.
-
A. P. Dhawan, B. D'Alessandro, S. Patwardhan and N. Mullani, Multispectral Optical Imaging of Skin-Lesions for Detection of Malignant Melanomas, Annual International Conference of the IEEE Engineering in Medicine and Biology Society 2009, Minneapolis, Minnesota, USA, September 2–6, 2009, DOI:10.1109/IEMBS.2009.5334045.
-
I. Diebele, I. Kuzmina, J. Kapostinsh, A. Derjabo and J. Spigulis, Melanoma-nevus differentiation by multispectral imaging, European Conference on Biomedical Optics 2011, Munich, Germany, 22–26 May 2011, ISBN: 9780819486844, DOI:10.1364/ECBO.2011.80872G.
-
I. Kuzmina, I. Diebele, L. Valeine, D. Jakovels, A. Kempele, J. Kapostinsh and J. Spigulis, Multi-spectral imaging analysis of pigmented and vascular skin lesions: results of a clinical trial, Photonic Therapeutics and Diagnostics VII, SPIE BiOS, San Francisco, California, United States, 2011, Proceedings vol. 7883, 788312, DOI:10.1117/12.887207.
-
I. Diebele, A. Bekina, A. Derjabo, J. Kapostinsh, I. Kuzmina and J. Spigulis, Analysis of skin basalioma and melanoma by multispectral imaging, Biophotonics: Photonic Solutions for Better Health Care III, SPIE Photonics Europe, Brussels, Belgium, 2012, Proceedings vol. 8427, 842732, DOI: 10.1117/12.922301.
- D. S. Rigel, M. Roy, J. Yoo, C. J. Cockerell, J. K. Robinson and R. White, Arch. Dermatol., 2012, 148, 541–543 CrossRef.
-
H. K. Kim, N. Tucker, F. Debernardis and A. H. Hielscher, Melanoma Detection and Characterization with a 6-layered multispectral model, Optics and the Brain 2016, Fort Lauderdale, Florida, United States, 2016, ISBN: 978-1-943580-10-1, DOI:10.1364/CANCER.2016.JTu3A.26.
- X. Delpueyo, M. Vilaseca, S. Royo, M. Ares, L. Rey, F. Sanabria, S. Puig, G. Pellacani, F. N. Lavedán and G. Solomita, Multidisciplinary Digital Publishing Institute, Proceedings, 2017, 1, 701 CrossRef.
- M. Sharma, E. Marple, J. Reichenberg and J. W. Tunnell, Rev. Sci. Instrum., 2014, 85, 083101 CrossRef.
-
M. F. Modest, Radiative heat transfer, Academic press, 2013 Search PubMed.
-
G. Gaussorgues and S. Chomet, Infrared thermography, Springer Science & Business Media, 2012 Search PubMed.
- A. Fitzgerald and J. Berentson-Shaw, N. Z. Med. J., 2012, 125, 80–91 Search PubMed.
- B. Lahiri, S. Bagavathiappan, T. Jayakumar and J. Philip, Infrared Phys. Technol., 2012, 55, 221–235 CrossRef.
- C. Herman, Expert Rev. Dermatol., 2013, 8, 177–184 CrossRef CAS PubMed.
-
O. K. Cho and B. Holzgreve, Process and device for detecting the exchange of heat between the human body and the invented device and its correlation to the glucose concentration in human blood, US5924996A, 1999.
-
K. Goudjil, Skin cancer detection using non-invasive techniques:a review, US5581090A, 1996.
- B. Bohunicky and S. A. Mousa, Nanotechnol., Sci. Appl., 2011, 4, 1 CAS.
- The sKan: a low-cost skin cancer detection device engineered to end misdiagnosis, https://medium.com/dyson/the-skan-a-low-cost-skin-cancer-detection-device-engineered-to-end-misdiagnosis-c9a6beff3546, (accessed 05/03/2018), 2018.
-
N. Kambhatla, D. Kanevsky, W. W. Zadrozny and A. Zlatsin, Medical non-intrusive prevention based on network of embedded systems, US6238337B1, 2001.
- V. Gruev, R. Perkins and T. York, Opt. Express, 2010, 18, 19087–19094 CrossRef CAS PubMed.
-
J. Fraden, Active infrared motion detector and method for detecting movement, US4896039A, 1990.
-
E. Frei and M. Moshitzky, Apparatus for detection of tumors in tissue, US5143079A, 1992.
-
G. J. O'hara, J. J. Korff and P. A. Crill, Body temperature thermometer and method fo measuring human body temperature utilizing calibration mapping, US5293877A, 1994.
- E. Ring and K. Ammer, Physio.l Meas., 2012, 33, R33 CrossRef CAS.
- A. L. Shada, L. T. Dengel, G. R. Petroni, M. E. Smolkin, S. Acton and C. L. Slingluff, J. Surg. Res., 2013, 182, e9–e14 CrossRef.
- M. Bonmarin and F.-A. Le Gal, Comput. Biol. Med., 2014, 47, 36–43 CrossRef PubMed.
- A. M. N. Moustafa, H. H. Muhammed and M. Hassan, Engineering, 2013, 5, 18 CrossRef.
- F. Huber, H. P. Lang, J. Zhang, D. Rimoldi and C. Gerber, Swiss Med. Wkly., 2015, 145, w14092 Search PubMed.
- V. Fioravanti, L. Brandhoff, S. van den Driesche, H. Breiteneder, M. Kitzwögerer, C. Hafner and M. J. Vellekoop, Sensors, 2016, 16, 1659 CrossRef PubMed.
- T. Morimoto, S. Kimura, Y. Konishi, K. Komaki, T. Uyama, Y. Monden, D. Y. Kinouchi and D. T. Iritani, J. Invest. Surg., 1993, 6, 25–32 CrossRef CAS.
- N. Mitsuyama, T. Morimoto, Y. Kinouchi, T. Iritani, T. Sumi, S. Kimura and Y. Monden, Nihon Geka Gakkai zasshi, 1988, 89, 251–255 CAS.
- B. H. Brown, J. Med. Eng. Technol., 2003, 27, 97–108 CrossRef CAS.
- D. G. Beetner, S. Kapoor, S. Manjunath, X. Zhou and W. V. Stoecker, IEEE Trans. Biomed. Eng., 2003, 50, 1020–1025 CrossRef.
-
P. Åberg, Skin cancer as seen by electrical impedance, Institutionen för laboratoriemedicin/Department of Laboratory Medicine, 2004 Search PubMed.
- Y. A. Glickman, O. Filo, M. David, A. Yayon, M. Topaz, B. Zamir, A. Ginzburg, D. Rozenman and G. Kenan, Skin. Res. Technol., 2003, 9, 262–268 CrossRef PubMed.
- P. Aberg, I. Nicander, J. Hansson, P. Geladi, U. Holmgren and S. Ollmar, IEEE Trans. Biomed. Eng., 2004, 51, 2097–2102 CrossRef PubMed.
- P. Åberg, U. Birgersson, P. Elsner, P. Mohr and S. Ollmar, Exp. Dermatol., 2011, 20, 648–652 CrossRef PubMed.
- P. Åberg, P. Geladi, I. Nicander, J. Hansson, U. Holmgren and S. Ollmar, Skin. Res. Technol., 2005, 11, 281–286 CrossRef PubMed.
- S. Hong, K. Lee, U. Ha, H. Kim, Y. Lee, Y. Kim and H.-J. Yoo, IEEE J. Solid-State Circuits, 2015, 50, 245–257 Search PubMed.
- R. P. Braun, J. Mangana, S. Goldinger, L. French, R. Dummer and A. A. Marghoob, Dermatol. Clin., 2017, 35, 489–493 CrossRef CAS.
- P. Mohr, U. Birgersson, C. Berking, C. Henderson, U. Trefzer, L. Kemeny, C. Sunderkötter, T. Dirschka, R. Motley and M. Frohm-Nilsson, Skin. Res. Technol., 2013, 19, 75–83 CrossRef PubMed.
- Y. Yang, J. Wang, G. Yu, F. Niu and P. He, Physiol. Meas., 2006, 27, 1293 CrossRef PubMed.
- N. M. Zain and K. K. Chelliah, Asian Pac. J. Cancer Prev., 2014, 15, 1327–1331 CrossRef PubMed.
- J. Lademann, U. Jacobi, C. Surber, H.-J. Weigmann and J. Fluhr, Eur. J. Pharm. Biopharm., 2009, 72, 317–323 CrossRef CAS.
- W. Wachsman, V. Morhenn, T. Palmer, L. Walls, T. Hata, J. Zalla, R. Scheinberg, H. Sofen, S. Mraz and K. Gross, Br. J. Dermatol., 2011, 164, 797–806 CrossRef CAS PubMed.
- J. K. Patel, S. Konda, O. A. Perez, S. Amini, G. Elgart and B. Berman, Eur. J. Dermatol., 2008, 18, 617–631 Search PubMed.
- K. Rehman and M. H. Zulfakar, Pharm. Res., 2017, 34, 36–48 CrossRef CAS PubMed.
- F. S. G. Praça, W. S. G. Medina, J. O. Eloy, R. Petrilli, P. M. Campos, A. Ascenso and M. V. L. Bentley, Eur. J. Pharm. Sci., 2018, 111, 121–132 CrossRef.
- S. Paliwal, B. H. Hwang, K. Y. Tsai and S. Mitragotri, Eur. J. Pharm. Sci., 2013, 50, 546–556 CrossRef CAS PubMed.
- C. Wassef and B. K. Rao, Int. J. Dermatol., 2013, 52, 1481–1489 CrossRef PubMed.
- W. Wachsman, M. Zapala, D. Udall, A. Paik, T. Hata, L. Walls, R. Wong, N. Schork and S. Chang, Training, 2007, 100, 100 Search PubMed.
-
T. Vogt, Method for detection of melanoma, US7297480B2, 2007.
- P. Berardi and F. Arcangeli, Melanoma Res., 1992, 2, 93–99 CrossRef CAS PubMed.
- N. Lee, A. Scope and H. Rabinovitz, Dermatol. Clin., 2017, 35, 521–524 CrossRef CAS PubMed.
- W. Denk, J. Biomed. Opt., 1996, 1, 296–305 CrossRef CAS PubMed.
- A. Ustione and D. Piston, J. Microsc., 2011, 243, 221–226 CrossRef CAS PubMed.
- K. König, T. Becker, P. Fischer, I. Riemann and K.-J. Halbhuber, Opt. Lett., 1999, 24, 113–115 CrossRef PubMed.
- B. R. Masters, P. So and E. Gratton, Biophys. J., 1997, 72, 2405–2412 CrossRef CAS PubMed.
- B. R. Masters and P. T. So, Opt. Express, 2001, 8, 2–10 CrossRef CAS PubMed.
- E. B. Brown, R. B. Campbell, Y. Tsuzuki, L. Xu, P. Carmeliet, D. Fukumura and R. K. Jain, Nat. Med., 2001, 7, 864 CrossRef CAS PubMed.
- T. P. Padera, B. R. Stoll, P. T. So and R. K. Jain, Mol. Imaging, 2002, 1, 15353500200200004 Search PubMed.
- M. J. Koehler, K. König, P. Elsner, R. Bückle and M. Kaatz, Opt. Lett., 2006, 31, 2879–2881 CrossRef PubMed.
- M. J. Koehler, S. Hahn, A. Preller, P. Elsner, M. Ziemer, A. Bauer, K. König, R. Bückle, J. W. Fluhr and M. Kaatz, Exp. Dermatol., 2008, 17, 519–523 CrossRef PubMed.
- J. Paoli, M. Smedh, A.-M. Wennberg and M. B. Ericson, J. Invest. Dermatol., 2008, 128, 1248–1255 CrossRef CAS PubMed.
- E. Dimitrow, M. Ziemer, M. J. Koehler, J. Norgauer, K. König, P. Elsner and M. Kaatz, J. Invest. Dermatol., 2009, 129, 1752–1758 CrossRef CAS PubMed.
- M. J. Koehler, M. Speicher, S. Lange-Asschenfeldt, E. Stockfleth, S. Metz, P. Elsner, M. Kaatz and K. König, Exp. Dermatol., 2011, 20, 589–594 CrossRef PubMed.
- S. Guo, S. Pfeifenbring, T. Meyer, G. Ernst, F. Eggeling, V. Maio, D. Massi, R. Cicchi, F. S. Pavone and J. Popp, J. Chemom., 2018, 32, e2963 CrossRef.
- J. Paoli, M. Smedh and M. B. Ericson, Semin. Cutaneous Med. Surg., 2009, 28(3), 190–195 CrossRef CAS PubMed.
|
| This journal is © The Royal Society of Chemistry 2018 |
Click here to see how this site uses Cookies. View our privacy policy here. 
 Open Access Article
 This Open Access Article is licensed under a
  *ab,
P.
Padmapriya
c,
A.
Noorasafrin
c,
B.
Pooja
c,
K.
Hema
c,
Al'aina Yuhainis
Firus Khan
d,
K.
Nithyakalyani
c and
Fahmi
Samsuri
b
*ab,
P.
Padmapriya
c,
A.
Noorasafrin
c,
B.
Pooja
c,
K.
Hema
c,
Al'aina Yuhainis
Firus Khan
d,
K.
Nithyakalyani
c and
Fahmi
Samsuri
b