 Open Access Article
Influence of organic phase change materials on the physical and mechanical properties of HDPE and PP polymers
Vasiliki Chalkiaa,
Nikolaos Tachosb,
Pavlos K. Pandisb,
Aris Giannakasb,
Maria K. Koukoub,
Michalis Gr. Vrachopoulosb,
Luis Coelhod,
Athanasios Ladavosc and
Vassilis N. Stathopoulos *a
*a
aLaboratory of Chemistry and Materials Technology, School of Technological Applications, Technological Educational Institute of Sterea Ellada, 34400 Psachna campus, Evia, Greece. E-mail: vasta@teiste.gr; Tel: +30-2228099688
bEnergy and Environmental Research Laboratory, Mechanical Engineering Department, Technological Educational Institute of Sterea Ellada, 34400 Psachna campus, Evia, Greece
cDepartment of Business Administration of Food and Agricultural Enterprises, University of Patras, 30100, Agrinio, Greece
dPolytechnic Institute of Setubal, Center for Energy and Environment Research (CINEA), Portugal
First published on 1st August 2018
Abstract
In this work, the compatibility of four commercially available organic phase change materials, with melting points in the temperature range 44–58 °C and with engineering polymers high density polyethylene (HDPE) and polypropylene (PP), is investigated. These polymers are used for the design and manufacture of hot and cold thermal energy storage tanks or encapsulation media. The study involves interaction of polymer specimens with the four different phase change materials for a period of time up to 40 days under high temperature. The mass change, mechanical strength and properties of the polymers were tested. The wt% uptake reached 6.4 wt% for PP and 5.8 wt% for HDPE. The strength of HDPE is immediately decreased by Day 7 but at a significant level restored after Day 28. No such effect was found for PP. The surface wetting as well as thermal properties measured (DSC) on the specimens provided an insight on the interaction of the absorbed phase change materials with the polymer. An in depth distribution over time was observed with significant decrease in the mechanical strength of the polymers. An epoxy-based resin was also evaluated under the same conditions and is suggested as a protective coating.
1. Introduction
Lately a lot of efforts have been made to enhance sustainable energy development and utilization of renewable energy sources (RES) in building heating and cooling production systems, due to the increased energy consumption and the problems arising from the effects of global warming.1,2 Thermal energy stores can be utilized to store the time dependent solar energy resource and to shift the peak building electric loads for such systems' operation to off-peak hours. Such solutions have been extensively studied in IEA SHC Task 32 and in IEA SHC Task 42.3,4 A compact, modular and active controlled energy storage unit is required to be integrated in such heating/cooling systems. The most attractive solution is the latent heat storage tanks due to their high energy storage density.5,6 This technique uses phase change materials (PCM) where the stored energy amount depends on the latent heat of fusion of the material. The most common phase change in building energy storage systems is the solid–liquid phase change.7,8 In such systems the PCMs used, are classified in organic, inorganic and eutectic group. PCMs, their applications and their thermophysical properties have been studied in the last 10 years.9–18 The organic PCMs, which are carbon based blends, exhibit chemical stability, high latent heat of fusion and their melting point is suitable in heating/cooling systems for the building sector or in defence applications.9–18The latent heat storage tanks used in such systems are classified to two groups: the compact and the encapsulated. In the compact group there are systems where the PCM is contained in unpressurized tanks and a heat exchanger (HE) is immersed, in direct contact with the PCM and exhibit a high volumetric ratio.10,19 In the encapsulated system PCM is encased in small containers that are placed in pressurized tanks where the heat transfer fluid flows around them.20–22 J. Giro-Paloma et al. recently published a review on microencapsulated PCM.23
The most common container material for the compact latent heat storage group is metal because of their availability, price, and manufacturability. Thermal Energy Storage (TES) system must be resistant to corrosion to ensure a suitable working lifetime. Extensive research has been conducted in relation to the corrosion resistance of metal samples such as stainless steel, carbon steel, aluminium and copper in contact with inorganic24–30 mainly but also organic27,31–36 PCMs.
The use of polymer materials is common in the design of latent storage systems with macro-encapsulated PCMs.37 Lately polymers are proposed by many manufacturers for sensible (water) energy storage systems.38,39 Polymer tanks are generally delivered as pre-fabricated modular units with advantages such as low thermal losses due to low conductivity and low weight. The polymer tanks can be easily manufactured with low cost processes. They are recyclable and show excellent corrosion resistance against salt hydrate PCMs. Thus the compact latent heat storage units can be polymer based. However in the design process of such systems it is important to consider not only heat transfer aspects but the compatibility of the plastic to the containing organic PCM. A. Lázaro et al. have reported a compatibility experimental study on a series of organic and inorganic PCMs in low temperature contact with materials such as PP, PET, HDPE, LSPE and LDPE polymers for cold thermal energy storage (CTES) units.27 A thermal cycling was applied to increase the rate of phase change and LSPE showed high mass variations and large deformations. PET and PP were shown to be the best encapsulation materials of the organic PCM while HDPE for the inorganic PCM tested. Browne et al.38 recently investigated the effect of fatty acids, in contact with Perspex after a period of 722 days at 45 °C showing marginal corrosion. Very recently the group of L. Cabeza reported the failure of commercial HDPE spheres encapsulating organic PCM during heating cooling cycles on domestic hot water tank applications.40 PCM leakage was identified and therefore studied the most appropriate implementation according to their thermal behavior and stability. The authors suggested either 25 heating cooling cycles to reach a stable state of the PCM encapsulating HDPE spheres or a suitable coating to be applied on the external surface of the spheres to prevent leakage. A coating was not identified. The PCM used in ref. 40 was also studied in this work.
This work is a compatibility experimental study on four commercially available organic PCMs with melting point in the temperature range 44–58 °C when in contact with engineering polymers: high density polyethylene (HDPE) and polypropylene (PP) which can be used for the design and manufacture of hot and cold thermal energy storage tanks or encapsulation media. The approach involves immersing the polymer specimens in four different PCMs for a period up to 40 days under high temperature. The investigation carried out focus not only in mass change as in most of the previously published papers but also on the mechanical strength and properties of the polymers tested. The surface wetting as well as thermal properties measured on the specimens provided an insight on the interaction of PCMs in the bulk structure. An epoxy-based resin was also evaluated for the same period in contact with the same PCMs.
2. Experimental
2.1. Materials
Two engineering polymers were tested, high density polyethylene (HDPE, specimens denoted as A) – trade name Stemylen E, 0.95g cm−3 – and polypropylene (PP, specimens denoted as B) – trade name Stemylen P, 0.91g cm−3. In the form of 5 mm thick boards purchased by STEMPLAST S.A. Specimens of the required dimensions were cut out of such boards.The Ampreg 21 resin (specimens denoted as R) of Gurit Ltd, UK was also evaluated in contact with phase change materials. Ampreg flat 5 mm thick specimens were prepared after mixing with Ampreg 21 standard hardener, casting and curing.
The four organic phase change materials used are commercially available by PCM Products Ltd with trade names A44, A46 A53, A58 and will be hereafter referred as P44, P46, P53, and P58 respectively. These PCMs contain compounds of C22 to C28 range. Specifically, P44 consists of linear hydrocarbons, P46 and P53 of paraffin waxes and P58 of fatty alcohols [PCM Products ltd data].
2.2. Samples preparation
HDPE and PP 5 mm thick plates of defined dimensions 10 cm × 10 cm were cut and immersed in the PCMs mentioned in Section 2.1, kept at 70 °C.40 These 10 cm × 10 cm × 0.5 cm plates were cut to smaller specimens of the same thickness and used for further testing. Ampreg 21 resin specimens were also prepared after mixing with Ampreg 21 standard hardener, subsequent de-airing, casting and room temperature curing. All specimens when withdrawn from PCM were cleaned by warm water and ethanol to remove any surface PCM residue prior testing and characterization. HDPE (A), PP (B) and Ampreg (R) specimens been in contact with PCMs will be noted hereafter as (polymer)/(PCM in contact). For example, HDPE in contact with P44, PP in contact with P53 and Ampreg 21 resin in contact with P58 are A/P44, B/P53 and R/P58 respectively.2.3. Methods
For the compatibility experiments the ISO standard 175:2010 ‘Plastics – Methods of test for the determination of the effects of immersion in liquid chemicals’ was followed. The latter describes a method of exposing test plastic materials specimens to liquid chemicals. In addition, properties determination methods from such immersion are specified. Therefore, specimens were immersed in all four PCMs and kept till Day 40 at 70 ± 0.5 °C. Specimens were removed on specific checkpoint dates i.e. Day 7, Day 28, Day 40 warm water and ethanol wipe cleaned and their properties were measured and recorded. A comparison was made with the reference specimen of Day 0. Total weight% change was recorded daily from Day 1 till Day 7 and on a weekly basis till Day 40 using a KERN KB 1200-2 balance.| ΔHth = w × ΔHP | (1) |
| X (%) = ΔHobs × w/ΔHstd | (2) |
3. Results and discussion
A significant mass uptake was measured for all sample and PCMs even after a short period in contact of polymer with PCMs (Fig. 1). A faster uptake rate was observed for PCMs with the shortest carbon chain such as P44 for both HDPE and PP reaching almost maximum uptake values even from Day 7. The slowest uptake rate was observed for P58 indicating a correlation of uptake profile to its molecule size and nature as P58 is a C28 fatty alcohol. However, a detailed study is required as P53 and P46 paraffin waxes seem to deviate. In all cases after Day 28 polymers saturate in PCM reaching an uptake plateau.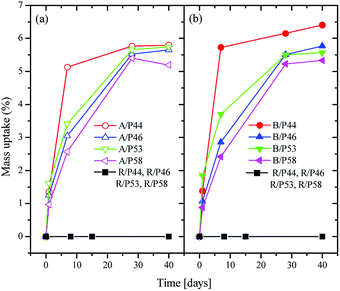 | ||
| Fig. 1 Weight change over time for HDPE samples (a) in left, for PP samples (b) in right and for Ampreg 21 samples in both (a) and (b), in contact with PCMs. | ||
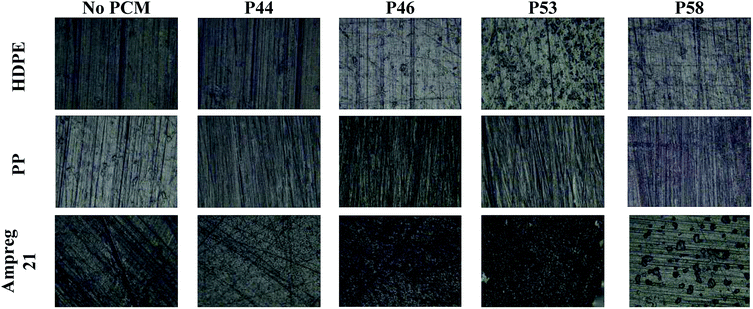
The optical microscopy images (Fig. 2) indicate no major surface variations or microstructural changes among samples. For HDPE in contact with P46 and P53 surface formations can be identified. Ampreg 21 specimen in contact with P58 shows inclusions that are not attributed to PCM but in substrates casting procedure. The high uptake values indicate that PCMs organic molecules tested seem to diffuse from the surface to the bulk structure of HDPE and PP rather than accumulating near or at the surface.
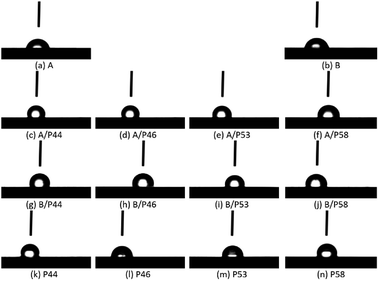
The effect of the PCM on the polymer was investigated both by hardness and contact angle measurements. Contact angle (CA) of water measured over all specimens is summarized in Table 1 and pictures are shown in Fig. 2. For the HDPE and PP specimens in use CA was measured 78° and 81° respectively. When HPDE and PP specimens were removed from PCM the CA values were found significantly higher. Values were found close to pure PCMs CA (Table 1). Namely 107° and 99° measured for HDPE and PP respectively after 40 days of immersion in P44 indicating clearly that the organic molecules of PCMs interact with the polymers (Fig. 3). In non-wipe cleaned HDPE and PP surfaces a PCM film remains. In this case the CA value measured equals to the respective PCM's CA value (Table 1). These findings indicate that after 40 days at 70 °C although organic PCMs are not accumulated on the surface of HDPE and PP specimens they do modify the polymers surface properties. Better insight on the introduced changes can be provided by the hardness test results which provide information to a much larger depth than CA measurements.
| a EtOH wipe cleaned surfaces. | |||||
|---|---|---|---|---|---|
| PCM | No | P44 | P46 | P53 | P58 |
| HDPE | 78° | 107° | 93° | 92° | 91° |
| PP | 81° | 99° | 94° | 87° | 93° |
| Pure PCM | 100° | 87° | 88° | 94° | |
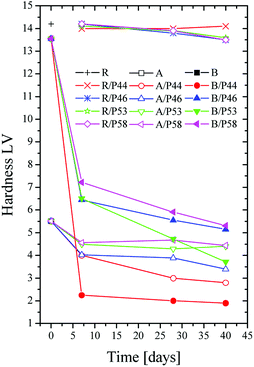
Thus the surface change of HDPE and PP is evident also by the hardness measurements results. However, no such effect is found for Ampreg 21 specimens (Fig. 4). A drastic decrease in hardness values for HDPE and PP samples was observed with in the first days of PCM contact. It is evident that the smaller the organic molecule is the higher and faster the hardness decrease. P44 consisting of C22 linear carbon chain molecules has the strongest effect and P58 of C28 fatty alcohols the least but still very important effect. Both HDPE and PP samples show decrease in hardness values and all PCMs have a significant influence on the hardness of PP. A decrease in hardness of 6 times is observed up to Day 7 by P44. HDPE is affected in similar trend but not so severely as PP. This can be attributed to the high density packed and branching nature of the molecular chains in HDPE structure.
However, considering the profile of the hardness values over time it seems that molecules of PCMs tested disperse rather fast in a significant depth towards the bulk structure of both HDPE and PP rather than accumulating near the surface. Therefore, the major decrease observed is reached by Day 7 and up to Day 40 limited additional changes are detected. No or limited change is noticed on the hardness of the epoxy based Ampreg 21 specimens. These results are in very good agreement with the wt% mass uptake measurements.
Characteristic stress–strain curves for all tested specimens are presented in Fig. 5 while the estimated average values along with the standard deviation of the Young's modulus (E), tensile strength (σuts) and elongation at break (εb) are tabulated in Table 2. Tensile strength and elongation at break point values of HDPE and PP specimens after contact with various PCMs were found decreased. Thus lower Young's modulus (E), tensile strength (σuts) and elongation at break (εb) point values (see Table 2) were estimated for all HDPE (A) and PP (B) tested samples in comparison with corresponding reference HDPE (A0) and PP (B0) specimens. For PP specimens the anti-plasticization effect is more pronounced as it is revealed from the disappearance of the deformation strengthening region in the tail of stress–strain curves. The disappearance or decrease of deformation strengthening curve suggests destroy of a long-range order and formation of hydrogen bonding between polymer chains48,49 and PCMs molecules.
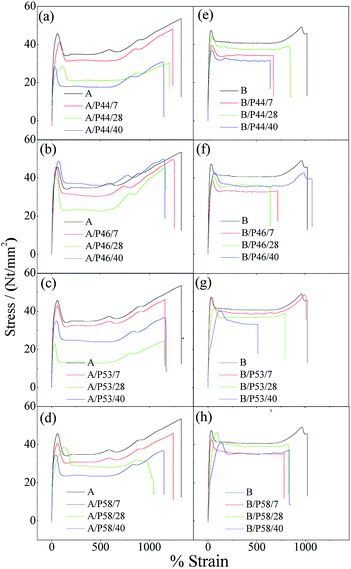 | ||
| Fig. 5 Characteristic stress–strain curves of all tested HDPE (A) and PP (B) specimens. (a) A/P44, (b) A/P46, (c) A/P53, (d) A/P58, (e) B/P44, (f) B/P46, (g) B/P53, (h) B/P58. | ||
| 7 days | 28 days | 40 days | |
|---|---|---|---|
| Young's modulus (N mm−2) | |||
| A0 | 514.3 ± 25.0 | ||
| A/P44 | 372.3 ± 30.3 | 335.9 ± 122.9 | 447.3 ± 73.2 |
| A/P46 | 483.0 ± 53.5 | 406.9 ± 62.1 | 484.0 ± 46.9 |
| A/P53 | 491.7 ± 47.4 | 351.4 ± 109.1 | 497.5 ± 71.4 |
| A/P58 | 466.0 ± 74.2 | 498.6 ± 36.0 | 528.6 ± 51.9 |
| B0 | 567.0 ± 25.9 | ||
| B/P44 | 362.0 ± 52.7 | 368.3 ± 72.6 | 414.6 ± 45.5 |
| B/P46 | 428.0 ± 24.2 | 338.7 ± 28.1 | 391.6 ± 77.4 |
| B/P53 | 465.7 ± 55.1 | 370.6 ± 47.9 | 457.3 ± 73.3 |
| B/P58 | 456.0 ± 30.6 | 443.8 ± 16.9 | 222.0 ± 55.0 |
![[thin space (1/6-em)]](https://www.rsc.org/images/entities/char_2009.gif) |
|||
| Tensile strength – σ (N mm−2) | |||
| A0 | 49.7 ± 8.0 | ||
| A/P44 | 44.3 ± 6.2 | 31.9 ± 9.7 | 40.1 ± 5.6 |
| A/P46 | 46.4 ± 5.0 | 30.7 ± 7.7 | 47.4 ± 2.5 |
| A/P53 | 47.5 ± 7.5 | 34.3 ± 7.1 | 41.6 ± 1.6 |
| A/P58 | 45.2 ± 6.4 | 32.5 ± 11.2 | 39.3 ± 8.0 |
| B0 | 44.2 ± 7.2 | ||
| B/P44 | 37.3 ± 4.0 | 35.0 ± 4.8 | 36.9 ± 8.3 |
| B/P46 | 32.0 ± 6.2 | 30.3 ± 2.2 | 41.9 ± 1.6 |
| B/P53 | 40.8 ± 4.9 | 35.5 ± 11.9 | 30.3 ± 3.6 |
| B/P58 | 30.0 ± 5.9 | 44.9 ± 0.3 | 39.0 ± 2.2 |
![[thin space (1/6-em)]](https://www.rsc.org/images/entities/char_2009.gif) |
|||
| Elongation at break – % ε | |||
| A0 | 1326.0 ± 225.3 | ||
| A/P44 | 1241.3 ± 45.2 | 1209.0 ± 33.2 | 1170.0 ± 22.6 |
| A/P46 | 1258.8 ± 83.2 | 1154.6 ± 61.4 | 1169.3 ± 17.7 |
| A/P53 | 1166.3 ± 48.2 | 1102.0 ± 56.2 | 1187.3 ± 7.1 |
| A/P58 | 1246.6 ± 21.5 | 1051.6 ± 57.5 | 1149.3 ± 35.0 |
| B0 | 1021.7 ± 102.0 | ||
| B/P44 | 674.3 ± 105.3 | 863.3 ± 10.7 | 642.6 ± 63.1 |
| B/P46 | 791.0 ± 29.8 | 644.6 ± 41.5 | 1083.0 ± 219.0 |
| B/P53 | 1018.6 ± 180.1 | 793.3 ± 81.0 | 653.2 ± 109.7 |
| B/P58 | 780.3 ± 81.1 | 746.6 ± 49.7 | 856.0 ± 46.7 |
This reduction in strength of HDPE and PP samples with various PCMs treatment was expected. In the literature there are publications where strength and thermal stability deterioration after paraffin or waxes addition in HDPE45,50,51 and PP52,53 matrixes were observed.
In Fig. 6 the percentage of strength alteration of each sample (% σi/σ0) as a function of treatment time with various PCMs is plotted. For all HDPE (A) (see Fig. 6a) treated samples a decrease of strength values during 28 days of treatment and a small increase of strength values after 40 days of treatment were observed. For PP (B) samples treated with P44 and P46 PCMs (see Fig. 6b) the same strength change, as in case of HDPE, was observed, while for sample treated with P58 the re-increase of strength values was recorded after 28 days of treatment. For sample treated with P53 a linear decrease of strength values up to 40 days of treatment was recorded.
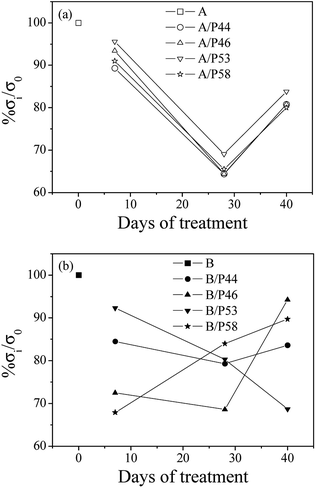 | ||
| Fig. 6 Variation of percentage strength change of all tested HDPE (A) in top (a) and PP (B) samples in bottom (b) as a function of treatment time. | ||
Strength values variation of both HDPE and PP matrixes treated with various PCMs as a function of time agrees with the results of mass uptake and hardness measurements up to Day 28. Mass uptake results showed that the mass increase rate is high in first days of treatment and stabilized from Day 28. The profile of the hardness values over time are of similar change and led to the scenario that molecules of PCMs tested diffuse rather fast in a significant depth to the bulk structure of both HDPE and PP rather than accumulating near the surface. Decreased strength values after few days in contact with PCM indicates penetration of PCM molecules in the bulk of HDPE and PP chains affecting polymer chain bonding, crystallinity and structure homogeneity. A diffusion limited PCM penetration up to a specific depth of the polymer specimen not far from surface would probably lead to an immediate decrease of strength values but also to a stabilization of them soon after. Non stable or even increased tensile values found for HDPE and/or PP samples after Day 28 together with further increase of PCM uptake suggest the in-depth distribution of PCMs molecules in the HDPE and PP bulk structure. Despite the high decrease of tensile values after the first 7 days of contact a re-increase of the values from 28 to Day 40 samples indicates some structural effect of PCMs on the HDPE and PP bulk. The lower mechanical properties observed for the first 7 days contact and up to 28 days are caused by the induced inhomogeneity in the polymer structure by the PCM introduction. It is of interest that the structure despite its PCM content restores mechanical properties at a certain degree indicating a relaxation effect on the initial structural deterioration. Since no significant increase in PCM uptake is observed after Day 28 it may be assumed that PCM already introduced is interacting with the bulk at a molecular level being redistributed over time. DSC results shown below support further such a case. Thus, strength recovery after Day 28 is indicative to a kind of bonding between absorbed paraffin, waxy or hydrocarbon molecules and HDPE or PP chains or to a reorientation of HDPE and PP chains. This behavior matches satisfactorily to the model suggested in the past from other researchers to explain the water molecules adsorption mechanism in polymer matrixes.54–56
Further information on the bulk structure of the PCM treated can be retrieved by the thermal analysis of the samples. The absorbed PCM quantities by the polymer's mass alter also their thermal properties significantly. Results are shown in Fig. 7 and data derived therein are gathered in Table 3.
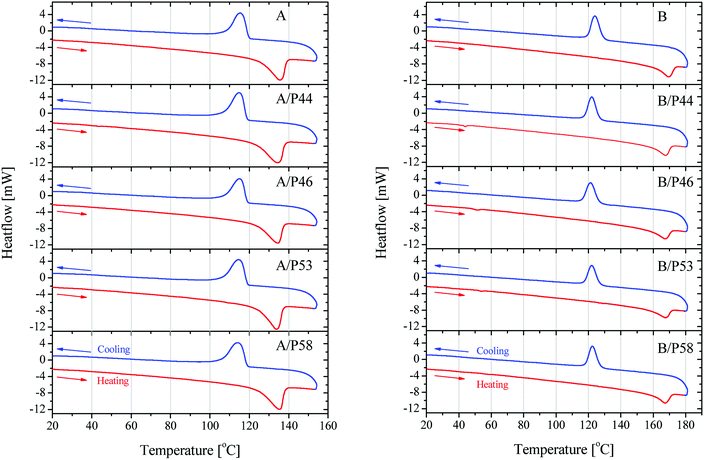 | ||
| Fig. 7 DSC results on heating and cooling on HDPE in contact with PCMs (left) and PP in contact with PCMs (right). | ||
| Sample | Tin (°C) | Tm (°C) | ΔHobs (J g−1) | Crystallinity (%) |
|---|---|---|---|---|
| a Tin: temperature of thermal effect initiation; Tm: melting temperature ΔHobs: enthalpy of thermal effect recorded. | ||||
| A0 | 97.1 | 135.3 | 161.0 | 97.6 |
| A/P44 | 92.5 | 134.2 | 170.1 | 97.1 |
| A/P46 | 91.0 | 134.5 | 161.3 | 92.6 |
| A/P53 | 90.0 | 133.8 | 138.8 | 79.3 |
| A/P58 | 89.0 | 135.3 | 158.2 | 90.8 |
| B0 | 132.2 | 169.4 | 74.4 | 97.9 |
| B/P44 | 134.1 | 167.5 | 73.0 | 89.9 |
| B/P46 | 135.2 | 167.3 | 63.4 | 78.6 |
| B/P53 | 139.3 | 167.7 | 62.6 | 77.7 |
| B/P58 | 132.6 | 167.3 | 73.1 | 91.0 |
Crystallinity is affected in various degrees depending on both polymer and the PCM molecule. Despite the lower wt% uptake of HPDE specimens and their better kept mechanical properties, a significant shift of the melting initiation to lower temperatures by up to 8% was observed. The overall crystallinity is not deteriorated extensively as well the main peak of the melting phenomenon which stays very close to the value of the blank specimen of HDPE used. This is most probably due to their densely packed as well as branched structure. An exception is observed for P53 that is affecting at a higher degree than the rest of PCMs all thermal derived properties of HDPE, lowering crystallinity by 18.8% and initiating melting about 7 °C earlier causing a lower overall melting temperature by 1.5 °C.
P53 has similar effect on the properties of PP lowering its crystallinity by 20.6% and causing a lower overall melting temperature by almost 2 °C. However, no shift to lower temperatures for the melting effect is observed. In general PP melting peak becomes sharper after contact with PCMs and initial temperature is found higher by 0.25–7 °C indicating a very different type of interaction with the diffused PCM molecules in the bulk. The latter is observed also by the mechanical strength tests (Fig. 5 and 6). In favor of this observation is the fact that in the DSC curve a small but distinct peak is recorded at lower temperatures (Fig. 8). This peak is attributed to PCM melting. For example, for PP specimen in contact with P44 the small peak maximum is located at 43.7 °C. Respectively for PP with P46 peak is found at 51.0 °C, P53 is at 53.2 °C and a very small peak for P58 at 58.9 °C. These values are identical or very close to the producer given melting temperatures for the PCMs studied that are 44 °C, 46 °C, 53 °C and 58 °C respectively. Despite the similar to PP wt% PCM uptake, the HDPE specimens do not show any similar DSC peaks although treated by the same PCMs. An exception exists for A/P44 showing a minor peak (Fig. 8). In PP specimens the absorbed PCMs maintain their molecular thermal properties indicating a weaker interaction with the hosting polymer substrate compared to HDPE. Among them P58 (C28 fatty alcohol) shows the smallest DSC peak thus the strongest molecular interaction with PP. B/P58 has the lowest wt% uptake with the slowest uptake rate. At the same time its crystallinity in Day 40 appears the highest among the specimens (91%) indicating low structural deterioration and a finer distribution of P58 in PP matrix. Such a molecular interaction may also explain the slight increase in its Day 40 mechanical strength (Fig. 6). The different interaction of HDPE with PCM molecules is due to its densely packed as well as branched bulk structure. In HDPE a finer presumably at a molecular level distribution of each PCM in the polymer bulk structure is expected thus diluting and minimizing the PCM's melting thermal effect. A minor peak is only observed in the case of A/P44 with the smaller molecules among PCMs tested. None of the respective PCMs solidification peaks is observed during cooling step of the DSC measurement. Upon melting a uniform even finer distribution of PCM molecules in the structure of HDPE and PP respectively is expected due to liquid state mixing. As a result, upon solidification the respective latent heat of the absorbed PCM quantity is not anymore detectable. In order to verify the above assumption a subsequent second heating step was performed in the DSC test for the B/P44 specimen (Fig. 8). As a result, no thermal effect was recorded for P44 melting in the range of 35–65 °C. The observed small peak at 43.7 °C during the heating step has disappeared proving the fine dispersion and maybe the better interaction of the absorbed P44 with the PP bulk.
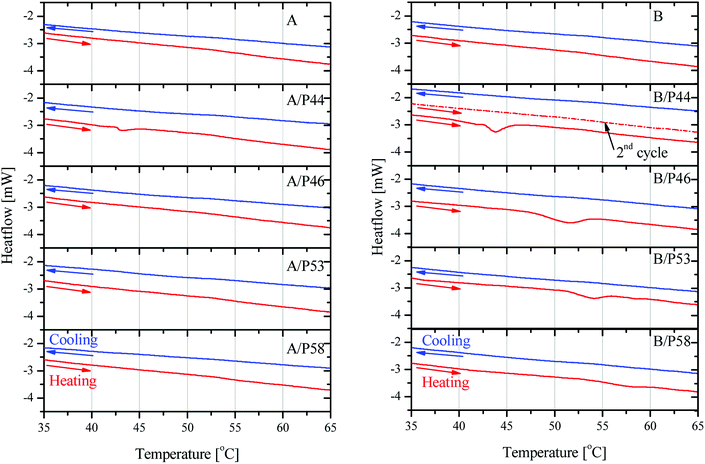 | ||
| Fig. 8 DSC results on heating and cooling cycles in 35–65 °C region on HDPE in contact with PCMs (left) and PP in contact with PCMs (right). For B/P44 sample second heating cycle is shown. | ||
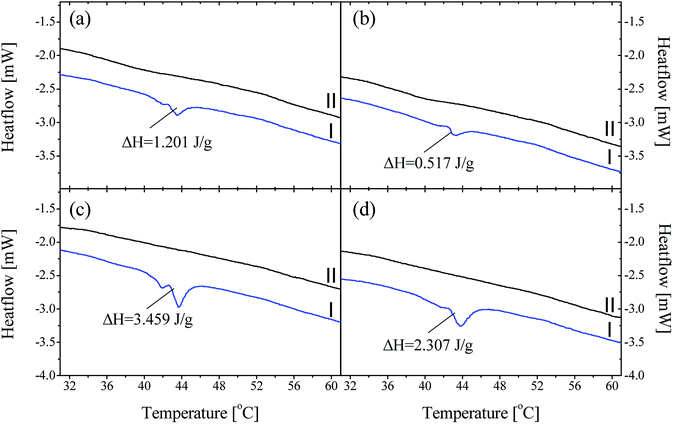
As discussed, P44 shows differences on its absorption, distribution and interaction to HDPE and PP (Fig. 8) compared to rest PCMs. Therefore, samples of HDPE and PP, Day 7 in contact with P44 were also tested for their DSC profile in order to better understand the PCM interaction in the bulk polymer. Results are shown in Fig. 9 and reveal that in Day 7 a larger quantity of P44 exist as non-finely distributed for both HDPE and PP. Such presence is evident by the melting thermal effect recorded and quantified around 44 °C. In PP this value is bigger. The thermal effect due to the non-uniformly and non-molecularly distributed quantity in the polymer bulk corresponds for HDPE (A/P44) Day 7 to ΔH = 1.201 J g−1 and 3.459 J g−1 for PP (B/P44) Day 7. However, in Day 40 the non-molecularly distributed quantity is significantly decreased as identified by the smaller melting peak and the corresponding thermal content measured; namely by 57% for HDPE (0.517 J g−1) and by 33% for PP (2.307 J g−1). P44 absorbed quantity is therefore slowly distributed and dissolved by diffusion in the bulk of the polymer over time; eventually leading to a more uniform structure in Day 40 with less inhomogeneity than in Day 7. Therefore, the degree of interaction among P44 and HDPE and PP improves towards Day 40. Thus, either a better molecular distribution and bonding between absorbed PCM molecules and HDPE or PP chains and/or respective a reorientation of HDPE and PP chains is developing within this period. A strength recovery can therefore be expected. The results are in good agreement with the tensile test results and the observed strength restoration on Day 40.
When samples A/P44 of Day 7, B/P44 of Day 7 are melted and a second DSC heating cycle is applied (Fig. 9a and c curves II) no thermal effect is recorded around 44 °C for both HDPE and PP caused by the finer distribution of P44 molecules in the structure of HDPE and PP respectively established by liquid state mixing. The same occurs for the Day 40 sample of B/P44 (Fig. 9d, curve II) and sample of B/P44 Day 40 (Fig. 8 and 9b, curve II).
Still the kinetics of such diffusion and the molecular interaction of the loaded PCM in HPDE and PP is an interesting issue deserving further investigation, but this lies outside the scope of this study.
From the opposing point of view Ampreg 21 is clearly not influenced by any PCM showing very stable mass throughout testing period. The latter is an epoxy-based resin highly branched with no available space even for lower molecular weight linear carbon molecules such as P44 to be dissolved and diffused into the bulk. Thus, an epoxy based resin may be used as a protective coating in PCM containers made by HDPE or PP for thermal energy storage systems. Considering the low surface energy of polyolefins such as HDPE and PP a surface pre-treatment is required to improve the surface bonding characteristics. Therefore, structural bonding can be improved by immersion in a solution of concentrated sulfuric acid 3.0 L, potassium dichromate, 0.25 kg in 0.15 L of water for 10–15 min, at 25 °C for HDPE and 1–2 min at 70 °C for PP.
After immersion, surfaces should be washed with clean cold water and dry carefully. Alternatively, a blue acetylene flame burn off until the materials surfaces appear smooth and polished but not melted. However suitable commercially available chromates containing primers can be also applied as a base for an epoxy-based resin coating deposition.
4. Conclusions
Under the testing conditions, a significant absorption of all tested organic phase change materials is observed in both HDPE and PP affecting negatively their mechanical properties. When HDPE and PP have been in contact with organic PCMs at 70 °C uptake values reached up to 6.4 wt% for PP and 5.8 wt% for HDPE. The mass uptake and the rate depend on the type of PCM with the PCM of C22 molecule being absorbed in a faster rate.Both HDPE and PP show fast and significant mechanical properties deterioration upon contact with all PCMs by Day 7 at 70 °C. Both HDPE and PP cannot withstand contact under warm conditions with the organic phase change materials tested in this work. Therefore, HDPE and PP should be used with caution when in contact with organic PCMs either as tanks or encapsulating materials. The absorbed PCM molecules show a time depended molecular interaction. Thus, the strength of HDPE is immediately decreased but remarkably restored at a significant level after Day 28. This was related to the molecular dispersion of PCM and the uniformity achieved over time in HDPE bulk. PP results are without a similar trend for all PCMs indicating the need for further investigation.
An epoxy-based resin (Ampreg 21) was clearly not influenced by any PCM at 70 °C showing very stable mass throughout testing period. This was attributed to the highly branched structure with no available space even for lower molecular weight linear hydrocarbon molecules as P44 to be dissolved and diffused into the bulk. Such an epoxy-based resin is suggested to be used as a protective coating in PCM containers made by HDPE or PP for thermal energy storage systems. For PCM encapsulation applications in such a working temperature region alternative materials should be used. A group of encapsulation materials to be considered can be low cost ceramics showing high chemical inertness as well as higher thermal conductivity than engineering polymers.
Conflicts of interest
There are no conflicts to declare.Acknowledgements
Part of this work was financially supported by the TESSe2b project that has received funding from the European Union's Horizon 2020 research and innovation programme under grant agreement No. 680555. This article reflects only the authors' view and the European Commission is not responsible for any use that may be made of the information it contains.References
- L. Navarro, A. de Gracia, S. Colclough, M. Browne, S. J. McCormack, P. Griffiths and L. F. Cabeza, Renewable Energy, 2016, 88, 526–547 CrossRef.
- L. Navarro, A. de Gracia, D. Niall, A. Castell, M. Browne, S. J. McCormack, P. Griffiths and L. F. Cabeza, Renewable Energy, 2016, 85, 1334–1356 CrossRef.
- W. Streicher, J. Schultz, C. Solé, L. Cabeza, J. Bony and S. Citherlet, Final report of subtask C phase change materials. Report C7—IEA SHC task 32, Int. Energy Assoc., 2008 Search PubMed.
- M. Rommel, A. Hauer and W. van Helden, Energy Procedia, 2016, 91, 226–230 CrossRef.
- H. Mehling and L. F. Cabeza, Heat and cold storage with PCM, Springer, Berlin, Heidelberg, 2008 Search PubMed.
- A. Amini, J. Miller and H. Jouhara, Energy, 2017, 136, 163–172 CrossRef.
- Z. Khan, Z. Khan and A. Ghafoor, Energy Convers. Manage., 2016, 115, 132–158 CrossRef.
- S. Seddegh, X. Wang, A. D. Henderson and Z. Xing, Renewable Sustainable Energy Rev., 2015, 49, 517–533 CrossRef.
- Á. Á. Pardiñas, M. J. Alonso, R. Diz, K. H. Kvalsvik and J. Fernández-Seara, Energy and Buildings, 2017, 140, 28–41 CrossRef.
- B. Zalba, J. M. Marín, L. F. Cabeza and H. Mehling, Appl. Therm. Eng., 2003, 23, 251–283 CrossRef.
- M. J. Huang, P. C. Eames and N. J. Hewitt, Sol. Energy Mater. Sol. Cells, 2006, 90, 1951–1960 CrossRef.
- A. Hasan, S. J. McCormack, M. J. Huang and B. Norton, Sol. Energy, 2010, 84, 1601–1612 CrossRef.
- M. C. Browne, B. Norton and S. J. McCormack, Renewable Sustainable Energy Rev., 2015, 47, 762–782 CrossRef.
- A. Hasan, S. McCormack, M. Huang and B. Norton, Energies, 2014, 7, 1318–1331 CrossRef.
- A. Sari, H. Sari and A. Onal, Energy Convers. Manage., 2004, 45, 365–376 CrossRef.
- A. Sharma, V. V. Tyagi, C. R. Chen and D. Buddhi, Renewable Sustainable Energy Rev., 2009, 13, 318–345 CrossRef.
- R. Kumar, M. Misra, R. Kumar, D. Gupta, P. Khatri, B. Tak and S. Meena, Def. Sci. J., 2011, 61, 576–582 CrossRef.
- M. Pomianowski, P. Heiselberg and Y. Zhang, Energy and Buildings, 2013, 67, 56–69 CrossRef.
- M. K. Koukou, M. G. Vrachopoulos, N. S. Tachos, G. Dogkas, K. Lymperis and V. Stathopoulos, Thermal Science and Engineering Progress, 2018, 7, 87–98 CrossRef.
- T. Kousksou, P. Bruel, A. Jamil, T. El Rhafiki and Y. Zeraouli, Sol. Energy Mater. Sol. Cells, 2014, 120, 59–80 CrossRef.
- Y. Yuan, N. Zhang, W. Tao, X. Cao and Y. He, Renewable Sustainable Energy Rev., 2014, 29, 482–498 CrossRef.
- S. Pendyala, Macroencapsulation of Phase Change Materials for Thermal Energy Storage, MSc thesis, University of South Florida, 2012.
- J. Giro-Paloma, M. Martínez, L. F. Cabeza and A. I. Fernández, Renewable Sustainable Energy Rev., 2016, 53, 1059–1075 CrossRef.
- J. Pereira da Cunha and P. Eames, Appl. Energy, 2016, 177, 227–238 CrossRef.
- A. Jamekhorshid, S. M. Sadrameli and M. Farid, Renewable Sustainable Energy Rev., 2014, 31, 531–542 CrossRef.
- T. E. Alam, J. S. Dhau, D. Y. Goswami and E. Stefanakos, Appl. Energy, 2015, 154, 92–101 CrossRef.
- A. Lázaro, B. Zalba, M. Bobi, C. Castellón and L. F. Cabeza, AIChE J., 2006, 52, 804–808 CrossRef.
- L. F. Cabeza, J. Illa, J. Roca, F. Badia, H. Mehling, S. Hiebler and F. Ziegler, Mater. Corros., 2001, 52, 140–146 CrossRef.
- L. F. Cabeza, J. Illa, J. Roca, F. Badia, H. Mehling, S. Hiebler and F. Ziegler, Mater. Corros., 2001, 52, 748–754 CrossRef.
- L. F. Cabeza, J. Roca, M. Nogueés, H. Mehling and S. Hiebler, Mater. Corros., 2005, 56, 33–39 CrossRef.
- A. García-Romero, A. Delgado, A. Urresti, K. Martín and J. M. Sala, Corros. Sci., 2009, 51, 1263–1272 CrossRef.
- M. Groll, O. Brost and D. Heine, Heat Recovery Syst. CHP, 1990, 10, 567–572 CrossRef.
- F. C. Porisini, Sol. Energy, 1988, 41, 193–197 CrossRef.
- G. Ferrer, A. Solé, C. Barreneche, I. Martorell and L. F. Cabeza, Renewable Energy, 2015, 76, 465–469 CrossRef.
- A. Solé, L. Miró, C. Barreneche, I. Martorell and L. F. Cabeza, Renewable Energy, 2015, 75, 519–523 CrossRef.
- P. Moreno, L. Miró, A. Solé, C. Barreneche, C. Solé, I. Martorell and L. F. Cabeza, Appl. Energy, 2014, 125, 238–245 CrossRef.
- A. Sarı and K. Kaygusuz, Renewable Energy, 2003, 28, 939–948 CrossRef.
- M. C. Browne, E. Boyd and S. J. McCormack, Renewable Energy, 2017, 108, 555–568 CrossRef.
- A. J. Farrell, B. Norton and D. M. Kennedy, J. Mater. Process. Technol., 2006, 175, 198–205 CrossRef.
- L. Navarro, C. Barreneche, A. Castell, D. A. G. Redpath, P. W. Griffiths and L. F. Cabeza, Journal of Energy Storage, 2017, 13, 262–267 CrossRef.
- V. Chalkia, E. Marathoniti and V. N. Stathopoulos, Ceram. Int., 2017, 43, 17238–17242 CrossRef.
- J. Brandrup and E. H. Immergut, Polymer handbook, John Wiley & Sons, New York/ Chichester/ Brisbane/Toronto/ Singapore, 3rd edn, 1989 Search PubMed.
- T. Hatakeyama and Z. Liu, Handbook of Thermal Analysis, John Wiley & Sons, West Sussex, 1998 Search PubMed.
- K. A. Moly, H. J. Radusch, R. Androsh, S. S. Bhagawan and S. Thomas, Eur. Polym. J., 2005, 41, 1410–1419 CrossRef.
- M. A. AlMaadeed, S. Labidi, I. Krupa and M. Ouederni, Arabian J. Chem., 2015, 8, 388–399 CrossRef.
- N. Vourdas, G. Pashos, G. Kokkoris, A. G. Boudouvis and V. N. Stathopoulos, Langmuir, 2016, 32, 5250–5258 CrossRef PubMed.
- N. Vourdas, C. Ranos and V. N. Stathopoulos, RSC Adv., 2015, 5, 33666–33673 RSC.
- Y. Huang and D. R. Paul, J. Polym. Sci., Part B: Polym. Phys., 2007, 45, 1390–1398 CrossRef.
- P. Spitael and C. W. Macosko, Polym. Eng. Sci., 2004, 44, 2090–2100 CrossRef.
- K. Kaygusuz and A. Sari, Energy Sources, Part A, 2007, 29, 261–270 CrossRef.
- I. Krupa, Z. Nógellová, Z. Špitalský, I. Janigová, B. Boh, B. Sumiga, A. Kleinová, M. Karkri and M. A. AlMaadeed, Energy Convers. Manage., 2014, 87, 400–409 CrossRef.
- M. J. Mochane and A. S. Luyt, Thermochim. Acta, 2012, 544, 63–70 CrossRef.
- I. Krupa and A. S. Luyt, Thermochim. Acta, 2001, 372, 137–141 CrossRef.
- G. C. Papanicolaou, T. V. Kosmidou, A. S. Vatalis and C. G. Delides, J. Appl. Polym. Sci., 2006, 99, 1328–1339 CrossRef.
- J. Zhou and J. P. Lucas, Polymer, 1999, 40, 5505–5512 CrossRef.
- J. Zhou and J. P. Lucas, Polymer, 1999, 40, 5513–5522 CrossRef.
| This journal is © The Royal Society of Chemistry 2018 |

