 Open Access Article
An AC electrothermal self-circulating system with a minimalist process to construct a biomimetic liver lobule model for drug testing†
Shengli Mi‡
 ae,
Baihan Li‡a,
Xiaoman Yia,
Yuanyuan Xud,
Zhichang Dua,
Shuaitao Yanga,
Wei Lif and
Wei Sun*abcd
aGraduate School at Shenzhen, Tsinghua University, Shenzhen, P. R. China. E-mail: weisun@mail.tsinghua.edu.cn; Fax: +8675526036356; Tel: +8675526036329
bDepartment of Mechanical Engineering and Mechanics, Tsinghua University, Beijing, China
cDepartment of Mechanical Engineering, Drexel University, Philadelphia, PA, USA
dTsinghua-Berkeley Shenzhen Institute, Shenzhen, P. R. China
eOpen FIESTA Center, Tsinghua University, Shenzhen 518055, PR China
fDepartment of Mechanical Engineering, The University of Texas at Austin, Austin, Texas 78712, USA
First published on 1st November 2018
Abstract
Liver-on-chip, due to its precision and low cost for constructing in vitro models, has tremendous potential for drug toxicity testing and pathological studies. By applying APAP (acetaminophen) treatment of different concentrations, a dynamic self-circulating liver lobule model for drug testing was proven useful for emulating the human physiological system. However, the demand for a dynamic system of on-chip organs is difficult to fulfil due to the relatively cumbersome fabrication processes. In this paper, the design and fabrication of an AC electrothermal self-circulating system combined with a 3D biomimetic liver lobule is described. The system was fabricated using a low-cost ITO laser etching process within a few seconds. A large number of interdigital electrodes were arranged in a limited space to increase the fluid flow-driven efficiency. The liver lobule consists of two parts, a hepatocyte cell-laden layer and an endothelial layer, which exhibit a sandwich radial shaped pattern that is more bionic in structure and function. By evaluating the velocity and temperature in the self-circulating system at various voltages and frequencies, we obtained a set of reliable input parameters to provide an adequate supply of culture fluid without cell damage. The metabolism of the liver lobule in dynamic culture and static culture was compared based on cell viability, albumin secretion and urea synthesis.
1 Introduction
Due to the high cost of pharmaceutical development to conduct toxicity testing on live animals and human organs and the need for basic physiological and pathological research, a substantial amount of work has been devoted towards constructing in vitro tissue models to realize part of the cellular microenvironment and tissue function.1 From early microfluidic chips for protein fragment testing and multicellular co-culturing to microtissue or micro-organ systems, such as co-culture systems of hepatocytes and liver endothelial cells, the existing models have been extended to MPS (microphysiological systems), and the future trend is to build so-called human-on-chip devices for various pharmacokinetic studies.2–6 However, there is currently no closed-loop liver chip that simulates the in vivo dynamic circulation and achieves the control of flow rates in micro-tissues or micro-organs.7 Hepatic lobule is the smallest unit of liver, and it bears multiple functions of human body including detoxification, dynamic metabolism and immune response8 and the establishment of an entire microphysiological circulatory system and the biomimetic construction of a hepatic lobule model are key to the realization of a model of liver metabolism and drug testing.Recent advances in tissue engineering and microfabrication technologies, which allow the manipulation of various cell types to grow rapidly in vitro, have provided an unprecedented opportunity to fulfil this purpose.9–11 To this end, some remarkable work has focused on reconstructing 3D multilayer structures,12–14 especially a radial star-shaped structure, which contains multiple liver tissue cells to mimic the functional unit of liver lobule.15 For example, to create different phase boundaries to generate sinusoid-like models, a biomimetic artificial hepatic sinusoid with a microfluidic endothelial barrier was built with the liver acinus-like function for mass transportation.4,16 Additionally the use of a porous membrane, such as PET17,18 or silicon nitride19 in place of barriers can effectively reduce the boundary inhomogeneities resulting from the barrier structure. Although these in vitro approaches imitating the structure of hepatic cord could be applied for the study for toxicity testing, they do not constitute the actual morphology of hepatic lobule and the capability for mass transportation would be degraded by applying porous membrane. Recently, one noteworthy approach applying the principle of dielectrophoresis with two different sets of electrodes could trap HepG2 cells and vein endothelial cells respectively to form a radial shaped hepatic lobule.20 In another approach, a DLP (digital light process) based 3D bioprinting system was applied to develop a 3D hydrogel-based triculture model.21 However, a hydrogel with cells can only be manufactured in a thin layer using the above methods, and large-scale cell-hydrogel assemblies would be achieved by stacking cell-embedded mesh-like hydrogel sheets and curing layer by layer to form a sandwich shaped radial structure.22 However, the curing method using alginate with calcium chloride does not provide as good an environment for free cells growth as tail collagen. As for dynamic culture, an extensible liver lobule microphysiological system consisting of an integrated network of hexagonal chambers realized the distribution of blood vessels and the state of blood flow.23 Another approach using a Pμs (pneumatic microvalve system) to actuate two independent cell suspension flows for cell capturing arrays to construct a radial hepatic cord-like network showed a more obvious physiological metabolites of the liver and a faster drug reaction rate.24 However, there are some limitation of the above two in that the syringe pumps or the relatively large external devices, such as gas cylinders cannot supply liquid to many receptors in a limited space. In our previous study, we reported the research of constructing a biomimetic liver sinusoid by taking advantage of laminar flow and analysing the metabolic products by the effects of drug toxicity.25 Although the simulation of blood flow in vitro was performed by fluid gravity and did not need any other devices to pump it, we could not achieve a relatively stable and controllable flow rate.
Over the past decades, with the maturity of AC electrothermal theory, chips integrated with AC electrodes have emerged to be driven functionally.26,27 For example, an AC electrothermal circulatory pumping chip was manufactured to generate a sufficient fluid rate without any harm to cell culture.28 However, the electrodes were made by patterning different thicknesses of metal layers, such as gold and platinum on the silicon substrate. The process of depositing electrodes requires a relatively long time and is a relatively difficult manufacturing process.29,30 Based on the previous study, we report the design and manufacture of a self-circulating microsystem which mainly consists of two parts: the pumping area and liver lobule model area. The pumping area is driven by AC electrothermal electrodes, which are fabricated easily to enhance the pumping efficiency. We use a laser marking machine to photo-etch the ITO glass surface and produce high density electrodes. The processing time is reduced to only several seconds. The lobule area is a two-layer structure upon which the upper radial shaped layer of HUVECs grows, and hepatocytes HepG2 grows on the lower layer directly with no porous membrane. This design helps reduce the involvement of non-biological materials. Through simulation of the fluid velocity and temperature of the chip and measurement of the main flow velocity and overall temperature, we obtain an AC electrothermal actuating system that simulates blood flow and bionic interstitial flow. The cell morphology and viability under dynamic culture were characterized, and a toxicity test and the expression of liver-specific functions, such as protein secretion and urea synthesis were analysed.
2 Theory
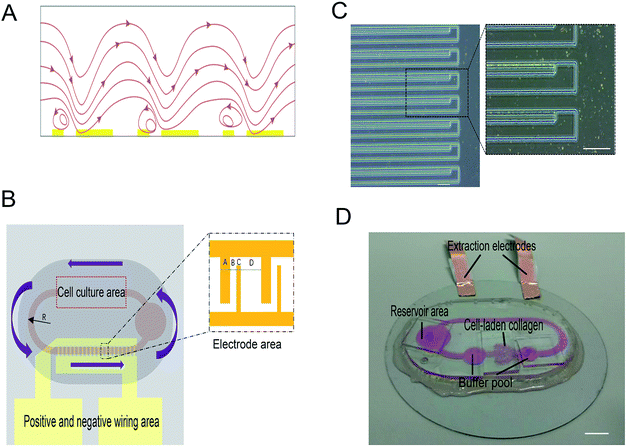
When there is an uneven electric field applied in a high ion concentration medium, the electric field induced Joule heating would generate a locally inhomogeneous thermal field in the microfluidic flow channel. We qualify the thermal field as the temperature gradient, ∇T. Subsequently, some properties of the fluid with a close relationship with the temperature gradient (i.e., permittivity and conductivity) would vary according to the temperature change. Therefore, induced free charges shuttles through the nonuniform electric field. The impetus determined by these nonuniform electric fields would actuate the fluid to move along one direction. The phenomenon of AC electrothermal is shown in Fig. 1A.2.1 Electrostatics
The electric potential V is determined by the Laplace equation:31| ∇2V = 0 |
The magnitude of the electric field applied through the media, E is determined by the AC electric field V:32
| E = −∇V |
2.2 Heat transfer
The power density turned into Joule heating from the applied electric fields is given by:33| W = σE2 |
We can obtain the relationship between the electric-field and Joule heating from the energy balance equation34
Because the AC temperature equilibrium is quickly reached when the AC current is working and the effect of fluid flow on the temperature distribution can be neglected, the equation can be written as:34
| k∇2T + σE2 = 0 |
If the temperature increases very little, a linear approximation can represent the temperature dependent parameters σ and ε.35
| ε(T) = ε(T0)(1 + α(T − T0)) |
| σ(T) = σ(T0)(1 + β(T − T0)) |
For an aqueous solution, the approximation of α and β can be expressed as:35
where T0 represents the ambient temperature.
3 Fluid flow
We use the Navier–Stokes equation and the equation of continuity to illustrate the incompressible fluid that has low Reynolds number.36–38| −∇p + η∇2u + 〈FET〉 = 0, ∇·u = 0 |
The time average bulk forces that ACET generated can be written as:39
4 Materials and methods
4.1 Design and manufacture of AC electrothermal self-circulating system
Fig. 1B shows the design of the self-circulating chip. The self-circulating system consists of three layers, the electrode substrate, the circular flow channel and the upper liver plate, which form a sandwich structure. The following section explains the details of the self-circulating chip and how it is more easily fabricated and more inexpensive than previously reported designs.![[thin space (1/6-em)]](https://www.rsc.org/images/entities/char_2009.gif) :
:![[thin space (1/6-em)]](https://www.rsc.org/images/entities/char_2009.gif) 10 to pour on the mould. A slightly larger oval polymethylmethacrylate (PMMA) sheet (1.5 mm thick) with two exhaust vents covered the mould. After degassing in a vacuum drying oven and curing at 85 °C for 30 min, the circulating flow channel is then drafted.
10 to pour on the mould. A slightly larger oval polymethylmethacrylate (PMMA) sheet (1.5 mm thick) with two exhaust vents covered the mould. After degassing in a vacuum drying oven and curing at 85 °C for 30 min, the circulating flow channel is then drafted.4.2 Formation of 3D biomimetic liver lobule model
4.3 Dynamic culturing and measurement of the parameters of fluid flow
After a period of static culture, we use conductive copper adhesive tape to connect the self-circulating chip with the anode and the cathode of a signal generator (RIGOL, DG1022Z). We analysed the conductivity of the culture medium for 0 h, 12 h, 36 h and 84 h with a commercial electrical conductivity testing instrument (JY-TDS230) separately. The AC peak voltages of 2.5 V, 3 V, 3.5 V, 4 V, 4.5 V, 5 V, 5.5 V and 6 V, with a frequency of 10 MHz and 1 MHz are applied to the self-circulating chip. Polystyrene microspheres (Tianjin Baseline Chromtech Research Centre, diameter: 5 μm, green) were resuspended in the solution and the time to pass a fixed distance was recorded to calculate the velocities of the medium. The temperature variation near the cell culture chamber is recorded with a commercial thermocouple temperature sensor (Zhaoxin, TM-902C) in real time. AC peak voltages of 2.5 V, 3 V, 3.5 V, 4 V, 4.5 V, 5 V, 5.5 V, 6 V, 10 V, 15 V and 20 V with frequency of 10 MHz are applied to energize the chip separately and the entire measurement is accomplished in 37 °C incubator for each voltage applied for 10 min.4.4 Assessment of functional specificity of liver lobule
Albumin is a specific secretion of the liver, and via ammonia metabolism, urea is also generated specifically by hepatocytes. By analysing the amount of these two products, the degree of functional normality can be determined.40 The albumin and urea were analysed on at 1.5, 2.5 and 3.5 d in static and dynamic culture environments, specifically. Albumin secretion was measured with a Human Serum albumin (ALB) ELISA Kit (Wuhan Chundu Biological Technology Co., Ltd.) according to standard instruction. The urea concentration was assayed with the Urea Assay Kit (Abcam, ab83362) with a NanoDrop 2000c (Thermo Scientific) according to the manufacturer's instructions.4.5 APAP treatment of liver lobule
In our study, we selected the acetaminophen (APAP) (Abcam, ab120990) at different concentrations (0 (control), 10 mM and 20 mM) to evaluate our liver lobule model. After dynamic culture in an incubator for 1.5, 2.5 or 3.5 d, cell viability, urea synthesis and albumin secretion were evaluated from collected samples was taken out.4.6 Cell viability
The Live/Dead Cell Imaging Kit (Life Technologies Corporation) was employed to detect the viability of cells in the liver lobule model. The liver plate samples cultured for 1.5 d, 2.5 d or 3.5 d were removed and 15 μl of phosphate buffered saline (PBS) (HyClone) was added to the liver plate for washing 3 times for 5 min each, a total of 15 min. The Live/Dead Cell Imaging Kit was added on the chamber to stain the liver plate. After the reaction proceeded for 15 min at 37 °C, the chamber was washed with PBS 3 times. Finally, live/dead cell images were obtained with an electron microscope (Leica, DMi8), and the percentages of living and dead cells were counted to evaluate the viability of the liver lobule. Additionally, an elastomer base was mixed at proportion of 1![[thin space (1/6-em)]](https://www.rsc.org/images/entities/char_2009.gif) :
:![[thin space (1/6-em)]](https://www.rsc.org/images/entities/char_2009.gif) 10 to pour on the mould. A slightly larger oval polymethylmethacrylate (PMMA) sheet (1.5 mm thick) with two exhaust vents covered the mould. After degassing in a vacuum drying oven and curing at 85 °C for 30 min, the circulating flow channel is drafted.
10 to pour on the mould. A slightly larger oval polymethylmethacrylate (PMMA) sheet (1.5 mm thick) with two exhaust vents covered the mould. After degassing in a vacuum drying oven and curing at 85 °C for 30 min, the circulating flow channel is drafted.
5 Results
5.1 Construction of self-circulating system
To enhance the pumping efficiency in a unit of space, the parameters of the self-circulating system should be optimized. In the beginning, we experimented with using lengths of A, B, C and D of 100, 100, 150 and 350 μm, respectively, not shown in this paper. As is shown in Fig. 1B, we designed the dimensions of the electrodes according to the optimal geometry ratio (0.3![[thin space (1/6-em)]](https://www.rsc.org/images/entities/char_2009.gif) :
:![[thin space (1/6-em)]](https://www.rsc.org/images/entities/char_2009.gif) 1
1![[thin space (1/6-em)]](https://www.rsc.org/images/entities/char_2009.gif) :
:![[thin space (1/6-em)]](https://www.rsc.org/images/entities/char_2009.gif) 3
3![[thin space (1/6-em)]](https://www.rsc.org/images/entities/char_2009.gif) :
:![[thin space (1/6-em)]](https://www.rsc.org/images/entities/char_2009.gif) 3–6)35 such that the lengths of A, B, C and D are 20, 20, 100 and 150 μm, respectively. This accuracy has approached the limitation of the laser marking machine with the line width accuracy, which is approximately 20 μm, and the number of electrode pairs reached 120 pairs compared to the previous 50 pairs. Due to the variation of energy distribution uniformity of the laser ablation, the boundary of the electrode area presents a zigzag appearance which could enhance the relative line boundary. The image of the electrode array is shown in Fig. 1C. And on the opposite of the electrode area, we arranged the cell culture area composed of buffer pools and cell-laden collagen area (Fig. 1D).
3–6)35 such that the lengths of A, B, C and D are 20, 20, 100 and 150 μm, respectively. This accuracy has approached the limitation of the laser marking machine with the line width accuracy, which is approximately 20 μm, and the number of electrode pairs reached 120 pairs compared to the previous 50 pairs. Due to the variation of energy distribution uniformity of the laser ablation, the boundary of the electrode area presents a zigzag appearance which could enhance the relative line boundary. The image of the electrode array is shown in Fig. 1C. And on the opposite of the electrode area, we arranged the cell culture area composed of buffer pools and cell-laden collagen area (Fig. 1D).
5.2 Quantitative study of characteristic parameters of the self-circulating system
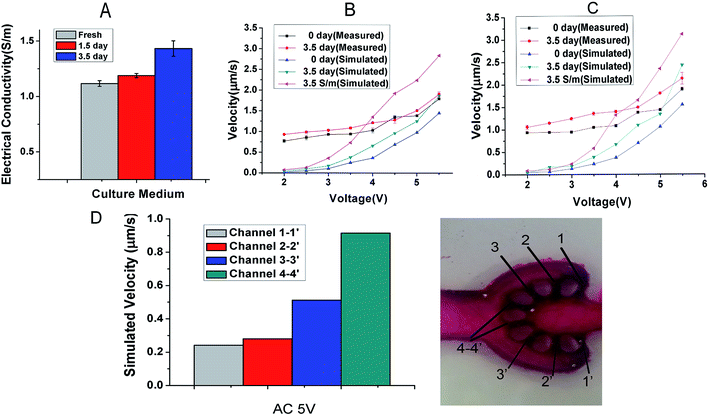
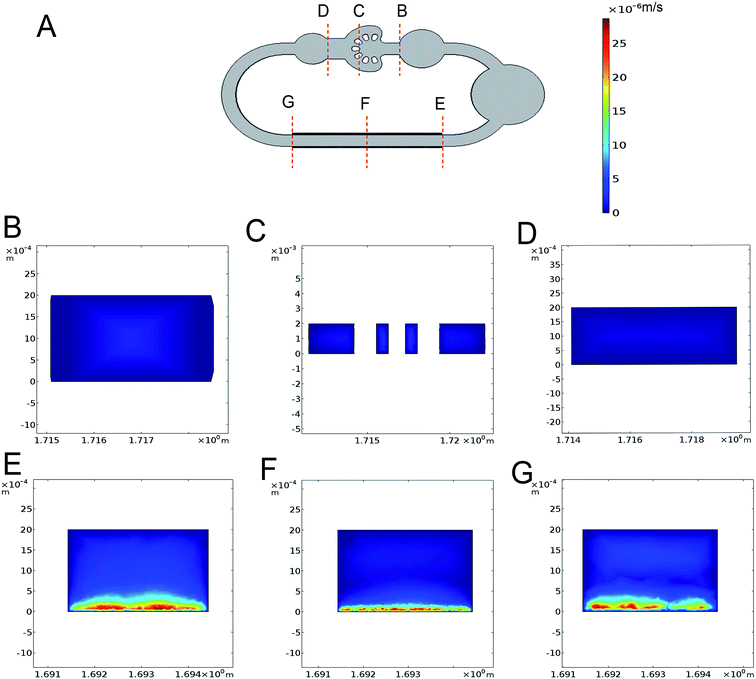
The variation of electrical conductivity directly affects the state of ACET flow, particularly the velocity of fluid flow. And the electrical conductivities measured from the culture medium at 0, 1.5 and 3.5 d have been measured and shown in Fig. 2A. The measured electrical conductivity of the culture medium which contains 40% DMEM and 40% RPMI supplemented with 1% P/S and 10% FBS shows an increasing trend from 1.12 to 1.43 S m−1 for 3.5 d. The reason is that with the extension of culture time, the cell supernatant ion concentration level was changing in varying degrees.To quantitatively calculate the influence of voltage and frequency on the flow velocity and temperature of the cell culture channel, we selected the finite element analysis software (COMSOL Multiphysics 5.3) to observe dynamic change. In Fig. 2B and C, we simulated the flow velocity 1 mm above the bottom at the electrical conductivity of 1.12, 1.43 and 3.5 S m−1 to represent the condition of fresh, 3.5 d culture medium and maximum conductivity. The range of applied voltage was 2–5.5 V with the interval of 0.5 V and the applied frequency was 1 MHz and 10 MHz. The maximum velocity of 2.47 μm s−1 appeared at the electrical conductivity of 1.43 S m−1, the applied frequency of 10 MHz and the voltage of 5.5 V. The simulation curve obtained with the numerical simulation shows that under low electrical conductivity and low voltage, and the frequency variation did not have obvious influence on the velocity especially under 5 V (Fig. 2B and C). The experimental data (Fig. 2B and C), shows that the velocity was positively correlated with the level of frequency, electrical conductivity and applied voltage. From an overall perspective, the velocity from empirical observations was higher than the simulation calculation particularly at a low voltage and the exception appeared at high velocity. The highest velocity of 2.13 μm s−1 occurred at the electrical conductivity of 1.43 S m−1, applied frequency of 10 MHz and voltage of 5.5 V. To estimate the velocity in each diverging channel, we calculated the proportional relationship between the branch channel velocity (Fig. 2D) and the main flow velocity by simulating the 3D velocity of the total chip. At a voltage of 5 V, frequency of 10 MHz and electrical conductivity of 1.12 S m−1, the simulated flow of each channel was 20.3, 29.5, 53.8 and 96.1 μl per day, and the actual flow of each channel we evaluated are 17, 25.8, 47.4 and 84 μl d−1, which fit the demand of 10 μl d−1 from our previous work.25 As shown in Fig. 3A–G, we simulated the velocities at the voltage of the 5 V, frequency of 1 MHz and electrical conductivity of 1.43 S m−1 and temperature variations appear mainly above electrode area.
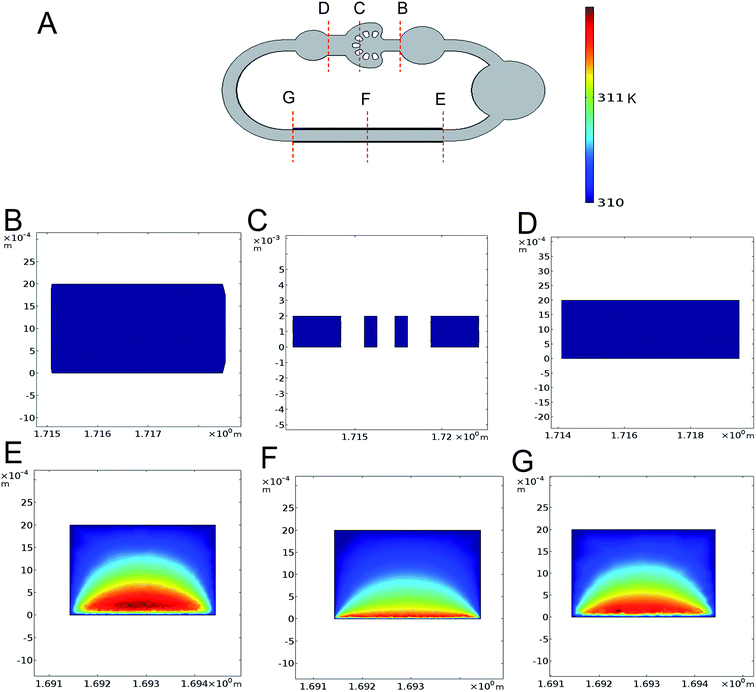
Another critical factor is the cell damage generated by the AC electrothermal flow which cannot be neglected. To validate the extra input not affecting the cell culture, we use the finite element analysis software to simulate the 3D temperature distribution of the self-circulating system. From the result of the simulation at the applied voltage of 20 V, frequency of 10 MHz and the electrical conductivity of 1.43 S m−1, we found that the rise in temperature only clearly exist on the electrode pumping area (Fig. 4A–G). This is somewhat different from the actual situation that the rise in temperature is inevitable. This is because that we set the temperature boundary condition of the flow channel at 37 °C, whereas the fluid flow encapsulated in the PDMS channel which has low thermal conductivity would facilitate temperature accumulation. From the actual measurement of the temperature rise in cell culture area at applied voltage of 0–20 V with fresh culture medium, we found that there is no conspicuous rise in temperature under the voltage of 7 V with the accuracy of 0.1 °C (ESI Fig. S1†). And the highest temperature is no more than 1 °C above the temperature in the incubator during the entire loading process.
5.3 In vitro reconstruction of 3D radial shaped liver lobule model
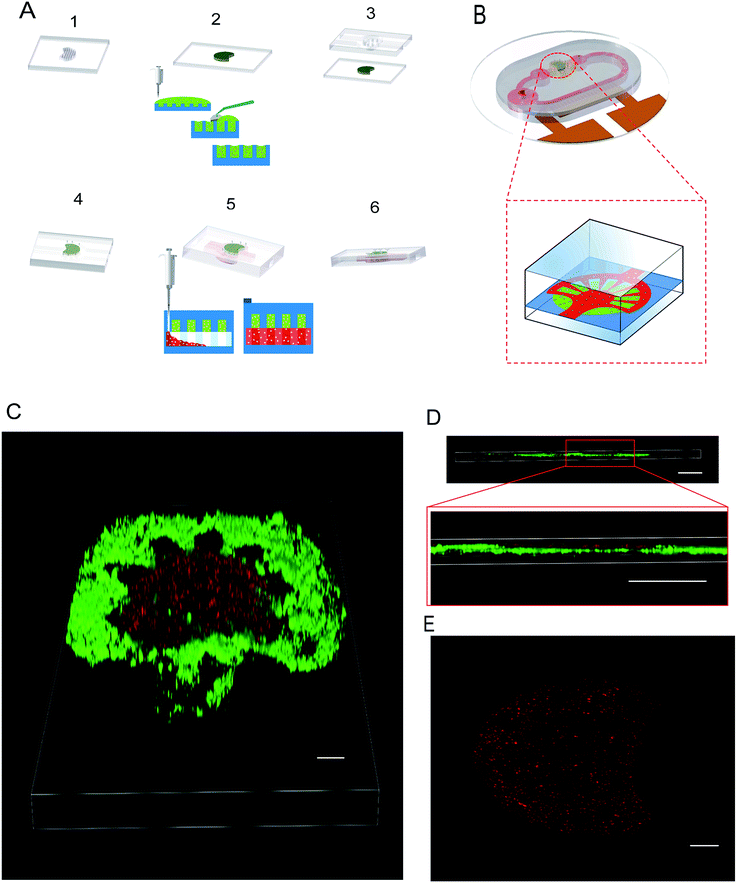
To achieve a 3D radial shaped liver lobule model integrating human liver cells and umbilical vein endothelial cells, the hierarchical approach of patterning was applied. The liver lobule model consists of three parts, i.e., the liver plate, HUVECs layer and flow channel. To construct the liver plate of the liver lobule, the hepatic cell-laden collagen was paved into the circular groove with some micro-pillars that efficiently fix the collagen efficiently (Fig. 5A). HUVECs were placed on the liver plate after positioning of the collagen such that it adheres tightly to the surface of the collagen (Fig. 5A). The radial shaped patterning of HUVECs was guided by the corresponding radial shaped channel that the branches of the liver lobule model can be regarded as an independent test unit. And referring to our past research, the density of cell-laden collagen was set as 1.5 × 10⁴ ml−1, which is considered as suitable for cell growth.To observe the multilayer structure in detail, the liver plate accompanied by HUVECs was imaged and laminated by confocal microscopy. Compared with growth on the collagen by gravity, the HUVECS layer was easily adhered to the surface of PDMS. However, after 12 h of static culture in the incubator, a radial pattern of HUVECs was formed on the surface of the fan-shaped liver plate (Fig. 5C–E). And due to the poor mechanical properties of the cell-laden collagen, we tested the flow effect of a that a maximum flow velocity of 20 μm s−1 from the static state to dynamic state and found that it did not damage the morphology of the liver plate.
5.4 Quantitative analysis of liver lobule model in dynamic culture and static culture
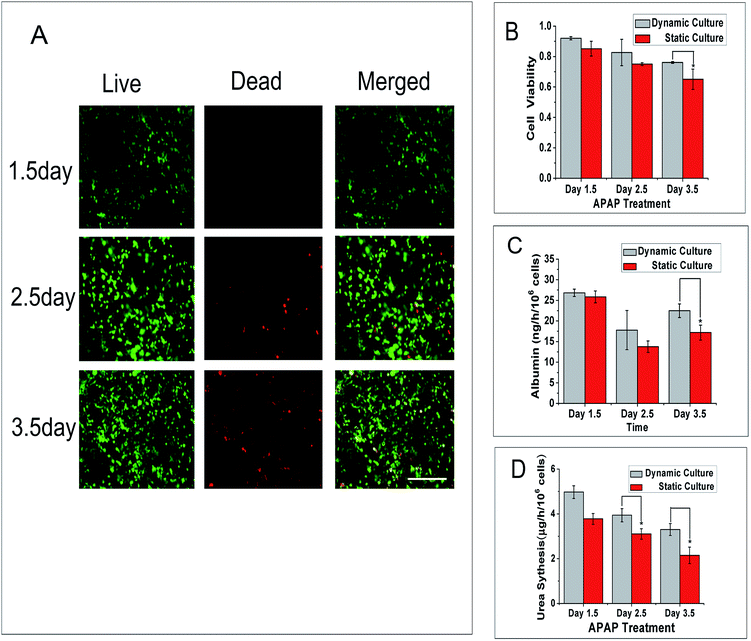
To better understand the activities of liver-lobule model in different situations, the cell viability of the 3D liver lobule model in a dynamic environment and static environment were assessed. We apply a voltage of 5 V to generate a velocity of approximately 2 μm s−1 in the main flow channel. And after a 12 h static culture followed another 1, 2 and 3 d of continuous dynamic culturing, we calculate the ratio of live cells to dead cells. The images (Fig. 6A) clearly show the state of cell proliferation and dead. Cell viability was negatively correlated with the culture time. Through the quantitative comparison of cell viability in dynamic and static culture (Fig. 6B), we found that cells in dynamic culture have a higher viability than in static culture. The viability of cells in dynamic culture maintained a ratio of above 80% for 2.5 d and above 75% for 3.5 d that is suitable for short-term training.Albumin secretion is a main liver-specific biomarker that can be used to evaluate the activity of hepatocytes and urea metabolism is also regarded as a major measurement of hepatocyte functionality. In our research, we measured the content of human albumin by ELISA to quantitatively anabase the metabolic rate. The chart (Fig. 6C) shows that the albumin secretion was not linearly related to time. The secretion of albumin in dynamic culture in these three days are approximately 27, 18 and 22 ng per h per 106 cells, respectively, and 26, 14 and 17 ng per h per 106 cells in static culture. Therefore the liver lobule model cultured in a dynamic environment have a higher albumin synthesis level than that in static culture. As shown in another set of data (Fig. 6D), we used the Urea Assay Kit to quantitatively analyse the ammonia metabolism of our liver lobule model. The urea production diminished over time and the trend is the same as cell viability change over time. The level of urea metabolism in dynamic culture is approximately 0.8–1.2 μg per h per 106 cells more than in static culture.
5.5 APAP drug reaction to self-circulating liver lobule model
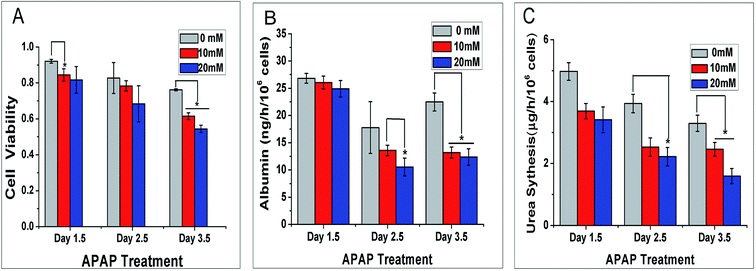
Liver, the biggest interior organ in our body, plays a crucial role in the metabolism and detoxification for drugs. Hence, whether the self-circulating liver lobule model can be applied to screen for drug reactions is a key for our model to simulate the function of the liver in vivo. We selected the hepatotoxic drug acetaminophen at different concentrations of 0, 10 and 20 mM. We cultured the liver lobule model in a static environment for 12 h followed 1, 2 and 3 d dynamic culture at an AC voltage of 5 V and frequency of 10 MHz.The statistical results of cell viability are shown in Fig. 7A. From the histogram, under APAP treatment, cell viability is negatively correlated with the concentration of APAP. When the concentration of APAP was 10 mM and 20 mM, cell viability was significantly reduced with time compared to the control group.
The albumin secretion level of the self-circulating liver lobule model is shown in Fig. 7B. Similar to the previous static/dynamic comparison, the albumin secretion increases and decreases, which may be caused by the increase of the basic number and secretory activity changes. The albumin secretion at APAP concentration of 10 mM and 20 mM declined sharply at 2.5 and 3.5 d which reflects the inhibition of cell activity. As the energy is removed to support other functions to maintain basal metabolism, albumin secretion, a relatively high level metabolic product is reduced.
Urea production by APAP dynamic treatment at different concentrations for 1.5, 2.5 and 3.5 d were also evaluated by the method above. Different from the data collected for the cell viability and albumin secretion, the secretions of urea decreased in the first two days of dynamic culture, particularly at the concentration of 20 mM (Fig. 7C). This result is mainly caused by mitochondria damaged by APAP to varying degrees, which directly affects ammonia metabolism. At 3.5 d, the residual citrulline that maintained in the mitochondria was released, with cell organelle break down that can sustain urea production at a certain level. Based on these results, the effect of medicinal reactions on liver at low concentration has demonstrated that liver lobule model was injured in this self-circulating system obviously. For the current situation of no self-recirculating drug test model, our model can be used to detect drug metabolism in the liver under a dynamic environment.
6 Discussion
Based on our previous research, we constructed a self-circulating system on a chip integrating a 3D liver lobule model that can be used for dynamic drug screening and pathological study. The innovation of our research covered in this letter include the following: (1) we use a laser etching process to fabricate interdigitated electrodes on ITO that is rapid, more efficient and more inexpensive than the lift-off process of ITO or platinum.41–43 The minimum width of the electrode with the etching process can be controlled is 20 μm, whereas wet etching reaches approximately 50 μm, requiring a relatively high level of control for etching time and prior pattern processing.28,42,44 The result is that we increase the number of electrodes in a limited space approximately twice that used in the etching process. (2) Our self-circulating system can produce interstitial flow and vascular flow depending on the input parameters. The system integrated relatively more complex flow channels, and through actual measurement combined with simulation by finite element analysis, we achieved control of fluid velocity in branches at different applied AC voltages and frequencies without any thermal damage to the cells (as indicated by viability studies). Additionally, different from an AC electrothermal flow-driven microfluidic chip in which fluid affects only the cells on the electrode side,28 cells can be seeded on both sides of the channel by a method of double-sided bonding of the flow channel, which has scalable potential. (3) We constructed a membrane-free biomimetic liver lobule model, which form as a real multilayer structure of different types of cells in a spatial dimension. It is well-known that the co-culture of HepG2 with other types of specific cells would facilitate the bionics of liver function45–47 and the technology of cell-patterning can be further applied in this area.48 Through different methods, such as 3D stereolithography bioprinting,21 enhanced field-induced dielectrophoresis (DEP)20 or patterned collagen adsorbing cells,24 a radial shaped liver lobule model can be achieved. However, HUVECs and HepG2 cells are seeded on different interfaces, and blood does not contact HepG2 cells directly in an actual 3D biomimetic liver lobule. In addition, another method is the multilayer co-cultivation, which requires the porous membranes, such as PET or silicon nitride,17–19 and has a poor permeability that is not as good as direct contact at the bionic level. The remaining methods such as freestanding stacked mesh-like hydrogel sheets that produce a direct contact multilayer structure with an alginate precursor and calcium chloride dihydrate would not be used as a method for long-term culture due to the poor biocompatibility and expandability of cells.22 Our 3D biomimetic liver lobule model is a sandwich structure in which the endothelial layer is tightly attached to underlying hepatic cell-laden layer, which can protect hepatocytes from the destructive effect of fluid shear stress while ensuing effective nutrient transmission.5,23 By comparison, in dynamic culture and static culture, we observed that the flow shear force would enhance the metabolism of cells and from additional experiments in dynamic culture, APAP treatment at different concentration confirmed the feasibility of pharmacokinetic research. The results of some routine testing indicators such as cell viability, albumin secretion and urea synthesis conformed to general experimental laws.However, there remain some deficiencies in our research. (1) Due to the flow channel requiring a certain height to generate an electrothermal vortex to actuate the fluid, the size of the entire chip is larger than a traditional microfluidic chip. Therefore, optimizing the entire structural design is required in order to reduce the resistance of fluid flow and improve the utilization of space. (2) The current development of organ-on-chip is to integrate different organs in a parallel system. Therefore, the next step is to co-cultivate multiple organs in a closed-loop system and verify the interaction between different tissues and organs to construct a relatively complete metabolic system.
7 Conclusions
In summary, we fabricated an AC electrothermal self-circulating system by laser etching on ITO glass that can easily and efficiently improve the process of patterning of inter-digital electrodes. A 3D biomimetic liver lobule model shaped similar to a sandwich with hepatocytes on the bottom layer and an endothelium layer in the middle- was integrated with the fluid channel. By adjusting the input signal, the fluid velocity in the flow channel can be controlled without complex external devices, and temperature increases are rarely observed at the applied voltage of 7 V and frequency of 10 MHz. By comparing the metabolism of liver lobule in static and dynamic culture, we verified that the stress induced by the flow is more suitable for the growth of our liver lobule. In addition, we constructed a hepatic drug test model using APAP treatment at different concentrations in the dynamic culture. The results of cell viability, albumin secretion and urea synthesis showed that our self-circulating liver lobule system has the pharmacokinetic properties of the liver. Our future work will focus on the research and development of materials to reduce the resistance of fluid flow and additionally decrease the size of the system. We also plan to integrate the self-circulating system with more tissue or organ types to achieve a true sense of a self-circulating human model on a chip.Conflicts of interest
There are no conflicts to declare.Acknowledgements
This study was kindly supported by the Projects of Basic Research of Shenzhen, China (No. JCYJ20170817162507554, JCYJ20170817162121275, JCYJ20170817162629875, & JCYJ20170412101508433).References
- D. Huh, H. J. Kim, J. P. Fraser, D. E. Shea, M. Khan, A. Bahinski, G. A. Hamilton and D. E. Ingber, Nat. Protoc., 2013, 8, 2135–2157 CrossRef CAS PubMed.
- S. R. Khetani and S. N. Bhatia, Nat. Biotechnol., 2008, 26, 120–126 CrossRef CAS PubMed.
- D. Huh, G. A. Hamilton and D. E. Ingber, Trends Cell Biol., 2011, 21, 745 CrossRef CAS PubMed.
- A. Skardal, T. Shupe and A. Atala, Drug Discovery Today, 2016, 21, 1399–1411 CrossRef CAS PubMed.
- Y. Wang, W. Su, L. Wang, L. Jiang, Y. Liu, L. Hui and J. Qin, Toxicol. Res., 2017, 7, 13–21 RSC.
- Z. Li, L. Jiang, Y. Zhu, W. Su, C. Xu, T. Tao, Y. Shi and J. Qin, Toxicol. In Vitro, 2018, 46 CrossRef CAS PubMed.
- S. A. Lee, D. Y. No, E. Kang, J. Ju, D. S. Kim and S. H. Lee, Lab Chip, 2013, 13, 3529–3537 RSC.
- J. M. Prot, C. Aninat, L. Griscom, F. Razan, C. Brochot, C. G. Guillouzo, C. Legallais, A. Corlu and E. Leclerc, Biotechnol. Bioeng., 2011, 108, 1704–1715 CrossRef CAS PubMed.
- L. A. Vernetti, N. Senutovitch, R. Boltz, R. Debiasio, Y. S. Tong, A. Gough and D. L. Taylor, Exp. Biol. Med., 2016, 241, 101 CrossRef CAS PubMed.
- C. T. Ho, R. Z. Lin, W. Y. Chang, H. Y. Chang and C. H. Liu, Lab Chip, 2006, 6, 724–734 RSC.
- Y. B. Kang, T. R. Sodunke, J. Lamontagne, J. Cirillo, C. Rajiv, M. J. Bouchard and M. Noh, Biotechnol. Bioeng., 2015, 112, 2571–2582 CrossRef CAS PubMed.
- L. Prodanov, R. Jindal, S. S. Bale, M. Hegde, W. J. Mccarty, I. Golberg, A. Bhushan, M. L. Yarmush and O. B. Usta, Biotechnol. Bioeng., 2016, 113, 241–246 CrossRef CAS PubMed.
- Y. Du, N. Li, H. Yang, C. Luo, Y. Gong, C. Tong, Y. Gao, S. Lü and M. Long, Lab Chip, 2017, 17, 782–794 RSC.
- S. Zhang, L. Xia, C. H. Kang, G. Xiao, S. M. Ong, Y. C. Toh, H. L. Leo, N. D. Van, S. H. Kan and H. H. Tang, Biomaterials, 2008, 29, 3993–4002 CrossRef CAS PubMed.
- C. T. Ho, R. Z. Lin, R. J. Chen, C. K. Chin, S. E. Gong, H. Y. Chang, H. L. Peng, L. Hsu, T. R. Yew and S. F. Chang, Lab Chip, 2013, 13, 3578–3587 RSC.
- X. Ma, X. Qu, W. Zhu, Y. S. Li, S. Yuan, H. Zhang, J. Liu, P. Wang, C. S. Lai and F. Zanella, Proc. Natl. Acad. Sci. U. S. A., 2016, 113, 2206 CrossRef CAS PubMed.
- J. Son, C. Y. Bae and J. K. Park, Biotechnol. J., 2016, 11, 585–591 CrossRef CAS PubMed.
- A. A. Banaeiyan, J. Theobald, J. Paukštyte, S. Wölfl, C. B. Adiels and M. Goksör, Biofabrication, 2017, 9, 15014 CrossRef PubMed.
- M. Chao, Z. Lei, E. M. Zhou, J. Xu, S. Shen and J. Wang, Anal. Chem., 2016, 88, 1719 CrossRef PubMed.
- S. Mi, X. Yi, Z. Du, Y. Xu and W. Sun, Biofabrication, 2018, 10, 25010 CrossRef PubMed.
- X. Liu, K. Yang, A. Wadhwa, S. Eda, S. Li and J. Wu, Sens. Actuators, A, 2011, 171, 406–413 CrossRef CAS.
- Y. Quan and W. Jie, Biomed. Microdevices, 2013, 15, 125–133 CrossRef PubMed.
- Q. Lang, Y. Wu, Y. Ren, Y. Tao, L. Lei and H. Jiang, ACS Appl. Mater. Interfaces, 2015, 7, 26792–26801 CrossRef CAS PubMed.
- R. H. Vafaie, H. B. Ghavifekr, H. Lintel, J. Brugger and P. Renaud, Electrophoresis, 2016, 37, 719–726 CrossRef CAS PubMed.
- W. Y. Ng, S. Goh, Y. C. Lam, C. Yang and I. Rodríguez, Lab Chip, 2009, 9, 802–809 RSC.
- N. G. Green, A. Ramos, A. Gonzalez, H. Morgan and A. Castellanos, Phys. Rev. E: Stat. Phys., Plasmas, Fluids, Relat. Interdiscip. Top., 2000, 61, 4011 CrossRef CAS.
- A. Castellanos, A. Ramos, A. González, N. G. Green and H. Morgan, J. Phys. D: Appl. Phys., 2003, 36, 2584–2597 CrossRef CAS.
- A. Ramos, H. Morgan, N. G. Green and A. Castellanos, J. Phys. D: Appl. Phys., 1998, 31, 2338–2353 CrossRef CAS.
- M. Lian and J. Wu, Microfluid. Nanofluid., 2009, 7, 757 CrossRef CAS.
- Q. Yuan, K. Yang and J. Wu, Microfluid. Nanofluid., 2014, 16, 167–178 CrossRef CAS.
- A. González, A. Ramos, H. Morgan, N. G. Green and A. Castellanos, J. Fluid Mech., 2006, 564, 415–433 CrossRef.
- F. Gao, S. S. Naini, J. Wagner and R. Miller, Int. J. Refrig., 2016, 73, 99–110 CrossRef.
- F. Gao, L. Zhao, M. C. Boufadel, T. King, B. Robinson, R. Conmy and R. Miller, Appl. Ocean Res., 2017, 68, 77–90 CrossRef.
- J. Wu, M. Lian and K. Yang, Appl. Phys. Lett., 2007, 90, 56302 Search PubMed.
- R. Riahi, S. A. M. Shaegh, M. Ghaderi, S. Z. Yu, R. S. Su, J. Aleman, S. Massa, D. Kim, M. R. Dokmeci and A. Khademhosseini, Sci. Rep., 2016, 6, 24598 CrossRef CAS PubMed.
- A. Salari, M. Navi and C. Dalton, Biomicrofluidics, 2015, 9, 14113 CrossRef CAS PubMed.
- H. C. Feldman, M. Sigurdson and C. D. Meinhart, Lab Chip, 2007, 7, 1553–1559 RSC.
- I. Wagner, E. M. Materne, S. Brincker, U. Süssbier, C. Frädrich, M. Busek, F. Sonntag, D. A. Sakharov, E. V. Trushkin and A. G. Tonevitsky, Lab Chip, 2013, 13, 3538–3547 RSC.
- W. Y. Ng, S. Goh, Y. C. Lam, C. Yang and I. Rodríguez, Lab Chip, 2009, 9, 802–809 RSC.
- B. J. Kane, M. J. Zinner, M. L. Yarmush and M. Toner, Anal. Chem., 2006, 78, 4291 CrossRef CAS PubMed.
- Y. Du, N. Li, H. Yang, C. Luo, Y. Gong, C. Tong, Y. Gao, S. Lü and M. Long, Lab Chip, 2017, 17, 782–794 RSC.
- J. M. Prot, C. Aninat, L. Griscom, F. Razan, C. Brochot, C. G. Guillouzo, C. Legallais, A. Corlu and E. Leclerc, Biotechnol. Bioeng., 2011, 108, 1704–1715 CrossRef CAS PubMed.
- B. J. Kane, M. J. Zinner, M. L. Yarmush and M. Toner, Anal. Chem., 2006, 78, 4291 CrossRef CAS PubMed.
- C. T. Ho, R. Z. Lin and R. J. Chen, et al., Liver-cell patterning lab chip: mimicking the morphology of liver lobule tissue, Lab Chip, 2013, 13(18), 3578–3587 RSC.
- N. W. Y. Wan, N. A. Kadri and F. Ibrahim, Cell Patterning for Liver Tissue Engineering via Dielectrophoretic Mechanisms, Sensors, 2014, 14(7), 11714–11734 CrossRef PubMed.
- C. T. Ho, R. Z. Lin and H. Y. Chang, et al., In-Vitro Rapid Centimeter-Scale Reconstruction of Lobule-Mimetic Liver Tissue Employing Dielectrophoresis-Based Cell Patterning, Solid-State Sensors, Actuators and Microsystems Conference Transducers 2007, International, IEEE, 2007, pp. 351–354 Search PubMed.
- S. J. Kim, H. Ise and M. Goto, et al., Interactions of vimentin- or desmin-expressing liver cells with N-acetylglucosamine-bearing polymers, Biomaterials, 2012, 33(7), 2154–2164 CrossRef CAS PubMed.
- R. Chang, K. Emami and H. Wu, et al., Biofabrication of a three-dimensional liver micro-organ as an in vitro drug metabolism model, Biofabrication, 2010, 2(4), 045004 CrossRef PubMed.
Footnotes |
| † Electronic supplementary information (ESI) available. See DOI: 10.1039/c8ra03724h |
| ‡ These authors contributed equally to this work. |
| This journal is © The Royal Society of Chemistry 2018 |

