
 Open Access Article
 This Open Access Article is licensed under a Creative Commons Attribution-Non Commercial 3.0 Unported Licence
The anticancer efficacy of paclitaxel liposomes modified with low-toxicity hydrophobic cell-penetrating peptides in breast cancer: an in vitro and in vivo evaluation
Qi Zhanga,
Jing Wanga,
Hao Zhanga,
Dan Liua,
Linlin Mingb,
Lei Liua,
Yan Dongc,
Baiyu Jianc and
Defu Cai *a
*a
aInstitute of Medicine and Drug Research, Qiqihar Medical University, Qiqihar 161006, P. R. China. E-mail: cai@qmu.edu.cn; Tel: +86-452-2663376
bThe Third Affiliated Hospital, Qiqihar Medical University, Qiqihar 161006, P. R. China
cCollege of Pharmacy, Qiqihar Medical University, Qiqihar, 161006, P. R. China
First published on 2nd July 2018
Abstract
In our recent study, hydrophobic cell-penetrating peptides (CPPs) were demonstrated as an effective method of improving cancer treatment. To provide more evidence and broaden the application range for this promising strategy of improving cancer treatment, novel hydrophobic CPP-modified (PFV-modified) nanoliposomes loaded with paclitaxel, termed PFV-Lip-PTX, were developed as a treatment for breast cancer. Physicochemical evaluations of PFV-Lip-PTX revealed spheroid-like regular vesicles of about 120 nm in diameter with negative charge. An in vitro release study indicated that PTX was released from the liposomes in a controlled and sustained manner. A cellular uptake study indicated that PFV-Lip-PTX exhibited higher internalization efficiency in MCF-7 cells than non-modified liposomes. It was also demonstrated that PFV modification improved the cytotoxicity of PTX via a hydrophobic interaction between the PFV-Lip and cell lipid membranes compared with non-modified liposomes. Moreover, in vivo studies demonstrated that the PFV-modified liposomes led to highly efficient targeting and accumulation in an MCF-7 xenograft tumor and improved the antitumor efficacy of PTX. Finally, PFV-Lip-PTX showed low systemic toxicity evidenced by fewer changes in the body weights of mice and no visible histological changes in major healthy organs. Therefore, our results indicate that PFV-Lip-PTX has great potential in tumor-targeting and effective antitumor treatment.
1. Introduction
Breast cancer is the most common cancer in women, and one of the three most common cancers worldwide, along with lung and colon cancers.1 It is characterized by wild cell growth in breast tissues leading to metastasis, invasion of adjacent tissue and infiltration beyond the breasts. One in eight to ten women will develop breast cancer in their lifetime. In 2012, almost 1.7 million people were diagnosed worldwide and about half a million people died from this disease.2 Although surgery is a preferred method to remove breast cancer, it is difficult to completely remove the tumor and inhibit its rapid recurrence. Thus, chemotherapy is required to supplement the treatment deficit of surgery. Among the most commonly used chemotherapeutic drugs, taxanes have been established as a viable treatment choice for breast cancer.3Paclitaxel (PTX), a natural alkaloid from the Pacific yew, has a considerably wide therapeutic range against ovarian cancer, breast cancer, non-small cell lung cancer, stomach cancer, head and neck carcinomas, advanced forms of Kaposi's sarcoma and acute leukemia.4,5 PTX exerts its action through binding to the β-subunit of tubulin, a component of microtubules that results in the formation of stable microtubule assemblies.6 Subsequent PTX blocks the mitotic checkpoint and arrests cells in the late G2 and M phases of the cell cycle.7 However, the significant activity of PTX in clinical applications is greatly restricted by its poor water solubility, low therapeutic index and severe side effects at high doses.8 Due to the low water solubility of PTX in conventional formulations, a mixture of Cremophor EL and dehydrated ethanol (50![[thin space (1/6-em)]](https://www.rsc.org/images/entities/char_2009.gif) :50, v/v) was applied as a co-solvent in the first clinical formulation of PTX under the trade name of Taxol®.9 It is characterized by very low drug loading (1 wt%). Therefore, substantial amounts of Cremophor EL and ethanol are necessary to ensure an effective dose of PTX. However, many serious side effects including neutropenia, hypersensitivity, anaphylactic reactions, nephrotoxicity and neurotoxicity have been attributed to Cremophor EL, which remarkably impede dosing and often require clinical intervention.10,11 These negative side effects mean that the medical benefits obtained from PTX seem to have reached a plateau. Hence, the development of an improved delivery system for PTX is extremely desirable.
:50, v/v) was applied as a co-solvent in the first clinical formulation of PTX under the trade name of Taxol®.9 It is characterized by very low drug loading (1 wt%). Therefore, substantial amounts of Cremophor EL and ethanol are necessary to ensure an effective dose of PTX. However, many serious side effects including neutropenia, hypersensitivity, anaphylactic reactions, nephrotoxicity and neurotoxicity have been attributed to Cremophor EL, which remarkably impede dosing and often require clinical intervention.10,11 These negative side effects mean that the medical benefits obtained from PTX seem to have reached a plateau. Hence, the development of an improved delivery system for PTX is extremely desirable.
Fortunately, the introduction of nanotechnology in oncology could alleviate potential systemic toxicity and improve the therapeutic effect of PTX. A few successful nano-delivery formulations have already been accepted as alternative formulations of PTX on the market, such as Abraxane® (albumin-bound PTX nanoparticles), Lipusu® (PTX liposome injection) and Genexol-PM® (PTX polylactide-polyethylene glycol micelles).12 Well-designed nanocarriers for the delivery of PTX to tumor tissues might possess numerous appealing properties, such as increased PTX solubility, the ability to promote accumulation in tumor sites via passive and/or active targeting, reduced side effects and controlled release.13 Among the various existing delivery systems, liposomes are the most promising for clinical applications, as they exhibit high delivery efficiency, good biocompatibility, non-immunogenicity and the ability to encapsulate hydrophobic and hydrophilic drugs.14 However, compared to Taxol, PTX liposomes do not show a significant difference in response rate, and can also lead to the development of hematological and nervous system toxicity in patients.15 Its clinical effect in increasing survival is still unclear. Usually, it is difficult to achieve good outcomes when using liposomes as a clinical treatment, as they often cannot efficiently enter tumor cells.16 To overcome this difficulty, some specific functional moieties have been attached on the surfaces of liposomes for further functionalization on the basis of passive targeting.17 Among the many proposed strategies for improved delivery of liposomes, cell penetrating peptides (CPPs) have appeared as an achievable strategy and have led to encouraging results. One of the most remarkable properties of CPPs is their capability to deliver bioactive cargo with molecular weights several times greater than their own through the cell membrane.18 Since the discovery of the first CPPs in 1988, a variety of CPPs derived from natural, chimeric and synthetic sources have been used to transport small RNA/DNA, plasmids, antibodies and nanoparticles into specific sites of different cells.19 However, most CPPs are positively charged and are classified as cationic CPPs, which present toxicity alongside cellular uptake improvement.
Hydrophobic CPPs have a low net charge, contain only non-polar residues and have a hydrophobic motif that is crucial for uptake. They exhibit low toxicity to normal cells, which contrasts what is observed for most cationic CPPs.20,21 Moreover, some hydrophobic CPPs can directly translocate across lipid cell membranes, which could be especially advantageous as they would immediately get to the cytosol, eliminating the risk of endosomal entrapment.22 Several hydrophobic CPPs have been confirmed to be efficient in delivering therapeutic molecules into cells, such as the signal sequence from integrin β3 (VTVLALGALAGVGVG),23 FGF (PIEVCMYREP)24 and a short sequence QLPVM.20 In our previous study, the typical hydrophobic CPP, PFVYLI (PFV), which is derived from α1-antitrypsin, was introduced to modify doxorubicin-loaded liposomes for the first time. The modified liposomes were capable of facilitating intracellular delivery as well as improving antitumor efficiency without apparent toxicity.25 Furthermore, PFV serving as a carrier could efficiently facilitate the intracellular transport of cargoes such as siRNA, fluorescent probes and proapoptotic peptides into a number of different cell lines.26–28 However, further proof is needed to support the conclusion that the introduction of hydrophobic CPPs is an appropriate choice to improve the intracellular delivery of nanocarriers.
To verify that functionalizing liposomes with PFV would facilitate their intracellular delivery via the hydrophobic interaction between PFV and cell lipid membranes, we synthesized a novel PFV-conjugated PEG-DSPE polymer and incorporated it into the liposomes. The prepared PFV-Lip was characterized in terms of particle size, zeta potential, morphology, encapsulation efficiency and drug release. The in vitro cellular uptake of the PFV-modified liposomes was investigated via flow cytometry, confocal microscopy and HPLC analysis on MCF-7 cells, and the in vitro cytotoxicity was determined through an SRB assay. Finally, the in vivo distribution and anti-tumor efficacy of PFV-Lip-PTX were investigated in MCF-7 tumor-bearing mice. The systemic toxicity of PFV-Lip-PTX after administration was also evaluated (Fig. 1).
 | ||
| Fig. 1 Scheme of PFVYLI-modified liposomes for targeted delivery of PTX in vivo. | ||
2. Experimental
2.1 Materials
Paclitaxel (PTX) was provided by Dalian Meilun Biotech Co., Ltd. (Dalian, China). Egg yolk phosphatidylcholine (EPC, LIPOID E-80) was obtained from LIPOID GmbH (Ludwigshafen, Germany). Cholesterol (Chol), sephadex G-50, Cou6, Hoechst 33258, sulforhodamine B (SRB), trichloroacetic acid (TCA) and Tris base were all purchased from Sigma-Aldrich (Shanghai, China). Near-infrared lipophilic carbocyanine dye DiR was obtained from Biotium, Inc. (Hayward, USA). PEG2000-DSPE and N-hydroxysuccinimidyl-PEG2000-DSPE were purchased from ToYong Biotech Co., Ltd. (Shanghai, China). PFVYLI was provided by China Peptides Co., Ltd. (Shanghai, China). All other chemicals and reagents were purchased from Sigma-Aldrich (Shanghai, China) unless otherwise stated.Female BALB/c nude mice of 18–20 g were obtained from Beijing Vital River Laboratory Animal Technology Co., Ltd. (Beijing, China). Before the experiment, they were kept under SPF conditions for 1 week and were allowed free access to standard food and water. All animal procedures were performed in accordance with the Guidelines for Care and Use of Laboratory Animals of Qiqihar Medical University and experiments were approved by the Animal Ethics Committee of Qiqihar Medical University.
2.2 Cell culture
The human breast cancer cell line MCF-7 was obtained from the Institute of Basic Medical Science, Chinese Academy of Medical Science (Beijing, China). The MCF-7 cells were cultured in RPMI-1640 medium (Macgene, China) supplemented with 10% FBS (Gibco, USA) and 1% penicillin–streptomycin solution (Macgene, China) at 37 °C in 5% CO2 air.2.3 Conjugation of PFV peptide with NHS-PEG-DSPE
PFV-PEG-DSPE was synthesized in our laboratory according to a previously reported method.25 PFV was conjugated with NHS-PEG-DSPE through a nucleophilic substitution reaction. Briefly, PFV peptide and NHS-PEG2000-DSPE in a 1:2 molar ratio were dissolved in anhydrous DMF, and the pH of the reaction mixture was adjusted to 8.0–9.0 with triethylamine. The reaction was kept at room temperature under moderate stirring and the reaction was monitored by HPLC (Waters, USA). After 144 h, the reaction product was subjected to dialysis (MWCO 3500 Da) against deionized water to remove the unconjugated PFV peptide. Finally, the dialysate was lyophilized and stored at −20 °C until required. The product was identified using a MALDI-TOF mass spectrometry (Bruker Daltonics, USA).
2.4 Preparation and characterization of various drug-loaded liposomes
The thin-film hydration method was used to prepare the liposomes loaded with PTX or fluorescent dye (Cou6 or DiR) as described previously.29 Typically, 15.9 mg of EPC, 4.1 mg of Chol, 4.7 mg of PEG2000-DSPE and 1.5 mg of PFV-PEG2000-DSPE were used in the preparation of the PFV-modified liposomes. For the unmodified liposomes, 15.9 mg of EPC, 4.1 mg of Chol, and 6.0 mg of PEG2000-DSPE were used. 1.0 mg of PTX or 10 μg of fluorescent dye were added into the liposomal compositions to prepare drug-loaded or fluorescence-labeled liposomes, respectively. Lipid mixtures with PTX or fluorescent dye were co-dissolved in 35 mL dichloromethane, and the organic solvent was removed by rotary evaporation. Then the obtained film was further dried and stored under vacuum overnight. The lipid film was hydrated with phosphate buffer (pH 7.4), followed by sonication at 37 °C for 1 h until a clear solution was obtained. The liposome suspension was extruded through polycarbonate membranes with a pore size of 220 nm followed by gel filtration over a Sephadex G-50 column to remove the unencapsulated PTX or fluorescent dye. The liposomes were stored at 4 °C and used within 2 weeks of preparation.The particle sizes and zeta-potentials of different liposomes were determined by dynamic light scattering (DLS) using a Nicomp 380ZLS (PSS, USA). The analysis was performed with 633 nm laser light at a scattering angle of 90° at 25 °C. The liposome solution was diluted 100-fold with PBS before measurement. Three measurements were taken for each sample. Transmission electron microscopy (Hitachi HT-7700, Japan) was used to observe the morphology of the liposomes. The liposome solution was diluted 10-fold with water and a drop of the diluted solution was placed on a carbon film and negatively stained with 1% phosphotungstic acid. After drying in air, sample analyses were carried out on a TEM with an acceleration of 100 kV.
The encapsulation efficiency (EE) of PTX in liposomes was quantified using a HPLC system. Liposome solution was diluted 10-fold with methanol, and was then eluted on an Agilent TC-C18 column (250 × 4.6 mm id, 5 μm particles) at a temperature of 30 °C. The mobile phase consisted of acetonitrile and water (60:40, v/v), which was delivered at a flow rate of 1.0 mL min−1. The injection volume was 10 μL and the PTX absorbance was measured at a wavelength of 227 nm. The EE was calculated by the following equation: EE = W/W0 × 100%, where W0 and W represent the amounts of PTX in the liposomes before and after passing over the Sephadex G-50 column, respectively.
The release profile of PTX from PFV-Lip-PTX was investigated using a dialysis method. Briefly, a volume of 1.0 mL of purified liposome suspension was mixed with 3 mL of RPMI-1640 medium containing 10% FBS, and transferred into a dialysis bag (MWCO 12000–14000 Da) sealed at both ends. Then the bag was immersed in 30 mL of release medium (1.0 M sodium salicylate) at 37 °C, followed by gentle shaking at 100 rpm. At predetermined time intervals (2, 4, 6, 8, 12 and 24 h), a 1.0 mL aliquot of the release medium was collected and replaced with an equal volume of fresh medium. After the 24 h period of the release test, the released amount of PTX in each time point was measured via HPLC.
2.5 In vitro cellular uptake studies
000 events collected, excitation at 488 nm and detection at 560 nm. Each assay was performed in triplicate.000 rpm for 10 min and the supernatant was analyzed using HPLC to measure PTX uptake by MCF-7 cells. HPLC detection conditions for PTX were similar to those described in Section 2.4.2.6 In vitro cytotoxicity studies
The cytotoxic effects of free PTX, Lip-PTX and PFV-Lip-PTX against MCF-7 cells were determined using the sulforhodamine B (SRB) colorimetric assay. Briefly, MCF-7 cells were cultured in 96-well plates at a density of 5000 cells per well. After incubation for 24 h, cells were treated with a series of concentrations of free PTX, Lip-PTX and PFV-Lip-PTX (0.25–256 ng mL−1) diluted with complete RPMI-1640 medium for 48 h at 37 °C. Then the cells were fixed with 10% cold trichloroacetic acid, followed by washing and drying in the air. Subsequently, the fixed cells were stained with 0.4% SRB for 30 min, washed with 1% acetic acid and dissolved in 10 mM Tris base solution. Finally, the absorption representing cell viability was measured using a plate reader (Thermo Scientific, Multiskan FC, USA) at 540 nm. All data were calculated as the percentages of viable cells relative to the survival of the control group (cells treated with medium) and presented as the mean ± SD (n = 3). The IC50 values were calculated using SPSS software.2.7 In vivo distribution study of PFV-Lip-DiR by live imaging
The MCF-7 tumor xenograft model was established on BALB/c nude mice by subcutaneous inoculation of MCF-7 cells (2 × 10⁶) in the right armpit. When the tumor volume reached 50–100 mm3, the MCF-7 tumor-bearing mice were randomly divided into three groups and received intravenous injections of 0.2 mL free DiR, Lip-DiR and PFV-Lip-DiR via the tail vein. The final concentration of DiR was 5 μg mL−1. At 2, 4, 8, 12, 24, 36 and 48 h after administration, mice were anesthetized with 2% isoflurane and the distributions of different formulations were visualized using an In Vivo Imaging System (Carestream Health, USA). After that, the mice were sacrificed immediately by cervical dislocation. The tumors and organs were collected and ex vivo fluorescence images were obtained on the same system.2.8 In vivo antitumor efficacy and toxicity studies
In vivo antitumor efficacy was assessed using the xenograft tumor model as established above. When the tumor volume reached approximately 100 mm3, the mice were randomly assigned into 4 groups and treated with 0.2 mL of physiological saline, Taxol, Lip-PTX or PFV-Lip-PTX via the tail vein at a dosage of 10 mg PTX/kg body weight on every second day for a total of 5 doses. The mice were then monitored every other day for tumor volumes and body weights. Tumor volume was calculated as V = (length × width2)/2. At the end point of the experiment, the mice were sacrificed, and the tumors were excised and weighed to evaluate the in vivo anti-tumor efficacy. The major organs were excised to make H&E staining sections, which were observed using an optical microscope for histological analyses to evaluate the toxicity of the PTX solution and liposomes.2.9 Statistical analysis
All the quantitative data were presented as the mean ± SD, and Student's t test or one-way analysis of variance was performed to evaluate significance among groups. A value of P less than 0.05 or 0.01 was considered to be statistically significant or highly significant.3. Results and discussion
3.1 Conjugation of PFV peptide with NHS-PEG-DSPE
The targeting copolymer of PFV-PEG-DSPE was synthesized by conjugating isoleucine residue of PFV to NHS-PEG2000-DSPE. According to the HPLC chromatograms in Fig. 2B, the retention time of unreacted PFV was about 21.2 min and the conjugation efficiency was about 79.2% after 6 days. These results indicate that PFV had been conjugated to PEG-DSPE. The formation of PFV-PEG2000-DSPE was further confirmed using MALDI-TOF mass spectrometry. As shown in the MALDI-TOF MS spectra (Fig. 2C), the molecular weight (MW) of the reaction product was approximately 3655 Da, which was in good agreement with the theoretical MW, confirming that the targeting copolymer of PFV-PEG-DSPE had been successfully prepared.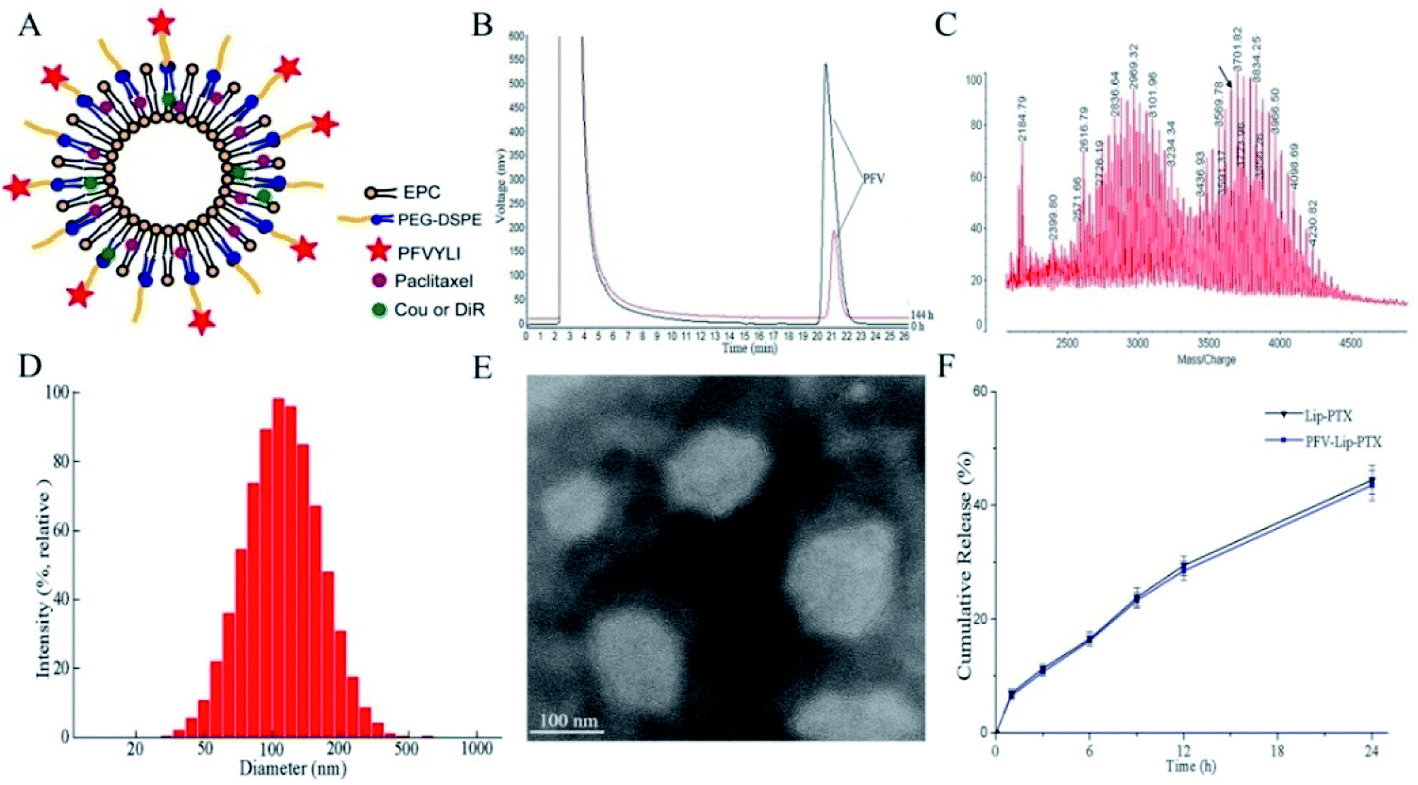 | ||
| Fig. 2 Characteristics of PFV-modified liposomes loaded with PTX. (A) Schematic representation of PFV-modified Liposomes (PFV-Lip). (B) HPLC spectra monitoring the reaction of PFV with NHS-PEG2000-DSPE. (C) MALDI-TOF MS spectra of PFV-PEG2000-DSPE. (D) Size distribution graph of PFV-Lip-PTX obtained via dynamic light scattering. (E) Transmission electron microscopy (TEM) image of PFV-Lip-PTX. (F) In vitro release of PTX from Lip-PTX and PFV-Lip-PTX (n = 3). | ||
3.2 Preparation and characterization of various drug-loaded liposomes
Fig. 2A shows a schematic representation of the PFV-modified liposomes. The physicochemical properties of PTX, coumarin-6 (Cou6) and 1,10-dioctadecyltetramethyl indotricarbocy-anine iodide (DiR) loaded liposomes with or without PFV modification are summarized in Table 1. Cou6 and DiR were used as hydrophobic fluorescent probes to investigate cellular uptake and the in vivo distribution of PFV-Lip. It has been previously reported that liposome size, especially aggregation size in the presence of serum, is one of the most important factors governing the fate of liposomes in vivo.30 In this study, the mean particle sizes of various liposomes were in the range of 105.4–123.0 nm, with low polydispersity index (PDI) values of less than 0.25. This size range is acknowledged as the best particle size for EPR. A typical particle size distribution graph of PFV-Lip-PTX is shown in Fig. 2D. The morphological structure was investigated using TEM (Fig. 2E). The TEM image shows that PFV-Lip-PTX comprises spheroid-like regular vesicles that are smaller than 200 nm in diameter, which is identical to the value obtained using DLS. Additionally, all liposomes are slightly charged with negative zeta potentials of less than −3 mV, meaning that they are in the ideal charge range to accumulate in tumors efficiently and avoid nonspecific organ uptake.31 On the other hand, the EEs are all higher than 90%. These results indicate that PFV modification would not bring about any significant changes to the physicochemical properties of the liposomes, and thus may not have any influence during the comparison of these two liposomal formulations.32| Size (nm) | PDI | Zeta potential | Encapsulation efficiency (%) | |
|---|---|---|---|---|
| Lip-PTX | 119.0 ± 5.3 | 0.210 ± 0.035 | −2.69 ± 0.89 | 92.2 ± 4.3 |
| PFV-Lip-PTX | 123.0 ± 7.1 | 0.194 ± 0.025 | −1.53 ± 0.63 | 90.7 ± 2.6 |
| Lip-Cou6 | 110.8 ± 5.7 | 0.183 ± 0.037 | −2.41 ± 0.97 | 93.3 ± 1.9 |
| PFV-Lip-Cou6 | 106.8 ± 4.5 | 0.141 ± 0.029 | −2.83 ± 0.35 | 95.6 ± 3.1 |
| Lip-DiR | 105.4 ± 4.8 | 0.196 ± 0.031 | −2.27 ± 0.48 | 94.1 ± 2.5 |
| PFV-Lip-DiR | 109.4 ± 3.2 | 0.218 ± 0.046 | −1.36 ± 0.21 | 92.1 ± 3.2 |
In vitro release studies are an essential step during drug development, because they not only allow for quality control of formulations, but also reveal the in vivo performance of the product.33 The release profiles of PTX from different liposomes are presented in Fig. 2F. No burst release was detected, and similar release kinetics was observed between Lip-PTX and PFV-Lip-PTX. The release rates of PTX in two liposomes were less than 10% at the initial 1 h and approximately 50% at 24 h, indicating that the PTX remained encapsulated within the liposomes, thus leading to a delayed drug release. This is beneficial for tumor therapy, as it may prevent rapid leakage during systemic circulation and ensure that the PTX-loaded liposomes can reach and accumulate in the tumor sites.
Generally, the above results reveal that the PFV modification does not bring about visible changes to liposomes in terms of their size, surface potential, stability and release kinetics. This was favorable for the following comparison of these two liposomal systems in cell and animal studies.
3.3 In vitro cellular uptake studies
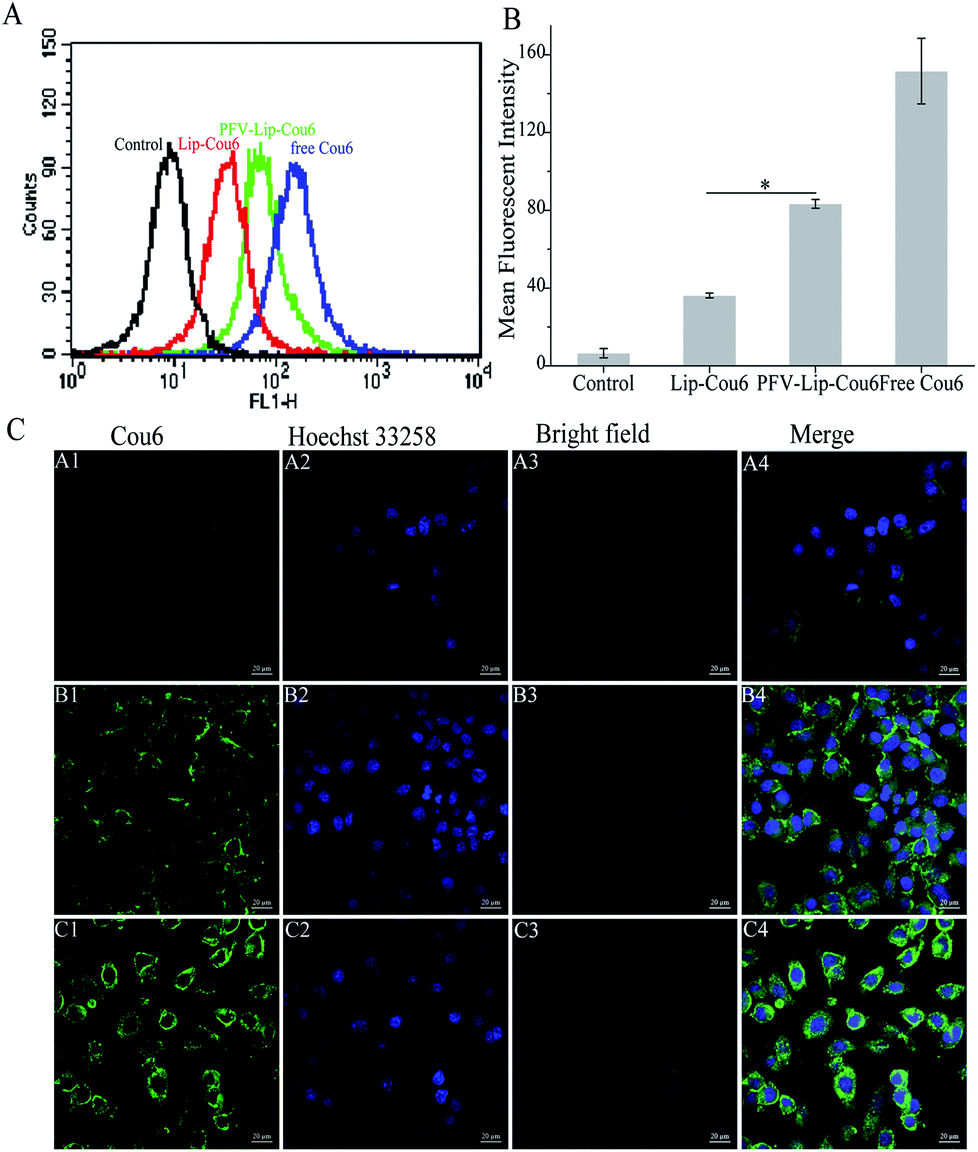 | ||
| Fig. 3 Cellular uptake study of free Cou6, Lip-Cou6 and PFV-Lip-Cou6 on MCF-7 cells at 37 °C for 1 h. The final concentration of Cou6 was 100 ng mL−1. (A) Flow cytometric quantitative determination of Cou6 uptake. (B) Quantitative analysis of Cou6 uptake based on flow cytometric plots. Each bar represents the mean fluorescence intensity ± SD (n = 3), *p < 0.01. (C) Laser scanning confocal microscopy images of cells incubated with Lip-Cou6 (A1-4), PFV-Lip-Cou6 (B1-4) and free Cou6 (C1-4). Green and blue indicate the fluorescence of Cou6 and Hoechst 33258, respectively. Scale bars represent 20 μm. | ||
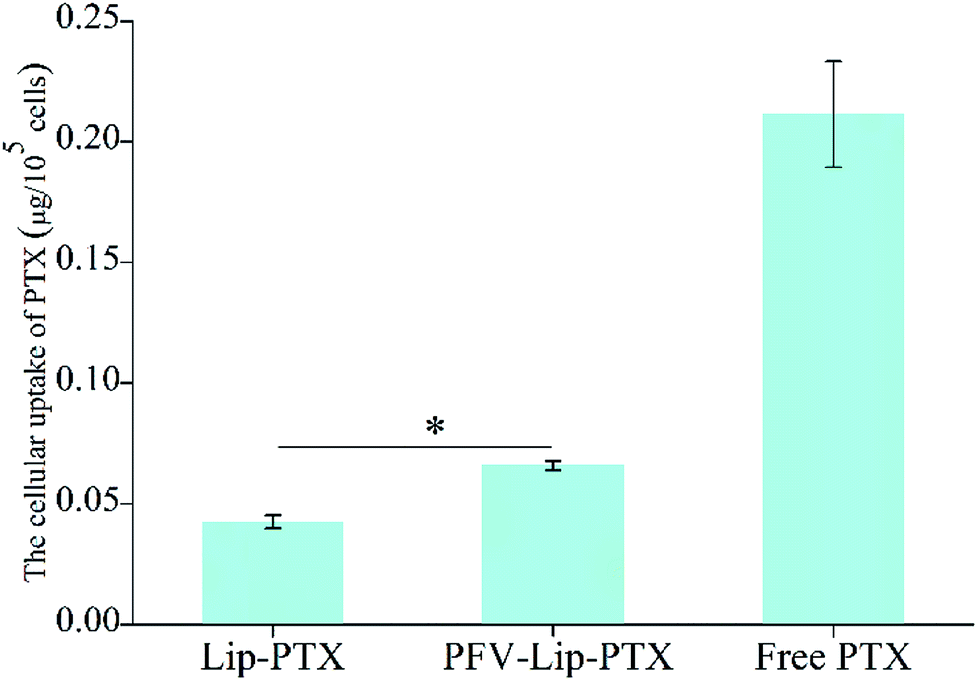 | ||
| Fig. 4 Cellular uptake study of free PTX, Lip-PTX and PFV-Lip-PTX on MCF-7 cells at 37 °C for 3 h. The final concentration of PTX was 10 μg mL−1. Each bar represents mean ± SD (n = 3), *p < 0.01. | ||
Ligand- or antibody-conjugated nanocarriers exhibit promising effects only in certain types of cancers that highly express the correlated specific receptors.35 However, patterns of receptor expression are diverse among different types of tumors and sometimes even within the same tumor, which limits the application of ligand- or antibody-based drug delivery systems.36 Theoretically, any interaction between cells and the specific molecules may be applied to enhance nanoparticle intracellular delivery. The hydrophobic interaction between hydrophobic peptides and cell membranes is another type of important interaction, which is often ignored or underestimated.21 The hydrophobic interaction is the primary driving force in a number of physiological events in the human body, including cell signaling, the formation of ion channels, cytolysis and cellular recognition.37 In this study, all the flow cytometry, confocal microscopy and HPLC results demonstrate that PFV modification obviously enhances the cellular uptake of liposomes on MCF-7 cells. This is attributed to the hydrophobic feature of PFV, which facilitates the interaction between the PFV-Lip and cell lipid membranes, thus improving the liposome intracellular uptake.
3.4 In vitro cytotoxicity studies
The first step in the therapeutic efficacy evaluation of the PFV-Lip-PTX formulation for breast cancer was to perform a cytotoxicity assay on MCF-7 cells using an SRB method. Fig. 5 shows the cell viabilities of free PTX, Lip-PTX and PFV-Lip-PTX under a series of PTX concentrations against MCF-7 cells. The results demonstrate that free PTX, Lip-PTX and PFV-Lip-PTX could inhibit cell proliferation in a concentration-dependent manner. The IC50 values of free PTX, Lip-PTX and PFV-Lip-PTX were calculated to be 3.44 ± 0.87, 34.98 ± 6.14 and 11.23 ± 3.69 ng mL−1, respectively, indicating that the cytotoxicity of PFV-Lip-PTX was significantly higher than that of Lip-PTX. It is obvious that free PTX exhibited stronger cytotoxicity than the two liposomal PTX formulations. As expected, PFV modification significantly enhanced the cytotoxicity of liposomal PTX at a concentration range of 4–256 ng mL−1.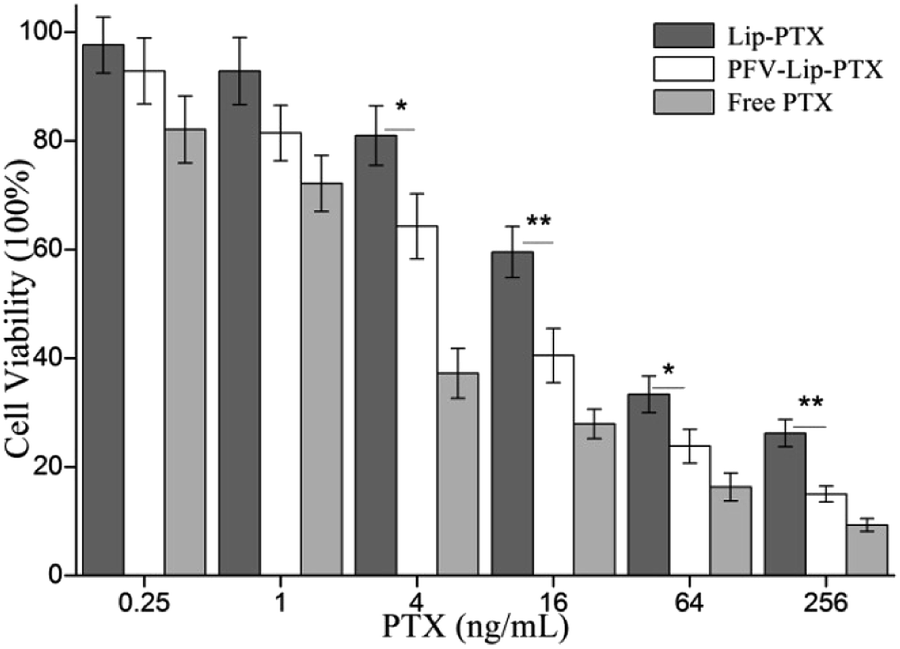 | ||
| Fig. 5 In vitro cytotoxicity of free PTX, Lip-PTX, and PFV-Lip-PTX on MCF-7 cells by SRB assay after treatment with indicated concentrations of PTX formulations for 48 h. Each bar represents mean ± SD (n = 3). * and ** indicate statistically different p < 0.05 and p < 0.01. | ||
PTX could inhibit cell microtubule disassembly and promote the formation of unusually stable microtubules, thereby disrupting the normal dynamic reorganization of the microtubule network required for mitosis and cell proliferation, and finally causing cell apoptosis.38 Thus, in this study, we observed that PTX could inhibit MCF-7 cell proliferation in a concentration-dependent manner. The cytotoxicity of PTX formulations against the MCF-7 cells followed the order: free PTX > PFV-Lip-PTX > Lip-PTX. Free PTX exhibited better cytotoxicity with a lower IC50 value than Lip-PTX and PFV-Lip-PTX, owing to the different internalization mechanisms of free PTX and PTX-loaded liposomes, and the sustained release manner of PTX from the liposomes. Free PTX could directly enter cells via passive diffusion and be effective, whereas the drug-loaded liposomes were mainly taken up by cells via the endocytic pathway and then the drug must be released to exert antitumor activity.39 The IC50 of the PFV-Lip-PTX group was found to be 3.1 times higher than that of Lip-PTX. The hydrophobic interaction of PFV with cell membranes could facilitate the cellular uptake of the liposomes, and then release PTX for anticancer effect. These results further confirm that the cellular uptake of the liposomes could be enhanced by the attachment of PFV on the surface of the liposomes, hence promoting the effectiveness of the PTX treatment.
3.5 In vivo distribution study of PFV-Lip-DiR by live imaging
To evaluate the in vivo biodistribution and tumor-targeting ability of the PFV-modified liposomes, free DiR, Lip-DiR and PFV-Lip-DiR were injected intravenously into mice bearing MCF-7 tumor xenografts and were monitored using a fluorescence imaging system. In the free DiR group, the fluorescence intensity in the tumor was negligible over a period of 48 h, revealing no specific accumulation of free DiR in the tumor (data not shown). As shown in Fig. 6A, the fluorescence signals in the tumors were detected in both the Lip-DiR and PFV-Lip-DiR groups at 2 h after administration. Both groups displayed specific fluorescence distribution in tumors over time through passive targeting. However, the PFV-Lip-DiR group had high tumor targeting capability and resulted in stronger fluorescence intensity in the tumor than the Lip-DiR control group, especially from 12 h to 48 h after administration. More importantly, the tumor accumulation of DiR in the PFV-Lip-DiR group occurred much earlier and lasted longer at a higher level than that in Lip-DiR group. The fluorescence intensity began to decrease from 24 h post-injection in the Lip-DiR group, whereas in the PFV-Lip-DiR group, the fluorescence intensity in the tumors gradually increased and was still obvious until 48 h. The ex vivo fluorescence images of the tumors and major organs at 48 h following i.v. injection revealed much stronger tumor fluorescence intensity in the PFV-Lip-DiR group than in the Lip-DiR group (Fig. 6B). As the typical tissue in RES, the livers and spleens had high fluorescence signals in both the Lip-DiR and Lip-SSLs-DiR groups, as expected. In brief, it was evident that the liposomes could target MCF-7 tumor tissue on the basis of the EPR effect after they were injected via the tail vein, and the PFV modification could further enhance the favorable distribution of PFV-Lip-DiR in the tumor site.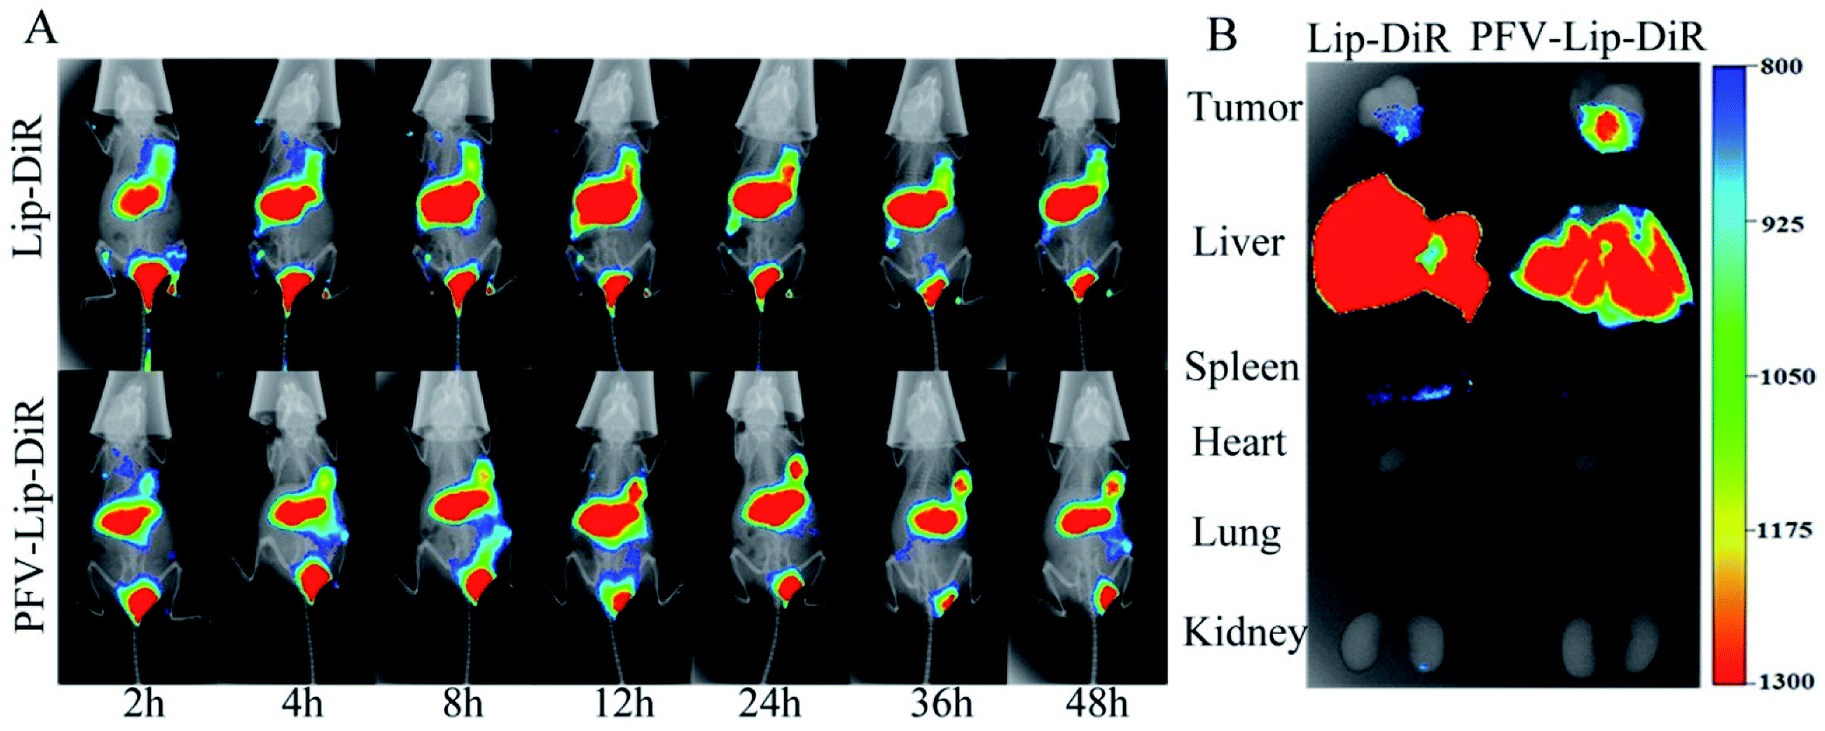 | ||
| Fig. 6 (A) Representative whole-body in vivo fluorescence images of MCF-7 tumor-bearing BALB/c nude mice were injected intravenously with different DiR-loaded liposomes at different time points. (B) Ex vivo fluorescent images of dissected tumors and major organs of mice sacrificed after 48 h circulation in the body. | ||
DiR, a near-infrared fluorescence probe, was utilized to label the liposomes as it could effectively reduce the interference caused by the animal auto-fluorescence.40 Compared with unmodified Lip-DiR, PFV-Lip-DiR showed a stronger fluorescence distribution in the tumor from 12 h to 48 h after administration, which was still significant at 48 h. It has been widely recognized that timely internalization by tumor cells can reduce the liposomes from re-entering systemic circulation.20 The higher tumor distribution of PFV-Lip is probably due to PFV modification increasing the internalization, before PFV-Lip could re-enter systemic circulation, allowing PTX to exert its therapeutic effects inside the cells.41
3.6 In vivo antitumor efficacy and toxicity studies
The PFV-modified liposomes showed definite antitumor effects in vitro. Therefore, the in vivo anti-tumor efficiency and systemic toxicity of PFV-Lip-PTX were further investigated. Fig. 7 displays the anti-tumor effects of various PTX formulations against MCF-7 tumor-bearing BALB/c nude mice. Based on the tumor volume curve in Fig. 7A, tumor growth in the physiological saline group was more rapid than that in all PTX treatment groups. When compared to free PTX and Lip-PTX groups, the PFV-Lip-PTX group showed outstanding tumor suppression activity during the total test process and was significantly different (p < 0.05). At the end of the experiment, the ex vivo tumor weight of different treatment groups in Fig. 7B further confirmed that PFV-Lip-PTX exhibited significant tumor inhibition compared with Lip-PTX in the MCF-7 tumor-bearing mouse model. These results clearly indicate the greater tumor suppressive efficacy of our established PFV-Lip-PTX. The enhanced antitumor efficacy of PFV-Lip-PTX may be explained as follows: (1) negatively-charged PFV-Lip-PTX in circulation interacts less with plasma proteins, so it can resist non-specific protein absorption and escape RES rapid elimination;42 (2) the particle sizes of PFV-Lip-PTX are in the ideal range to take advantage of the EPR effect for tumor therapy, inducing greater accumulation of PFV-Lip-PTX into the tumor tissue via the EPR effect;43 (3) the liposomes possess excellent stability; and (4) PFV modification increases the cellular uptake of PFV-Lip-PTX to enhance cytotoxicity in breast cancer cells.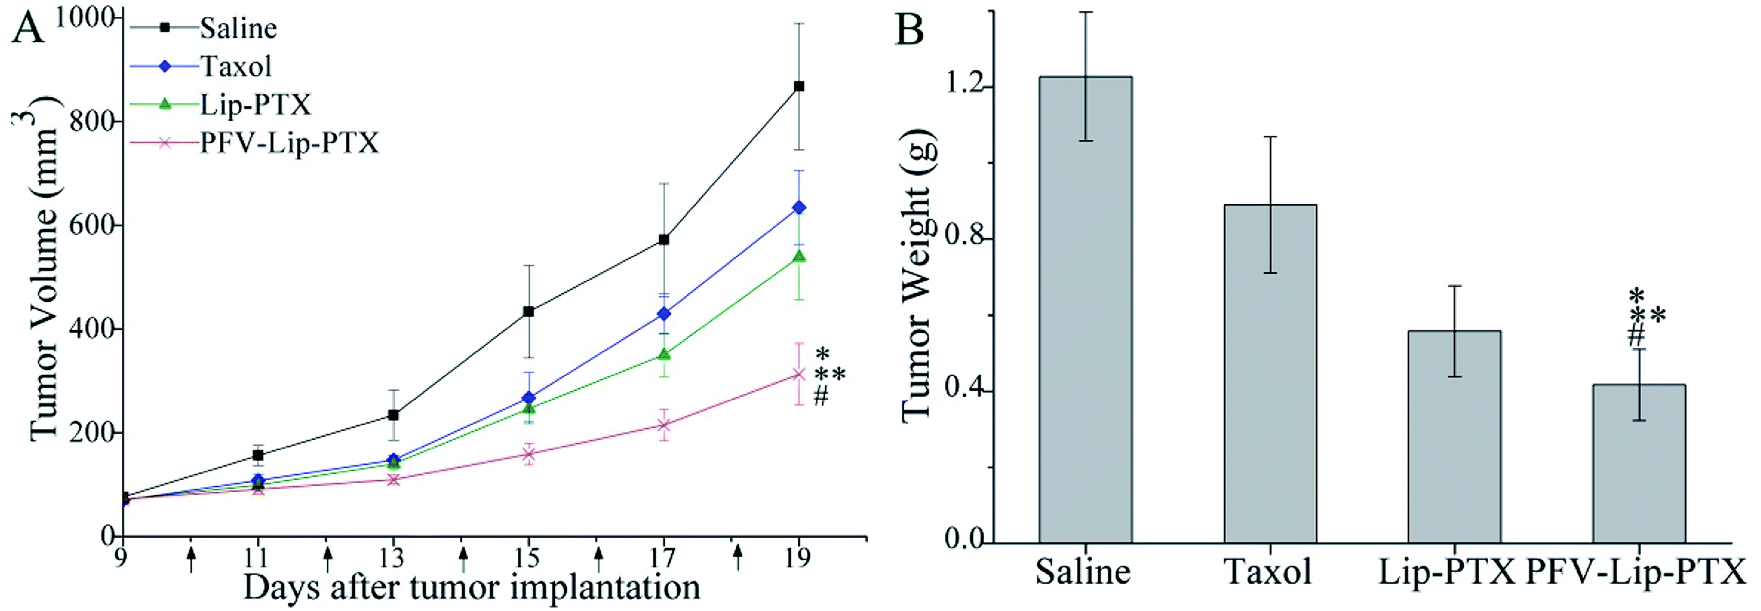 | ||
| Fig. 7 In vivo antitumor efficacy and toxicity studies in MCF-7 human breast tumor-bearing BALB/c nude mice. Mice were treated with saline, Taxol, Lip-PTX and PFV-Lip-PTX every other day 5 times at a dosage of 10 mg kg−1 PTX. (A) Tumor volume changes of mice treated with different PTX-loaded formulations. (B) The weight of the excised tumor masses from different treatment groups. The black arrows note the day of administration. Data are presented as mean ± SD (n = 6). Notes: *p < 0.01 vs. saline; **p < 0.05 vs. taxol; #p < 0.05 vs. Lip-PTX. | ||
Mouse body weight changes in all groups, as an indicator of systemic toxicity, were measured simultaneously. As shown in Fig. 8, the body weights of mice in the control group slightly increased, and all the PTX treatment groups did not show sharp body weight loss. The body weight of mice in the Taxol group decreased to a greater extent than those in the PFV-Lip-PTX-treated group, suggesting the low systemic toxicity of PFV-Lip-PTX. The histological examination of several healthy organs of mice following treatment was conducted using H&E staining (Fig. 9). H&E staining showed that PFV-Lip-PTX did not cause visible histological changes to the major healthy organs over the duration of the experiment. These results confirm that PFV-modified liposomes can provide better anti-tumor effects with low systemic toxicity.
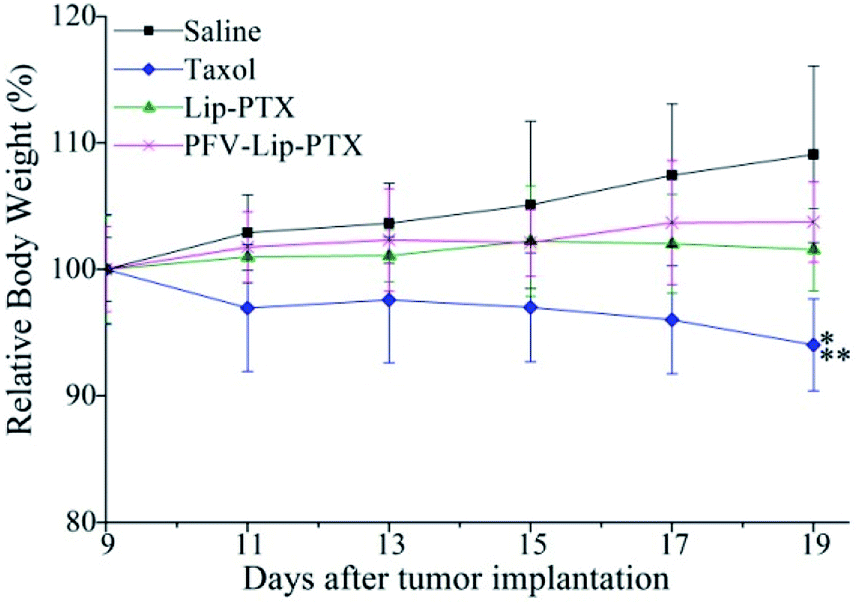 | ||
| Fig. 8 Body weight changes of mice during anti-tumor efficacy study (n = 6). Notes: *p < 0.01 vs. saline; **p < 0.05 vs. PFV-Lip-PTX. | ||
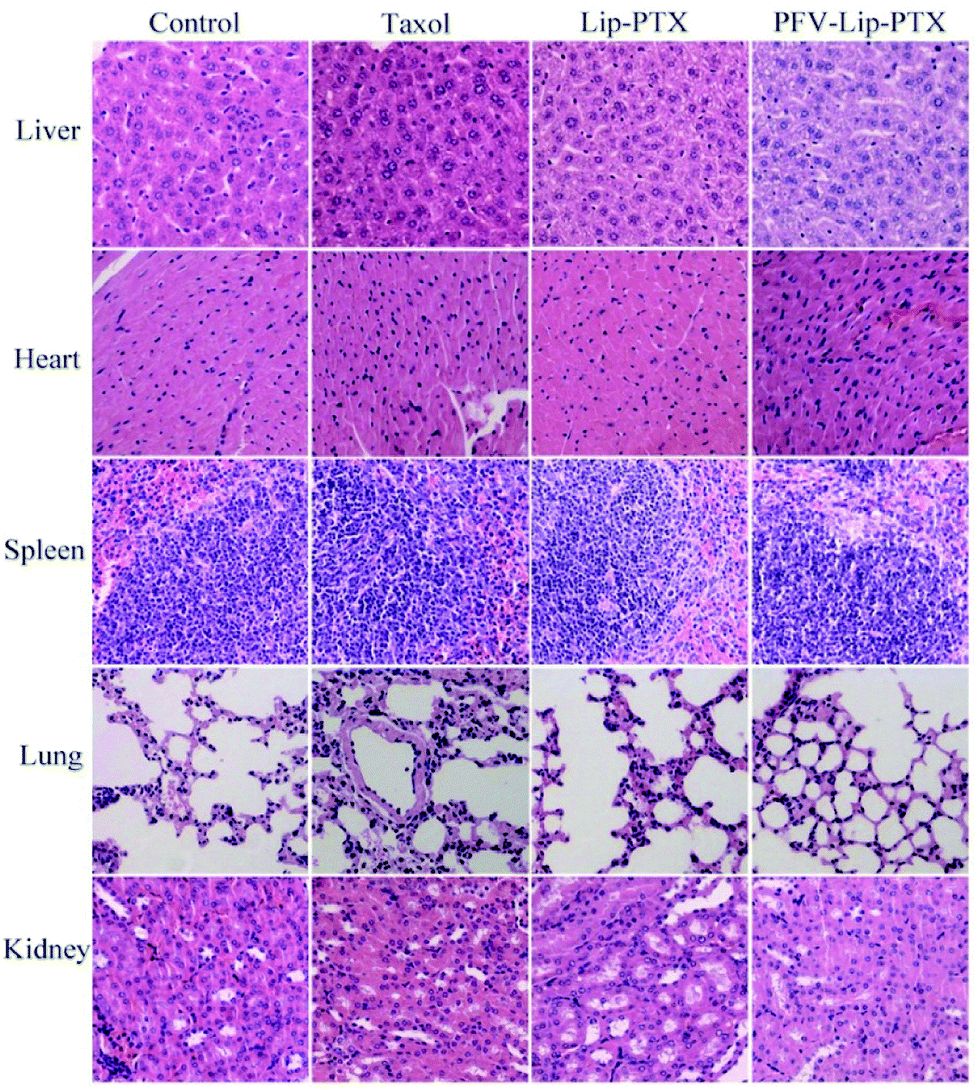 | ||
| Fig. 9 Representative light microscopy images of several healthy organ (×200) tissue sections with H&E staining. | ||
In addition to the treatment for breast cancer indicated in this study, we believe that the PFV-modified liposomes could be used for the delivery of different therapeutic or imaging agents to heterogeneous tumors, based on our studies into the mechanism of cellular uptake. Although the interaction between PFV and the tumor cell membrane is nonspecific, combined with the EPR effect of nano-sized liposomes, PFV-Lip shows potential to enhance the tumor tissue distribution and improve the antitumor therapy. In this way, this study with PFV is similar to previous research on cyclosporine A and QLPVM-functionalized liposomes, and PFV-, CSA- and QLPVM-modified systems are generally similar to CPP- or target ligand-modified liposomes.20,21,44
4. Conclusions
PFVYLI, a low toxicity hydrophobic CPP, was successfully used to modify liposomes (PFV-Lip) to deliver PTX for the first time. PFV-Lip-PTX showed remarkable characteristics including ideal size and charge, narrow size distribution, high encapsulation efficiency and a controlled, sustained release profile. We demonstrated that PFV modification could enhance the binding of PFV-Lip to cancer cells via a hydrophobic interaction, and thus facilitate the intracellular delivery of liposomes into cancer cells. The results of cytotoxicity, in vivo distribution and antitumor efficacy experiments confirmed the superior therapeutic efficacy of PFV-Lip-PTX in vitro and in vivo. Furthermore, PFV-Lip-PTX displayed less systemic toxicity in terms of body weight changes and histological section observations. It is believed that PFV-Lip can provide us with a new perspective based on hydrophobicity, which is different to that exhibited by classic cationic CPPs. Consequently, PFV-Lip represents a promising platform for the improvement of therapeutic efficacy and reduction of drug toxicity, which may be widely applicable to the delivery of different types of chemotherapy drugs or imaging agents to various tumors.Conflicts of interest
There are no conflicts to declare.Acknowledgements
The project was financially supported by the Natural Science Foundation of Heilongjiang Province of China (No. H2015069).References
- N. Harbeck and M. Gnant, Lancet, 2017, 389, 1134–1150 CrossRef.
- L. A. Torre, F. Bray, R. L. Siegel, J. Ferlay, J. Lortet-Tieulent and A. Jemal, Ca-Cancer J. Clin., 2015, 65, 87–108 CrossRef PubMed.
- N. S. El Saghir, A. Tfayli, H. A. Hatoum, Z. Nachef, P. Dinh and A. Awada, Crit. Rev. Oncol. Hematol., 2011, 80, 433–449 CrossRef PubMed.
- F. Ravar, E. Saadat, M. Gholami, P. Dehghankelishadi, M. Mahdavi, S. Azami and F. A. Dorkoosh, J. Controlled Release, 2016, 229, 10–22 CrossRef PubMed.
- Y. Y. Shen, Z. K. Pi, F. Yan, C. K. Yeh, X. J. Zeng, X. F. Diao, Y. X. Hu, S. P. Chen, X. Chen and H. R. Zheng, Int. J. Nanomed., 2017, 12, 5613–5629 CrossRef PubMed.
- K. L. Crossin and D. H. Carney, Cell, 1981, 27, 341–350 CrossRef PubMed.
- S. P. Akhlaghi, S. Saremi, S. N. Ostad, R. Dinarvand and F. Atyabi, J. Nanomed. Nanotechnol., 2010, 6, 689–697 CrossRef PubMed.
- A. Safavy, Curr. Drug Delivery, 2008, 5, 42–54 CrossRef.
- P. Ma, S. R. Benhabbour, L. Peng and R. J. Mumper, Cancer Lett., 2013, 334, 253–262 CrossRef PubMed.
- L. B. Ling, Y. W. Du, M. Ismail, R. Y. He, Y. P. Hou, Z. L. Fu, Y. Zhang, C. Yao and X. S. Li, Int. J. Pharm., 2017, 526, 11–22 CrossRef PubMed.
- R. B. Weiss, R. C. Donehower, P. H. Wiernik, T. Ohnuma, R. J. Gralla, D. L. Trump, J. R. Baker Jr, D. A. Van Echo, D. D. Von Hoff and B. Leyland-Jones, J. Clin. Oncol., 1990, 8, 1263–1268 CrossRef PubMed.
- Z. P. Zhang, L. Mei and S. S. Feng, Expert Opin. Drug Delivery, 2013, 10, 325–340 CrossRef PubMed.
- S. Singh and A. K. Dash, Crit. Rev. Ther. Drug Carrier Syst., 2009, 26, 333–372 CrossRef PubMed.
- P. P. Deshpande, S. Biswas and V. P. Torchilin, Nanomedicine, 2013, 8, 1509–1528 CrossRef PubMed.
- X. Xu, L. Wang, H. Q. Xu, X. E. Huang, Y. D. Qian and J. Xiang, Asian Pac. J. Cancer Prev., 2013, 14, 2591–2594 CrossRef PubMed.
- O. C. Farokhzad and R. Langer, ACS Nano, 2009, 3, 16–20 CrossRef PubMed.
- J. W. Sun, L. Jiang, Y. Lin, E. M. Gerhard, X. H. Jiang, L. Li, J. Yang and Z. W. Gu, Int. J. Nanomed., 2017, 12, 1517–1537 CrossRef PubMed.
- C. P. Cerrato, K. Kunnapuu and U. Langel, Expert Opin. Drug Delivery, 2017, 14, 245–255 CrossRef PubMed.
- D. M. Copolovici, K. Langel, E. Eriste and U. Langel, ACS Nano, 2014, 8, 1972–1994 CrossRef PubMed.
- X. Y. Wang, X. H. Chen, X. C. Yang, W. Gao, B. He, W. B. Dai, H. Zhang, X. Q. Wang, J. C. Wang, X. Zhang, Z. F. Dai and Q. Zhang, J. Nanomed. Nanotechnol., 2016, 12, 387–397 CrossRef PubMed.
- W. Gao, X. C. Yang, Z. Q. Lin, S. Y. Gao, B. He, D. Mei, D. Wang, L. Yuan, H. Zhang, W. B. Dai, X. Q. Wang, J. C. Wang, X. Zhang and Q. Zhang, J. Biomed. Nanotechnol., 2016, 12, 1183–1198 CrossRef PubMed.
- J. R. Marks, J. Placone, K. Hristova and W. C. Wimley, J. Am. Chem. Soc., 2011, 133, 8995–9004 CrossRef PubMed.
- X. Y. Liu, S. Timmons, Y. Z. Lin and J. Hawiger, Proc. Natl. Acad. Sci. U. S. A., 1996, 93, 11819–11824 CrossRef.
- F. Nakayama, T. Yasuda, S. Umeda, M. Asada, T. Imamura, V. Meineke and M. Akashi, J. Biol. Chem., 2011, 286, 25823–25834 CrossRef PubMed.
- D. F. Cai, W. Gao, B. He, W. B. Dai, H. Zhang, X. Q. Wang, J. C. Wang, X. Zhang and Q. Zhang, Biomaterials, 2014, 35, 2283–2294 CrossRef PubMed.
- C. L. Watkins, P. Brennan, C. Fegan, K. Takayama, I. Nakase, S. Futaki and A. T. Jones, J. Controlled Release, 2009, 140, 237–244 CrossRef PubMed.
- J. W. Park, E. K. Bang, E. M. Jeon and B. H. Kim, Org. Biomol. Chem., 2012, 10, 96–102 RSC.
- M. Rhee and P. Davis, J. Biol. Chem., 2006, 281, 1233–1240 CrossRef PubMed.
- B. Du, S. P. Han, H. Y. Li, F. F. Zhao, X. J. Su, X. H. Cao and Z. Z. Zhang, Nanoscale, 2015, 7, 5411–5426 RSC.
- N. Maeda, Y. Takeuchi, M. Takada, Y. Sadzuka, Y. Namba and N. Oku, J. Controlled Release, 2004, 100, 41–52 CrossRef PubMed.
- C. B. He, Y. P. Hu, L. C. Yin, C. Tang and C. H. Yin, Biomaterials, 2010, 31, 3657–3666 CrossRef PubMed.
- M. A. Theresa, W. K. C. Wilson, I. H. Jennifer and M. L. Kimberley, Anti-Cancer Agents Med. Chem., 2006, 6, 513–523 CrossRef.
- M. L. Van Slooten, O. Boerman, K. Romoren, E. Kedar, D. J. Crommelin and G. Storm, Biochim. Biophys. Acta, 2001, 1530, 134–145 CrossRef.
- N. Düzgüneş and S. Nir, Adv. Drug Delivery Rev., 1999, 40, 3–18 CrossRef.
- M. Li, H. Deng, H. Peng and Q. Wang, J. Nanosci. Nanotechnol., 2014, 14, 415–432 CrossRef PubMed.
- R. K. Thapa, H. T. Nguyen, M. Gautam, A. Shrestha, E. S. Lee, S. K. Ku, H. G. Choi, C. S. Yong and J. O. Kim, Drug Delivery, 2017, 24, 1690–1702 CrossRef PubMed.
- S. Kolusheva, T. Shahal and R. Jelinek, Biochemistry, 2000, 39, 15851–15859 CrossRef PubMed.
- Y. Wang, S. Ma, Z. Xie and H. Zhang, Colloids Surf., B, 2014, 116, 41–48 CrossRef PubMed.
- D. Zhu, S. Wu, C. Hu, Z. Chen, H. Wang, F. Fan, Y. Qin, C. Wang, H. Sun, X. Leng, D. Kong and L. Zhang, Acta Biomater., 2017, 58, 399–412 CrossRef PubMed.
- P. Sharma, S. Brown, G. Walter, S. Santra and B. Moudgil, Adv. Colloid Interface Sci., 2006, 123, 471–485 CrossRef PubMed.
- T. Lammers, F. Kiessling, W. E. Hennink and G. Storm, J. Controlled Release, 2012, 161, 175–187 CrossRef PubMed.
- L. Jiang, L. Li, X. D. He, Q. Y. Yi, B. He, J. Cao, W. S. Pan and Z. W. Gu, Biomaterials, 2015, 52, 126–139 CrossRef PubMed.
- E. Gullotti and Y. Yeo, Mol. Pharm., 2009, 6, 1041–1051 CrossRef PubMed.
- K. Saar, M. Lindgren, M. Hansen, E. Eiríksdóttir, Y. Jiang, K. Rosenthal-Aizman, M. Sassian and Ü. Langel, Anal. Biochem., 2005, 345, 55–65 CrossRef PubMed.
| This journal is © The Royal Society of Chemistry 2018 |