 Open Access Article
Facile morphology control of 3D porous CeO2 for CO oxidation†
Xia Jiang,
Xiaochun Huang,
Wei Zeng,
Jiale Huang,
Yanmei Zheng,
Daohua Sun * and
Qingbiao Li*
Department of Chemical and Biochemical Engineering, College of Chemistry and Chemical Engineering, Xiamen University, Xiamen, 361005, P. R. China. E-mail: sdaohua@xmu.edu.cn; kelqb@xmu.edu.cn
First published on 13th June 2018
Abstract
3D porous CeO2 with various morphologies was successfully synthesized via a facile precipitation using glycine as the soft bio-template. During the synthesis, it was demonstrated that the morphology of CeO2 depended on the molar ratio of reactants. Furthermore, the catalytic performance towards CO oxidation of the as-synthesized CeO2 with different morphologies was investigated. CeO2 with a bowknot shape showed excellent catalytic performance, giving complete CO conversion at 370 °C, due to its properties of much higher oxygen vacancies, loosely packed pore structure and larger specific surface area.
Introduction
CeO2 has the most widespread applications in catalysis owing to its excellent oxygen storage capacity.1,2 It has been proved that the morphology of CeO2 could influence its catalytic performance to a certain extent. Specifically, the 3D structure of CeO2 possesses remarkable advantages compared to 2D or 1D CeO2 samples.3 Thus, it is of great significance to obtain 3D porous CeO2 materials with various shapes.Numerous methods for synthesis of 3D porous CeO2 with different morphologies have been developed, including spray pyrolysis,4 precipitation methods,5,6 combustion synthesis,7 hydrothermal methods,8–10 etc. However, among these methods, hazardous reagents and a series of energy consuming and tedious manipulations are usually needed. Again, it is difficult to obtain different morphologies of CeO2 in the same preparation route. Hence, it is still a challenge to develop a facile process to synthesize 3D porous CeO2 with different types of morphologies.
The bio-template method is one of the common synthesis strategies to prepare porous materials.11 To date, diatom,12 butterfly,13 wood,14 leaf,15 cotton16 and pollen17 etc. are used as hard biotemplate to prepare kinds of porous materials. Qian reported that porous CeO2 was obtained through a bio-template of lotus pollen.18 However, this method was difficult to tune the pore structure and morphology of CeO2, for the reason that the structure of the templates was natural and inherent. Amine acid, with the special structure of –NH2 and –COOH, has been used in fabricating porous materials.19,20 Among the numerous amine acids, glycine is the simplest in the structure. Moreover, Guo reported that amine acid with 2 carbon atoms (such as glycine) led to more loosely packed material, while the amine acid with more complicated structure and more carbons usually resulted in the close-packed products.20 The loosely packed material owns more slit holes, which could increase the ability of mass transfer in catalysis.
Herein, a simple and soft bio-template of glycine was chosen to direct the growth of CeO2 by a milder precipitation method in this work. We obtained 3D porous CeO2 (A-CeO2) with different morphologies by facilely changing the preparation conditions. Furthermore, the model reaction of CO oxidation was used to evaluate the influence of the structure of CeO2.
Experimental
Urea, glycine, anhydrous ethanol, and cerium nitrate (Ce(NO3)3·6H2O) were analytical grade, and used as received. A-CeO2 was prepared as following: 3.50 g Ce(NO3)3·6H2O and 1.44 g urea were dissolved in 200 mL deionized water under vigorous stirring at room temperature, then 1.20 g glycine was added. After stirring for another 1 h, the solution was transferred to drying oven heated at 100 °C for certain time. Finally, the sample was dried and calcined at 500 °C in air. The obtained product is denoted as A-CeO2 (3![[thin space (1/6-em)]](https://www.rsc.org/images/entities/char_2009.gif) :
:![[thin space (1/6-em)]](https://www.rsc.org/images/entities/char_2009.gif) 2
2![[thin space (1/6-em)]](https://www.rsc.org/images/entities/char_2009.gif) :
:![[thin space (1/6-em)]](https://www.rsc.org/images/entities/char_2009.gif) 1), the proportion in brackets is the molar ratio of urea, glycine and cerium nitrate. Different molar ratio of reactants for A-CeO2 was prepared under the same reaction condition. The CeO2 bulk was prepared by calcining Ce(NO3)3·6H2O at 600 °C directly.
1), the proportion in brackets is the molar ratio of urea, glycine and cerium nitrate. Different molar ratio of reactants for A-CeO2 was prepared under the same reaction condition. The CeO2 bulk was prepared by calcining Ce(NO3)3·6H2O at 600 °C directly.
Functional groups of A-CeO2 samples were investigated by Fourier transform infrared spectroscopy (FTIR, Nicolet 6700, USA). The crystal phases were obtained on X-ray powder diffraction (XRD, RigakuUltima IV, Japan). The UV-vis diffuse reflectance spectral (UV-vis DRS, Varian Cary 5000, USA) characterization was employed to calculate the band gap energy of samples. The thermo-gravimetric analysis (TGA, SDT Q600, USA) performed the thermal behavior of A-CeO2. Morphologies of the samples were taken by scanning electron microscope (SEM, ZEISS SIGMA, Germany) and TEM (TECNAI F30, USA). Surface area and pore were characterized by N2 adsorption/desorption measurements (BET, Tristar II3020, USA), pore size was calculated by the Barrett–Joyner–Halenda (BJH) model. Raman analysis (Renishaw, INvia) for detecting the oxygen vacancy was performed using a 532 nm excitation laser. The Ce valence state was detected by XPS (Physical Electronics, USA) using a monochromated Al Kα (1486.7 eV) as X-ray source in which the binding energy was calibrated with C 1s 284.8 eV. The H2-TPR was used to illustrate the reducibility of samples.
The CO oxidation was carried out under atmospheric pressure in a fixed bed reactor containing 0.1 g catalyst. The reactor stream was composition of CO (1%), O2 (1%) and Ar (98%) with the total flow rate of 20![[thin space (1/6-em)]](https://www.rsc.org/images/entities/char_2009.gif) 000 mL h−1 gcat−1. The reactants and products analysis were investigated by gas chromatography (GC 9560) with a thermal conductivity detector.
000 mL h−1 gcat−1. The reactants and products analysis were investigated by gas chromatography (GC 9560) with a thermal conductivity detector.
Results and discussion
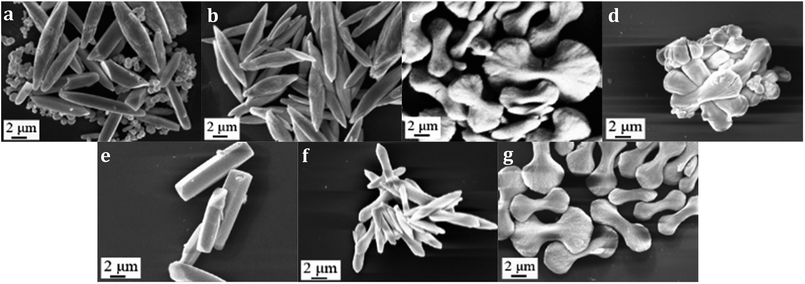
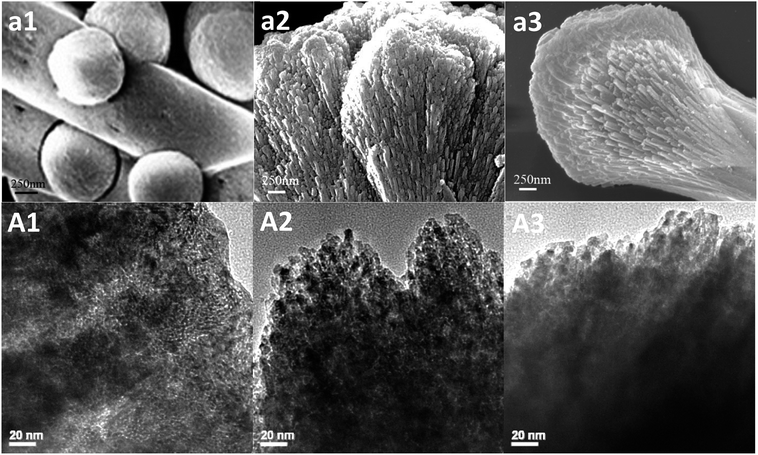
A-CeO2 was prepared as illustrated in Fig. 1. Ce(NO3)3·6H2O, urea and glycine were dissolved in deionized water under vigorous stirring at room temperature for a certain time, then the solution was transferred to drying oven heated at 100 °C. Finally, the sample was dried and calcined at 500 °C (according to Fig. S1†) in air. The preparation was easy to implement, and we could obtain various morphologies of A-CeO2 by simply changing the molar ratio of reactants (urea, glycine and cerium nitrate). As shown in Fig. 2, A-CeO2 with about 10 μm spindle structure and a few spherical particles were obtained without introducing glycine (Fig. 2a). As the increase of glycine, the spherical particles disappeared (Fig. 2b), further increasing mole ratio of glycine, the morphology of A-CeO2 changed to bowknot (Fig. 2c) and bulk shape (Fig. 2d). Simply, the existence of glycine brought more uniform structure of A-CeO2, and the amount of glycine influenced the morphology of A-CeO2. The amount of urea and Ce precursor also affected the structure of A-CeO2. A-CeO2 (1.5![[thin space (1/6-em)]](https://www.rsc.org/images/entities/char_2009.gif) :
:![[thin space (1/6-em)]](https://www.rsc.org/images/entities/char_2009.gif) 2
2![[thin space (1/6-em)]](https://www.rsc.org/images/entities/char_2009.gif) :
:![[thin space (1/6-em)]](https://www.rsc.org/images/entities/char_2009.gif) 1) showed the prism shape (Fig. 2e), A-CeO2 (6
1) showed the prism shape (Fig. 2e), A-CeO2 (6![[thin space (1/6-em)]](https://www.rsc.org/images/entities/char_2009.gif) :
:![[thin space (1/6-em)]](https://www.rsc.org/images/entities/char_2009.gif) 2
2![[thin space (1/6-em)]](https://www.rsc.org/images/entities/char_2009.gif) :
:![[thin space (1/6-em)]](https://www.rsc.org/images/entities/char_2009.gif) 1) performed small dumbbell shape (Fig. 2f), and A-CeO2 (3
1) performed small dumbbell shape (Fig. 2f), and A-CeO2 (3![[thin space (1/6-em)]](https://www.rsc.org/images/entities/char_2009.gif) :
:![[thin space (1/6-em)]](https://www.rsc.org/images/entities/char_2009.gif) 2
2![[thin space (1/6-em)]](https://www.rsc.org/images/entities/char_2009.gif) :
:![[thin space (1/6-em)]](https://www.rsc.org/images/entities/char_2009.gif) 2) presented dumbbell shape (Fig. 2g). In Fig. 3, Enlarged Fig. 2 and TEM of special samples showed that different shapes owned different stack forms. It was no obvious stack when without glycine (Fig. 3a1 and A1). A-CeO2 (3
2) presented dumbbell shape (Fig. 2g). In Fig. 3, Enlarged Fig. 2 and TEM of special samples showed that different shapes owned different stack forms. It was no obvious stack when without glycine (Fig. 3a1 and A1). A-CeO2 (3![[thin space (1/6-em)]](https://www.rsc.org/images/entities/char_2009.gif) :
:![[thin space (1/6-em)]](https://www.rsc.org/images/entities/char_2009.gif) 2
2![[thin space (1/6-em)]](https://www.rsc.org/images/entities/char_2009.gif) :
:![[thin space (1/6-em)]](https://www.rsc.org/images/entities/char_2009.gif) 1) showed the stack form of sticks that was linked by balls. However, A-CeO2 (3
1) showed the stack form of sticks that was linked by balls. However, A-CeO2 (3![[thin space (1/6-em)]](https://www.rsc.org/images/entities/char_2009.gif) :
:![[thin space (1/6-em)]](https://www.rsc.org/images/entities/char_2009.gif) 2
2![[thin space (1/6-em)]](https://www.rsc.org/images/entities/char_2009.gif) :
:![[thin space (1/6-em)]](https://www.rsc.org/images/entities/char_2009.gif) 2) piled in prismatic forms.
2) piled in prismatic forms.
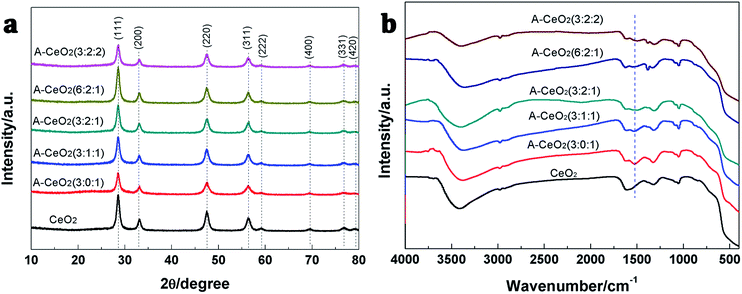
As shown in Fig. 4a, the prepared A-CeO2 had the same structure of cubic fluorite with face centered as CeO2 (JCPDS file no. 34-0394).2 Meanwhile, there were no other crystalline byproducts and obvious difference in characteristic diffraction peaks could be observed, confirming the high purity among various morphologies. In FTIR spectra (Fig. 4b), different morphologies of A-CeO2 showed basically consistence, but the obtained A-CeO2 exhibited a –NH flexural vibration at about 1522 cm−1 compared with CeO2, indicating that the addition of glycine could residual N element. Nitrogen adsorption–desorption isotherms of special samples (Fig. 5a) corresponded to the type IV curves with H3 hysteresis loop, that reflected the A-CeO2 owned the feature of slit mesoporous (2–4 nm, Fig. 5b). And, the samples exhibited similar pore size distribution rule. Different morphologies presented different specific surface areas (Table 1), and A-CeO2 (3![[thin space (1/6-em)]](https://www.rsc.org/images/entities/char_2009.gif) :
:![[thin space (1/6-em)]](https://www.rsc.org/images/entities/char_2009.gif) 2
2![[thin space (1/6-em)]](https://www.rsc.org/images/entities/char_2009.gif) :
:![[thin space (1/6-em)]](https://www.rsc.org/images/entities/char_2009.gif) 1) owned the larger specific surface areas of 85 m2 g−1. Hence, the 3D porous A-CeO2 with tuning morphology was successfully obtained via a milder process. The whole preparation process is more economic than the previous report by Mitchell and coworkers.21
1) owned the larger specific surface areas of 85 m2 g−1. Hence, the 3D porous A-CeO2 with tuning morphology was successfully obtained via a milder process. The whole preparation process is more economic than the previous report by Mitchell and coworkers.21
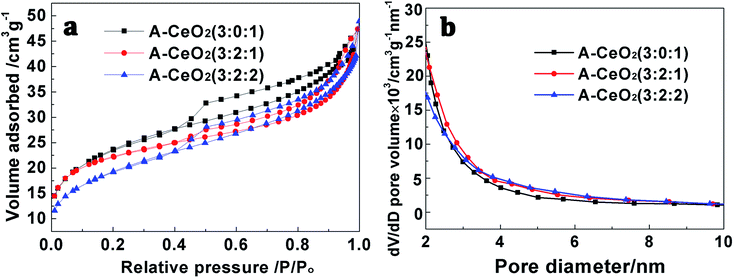 | ||
| Fig. 5 N2 adsorption–desorption isotherms (a) and corresponding pore size distribution curves (b) of different A-CeO2 with different ratio of reactant. | ||
| Samples | Eg (eV) | Area RCe–O/area F2g (%) | SBET (m2 g−1) | T100 (°C) |
|---|---|---|---|---|
| CeO2 | 2.67 | 5.91 | — | 620 |
A-CeO2 (3![[thin space (1/6-em)]](https://www.rsc.org/images/entities/char_2009.gif) : :![[thin space (1/6-em)]](https://www.rsc.org/images/entities/char_2009.gif) 0 0![[thin space (1/6-em)]](https://www.rsc.org/images/entities/char_2009.gif) : :![[thin space (1/6-em)]](https://www.rsc.org/images/entities/char_2009.gif) 1) 1) |
2.63 | 6.88 | 78 | 480 |
A-CeO2 (3![[thin space (1/6-em)]](https://www.rsc.org/images/entities/char_2009.gif) : :![[thin space (1/6-em)]](https://www.rsc.org/images/entities/char_2009.gif) 2 2![[thin space (1/6-em)]](https://www.rsc.org/images/entities/char_2009.gif) : :![[thin space (1/6-em)]](https://www.rsc.org/images/entities/char_2009.gif) 1) 1) |
2.48 | 8.74 | 85 | 370 |
A-CeO2 (3![[thin space (1/6-em)]](https://www.rsc.org/images/entities/char_2009.gif) : :![[thin space (1/6-em)]](https://www.rsc.org/images/entities/char_2009.gif) 2 2![[thin space (1/6-em)]](https://www.rsc.org/images/entities/char_2009.gif) : :![[thin space (1/6-em)]](https://www.rsc.org/images/entities/char_2009.gif) 2) 2) |
2.47 | 7.38 | 70 | 480 |
As we all know that oxygen vacancies dominate the electronic and chemical properties of CeO2.2 In this work, Raman (Fig. 6a) and XPS (Fig. 6b and S3†) were used to exhibit the concentration of oxygen vacancies. According to the report,22 the typical Raman shift at 460 cm−1 and 600 cm−1 can be assigned to F2g vibration of the fluorite-type structure and oxygen vacancies. More importantly, the integral area ratios of oxygen vacancy peak (RCe–O) and F2g reflect the oxygen vacancy concentration. As shown in Table 1, A-CeO2 (3![[thin space (1/6-em)]](https://www.rsc.org/images/entities/char_2009.gif) :
:![[thin space (1/6-em)]](https://www.rsc.org/images/entities/char_2009.gif) 2
2![[thin space (1/6-em)]](https://www.rsc.org/images/entities/char_2009.gif) :
:![[thin space (1/6-em)]](https://www.rsc.org/images/entities/char_2009.gif) 1) had the larger oxygen vacancy concentration, and relatively narrower energy gap (Eg) (Fig. S2† and Table 1) further verified the higher oxygen vacancy concentration of A-CeO2 (3
1) had the larger oxygen vacancy concentration, and relatively narrower energy gap (Eg) (Fig. S2† and Table 1) further verified the higher oxygen vacancy concentration of A-CeO2 (3![[thin space (1/6-em)]](https://www.rsc.org/images/entities/char_2009.gif) :
:![[thin space (1/6-em)]](https://www.rsc.org/images/entities/char_2009.gif) 2
2![[thin space (1/6-em)]](https://www.rsc.org/images/entities/char_2009.gif) :
:![[thin space (1/6-em)]](https://www.rsc.org/images/entities/char_2009.gif) 1). The XPS spectra were used to study the valence state of Ce/oxygen vacancies of CeO2 and etc. As shown in Fig. 6b and S3,† the Ce 3d spectrum of samples showed the appearance of the v, v′′, v′′′, u, u′′ and u′′′, which were attributed to Ce4+. The v0, v1, u0 and u1 peaks were characteristic peaks of Ce3+.23 Moreover, the Ce3+/Ce4+ of CeO2, A-CeO2 (3
1). The XPS spectra were used to study the valence state of Ce/oxygen vacancies of CeO2 and etc. As shown in Fig. 6b and S3,† the Ce 3d spectrum of samples showed the appearance of the v, v′′, v′′′, u, u′′ and u′′′, which were attributed to Ce4+. The v0, v1, u0 and u1 peaks were characteristic peaks of Ce3+.23 Moreover, the Ce3+/Ce4+ of CeO2, A-CeO2 (3![[thin space (1/6-em)]](https://www.rsc.org/images/entities/char_2009.gif) :
:![[thin space (1/6-em)]](https://www.rsc.org/images/entities/char_2009.gif) 0
0![[thin space (1/6-em)]](https://www.rsc.org/images/entities/char_2009.gif) :
:![[thin space (1/6-em)]](https://www.rsc.org/images/entities/char_2009.gif) 1), A-CeO2 (3
1), A-CeO2 (3![[thin space (1/6-em)]](https://www.rsc.org/images/entities/char_2009.gif) :
:![[thin space (1/6-em)]](https://www.rsc.org/images/entities/char_2009.gif) 2
2![[thin space (1/6-em)]](https://www.rsc.org/images/entities/char_2009.gif) :
:![[thin space (1/6-em)]](https://www.rsc.org/images/entities/char_2009.gif) 1) and A-CeO2 (3
1) and A-CeO2 (3![[thin space (1/6-em)]](https://www.rsc.org/images/entities/char_2009.gif) :
:![[thin space (1/6-em)]](https://www.rsc.org/images/entities/char_2009.gif) 2
2![[thin space (1/6-em)]](https://www.rsc.org/images/entities/char_2009.gif) :
:![[thin space (1/6-em)]](https://www.rsc.org/images/entities/char_2009.gif) 2) were 0.837, 0.857, 0.888 and 0.873 respectively. It was known that the higher Ce3+ concentration in nanoparticles was correlated with higher oxygen vacancy, so the obtained A-CeO2 owned more oxygen vacancy than CeO2, and A-CeO2 (3
2) were 0.837, 0.857, 0.888 and 0.873 respectively. It was known that the higher Ce3+ concentration in nanoparticles was correlated with higher oxygen vacancy, so the obtained A-CeO2 owned more oxygen vacancy than CeO2, and A-CeO2 (3![[thin space (1/6-em)]](https://www.rsc.org/images/entities/char_2009.gif) :
:![[thin space (1/6-em)]](https://www.rsc.org/images/entities/char_2009.gif) 2
2![[thin space (1/6-em)]](https://www.rsc.org/images/entities/char_2009.gif) :
:![[thin space (1/6-em)]](https://www.rsc.org/images/entities/char_2009.gif) 1) exhibited the highest oxygen vacancy concentration, that coincided with the results of the Raman spectra.
1) exhibited the highest oxygen vacancy concentration, that coincided with the results of the Raman spectra.
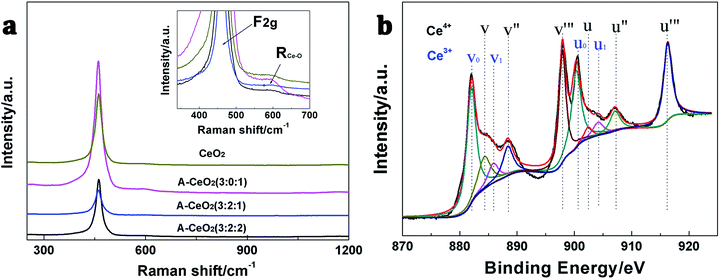 | ||
Fig. 6 Raman spectra (a) of CeO2 and different A-CeO2 with different ratio of reactant and Ce 3d core level XPS pattern (b) of A-CeO2 (3![[thin space (1/6-em)]](https://www.rsc.org/images/entities/char_2009.gif) : :![[thin space (1/6-em)]](https://www.rsc.org/images/entities/char_2009.gif) 2 2![[thin space (1/6-em)]](https://www.rsc.org/images/entities/char_2009.gif) : :![[thin space (1/6-em)]](https://www.rsc.org/images/entities/char_2009.gif) 1). 1). | ||
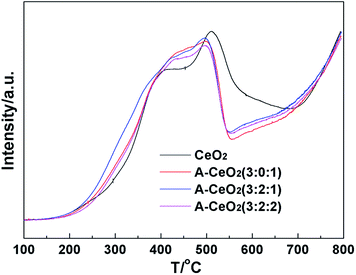
The H2-TPR profiles (Fig. 7) showed that all the samples owned a broad profile centered around 500 °C corresponding to the consumption of surface oxygen species and a high-temperature reduction peak above 800 °C arose from bulk reduction.23 The peak characteristic of surface oxygen species at lower temperature of A-CeO2 indicated that the synthesized nanomaterials possessed relatively stronger surface activity, and A-CeO2 (3![[thin space (1/6-em)]](https://www.rsc.org/images/entities/char_2009.gif) :
:![[thin space (1/6-em)]](https://www.rsc.org/images/entities/char_2009.gif) 2
2![[thin space (1/6-em)]](https://www.rsc.org/images/entities/char_2009.gif) :
:![[thin space (1/6-em)]](https://www.rsc.org/images/entities/char_2009.gif) 1) exhibited the strongest surface activity.
1) exhibited the strongest surface activity.
The formation process of typical A-CeO2 was investigated by FTIR, SEM and XRD. Fig. S4a† showed the FTIR spectra of the reactants and products. It could be inferred that glycine acted as a complexing agent in the reaction. Urea was supposed to be a precipitant due to the phenomenon of more A-CeO2 formation as increasing the dosage of urea (Table S1†). The molar ratio of reactants could influence the dispersion and hydrolysis rate of Ce3+, and then affect the morphology of A-CeO2. The adsorbed Ce3+ hydrolyzed on the surface of glycine, and then the sphere CeCO3OH (Fig. S4b,† orthorhombic structure, JCPDS file no. 41-0013) was formed. In order to further verify the sphere structure, addition of ethanol in the solvent to prevent from the hydrolysis of Ce3+, and then decrease the formation rate of A-CeO2,3 the obtained sample was sphere nanoparticle (Fig. S5†). Moreover, the shape of A-CeO2 changed from sphere, bowknot to bulk over time (Fig. S6†). Above all, we supposed the schematic diagram as shown in Fig. 8.
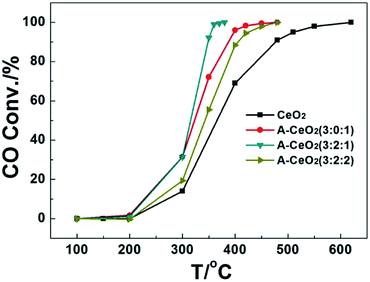
The catalytic effect for CO oxidation of typical A-CeO2 with different morphologies was investigated. Fig. 9 showed that the catalytic performance was highly dependent on the shape of A-CeO2, and the complete CO conversion temperature of A-CeO2 (3![[thin space (1/6-em)]](https://www.rsc.org/images/entities/char_2009.gif) :
:![[thin space (1/6-em)]](https://www.rsc.org/images/entities/char_2009.gif) 2
2![[thin space (1/6-em)]](https://www.rsc.org/images/entities/char_2009.gif) :
:![[thin space (1/6-em)]](https://www.rsc.org/images/entities/char_2009.gif) 1) was 370 °C, which was much lower than others especially the CeO2 (620 °C) in bulk (Fig. S7†). The catalytic performance was also better than the reported commercial CeO2 powers, CeO2 nanowires and 3D ordered macroporous CeO2.5,6,24 The A-CeO2 (3
1) was 370 °C, which was much lower than others especially the CeO2 (620 °C) in bulk (Fig. S7†). The catalytic performance was also better than the reported commercial CeO2 powers, CeO2 nanowires and 3D ordered macroporous CeO2.5,6,24 The A-CeO2 (3![[thin space (1/6-em)]](https://www.rsc.org/images/entities/char_2009.gif) :
:![[thin space (1/6-em)]](https://www.rsc.org/images/entities/char_2009.gif) 2
2![[thin space (1/6-em)]](https://www.rsc.org/images/entities/char_2009.gif) :
:![[thin space (1/6-em)]](https://www.rsc.org/images/entities/char_2009.gif) 1) with bowknot shape showed the best catalytic effect might be due to its outstanding features: higher oxygen vacancy (Table 1) for improving oxygen mobility,24 more loosely packed porous structure (Fig. 4d) and larger specific surface area (Table 1), which could intensify mass transfer.7
1) with bowknot shape showed the best catalytic effect might be due to its outstanding features: higher oxygen vacancy (Table 1) for improving oxygen mobility,24 more loosely packed porous structure (Fig. 4d) and larger specific surface area (Table 1), which could intensify mass transfer.7
Conclusions
In summary, a series of A-CeO2 with different morphologies, namely spindle, bowknot, dumbbell and prism, have been successfully fabricated via a milder precipitation route assisted by glycine. The catalytic performance for CO oxidation of the as-synthesized A-CeO2 is strongly dependent on the shape of A-CeO2. Owing to the outstanding properties, A-CeO2 (3![[thin space (1/6-em)]](https://www.rsc.org/images/entities/char_2009.gif) :
:![[thin space (1/6-em)]](https://www.rsc.org/images/entities/char_2009.gif) 2
2![[thin space (1/6-em)]](https://www.rsc.org/images/entities/char_2009.gif) :
:![[thin space (1/6-em)]](https://www.rsc.org/images/entities/char_2009.gif) 1) with bowknot shape possesses the excellent catalytic activity with the complete CO conversion temperature of 370 °C. The facile and eco-friendly synthesis method of A-CeO2 may provide reference for the preparation of other 3D porous metal oxides. The prepared CeO2 with different microstructures is promising for the future practical application in catalysis.
1) with bowknot shape possesses the excellent catalytic activity with the complete CO conversion temperature of 370 °C. The facile and eco-friendly synthesis method of A-CeO2 may provide reference for the preparation of other 3D porous metal oxides. The prepared CeO2 with different microstructures is promising for the future practical application in catalysis.
Conflicts of interest
There are no conflicts to declare.Acknowledgements
Authors are thankful for the financial support of National Natural Science Foundation of China (21536010 and 41773105) and Natural Science Foundation of Fujian Province (2017J01025)Notes and references
- T. Montini, M. Melchionna, M. Monai and P. Fornasiero, Chem. Rev., 2016, 116, 5987–6041 CrossRef PubMed.
- C. Sun, H. Li and L. Chen, Energy Environ. Sci., 2012, 5, 8475 Search PubMed.
- H. Liu and H. Liu, J. Alloys Compd., 2016, 681, 342–349 CrossRef.
- S.-J. Shih, W.-L. Tzeng and W.-L. Kuo, Surf. Coat. Technol., 2014, 259, 302–309 CrossRef.
- X. Lu, X. Li, J. Qian and Z. Chen, Powder Technol., 2013, 239, 415–421 CrossRef.
- G. Mu, C. Liu, Q. Wei and Y. Huang, Mater. Lett., 2016, 181, 161–164 CrossRef.
- W. Kang and A. Varma, Appl. Catal., B, 2018, 220, 409–416 CrossRef.
- C. Cheng, F. Chen, H. Yi and G. Lai, J. Alloys Compd., 2017, 694, 276–281 CrossRef.
- B. Zong, J. Mater. Sci.: Mater. Electron., 2016, 28, 2458–2461 CrossRef.
- X. Niu, M. Li, B. Hao and H. Li, J. Mater. Sci.: Mater. Electron., 2016, 27, 6845–6848 CrossRef.
- X. Y. Yang, L. H. Chen, Y. Li, J. C. Rooke, C. Sanchez and B. L. Su, Chem. Soc. Rev., 2017, 46, 481–558 RSC.
- D. Liu, J. Gu, Q. Liu, Y. Tan, Z. Li, W. Zhang, Y. Su, W. Li, A. Cui, C. Gu and D. Zhang, Adv. Mater., 2014, 26, 1229–1234 CrossRef PubMed.
- Z. He, W. Zhang, W. Wang, M. Tassin, J. Gu, Q. Liu, S. Zhu, H. Su, C. Feng and D. Zhang, J. Mater. Chem. B, 2013, 1, 1673 RSC.
- J. Xi, E. Zhou, Y. Liu, W. Gao, J. Ying, Z. Chen and C. Gao, Carbon, 2017, 124, 492–498 CrossRef.
- H. Zhou, X. Li, T. Fan, F. E. Osterloh, J. Ding, E. M. Sabio, D. Zhang and Q. Guo, Adv. Mater., 2010, 22, 951–956 CrossRef PubMed.
- D. Shen, Y. Dai, J. Han, L. Gan, J. Liu and M. Long, Chem. Eng. J., 2018, 332, 563–571 CrossRef.
- K. Tian, X.-X. Wang, H.-Y. Li, R. Nadimicherla and X. Guo, Sens. Actuators, B, 2016, 227, 554–560 CrossRef.
- J. Qian, Z. Chen, C. Liu, X. Lu, F. Wang and M. Wang, Mater. Sci. Semicond. Process., 2014, 25, 27–33 CrossRef.
- A. F. Alkaim, E. M. Alrobayi, A. M. Algubili and A. M. Aljeboree, Environ. Technol., 2017, 38, 2119–2129 CrossRef PubMed.
- Y. Guo, S. Lin, X. Li and Y. Liu, Appl. Surf. Sci., 2016, 384, 83–91 CrossRef.
- S. L. Mitchell and J. Guzman, Mater. Chem. Phys., 2009, 114, 462–466 CrossRef.
- B. Xu, Q. T. Zhang, S. S. Yuan, M. Zhang and T. Ohno, Chem. Eng. J., 2015, 260, 126–132 CrossRef.
- T. S. Sreeremya, A. Krishnan, K. C. Remani, K. R. Patil, D. F. Brougham and S. Ghosh, ACS Appl. Mater. Interfaces, 2015, 7, 8545–8555 Search PubMed.
- X. Zhou, J. Ling, W. Sun and Z. Shen, J. Mater. Chem. A, 2017, 5, 9717–9722 Search PubMed.
Footnote |
| † Electronic supplementary information (ESI) available. See DOI: 10.1039/c8ra03555e |
| This journal is © The Royal Society of Chemistry 2018 |


