
 Open Access Article
 This Open Access Article is licensed under a Creative Commons Attribution-Non Commercial 3.0 Unported Licence
Framework of ruthenium-containing nickel hydrotalcite-type material: preparation, characterisation, and its catalytic application†
Sreenavya A.a,
Baskaran T.a,
Ganesh V.b,
Sharma D.c,
Nagendra Kulald and
Sakthivel A. *a
*a
aDepartment of Chemistry, School of Physical Sciences, Central University of Kerala, Kasaragod 671316, Kerala, India. E-mail: sakthiveldu@gmail.com
bElectrodics and Electro Catalysis Division, CSIR-Central Electrochemical Research Institute (CSIR-CECRI), Karaikudi 630003, India
cDepartment of Chemistry, University of Delhi, Delhi 110007, India
dMaterials Science Department, Poornaprajna Institute of Scientific Research, Bidalur Post, Devanahalli, Bengaluru-562164, India
First published on 16th July 2018
Abstract
The framework ruthenium-containing nickel (NiRu) hydrotalcite (HT)-type materials were prepared by a co-precipitation method for the first time in this study. Fourier-transform infrared spectroscopy and X-ray diffraction analysis revealed the formation of a layered hydrotalcite-type phase. DRUV-Vis and X-ray photoelectron spectroscopic studies revealed the presence of nickel in the +2 and +3 oxidation states along with the presence of ruthenium as Ru3+ ions. Temperature-programmed desorption studies of the NiRu-HT-type materials indicated a two-stage reduction with a decrease in Tmax, supporting the presence of Ni2+ and Ru3+ in the framework of hydrotalcite. The obtained NiRu-HT-type materials proved to be promising catalysts for the reduction of aromatic nitro compounds in the presence of hydrazine as a hydrogen source under ambient conditions. The NiRu-HT-type material demonstrated enhanced activity and selectivity during the reduction of nitrobenzene and its derivatives due to the synergistic effect of nickel and ruthenium ions.
Introduction
Anionic clays or hydrotalcite (HT)-like layered mixed hydroxides are natural or synthetic materials that are extensively used as adsorbents, ion-exchangers, ceramic precursors, flame retardants, stabilisers, corrosion inhibitors, and electrode materials and are employed in catalysis and pharmaceutical applications.1,2 These crystalline materials consist of positively charged two-dimensional sheets with water and exchangeable charge-balancing anions in the interlayer region. The general formula of the materials is [M2+1−xM3+x(OH)2]x+(Ax/nn)·mH2O, where M2+ and M3+ respectively represent divalent and trivalent cations, A is the interlayer anion with charge n, and x is the fraction of trivalent cations.3 The structure of HT-like compounds is similar to that of layered brucite, where Mg2+/Al3+ ions are located on octahedral (Oh) co-ordination sites and share edges to form infinite sheets. The infinite sheets are stacked on each other to form a positively charged framework, and the electrical neutrality is maintained by anions located in the interlayer domains containing water molecules.4,5 HT materials have also proved to be promising catalysts in a wide range of organic reactions, such as reduction, oxidation, alkylation, condensation, hydroxylation, transesterification, isomerisation, epoxidation, hydro-isomerisation, and reforming.3–5 These materials have advantages such as improved activity, selectivity, less waste production, and easy recovery of products. These materials can be used either in the as-synthesised form or in the form of mixed metal oxides derived after calcination.1–4,6–14 These types of layered HT materials possess inherent basicity and have redox properties, which are derived from the elemental composition of the octahedral layers of the materials. Catalytic properties of HTs can be modified by introducing varying divalent and trivalent cations such as Zn2+, Ni2+, Mn2+, Co2+, Fe2+, Cr3+, Fe3+, Mn3+, Co3+, and Ga3+ into the framework. Moreover, the properties can be modified by introducing anions like halides, carbonates, nitrates, sulphates, silicates, organic anions, anionic complexes, or anionic polymers in the interlayer region.15–22In recent decades, the transition-metal-based HT-like system has gained increasing interest among researchers because of its enormous applications in the field of reforming, fine chemicals, and redox processes.3–5 A nickel-based material is one among the most widely used transition metal and has a strong ability to form a bimetallic system with other trivalent metal ions. Nickel-based HT was developed because it is easily available, low-cost alternative to noble metal catalysts, has electronic properties similar to noble metals, and has an excellent activity for various elementary organic transformations and reforming processes.3–15 There are several studies on nickel-based HT-like catalyst for use in both fine, petro chemical and electrochemical processes such as catalytic reforming, dehydrogenation, hydrogenation, and electrocatalysis.23
In recent years, attention has been focussed on the preparation and applications of monometallic HT-like compounds in which a single element (transition metal ions) was used in both divalent and trivalent framework sites. The early work devoted to these types of materials was reported by Taylor in 1980. Taylor studied the formation and properties of Fe2+/Fe3+ hydroxyl carbonates. Moreover, several studies were focused on the preparation of various monometallic, such as iron-, cobalt-, and nickel-based HT type compounds. These materials proved to be promising as catalysts, super-capacitors, electro-catalysts, biosensors, electro-chromic electrodes and optical devices, water treatment agents etc.24–32
Monometallic nickel-based HT materials have potential applications in rechargeable batteries, photonic catalysis, and non-enzymatic glucose sensors. However, there are limited studies that discuss the catalytic applications of monometallic nickel-based HT materials. Moreover, these materials are often prepared in the presence of excess of organic anions and hexamethylenetetramine, which is a hydrolysing agent. Nickel was found to be active in a number of processes such as hydrogenation and reforming reactions. However, single component Ni catalysts cannot meet the activity, selectivity, and stability requirements in many processes at the industrial level. Nickel has a high alloying efficiency with noble metals and many transition metals. Therefore, nickel can be easily utilised to develop a catalyst with a diversified catalytic application. Currently, there are many studies on the facile fabrication of bimetallic nickel systems that present potential alternatives for noble metal catalysts, which are expensive, in terms of the catalytic activity and stability.23,33–42
Thus, it will be interesting to introduce a small amount of trivalent ruthenium ions, which possess excellent activity in various organic transformations such as hydrogenation, C–C coupling, and metathesis, to the monometallic nickel HT-type materials. In this work, we intend to prepare HT-type α-Ni(OH)2 containing ruthenium ions by using a simple co-precipitation method and used as a potential catalyst for the hydrogenation of nitro compounds to corresponding anilines. The hydrogenation of nitro-compound is one of the important industrial processes to produce aniline, which is used for the synthesis of polyurethane, dyes, pharmaceutical products and agricultural products.
Experimental section
Ruthenium-containing nickel (NiRu) HT-type material was synthesised by the co-precipitation method without using any organic base. Solution 1 was prepared by dissolving nickel nitrate (Ni(NO3)2·6H2O; 5 mmol) and ruthenium chloride (RuCl3·3H2O; 1 mmol). Solution 2 was prepared by dissolving ammonium carbonate ((NH4)2CO3; 6 mmol) and ammonium hydroxide (NH4OH; 30 mmol) in 40 ml deionised water. Solution 2 was added in a drop-wise manner into solution 1 with constant stirring at 65 °C for 2 h. The precipitation was observed in HT with a final gel pH of 8.5, and the resulting solution was maintained for ageing for 18 h. The precipitation of NiRu-HT gel was filtered and washed with deionised water. The material was dried overnight and represented as NiRu-HT catalysts. The samples were prepared by introducing varying molar ratios of Ni–Ru, that is, 1![[thin space (1/6-em)]](https://www.rsc.org/images/entities/char_2009.gif) :0.1, 1:0.2, 1:0.3, 1:0.45, and 1:0.6, and were represented as NiRu-0.1, NiRu-0.2, NiRu-0.3, NiRu-0.45, and NiRu-0.6, respectively.
:0.1, 1:0.2, 1:0.3, 1:0.45, and 1:0.6, and were represented as NiRu-0.1, NiRu-0.2, NiRu-0.3, NiRu-0.45, and NiRu-0.6, respectively.
Characterization
Powder X-ray diffraction (Powder XRD) was performed to determine the bulk crystalline phases of the materials by using an 18 kW X-ray diffractometer (Rigaku, Japan) with Cu-Kα radiation (λ = 1.54184 A). The diffraction patterns were recorded in the 2θ range of 2–80 with a scan speed of 0.5 min−1 and step size of 0.02. Fourier-transform infrared (FT-IR) spectra were obtained using the PerkinElmer Spectrum 2000 FTIR in the 400–4000 cm−1 range by using KBr pellets. Thermal decomposition of the samples was analysed using a thermal analyser (simultaneous thermal analyser 600, PerkinElmer). The morphology and size of the materials were analysed using SEM (Phillips Technai G2 T30 SEM) operated at 300 kV. Diffused reflectance UV-visible spectra were recorded at 200–800 nm by using a UV-visible spectrometer (PerkinElmer) with the help of BaSO4 as the reference. X-ray photoelectron spectra (XPS) of the catalysts were recorded by using a custom-built ambient pressure photoelectron spectrometer (Prevac, Poland) that was equipped with a VG Scienta's R3000HP analyser and a MX650 monochromator.27 A monochromatic Al-Kα X-ray was generated at 450 W and used for measuring the XPS data of the above samples. Base pressure in the analysis chamber was maintained in the range of 2 × 10⁻¹⁰ torr. The energy resolution of the spectrometer was set at 0.7 eV at a pass energy of 50 eV. The binding energy (BE) was calibrated with respect to the Au 4F7/2 core level at 84.0 eV. The error in the reported BE values is within 0.1 eV. Elemental composition present in the final materials was determined using ICP-AES. The reducibility of the materials was determined by the temperature-programmed reduction (TPR) studies using BELCAT-M (JAPAN). The textural properties (BET surface area, BJH average pore volume) of the samples were derived from N2 sorption measurements carried out at −196 °C out using physisorption analyser (BEL SORP II, Japan) after the samples were degassed at 150 °C for at least 8 h under 10−3 torr pressure prior to each run.Catalytic study
The catalytic activities of the synthesised NiRu-HT- and monometallic Ni-HT-type materials were studied for the reduction of various aromatic nitro compounds by using isopropanol as the solvent and hydrazine hydrate as the reducing agent under optimum conditions. In a typical reaction, 0.1 g of catalyst was introduced into the reaction mixture with 10 mmol of nitro compound, 20 mmol hydrazine, and 20 ml isopropanol. The reaction was studied at different reaction temperature and duration. The products of the reaction were analysed using gas chromatography (Clarus-680, Perkin Elmer) with the flame ionisation detector using an Elite-5 column.Result and discussion
FT-IR spectra of Ni(OH)2 prepared with different reaction conditions are shown in Fig. 1, which is characteristics of α-Ni(OH)2 and β-Ni(OH)2. The sharp vibrational band observed around 3200 to 3700 cm−1 (Fig. 1) is a characteristic of β-Ni(OH)2, which is prepared using NaOH and Na2CO3, and is similar to vibrational bands observed for the brucite structure. The sample prepared using NH4OH and (NH4)2CO3 displayed a broad vibrational band between 4000 and 3000 cm−1. This band occurs due to the stretching mode of hydrogen-bonded hydroxyl groups that are present in the brucite-like layers having interlayer water molecules. The bending vibration of the interlayer water is reflected in the broad band and appears at 1612 cm−1.43 FT-IR spectra of samples prepared with varying ruthenium concentrations are displayed in Fig. 2. The spectral data of the samples resemble the α-Ni(OH)2 type, which support the formation of hydrotalcite type (NiRu-HT) layered material structure. A strong absorption peak that appeared at 1380 cm−1 corresponds to the asymmetric stretch mode of CO32− ions. The band at 1380 cm−1, with a weak shoulder at 1470 cm−1, occurred due to the splitting of the band because of the three vibrational modes of carbonate. The characteristic bands for the M–O bond appear in the vibrational spectral region below 1000 cm−1. An additional sharp band that occurs in the 840 cm−1 region is due to the various lattice vibrations associated with metal hydroxide sheets. The absorption peaks at 413 and 693 cm−1 can be assigned to the M–O and M–O–M vibrations in the layered structure.35,44,45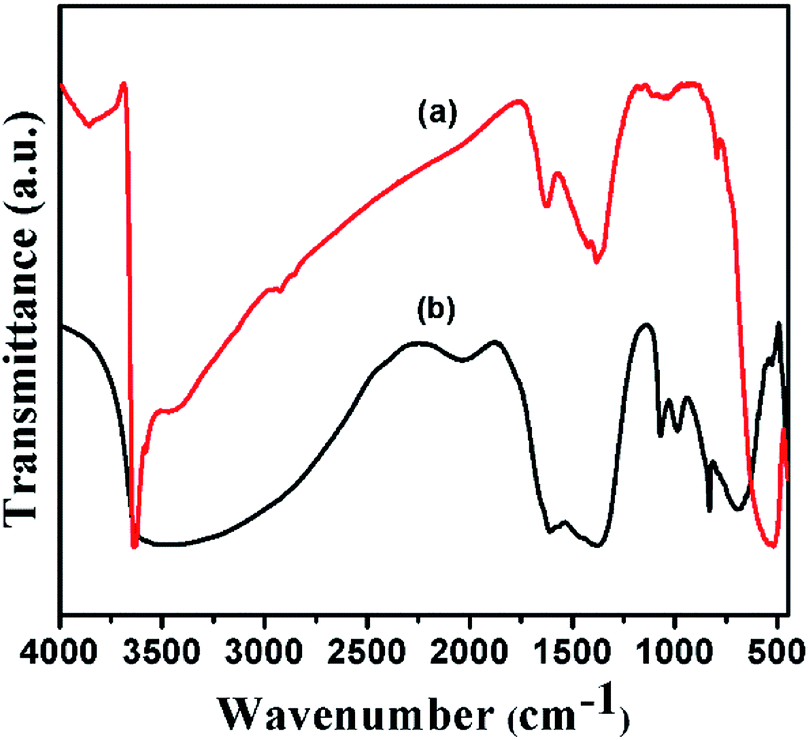 | ||
| Fig. 1 FT-IR spectra of (a) β-Ni(OH)2 and (b) α-Ni(OH)2. | ||
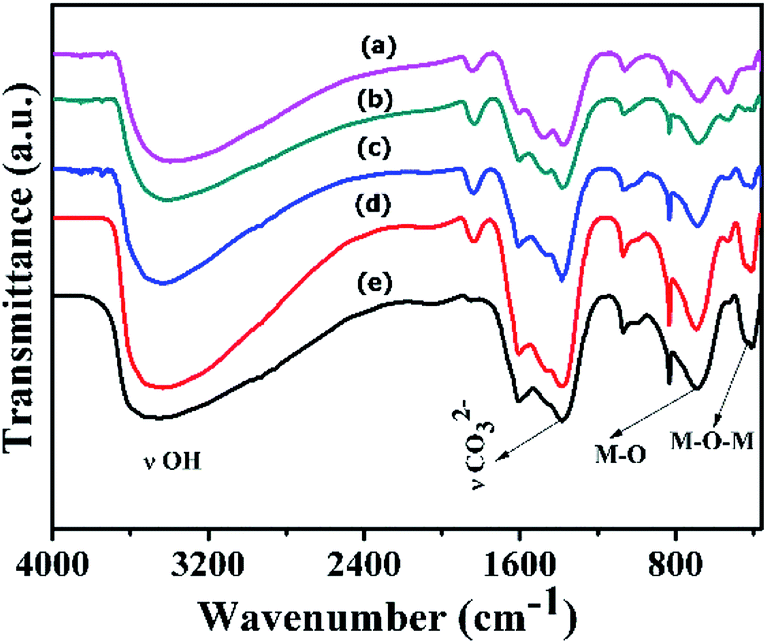 | ||
| Fig. 2 FT-IR spectra of various NiRu-HT materials (a) NiRu-0.025 (b) NiRu-0.2 (c) NiRu-0.3 (d) NiRu-0.45 and (e) NiRu-0.6. | ||
Powder XRD patterns of Ni(OH)2 prepared using sodium and ammonium-based sources are shown in Fig. 3. The samples prepared using the sodium-based source showed sharp and symmetrical reflections of (001), (100), (101), and (102) planes around 2θ values of 19, 33, 38, and 51° respectively; these reflections typically belong to β-Ni(OH)2.44 By contrast, the sample prepared using the ammonium-based source showed broad peaks at 2θ ranges 9.3, 17.5, 35, and 60° that correspond to (003), (006), (012), and (110) planes of the HT-type layered α-Ni(OH)2, respectively. The broadening of X-ray reflection evidently supports the orientation of carbonate anion in the interlayer spaces of the brucite-type layered structure. Powder XRD patterns of NiRu-HT-type samples prepared with varying ruthenium ion concentrations are displayed in Fig. 4. The incorporation of Ru3+ ions in the framework of brucite-type layered α-Ni(OH)2 facilitates the formation of layered HT-type structures, which is clearly evident from the powder X-ray patterns. All samples yielded X-ray diffraction (XRD) patterns with reflections at 2θ values of 4, 6.23, 18.23, 34.23, and 60.9° that correspond to the (001), (003), (006), (012), and (110) planes of HT-type materials, respectively.37,38 Moreover, X-ray reflections corresponding to metallic ruthenium or any other oxide phases are not observed, which supports the formation of pure layered NiRu-HT-type materials.
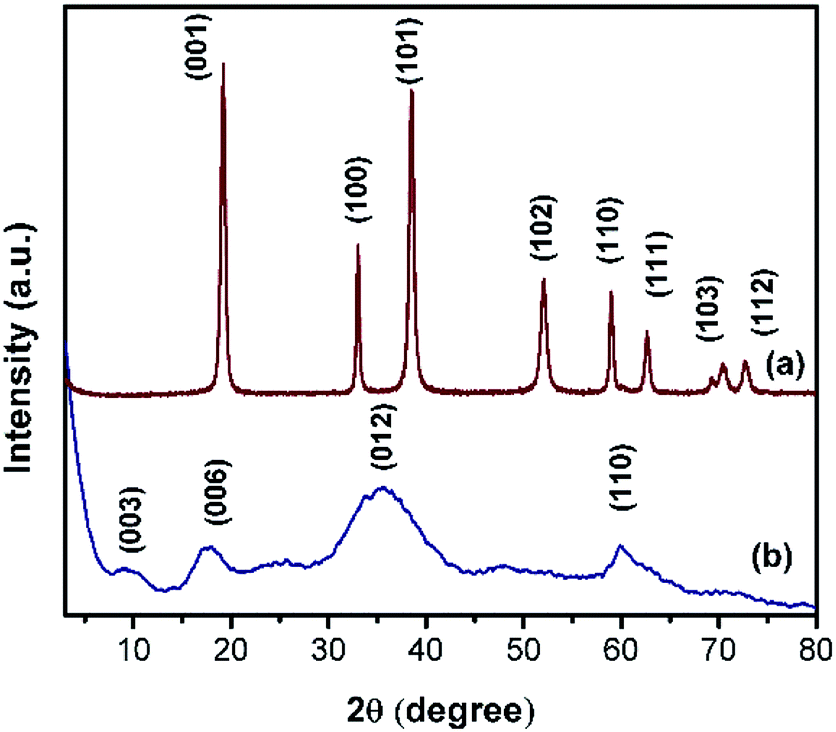 | ||
| Fig. 3 Powder XRD patterns of (a) β-Ni(OH)2 and (b) α-Ni(OH)2. | ||
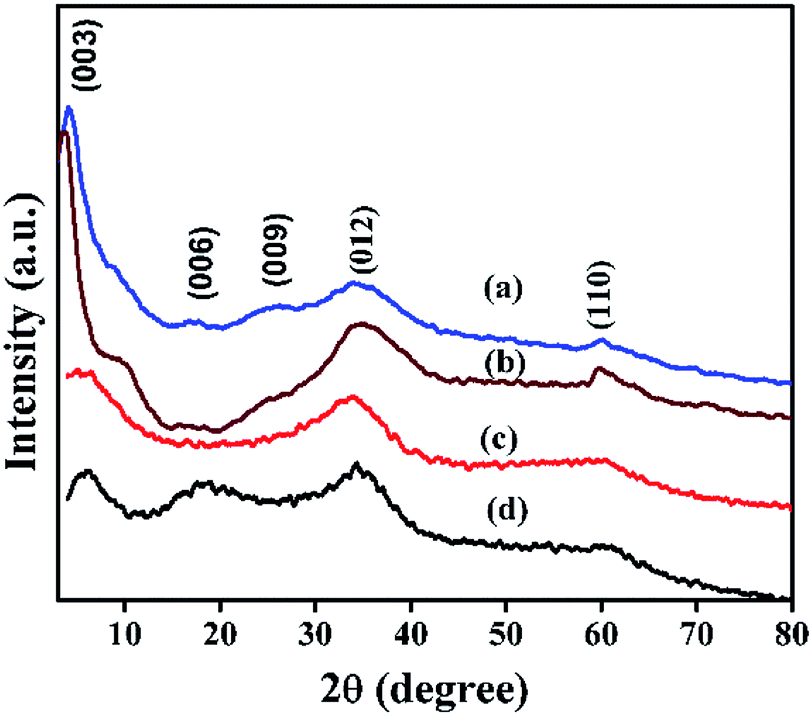 | ||
| Fig. 4 XRD patterns of NiRu-HT samples viz., (a) NiRu-0.2 (b) NiRu-0.3 (c) NiRu-0.45 and (d) NiRu-0.6. | ||
TGA profile of α-Ni(OH)2, β-Ni(OH)2, NiRu-HT are shown in Fig. 5. β-Ni(OH)2 displays a negligible weight loss of 0.355% due to the absence of any inter-layer physisorbed molecules (water, carbonate etc.), which is in line with XRD analysis. The TGA profile of NiRu-HT-type materials exhibits a three-stage thermal decomposition. The first-stage weight loss of 15% occurs at a low temperature of approximately 120 °C is due to the elimination of physisorbed water molecules present in the inter-layer space. The second-stage weight loss is observed between 120 and 300 °C (20 wt%); this loss occurs due to the removal of chemisorbed water and carbonate anions from the internal and external surface of the HT-type structure. The last-stage weight loss (15 wt%) occurs between 300 and 700 °C and is attributed to the removal of hydroxyl groups from the brucite layers and interlayer carbonate anions in the form of CO2.37
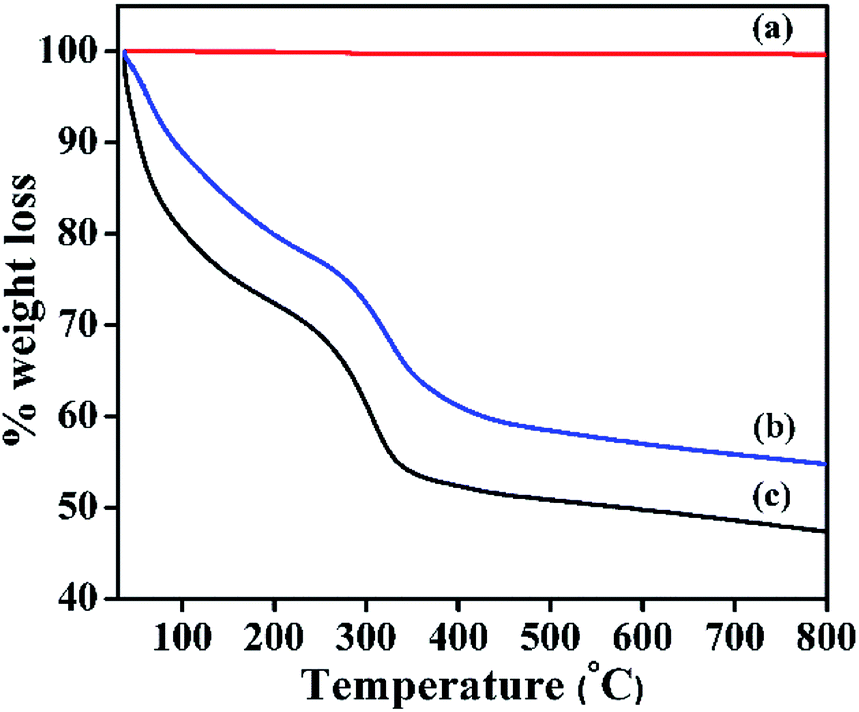 | ||
| Fig. 5 TGA profile of (a) β-Ni(OH)2, (b) NiRu-0.2, and (c) α-Ni(OH)2. | ||
The co-ordination and oxidation status of the nickel species present in the structure were analysed using DR UV-Vis spectra, and the results are displayed in Fig. 6. This figure reveals that α- and β-Ni(OH)2 samples show three absorption maxima in the wavelength region of 682, 390, and 238 nm that correspond to the following three spin-allowed, Laporte-forbidden transitions (3A2g(F) → 3T2g(F), 3A2g(F) → 3T1g(F), and 3A2g(F) → 3T1g(P)) of octahedral Ni2+ species.22 The introduction of a trace amount of ruthenium ions (NiRu-0.025-HT) in the framework of α-Ni(OH)2 HT-type materials retains the absorption band correspond to d–d transition of nickel ions. With an increase in the ruthenium ion concentration, the absorption band corresponding to higher energy transitions, that is, 3A2g(F) → 3T1g (F) and 3A2g(F) → 3T1g(P), are not resolved and display a broad absorption band in the 200–500 nm region. This could be due to the overlap of intense bands that involve the delocalised Ru–O molecular orbital for the n–π* bands (465 nm) derived from the framework of ruthenium ions and water coordinated octahedral Ru3+ ions.46 The absorption band corresponding to 3A2g(F) → 3T2g(F) transitions disappears as the Ru concentration increases. The peak position of NiRu-HT-type samples indicates a blue shift when ruthenium ions are added to the materials, thus the alloying of Ni–Ru occurs.22,46,47
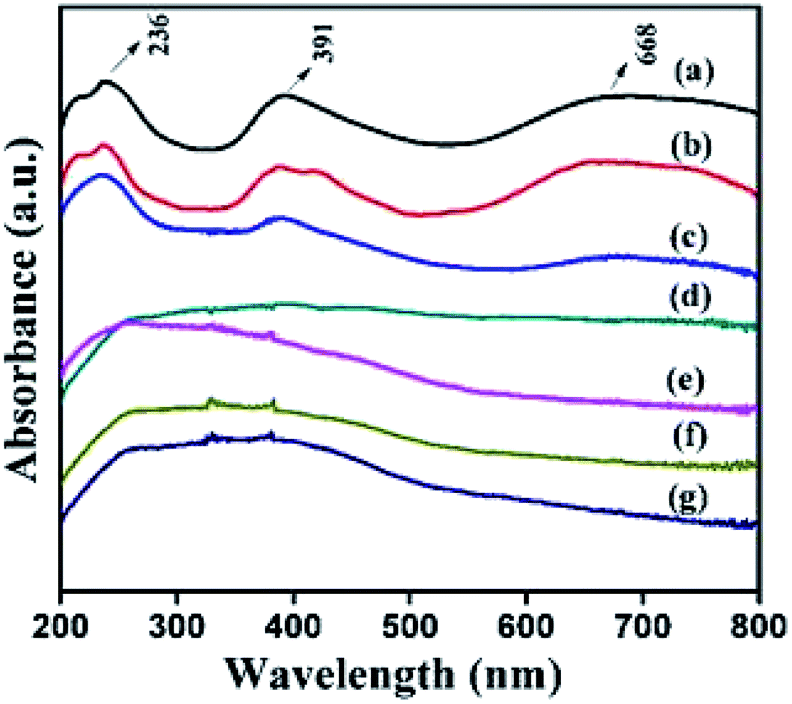 | ||
| Fig. 6 DR UV-Vis spectra of (a) α-Ni(OH)2, (b) β-Ni(OH)2, (c) NiRu-0.025 (d) NiRu-0.2 (e) NiRu-0.3(f) NiRu-0.45 and (g) NiRu-0.6. | ||
Table 1 summarises the elemental composition of NiRu-HT-type materials obtained from ICP-AES studies. The table reveals that the increase in ruthenium ions concentration in the final molar composition with an increase in the molar composition of synthesis gel was evident. The above fact supports that the introduced ruthenium ions are incorporated in the frame work of HT.
| Sample details | mol% | Ni + Ru mol% | Ru/(Ni + Ru) mol% | |
|---|---|---|---|---|
| Ni | Ru | |||
| NiRu-0.2 | 1.399 | 0.057 | 1.456 | 0.039 |
| NiRu-0.3 | 1.343 | 0.085 | 1.428 | 0.059 |
| NiRu-0.45 | 1.220 | 0.129 | 1.349 | 0.095 |
| NiRu-0.6 | 1.080 | 0.159 | 1.231 | 0.128 |
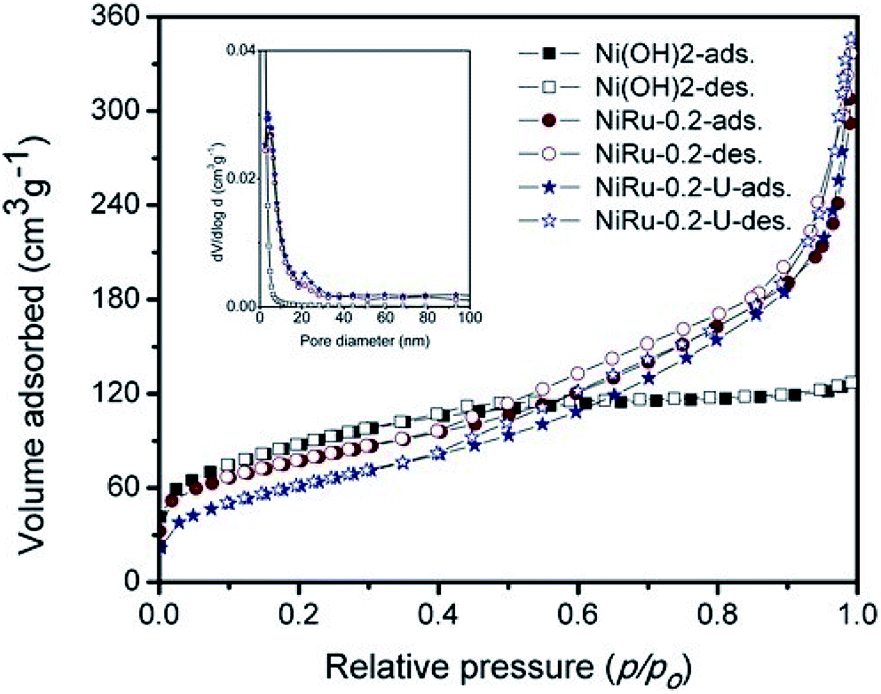
Fig. 7 shows the nitrogen sorption isotherms of α-Ni(OH)2, NiRu-0.2 and NiRu-0.2-used (NiRu-0.2U) samples at 77 K. The BET surface area of NiRu-0.2 is 278 m2 g−1 which is comparable that of pure α-Ni(OH)2 (318 m2 g−1).
 | ||
| Fig. 7 Nitrogen sorption isotherm of α-Ni(OH)2 and NiRuHT-0.2 before and after use. | ||
The isotherm of pure α-Ni(OH)2, doesn't shown any significant uptake in mesoporous range, indicates the interparticle space is not available, which is further supported by BJH pore volume of 0.111 cm3 g−1. The isotherm curve of NiRu-0.2 exhibited multilayer adsorption (Fig. 7) in the relative pressure (p/po) range of 0.3–0.9 are characteristics of type IV isotherms (Fig. 7) as per IUPAC classification.8,9 The increase in pore volume of NiRu-0.2 sample (Table 2) along with observed type IV isotherm with H4 hysteresis indicating the presence of narrow slit-like interparticle mesoporous nature, which is evident from pore size distribution (Fig. 7 inset). The used catalyst (NiRu-0.2-U) showed similar isotherm characters, and surface area, pore volume and pore diameter (Table 2) clearly support that the samples remain intact even after several catalytic studies.
| Sl no. | Sample details | BET (m2 g−1) | BJH pore volume (cm3 g−1) | Mean pore diameter (nm) |
|---|---|---|---|---|
| 1 | α-Ni(OH)2 | 318 | 0.111 | 2.43 |
| 2 | NiRuHT-0.2 | 278 | 0.453 | 4.25 |
| 3 | NiRuHT-0.2-used | 228 | 0.511 | 3.75 |
The SEM image of NiRu-0.2 HT is shown in Fig. 8. The catalyst surface consists of particles with irregular shapes and was formed due to the aggregation of individual particles. The sample displays individual particles in nano-size, which is in accordance with the reflection characteristics displayed in the XRD pattern.
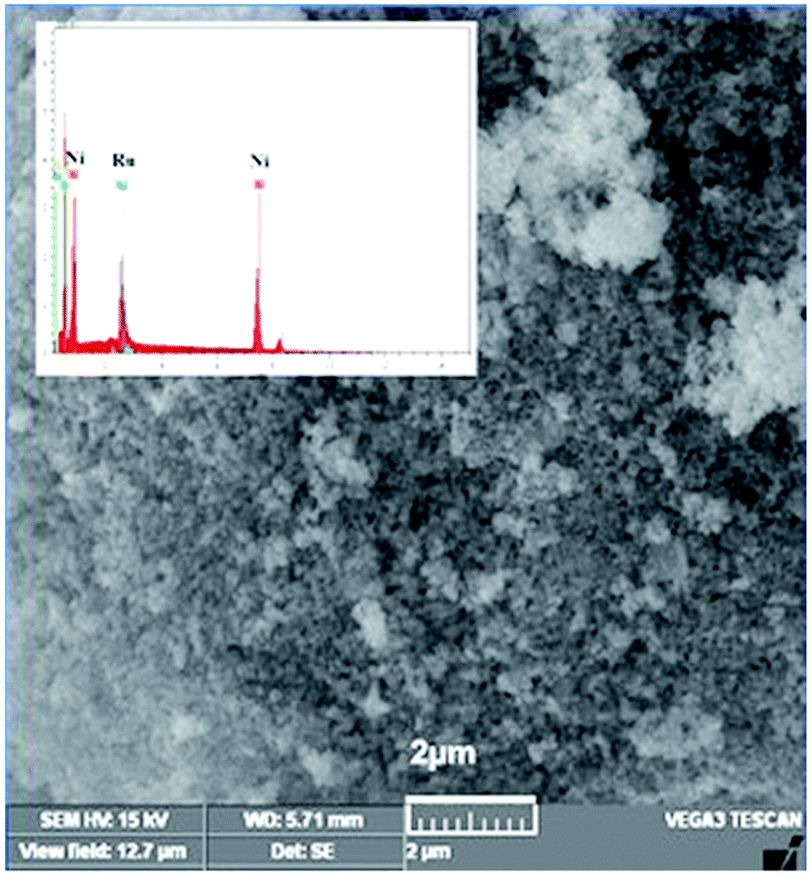 | ||
| Fig. 8 SEM image of NiRu-0.2 HT. | ||
Surface composition and oxidation states associated with the synthesised materials were characterised by X-ray photoelectron spectroscopy and the results are summarised in Table 3. The wide scan of XPS spectra is available in ESI† (Fig. S1†). These studies are carried out to understand the nature of the active species present on the surface of NiRu-HT-type materials (Ni-HT, NiRu-0.2, and NiRu-0.6). Ni 2p core level spectra of these samples are shown in Fig. 9. The α-Ni(OH)2 spectrum consists of a main peak of Ni 2p3/2 at the binding energy value of 855.5 eV and a broad satellite at 860.9 eV. The Ni 2p1/2 peak is located at the binding energy value of 873.3 eV with a satellite peak at 879.6. The main peak with broad satellite structure located within this binding energy range is considered as the contribution of divalent nickel species present in Ni(OH)2 structure.48,49
| Catalysts | Ni 2p3/2 (eV) | Ni 2p1/2 (eV) | Spin orbital splitting (eV) | Difference between main & satellite peak (eV) | O 1s (eV) | Ru (eV) | Ru 3d (eV) | ||||
|---|---|---|---|---|---|---|---|---|---|---|---|
| Main | Satellite | Main | Satellite | 2p3/2 | 2p1/2 | 3p3/2 | 3p1/2 | ||||
| α-Ni(OH)2 | 855.50 | 860.90 | 873.30 | 879.6 | 17.80 | 5.90 | 6.90 | 530.6 | — | — | — |
| NiRu-0.2 | 855.15 | 860.48 | 872.80 | 879.3 | 17.65 | 5.33 | 6.50 | 530.6 | 462.9 | 485.04 | 284.8 |
| NiRu-0.6 | 856.20 | 861.80 | 873.8 | 880.17 | 17.47 | 5.60 | 6.23 | 531.7 | 464.5 | 485.58 | 284.8 |
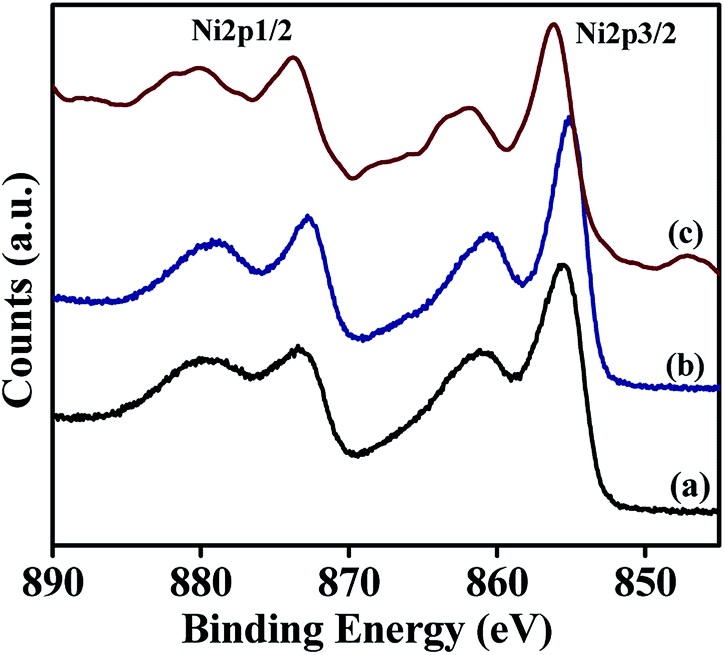 | ||
| Fig. 9 XPS of Ni 2p in various HT materials: (a) α-Ni(OH)2 (b) Ni–Ru-0.2, and (c) Ni–Ru-0.6. | ||
The introduction of small amount of Ru in the frame work of α-Ni(OH)2, for example NiRu-0.2 sample doesn't show much difference in the binding energy values, which supports the presence of Ni in identical environment in case of NiRu-0.2 as in α-Ni(OH)2. In the case of NiRu-0.2, the Ni 2p3/2 peak is located at the binding energy of 855.15 eV with a satellite peak at 860.48 eV. The Ni 2p1/2 main peak is observed at the binding energy of 872.8 eV with a satellite peak at 879.3 eV. These values are characteristics of nickel in +2 oxidation state with similar environment as of α-Ni(OH)2. The introduction of large excess of Ru in the framework of α-Ni(OH)2, viz., NiRu-0.6 sample shows a shift in the peak towards higher binding energy values. The binding energy observed for NiRu-0.6 such as 856.2 eV with a satellite at 861.8 eV for Ni 2p3/2 peak and at 873.8 eV with a satellite at 880.17 eV for Ni 2p1/2 peak. The shift in binding energy may be due to the contribution of trivalent nickel species that also exists in the layered structure.50 The increased concentration of ruthenium induces the nickel species to exist in higher oxidation state, i.e. +3.
The XPS spectrum corresponding to Ru 3p of NiRu-0.2 showed (Fig. 10A) well distinguished two peak with the binding energies of Ru 3p3/2 and Ru 3p1/2 core level at 462.9 eV and 485.04 eV respectively, which are characteristics of ruthenium species in the trivalent (Ru3+) oxidation state.51,52 On the other hand NiRu-0.6 exhibited peaks at the binding energy of 464.5 eV and 485.58 eV corresponding to Ru 3p3/2 and Ru 3p1/2 respectively, indicating the existence of ruthenium in the hydrated hydroxy form in the trivalent oxidation state.53
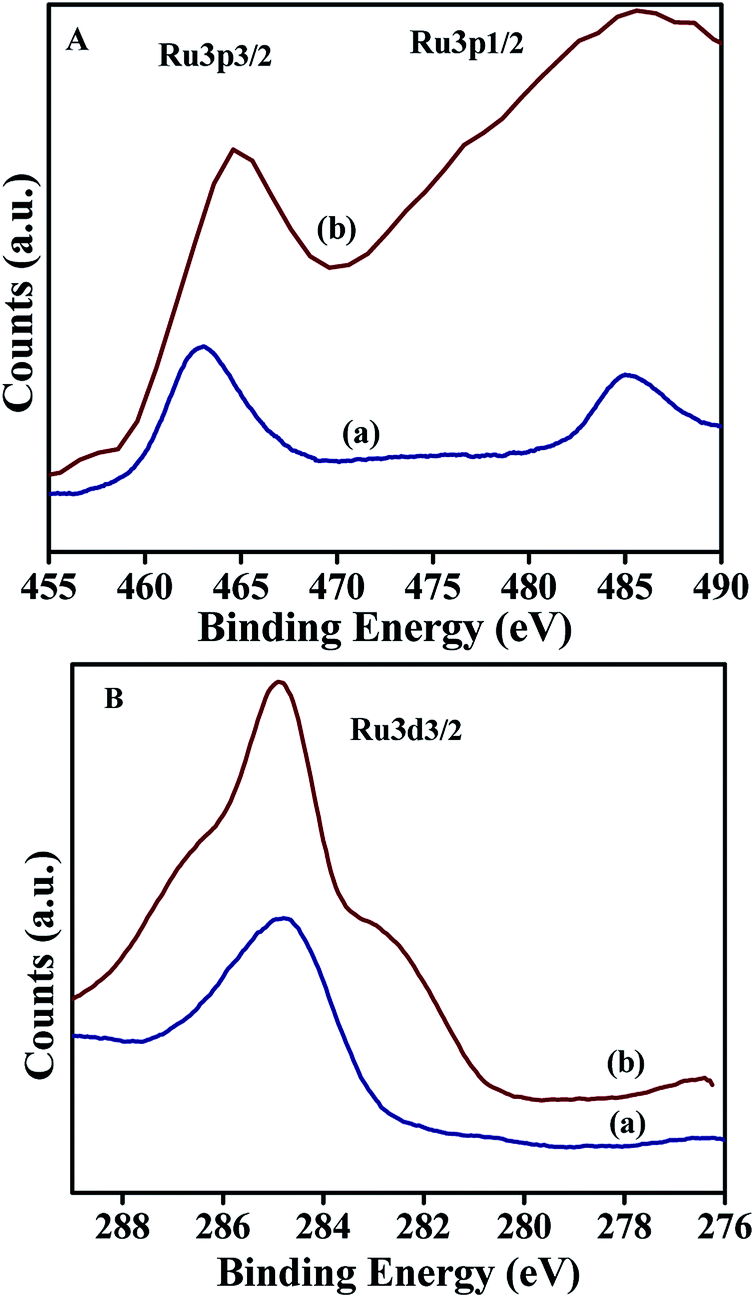 | ||
| Fig. 10 XPS of (A) Ru 3p; (B) Ru 3d in (a) NiRu-0.2 and (b) NiRu-0.6. | ||
Interestingly Ru 3d3/2 peak (Fig. 10B) of both NiRu-0.2 and NiRu-0.6 sample is located at the binding energy value of 284.8 eV suggesting the presence of ruthenium oxide in the hydrated form with in the frame work of nickel hydrotalcite. The incorporation of a large amount of ruthenium ions (NiRu-0.6) caused the broadening of XPS spectrum; this broadening may be attributed to the presence of some multiple oxidation-state ruthenium species.53
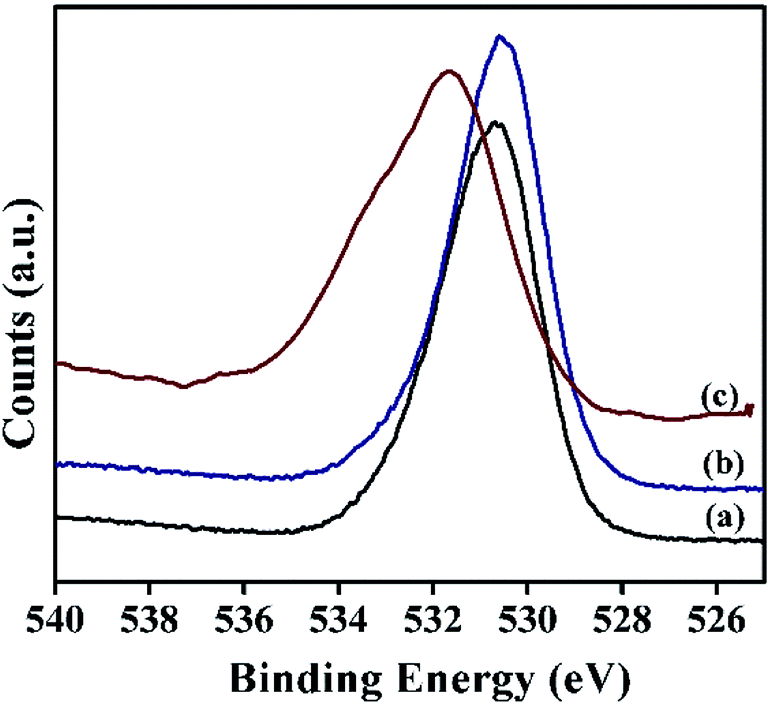
Moreover, the oxygen 1s spectra of α-Ni(OH)2 and NiRu-0.2 exhibited (Fig. 11) a broad peak in the binding energy value of 530.6 eV due to the presence of oxygen in different environments such as M–O–M, M–OH (where M = Ni/Ru), CO32− and water species. In case of NiRu-0.6 HT, the oxygen 1s spectra shows a shift towards higher binding energy (531.7 eV), which may be due to the formation of higher oxides in presence of increased amount of ruthenium.51 These results also correlate with our observations in Ru 3d region of the samples.
 | ||
| Fig. 11 XPS of O 1s in (a) α-Ni(OH)2, (b) NiRu-0.2 and (c)NiRu-0.6. | ||
The redox properties of α- and β-Ni(OH)2 and NiRu-HT-type samples were studied using TPR with hydrogen. TPR studies enable to understand the reducibility of the NiRu-HT-type materials. The TPR profiles (Fig. 12) displayed that the pure α-Ni(OH)2 exhibited a single reduction peak at 378 °C, which is a characteristic of the reduction of Ni(OH)2 to metallic Ni.54 However, β-Ni(OH)2 exhibited two reduction peaks between 391 and 630 °C. The additional peak that appeared at 630 °C may be due to the amorphous NiO present on the surface of β-Ni(OH)2.55 The incorporation of Ru3+ ions in the framework of α-Ni(OH)2, that is, NiRu-0.1-type materials, caused a peak at a low temperature of approximately 360 °C due to the reduction of NiRu(OH)x to the corresponding metallic nickel species.
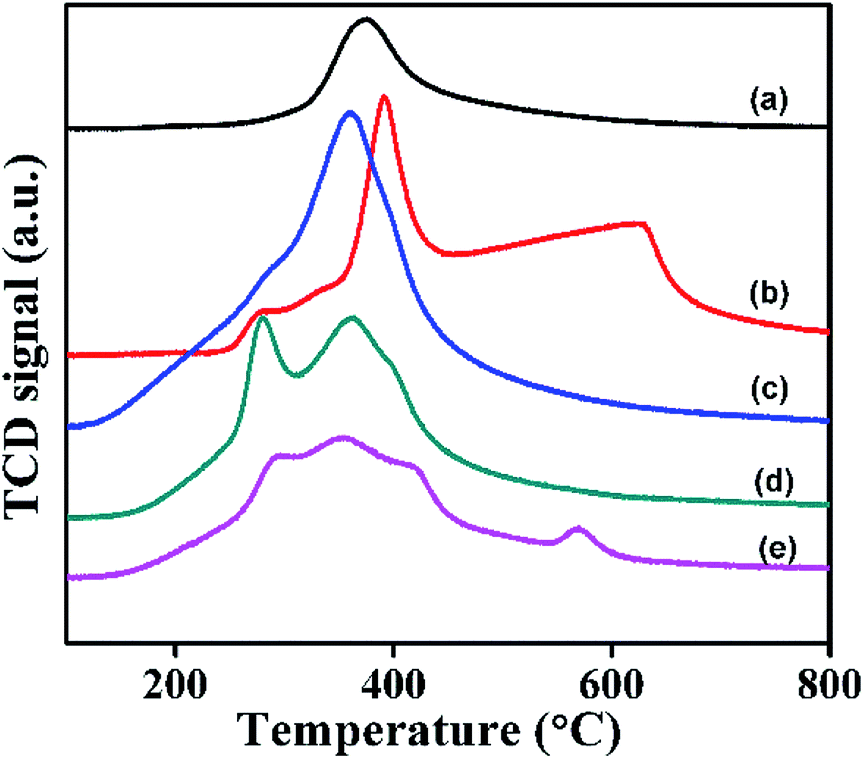 | ||
| Fig. 12 TPR profile of (a) α-Ni(OH)2 (b) β-Ni(OH)2 (c) NiRu-0.1 (d) NiRu-0.2 and (e) NiRu-0.6. | ||
The TPR profile of NiRu-0.2 suggests the existence of two reduction peaks at 278 and 362 °C that may have occurred due to the well dispersed ruthenium in the frame work as Ru3+ ions. The NiRu-0.6 sample exhibits reduction peaks at 290, 350, 416, and 568 °C respectively which could be due to presence of framework Ru3+ ions along with ruthenium oxide (RuOx) and (RuO2) species.55–57 As the Ru concentration increases in the samples, all TPR profiles of α-Ni(OH)2 evidently shifted to lower temperature ranges. The decrease in the reduction temperature of nickel oxides is due to the presence of framework ruthenium ions, which have a role in hydrogen spill-over effect.56 The presence of ruthenium ions on the surface dissociates to hydrogen species which diffuses to the bulk materials and enables the reduction of NiRu-HT at lower temperature.58,59 The lowering of the reduction temperature of NiRu-HT is due to the strong interaction between Ni2+ and Ru3+ ions in the framework of HT.
Influence of reaction parameters
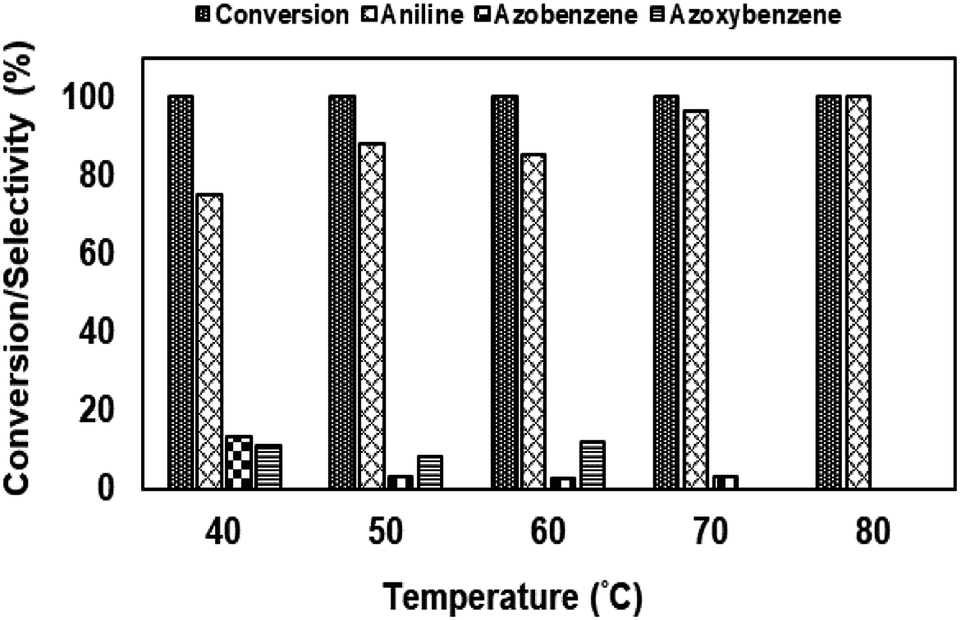 | ||
| Fig. 13 Effect of the reaction temperature on nitrobenzene reduction using NiRu-0.2. #Conditions: nitrobenzene-10 mmol, hydrazine: 20 mmol, solvent-isopropyl alcohol (20 ml), catalyst (NiRu-0.2-(100 mg)). | ||
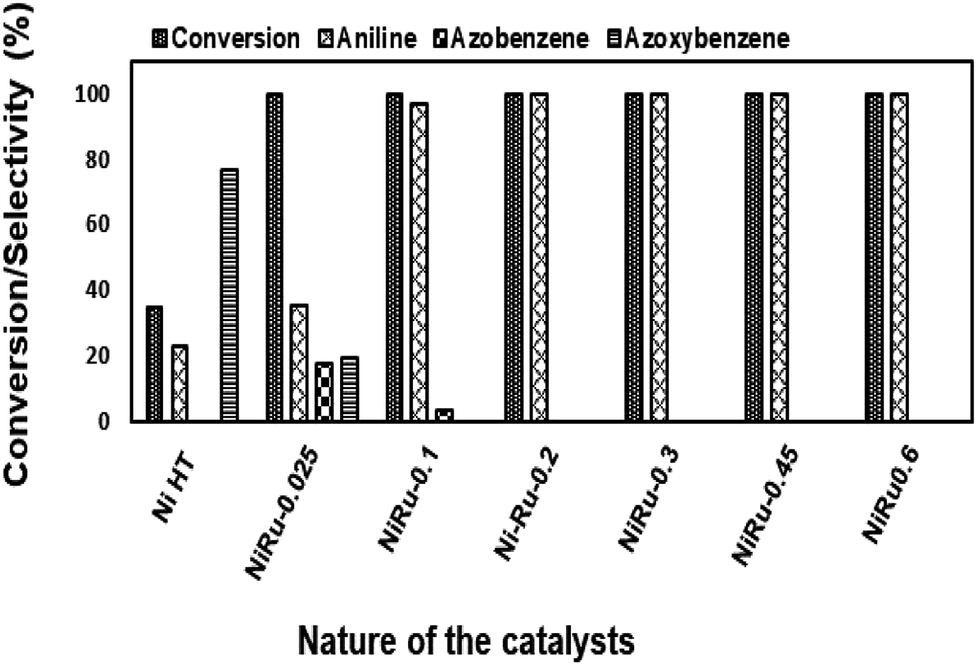 | ||
| Fig. 14 Reduction of nitrobenzene using NiRu-HT catalysts prepared with different ruthenium concentration. | ||
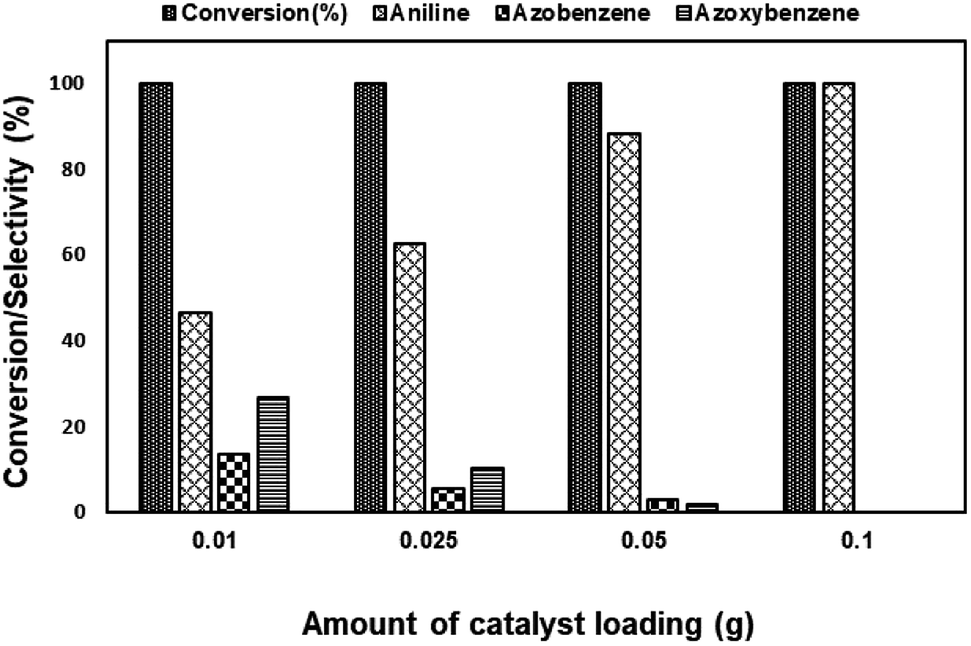 | ||
| Fig. 15 Effect of catalyst loading on nitrobenzene reduction using Ni–Ru-HT-0.2. | ||
Among the various catalysts, the use of NiRu-0.2 facilitates the complete conversion with exclusive formation of aniline was evident. Under similar conditions, NiRh-0.2, NiFe-0.2 catalysts gave 100% nitro benzene conversion with 87.1% and 34.6% aniline selectivity respectively with the formation of azobenzene and azoxybenzene as by-products. NiCo-0.2 catalyst shows only 16% conversion with 100% azoxybenzene selectivity. It is clear from above studies that among the various nickel based hydrotalcite, NiRu-0.2 catalyst is found to be superior for the complete conversion nitro benzene with the formation of aniline.
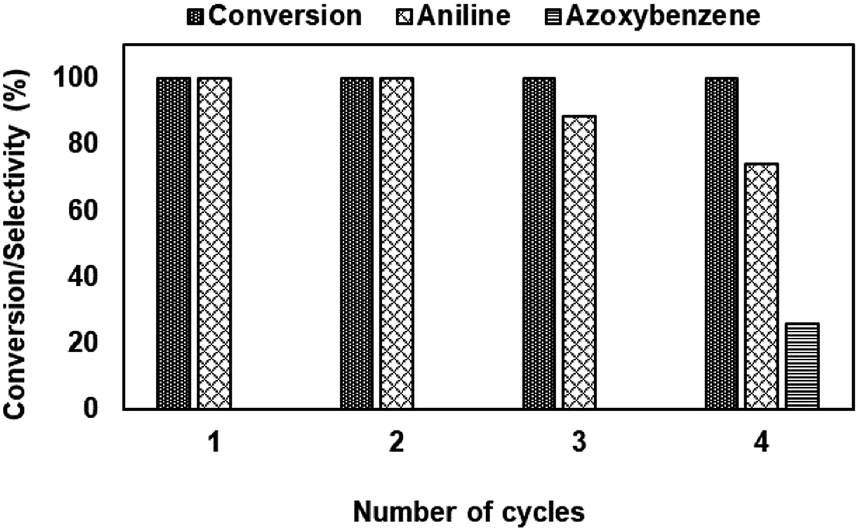 | ||
| Fig. 16 Recyclability study of NiRu-0.2 catalyst. | ||
| Sl no. | Substrate | Product | Yield (%) at | |
|---|---|---|---|---|
| 35 °C | 80 °C | |||
| a Substrate (10 mmol), catalyst Ni–Ru (1:0.2), (100 mg), isopropyl alcohol (20 ml), hydrazine hydrate (20 mmol = 1 ml), 80 °C,4 h. |
||||
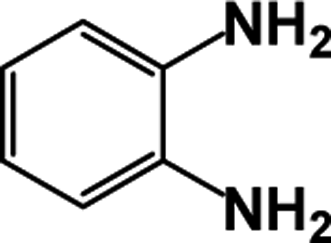
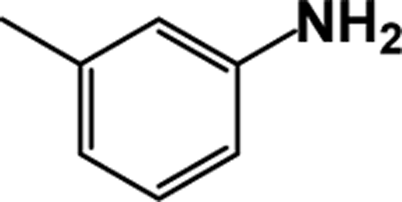
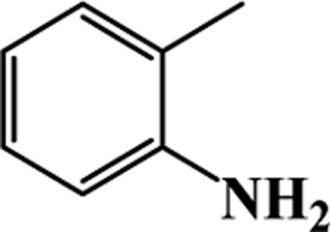
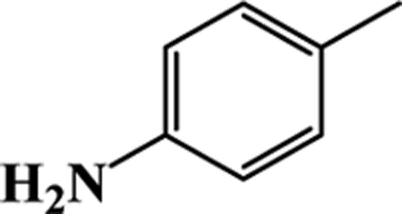
| 1 | 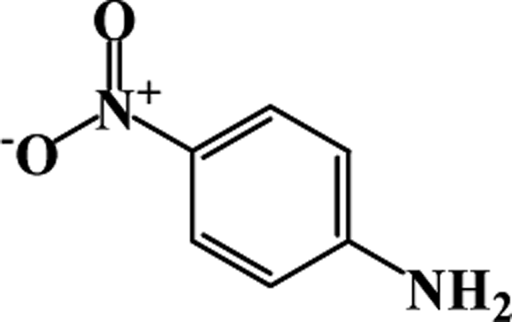 |
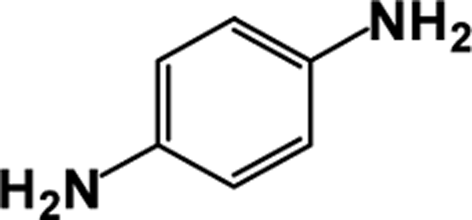 |
64 | 100 |
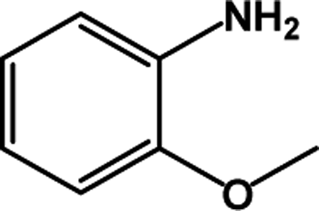
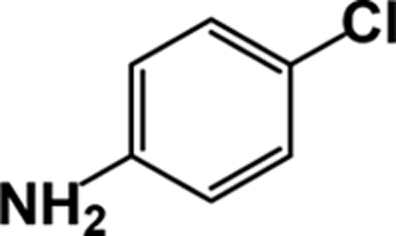
| 2 | 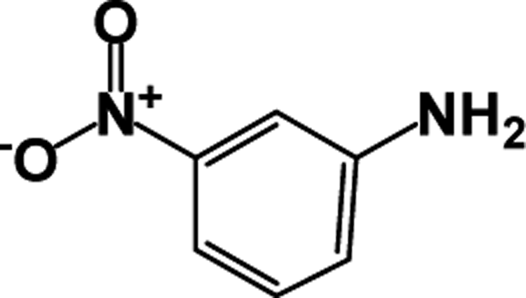 |
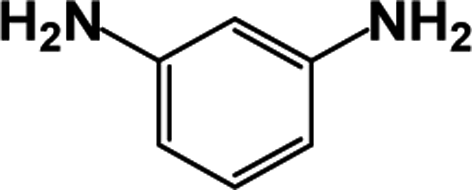 |
39 | 100 |
| 3 | 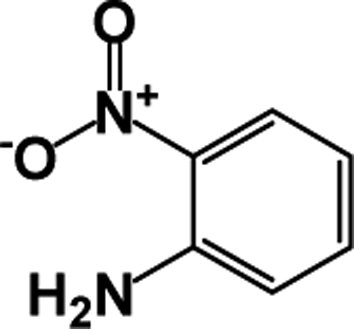 |
 |
63 | 100 |
| 4 | 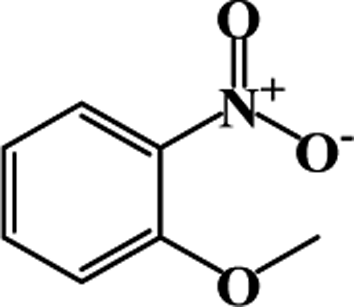 |
 |
55 | 100 |
| 5 | 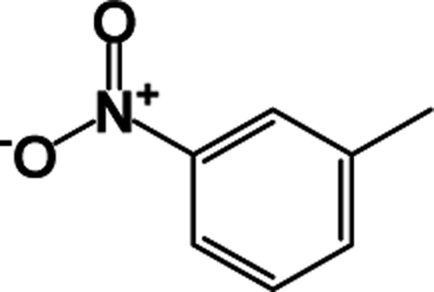 |
 |
51 | 100 |
| 6 | 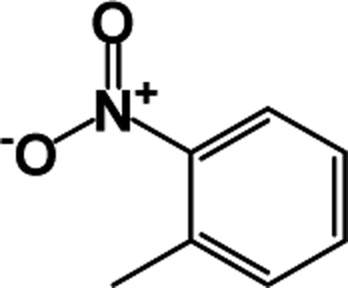 |
 |
37 | 100 |
| 7 | 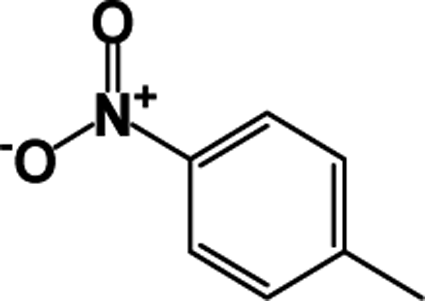 |
 |
87 | 91 |
| 8 | 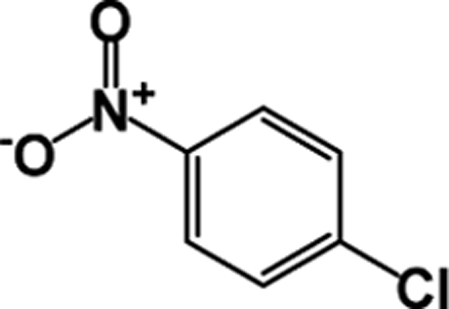 |
 |
10 | 89 |
Conclusion
Ruthenium ions substituted on α-Ni(OH)2-type layered materials are prepared for the first time using a simple co-precipitation method without using organic base. The formation of layered hydrotalcite-type materials is evident from powder XRD studies. The presence of ruthenium ions in the HT-framework is confirmed from powder XRD, XPS, and TPR studies. The presence of Ni2+ and Ru3+ in the octahedral environment is evident from the DRUV-Vis spectral studies. The presence of ruthenium ions in the framework facilitates the redox potential of catalysts employed for nitro-aromatic reduction, which showed a complete conversion of the nitro compound with exclusive formation of aniline products. Furthermore, the catalytic activity remains intact for several cycles.Conflicts of interest
There are no conflicts to declare.Acknowledgements
Authors thank to DST-SERB (EMR/2014/001214) for the financial support. Sreenavya is grateful to CUK for the fellowship and Lab facilities. Zeswa Catalyst Pvt. Ltd for their kind support on providing noble metal salts. Authors thank Dr G. V. Shanbhag, Poornaprajna Institute of Scientific research for their kind support on surface area analysis.Notes and references
- B. F. Sels, D. E. De Vos and P. A. Jacobs, Catal. Rev., 2001, 43, 443–488 CrossRef.
- K. Ladewig, Z. P. Xu and G. Q. Lu, Expert Opin. Drug Delivery, 2009, 6, 907–922 CrossRef PubMed.
- F. Cavani, F. Trifirò and A. Vaccari, Catal. Today, 1991, 11, 173–301 CrossRef.
- T. Baskaran, J. Christopher and A. Sakthivel, RSC Adv., 2015, 5, 98853–98875 RSC.
- A. Vaccari, Catal. Today, 1998, 41, 53–71 CrossRef.
- T. Baskaran, J. Christopher, T. Ajithkumar and A. Sakthivel, Appl. Catal., A, 2014, 488, 119–127 CrossRef.
- T. Baskaran, J. Christopher and A. Sakthivel, Adv. Porous Mater., 2014, 2, 54–60 CrossRef.
- T. Baskaran, R. Kumaravel, J. Christopher and A. Sakthivel, RSC Adv., 2013, 3, 16392–16398 RSC.
- T. Baskaran, R. Kumaravel, J. Christopher and A. Sakthivel, RSC Adv., 2014, 4, 11188–11196 RSC.
- T. Baskaran, N. R. Mahato, J. Christopher and A. Sakthivel, Adv. Porous Mater., 2015, 2, 183–188 CrossRef.
- A. Sakthivel, N. R. Mahato, T. Baskaran and J. Christopher, Catal. Commun., 2015, 65, 55–61 CrossRef.
- D. Sharma and A. Sakthivel, J. Nanosci. Nanotechnol., 2018, 18, 381–385 CrossRef PubMed.
- B. Thangaraj, C. Jayaraj, V. Ganesh and S. Ayyamperumal, Catal. Commun., 2016, 74, 85–90 CrossRef.
- B. Thangaraj, C. Jayaraj, R. Srinivasan and S. Ayyamperumal, J. Mol. Catal. A: Chem., 2015, 409, 11–18 CrossRef.
- W. T. Reichle, J. Catal., 1985, 94, 547–557 CrossRef.
- K. Zhu, C. Liu, X. Ye and Y. Wu, Appl. Catal., A, 1998, 168, 365–372 CrossRef.
- L. Yumin, L. Shetian, Z. Kaizheng, Y. Xingkai and W. Yue, Appl. Catal., A, 1998, 169, 127–135 CrossRef.
- F. Bröcker and L. Kainer, UK Patent 1342020, 1971.
- P. S. Kumbhar, J. Sanchez-Valente, J. M. M. Millet and F. Figueras, J. Catal., 2000, 191, 467–473 CrossRef.
- Z. P. Xu, J. Zhang, M. O. Adebajo, H. Zhang and C. Zhou, Appl. Clay Sci., 2011, 53, 139–150 CrossRef.
- O. Lebedeva, D. Tichit and B. Coq, Appl. Catal., A, 1999, 183, 61–71 CrossRef.
- V. Rives and S. Kannan, J. Mater. Chem., 2000, 10, 489–495 RSC.
- S. De, J. Zhang, R. Luque and N. Yan, Energy Environ. Sci., 2016, 9, 3314–3347 RSC.
- C. Ruby, M. Usman, S. Naille, K. Hanna, C. Carteret, M. Mullet, M. François and M. Abdelmoula, Appl. Clay Sci., 2010, 48, 195–202 CrossRef.
- D. Sharma, T. Baskaran, J. Christopher and A. Sakthivel, Nanosci. Nanotechnol. Lett., 2016, 8, 360–364 CrossRef.
- X. Liu, R. Ma, Y. Bando and T. Sasaki, Angew. Chem., Int. Ed., 2010, 49, 8253–8256 CrossRef PubMed.
- Z. Liu, R. Ma, M. Osada, K. Takada and T. Sasaki, J. Am. Chem. Soc., 2005, 127, 13869–13874 CrossRef PubMed.
- P. Vialat, C. Mousty, C. Taviot-Gueho, G. Renaudin, H. Martinez, J. C. Dupin, E. Elkaim and F. Leroux, Adv. Funct. Mater., 2014, 24, 4831–4842 CrossRef.
- B. Schneiderová, J. Demel, J. Pleštil, H. Tarábková, J. Bohuslav and K. Lang, Dalton Trans., 2014, 43, 10484–10491 RSC.
- K. Ariga, Y. Yamauchi, G. Rydzek, Q. Ji, Y. Yonamine, K. C.-W. Wu and J. P. Hill, Chem. Lett., 2013, 43, 36–68 CrossRef.
- B. Zapata, P. Bosch, G. Fetter, M. Valenzuela, J. Navarrete and V. Lara, Int. J. Inorg. Mater., 2001, 3, 23–29 CrossRef.
- D. Sharma, V. Ganesh and A. Sakthivel, Appl. Catal., A, 2018, 555, 155–160 CrossRef.
- P. R. Martins, M. Aparecida Rocha, L. Angnes, H. Eisi Toma and K. Araki, Electroanalysis, 2011, 23, 2541–2548 CrossRef.
- N. A. Hoque, P. Thakur, A. Kool, S. Das and P. P. Ray, J. Mater. Sci.: Mater. Electron., 2017, 28, 5375–5383 CrossRef.
- D. S. Hall, D. J. Lockwood, C. Bock and B. R. MacDougall, Proc. R. Soc. A, 2015, 471, 20140792 CrossRef PubMed.
- G.-X. Tong, F.-T. Liu, W.-H. Wu, J.-P. Shen, X. Hu and Y. Liang, Cryst. Eng. Commun., 2012, 14, 5963–5973 RSC.
- M.-Y. Cheng and B.-J. Hwang, J. Colloid Interface Sci., 2009, 337, 265–271 CrossRef PubMed.
- J. W. Lee, J. M. Ko and J.-D. Kim, J. Phys. Chem. C, 2011, 115, 19445–19454 CrossRef.
- Y. Luo, G. Li, G. Duan and L. Zhang, Nanotechnology, 2006, 17, 4278 CrossRef PubMed.
- S. Cabanas-Polo, Z. Gonzalez, A. Sanchez-Herencia and B. Ferrari, Cryst. Eng. Commun., 2015, 17, 6193–6206 RSC.
- Z. Gonzalez, J. Yus, A. Caballero, J. Morales, A. Sanchez-Herencia and B. Ferrari, Electrochim. Acta, 2017, 247, 333–343 CrossRef.
- D. Li, K. Nishida, Y. Zhan, T. Shishido, Y. Oumi, T. Sano and K. Takehira, Appl. Clay Sci., 2009, 43, 49–56 CrossRef.
- S. Le Bihan and M. Figlarz, J. Cryst. Growth, 1972, 13, 458–461 CrossRef.
- M. Freitas, J. Power Sources, 2001, 93, 163–173 CrossRef.
- F. M. Labajos, M. D. Sastre, R. Trujillano and V. Rives, J. Mater. Chem., 1999, 9, 1033–1039 RSC.
- E. A. Seddon and K. R. Seddon, The Chemistry of Ruthenium, in Topics in Inorganic and General Chemistry: A Collection of Monographs, ed.R. J. H. Clark, Elsevier, 2013 Search PubMed.
- M. Krauss and W. Stevens, J. Chem. Phys., 1985, 82, 5584–5596 CrossRef.
- M. Tomellini, J. Chem. Soc., Faraday Trans. 1, 1988, 84, 3501–3510 RSC.
- A. P. Grosvenor, M. C. Biesinger, R. S. C. Smart and N. S. McIntyre, Surf. Sci., 2006, 600, 1771–1779 CrossRef.
- A. Davidson, J. Tempere, M. Che, H. Roulet and G. Dufour, J. Phys. Chem., 1996, 100, 4919–4929 CrossRef.
- K. Yamaguchi, T. Koike, J. W. Kim, Y. Ogasawara and N. Mizuno, Chem.–Eur. J., 2008, 14, 11480–11487 CrossRef PubMed.
- D. Briggs and M. Seah, Practical Surface Analysis: By Auger and X-ray Photoelectron Spectroscopy, Wiley, 2003 Search PubMed.
- D. J. Morgan, Surf. Interface Anal., 2015, 47, 1072–1079 CrossRef.
- J. Dou, Z. Bao and F. Yu, ChemCatChem, 2018, 10, 250–258 CrossRef.
- A. Masalska, Catal. Today, 2008, 137, 439–445 CrossRef.
- Z. Bian, S. Das, M. H. Wai, P. Hongmanorom and S. Kawi, ChemPhysChem, 2017, 18, 3117–3134 CrossRef PubMed.
- A. S. Nagpure, A. K. Venugopal, N. Lucas, M. Manikandan, R. Thirumalaiswamy and S. Chilukuri, Catal. Sci. Technol., 2015, 5, 1463–1472 RSC.
- A. Ballarini, P. Benito, G. Fornasari, O. Scelza and A. Vaccari, Int. J. Hydrogen Energy, 2013, 38, 15128–15139 CrossRef.
- J. A. Velasco, C. Fernandez, L. Lopez, S. Cabrera, M. Boutonnet and S. Järås, Fuel, 2015, 153, 192–201 CrossRef.
- M. Sudhakar, M. Lakshmi Kantam, R. Kishore, S. Naveen Kumar and A. Venugopal, Indian J. Chem., 2014, 53A, 550–552 Search PubMed.
Footnote |
| † Electronic supplementary information (ESI) available: Fig. S1 wide scan XPS spectra of (a) α-Ni(OH)2, and (b) NiRu-0.2; Table S1 nitrobenzene reduction using a series of nickel based hydrotalcite; Scheme S1 representative reaction pathway of nitrobenzene reduction on nickel based hydrotalcite. See DOI: 10.1039/c8ra03506g |
| This journal is © The Royal Society of Chemistry 2018 |