 Open Access Article
Creative Commons Attribution 3.0 Unported Licence
A novel near-infrared fluorescent probe for highly selective recognition of hydrogen sulfide and imaging in living cells†
Keli Zhong ab,
Longlong Denga,
Jie Zhaoa,
Xiaomei Yanc,
Tong Sun*b,
Jianrong Li
 *b and
Lijun Tang
 *a
*a
aCollege of Chemistry and Chemical Engineering, Bohai University, Jinzhou, 121013, China. E-mail: ljtang@bhu.edu.cn
bCollege of Food Science and Technology, Bohai University, National & Local Joint Engineering Research Center of Storage, Processing and Safety Control Technology for Fresh Agricultural and Aquatic Products, The Fresh Food Storage and Processing Technology Research Institute of Liaoning Provincial Universities, Jinzhou, 121013, China. E-mail: jzsuntong@sina.com; lijr6491@163.com
cCollege of Laboratory Medicine, Dalian Medical University, Dalian, 116044, China
First published on 2nd July 2018
Abstract
A novel near-infrared fluorescent probe (L) based on a 1,4-diethyl-1,2,3,4-tetrahydro-7H-pyrano[2,3-g]quinoxalin-7-one scaffold has been synthesized and characterized. Probe L displays highly selective and sensitive recognition to H2S over various anions and biological thiols with a large Stokes shift (125 nm) in THF/H2O (6/4, v/v, Tris–HCl 10 mM, pH = 7.4). This probe exhibits turn-on fluorescence for H2S through HS− induced thiolysis of dinitrophenyl ether. Confocal laser scanning micrographs of MCF-7 cells incubated with L confirm that L is cell-permeable and can successfully detect H2S in living cells.
Introduction
Hydrogen sulfide (H2S), a newly identified gaseous signalling molecule, has recently become a research focus in biological fields due to its multiple functions in physiological and pathological processes.1 Previous studies have demonstrated that endogenous H2S can affect the functions of neuronal, cardiovascular, immune, endocrine, and gastrointestinal systems and its antioxidant and anti-apoptotic signaling effects also show therapeutic benefit for the treatment of ischemia-induced heart failure.2 Excessive H2S can irritate the eyes and respiratory tract, causing severe loss of consciousness, respiratory failure, and even death.3 The concentration-dependent effects of H2S on health and disease demand precise methods to track the production of this important signaling molecule in living organisms.4In view of the biological importance of H2S, several methods such as colorimetry,5–8 electrochemistry,9–11 and gas chromatography12 have been reported for H2S detection. Compared with these traditional methods, fluorescence analysis is widely used because of its advantages such as good selectivity, high sensitivity, simplicity, rapidness, and nondestructive bioimaging.13 Much attention has been given by chemists and biologists to develop various fluorescent chemosensors that would allow real-time tracking of a small molecule of interest in living cells and animals.14
In recent years, a number of fluorescent H2S probes based on different design strategies have been developed, including using nucleophilic substitution reaction,15–17 chemoselective reduction of azide to amine,18–20 Cu2+–fluorophore complex21–23 through indicator displacement assays. However, most of the reported H2S fluorescent probes still have some limitations, such as short emission wavelength, working in pure organic solvent, poor biological applications, etc. In fact, fluorescent probes with near-infrared (NIR) emission are more suitable for bioimaging applications due to their deep tissue penetration, minimum photo damage and background autofluorescence interference.24–32 Therefore, it is important to design and synthesize NIR fluorescent probe for selective and sensitive detection of H2S.33–35
In view of this, we judiciously designed an “off–on” fluorescence probe (L) for H2S detection with NIR emission. Coumarinyl chalcone (1) was selected as the NIR emitting fluorophore owing to its high molar absorption coefficient and long-wavelength emission.36 The incorporated 2,4-dinitrophenyl ether moiety in L was anticipated to function as both H2S recognition site and fluorescence quencher.37–41 After reaction with H2S, a fluorescence turn-on response would occur through HS−-triggered thiolysis of dinitrophenyl ether to release 1. Further investigations demonstrate that the proposed fluorescent probe L displays high selectivity and sensitivity to H2S with fast response and NIR emission, and L is applicable to image H2S in living cells. To the best of our knowledge, NIR fluorescence turn-on H2S probe based on thiolysis of the dinitrophenyl ether were rarely reported.
Experimental
Instruments and materials
1H NMR and 13C NMR spectra were measured on an Agilent 400 MR spectrometer, and the chemical shifts were expressed in ppm and coupling constants (J) in hertz. High-resolution mass spectra (HRMS) were measured using a Bruker micrOTOF-Q mass spectrometer (Bruker Daltonik, Bremen, Germany). Fluorescence measurements were carried out on a Sancho 970-CRT spectrofluorometer (Shanghai, China). UV-vis absorption spectra were measured with a SP-1900 spectrophotometer (Shanghai Spectrum Instruments Co., Ltd., China). pH measurements were made with a Model PHS-25 Bmeter (Shanghai, China). Cell imaging was observed under a confocal laser scanning microscope (LEICA TCS SP5 II, Germany) with excitation at 405 nm. Fluorescence quantum yields were measured with an absolute fluorescence quantum yield spectrometer (Quantaurus-QY C11347, Hamamatsu Photonics).Unless otherwise noted, reagents were purchased from commercial suppliers and used without further purification. 3 was prepared according to the reported method42 (ESI†). MCF-7 (human breast carcinoma) cells were obtained from Institute of Basic Medical Sciences (IBMS) of Chinese Academy of Medical Sciences (CAMS).
General methods
Stock solutions (50 mM) of anions (sodium or potassium salts), NaHS used as H2S source, and biological thiols (glutathione (GSH), homocysteine (Hcy) and cysteine (Cys)) were prepared in double-distilled water. Stock solution of L (10 mM) was prepared in DMSO and was further diluted with a mixed solution of THF/H2O (v/v, 6![[thin space (1/6-em)]](https://www.rsc.org/images/entities/char_2009.gif) :
:![[thin space (1/6-em)]](https://www.rsc.org/images/entities/char_2009.gif) 4 Tris–HCl 10 mM, pH = 7.4) to make a final concentration at 10 μM. Fluorescence spectra were measured using 10 μM solution of L after 30 minutes upon addition of anions by excitation at 500 nm. The excitation and emission slit widths were 10 and 10 nm, respectively. All titration experiments were carried out at room temperature. Double-distilled water was used throughout the experiments.
4 Tris–HCl 10 mM, pH = 7.4) to make a final concentration at 10 μM. Fluorescence spectra were measured using 10 μM solution of L after 30 minutes upon addition of anions by excitation at 500 nm. The excitation and emission slit widths were 10 and 10 nm, respectively. All titration experiments were carried out at room temperature. Double-distilled water was used throughout the experiments.
Synthesis of compound 2
Compound 3 (468.2 mg, 2.0 mmol), acetylacetic ether (260.4 mg, 2.0 mmol), and piperidine (0.1 mL) were dissolved in dry ethanol, the mixture was heated to refluxed for 4 h, then it was poured into hydrochloric acid (4 M, 10 mL) and stirred at 60 °C for 30 minutes. After that, the mixture was further diluted with H2O and extracted with ethyl acetate, and organic layer was dried with anhydrous Na2SO4 and removed under reduced pressure. The residue was purified by column chromatography with petroleum ether/ethyl acetate (5![[thin space (1/6-em)]](https://www.rsc.org/images/entities/char_2009.gif) :
:![[thin space (1/6-em)]](https://www.rsc.org/images/entities/char_2009.gif) 1, v/v) as eluent to give compound 2 (420.5 mg, 70%). 1H NMR (400 MHz, CDCl3) δ 8.38 (s, 1H), 6.48 (s, 1H), 6.39 (s, 1H), 3.59–3.52 (m, 2H), 3.42 (q, J = 7.1 Hz, 2H), 3.32 (q, J = 7.1 Hz, 2H), 3.26–3.20 (m, 2H), 2.67 (s, 3H), 1.22 (t, J = 7.2 Hz, 3H), 1.18 (t, J = 7.2 Hz, 3H).
1, v/v) as eluent to give compound 2 (420.5 mg, 70%). 1H NMR (400 MHz, CDCl3) δ 8.38 (s, 1H), 6.48 (s, 1H), 6.39 (s, 1H), 3.59–3.52 (m, 2H), 3.42 (q, J = 7.1 Hz, 2H), 3.32 (q, J = 7.1 Hz, 2H), 3.26–3.20 (m, 2H), 2.67 (s, 3H), 1.22 (t, J = 7.2 Hz, 3H), 1.18 (t, J = 7.2 Hz, 3H).
Synthesis of compound 1
Compound 2 (300.4 mg, 1.0 mmol), p-hydroxybenzaldehyde (134.2 mg, 1.1 mmol), and piperidine (0.1 mL) were dissolved by toluene, the mixture was heated to refluxed for 4 h, then it was poured into hydrochloric acid (4 M, 10 mL) and stirred for 50 min at 60 °C. After that, water were added into the mixture, then mixture was extracted with ethyl acetate (3 × 100 mL), and combined organic layer was dried with anhydrous Na2SO4 and removed under reduced pressure. The crude products were purified by column chromatography with petroleum ether/ethyl acetate (1![[thin space (1/6-em)]](https://www.rsc.org/images/entities/char_2009.gif) :
:![[thin space (1/6-em)]](https://www.rsc.org/images/entities/char_2009.gif) 1, v/v) as eluent to give compound 1 (199.8 mg, 49%). Mp 203.2–203.7 °C; 1H NMR (400 MHz, DMSO-d6) δ 10.01 (s, 1H), 8.48 (s, 1H), 7.82 (d, J = 15.7 Hz, 1H), 7.56 (d, J = 15.7 Hz, 1H), 7.51 (d, J = 8.2 Hz, 2H), 6.76–6.83 (m, 3H), 6.51 (s, 1H), 3.51 (t, J = 5.1 Hz, 2H), 3.45 (q, J = 7.1 Hz, 2H), 3.27 (d, J = 7.1 Hz, 2H), 3.15 (t, J = 5.1 Hz, 2H), 1.04–1.12 (m, 6H); 13C NMR (101 MHz, DMSO-d6) δ 185.70, 160.26, 153.36, 147.86, 143.95, 142.54, 132.69, 131.95, 130.80, 130.06, 129.09, 126.50, 122.21, 116.36, 115.25, 109.00, 108.14, 95.06, 47.53, 45.96, 45.05, 44.11, 10.85, 9.64; HRMS (ESI+) calcd for C24H24N2O4 [M − H]+: 403.1736, found: 403.1658.
1, v/v) as eluent to give compound 1 (199.8 mg, 49%). Mp 203.2–203.7 °C; 1H NMR (400 MHz, DMSO-d6) δ 10.01 (s, 1H), 8.48 (s, 1H), 7.82 (d, J = 15.7 Hz, 1H), 7.56 (d, J = 15.7 Hz, 1H), 7.51 (d, J = 8.2 Hz, 2H), 6.76–6.83 (m, 3H), 6.51 (s, 1H), 3.51 (t, J = 5.1 Hz, 2H), 3.45 (q, J = 7.1 Hz, 2H), 3.27 (d, J = 7.1 Hz, 2H), 3.15 (t, J = 5.1 Hz, 2H), 1.04–1.12 (m, 6H); 13C NMR (101 MHz, DMSO-d6) δ 185.70, 160.26, 153.36, 147.86, 143.95, 142.54, 132.69, 131.95, 130.80, 130.06, 129.09, 126.50, 122.21, 116.36, 115.25, 109.00, 108.14, 95.06, 47.53, 45.96, 45.05, 44.11, 10.85, 9.64; HRMS (ESI+) calcd for C24H24N2O4 [M − H]+: 403.1736, found: 403.1658.
Synthesis of probe L
Compound 1 (404.5 mg, 0.5 mmol), 2,4-dinitrofluorobenzene (186.0 mg, 0.6 mmol), potassium carbonate (187 mg, 1.0 mmol) were dissolved into DMF (5.0 mL), the mixture was stirred for 3 h at room temperature. After that, water was added and then the mixture was extracted with ethyl acetate, organic layer was dried with anhydrous Na2SO4. The crude products was purified by column chromatography with petroleum ether/dichloromethane (1![[thin space (1/6-em)]](https://www.rsc.org/images/entities/char_2009.gif) :
:![[thin space (1/6-em)]](https://www.rsc.org/images/entities/char_2009.gif) 4, v/v) as eluent to give compound L (285.3 mg, 50%). Mp > 250 °C; 1H NMR (400 MHz, DMSO-d6) δ 8.91 (d, J = 2.8 Hz, 1H), 8.55 (s, 1H), 8.46 (dd, J = 9.2, 2.8 Hz, 1H), 8.04 (d, J = 15.8 Hz, 1H), 7.87 (d, J = 8.4 Hz, 2H), 7.70 (d, J = 15.8 Hz, 1H), 7.35 (d, J = 8.4 Hz, 2H), 7.30 (d, J = 9.2 Hz, 1H), 6.88 (s, 1H), 6.57 (s, 1H), 3.57 (t, J = 5.0 Hz, 3H), 3.50 (q, J = 7.0 Hz, 2H), 3.36–3.31 (m, 2H), 3.20 (t, J = 5.0 Hz, 2H), 1.18–1.09 (m, 6H); 13C NMR (101 MHz, DMSO-d6) δ 185.76, 160.79, 155.52, 154.78, 153.64, 148.07, 144.29, 142.17, 140.44, 140.04, 133.47, 132.76, 131.96, 131.10, 130.11, 129.09, 126.24, 122.37, 121.08, 120.38, 114.76, 109.10, 108.14, 95.08, 47.59, 46.03, 45.06, 44.06, 10.89, 9.63; HRMS (ESI+) calcd for C30H27N4O8 [M + H]+: 571.1751, found: 571.1802.
4, v/v) as eluent to give compound L (285.3 mg, 50%). Mp > 250 °C; 1H NMR (400 MHz, DMSO-d6) δ 8.91 (d, J = 2.8 Hz, 1H), 8.55 (s, 1H), 8.46 (dd, J = 9.2, 2.8 Hz, 1H), 8.04 (d, J = 15.8 Hz, 1H), 7.87 (d, J = 8.4 Hz, 2H), 7.70 (d, J = 15.8 Hz, 1H), 7.35 (d, J = 8.4 Hz, 2H), 7.30 (d, J = 9.2 Hz, 1H), 6.88 (s, 1H), 6.57 (s, 1H), 3.57 (t, J = 5.0 Hz, 3H), 3.50 (q, J = 7.0 Hz, 2H), 3.36–3.31 (m, 2H), 3.20 (t, J = 5.0 Hz, 2H), 1.18–1.09 (m, 6H); 13C NMR (101 MHz, DMSO-d6) δ 185.76, 160.79, 155.52, 154.78, 153.64, 148.07, 144.29, 142.17, 140.44, 140.04, 133.47, 132.76, 131.96, 131.10, 130.11, 129.09, 126.24, 122.37, 121.08, 120.38, 114.76, 109.10, 108.14, 95.08, 47.59, 46.03, 45.06, 44.06, 10.89, 9.63; HRMS (ESI+) calcd for C30H27N4O8 [M + H]+: 571.1751, found: 571.1802.
Cell viability assays
The cytotoxicity of the probe was examined by MTT assay. MCF-7 cells with 90% confluence was digested by 0.25% of trypsin, and transferred into 96-well plates with a cell suspension of 5000 cells per hole. The cells were incubated for 24 h at 37 °C, and then different concentrations of L (0, 1.0, 5.0, 10, 20, 40 μM) were added to the 96-well plates. After 24 h incubation at the same condition, 10 μL MTT was added and incubated for another 4 h. The cells were washed twice with PBS (1 mL) and dissolved with DMSO (1 mL). The absorbance was recorded at 490 nm using the microplate spectrophotometer system, and each experiment was run in triplicate. Cell viability was calculated based on the equation: Cell viability (%) = (Awith probe − Ablank)/(Acontrol − Ablank) × 100%.Cell culture and confocal image
Similar to the cytotoxicity assay and incubation conditions, MCF-7 cells of proper density were transferred in confocal dishes. After 24 h incubating at 37 °C, the cell layer were washed three times with PBS buffer, then the same solution with a concentration of 2 μM L was added into each well and incubated for 30 min. Subsequently, the L treated MCF-7 cells were washed three times with PBS, and then further incubated with different concentrations of NaHS (10, 20, and 50 μM) for 30 min. After washing the culture dishes three times with PBS, fluorescence imaging experiments were performed using a LEICA TCS SP5 II confocal laser scanning microscope.Results and discussion
Synthesis and characterization of probe L
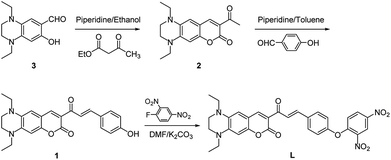
Probe L was synthesized according to the procedures as outlined in Scheme 1. Condensation of 1,4-diethyl-7-hydroxy-1,2,3,4-tetrahydroquinoxaline-6-carbaldehyde (3) with ethyl acetoacetate to give compound 2, which was followed by Claisen–Schmidt reaction with p-hydroxy benzaldehyde to afford compound 1. Probe L was synthesized via nucleophilic substitution reaction of 1 with 2,4-dinitrofluorobenzene and was structurally characterized by 1H NMR, 13C NMR, HRMS (Fig. S1–S3, ESI†).Optical responses of L to H2S
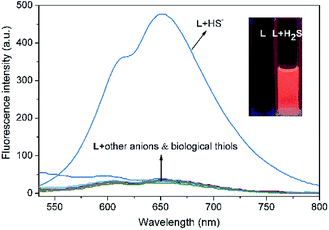
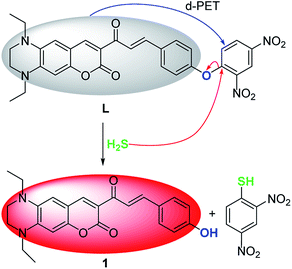
The specific selectivity of a probe determines its basic performance. Therefore, the optical responses of L toward various anions including F−, Cl−, Br−, I−, NO2−, CO32−, HCO3−, CH3COO−, HPO42−, H2PO4−, PO43−, CN−, SCN−, HS−, PPi, ClO−, SO42−, SO32−, HSO3−, HSO4−, N3− and S2O32−, as well as biological thiols (Cys, Hcy, GSH) were explored (Fig. 1). Probe L (10 μM) displays quite weak fluorescence emission (Φ = 0.0035) in THF/H2O (6/4, v/v, Tris–HCl 10 mM, pH = 7.4) solution (λex = 500 nm). Due to the strong electron withdrawing effect of the 2,4-dinitrophenyl ether group, a possible donor-excited photo-induced electron transfer (d-PET) process from coumarinyl chalcone to 2,4-dinitrophenyl would occur on excitation,43 which is responsible to the observed fluorescence quenching. When L was treated with 100 equiv. of HS−, a strong emission band centered at 650 nm occurred (Φ = 0.011) and the fluorescence color changed from non-fluorescence to vivid red (Fig. 1, inset or S4†). However, the fluorescence emission intensity of L underwent negligible or very slight changes upon addition of other anions and biological thiols to solution of L. These results demonstrate that L possesses high selectivity to H2S.In addition, UV-vis absorption experiments were carried out, and the absorption band centered at 525 nm of L (ε = 428![[thin space (1/6-em)]](https://www.rsc.org/images/entities/char_2009.gif) 144 M−1 cm−1) underwent a blue shift of 8 nm upon addition of HS− (ε = 391
144 M−1 cm−1) underwent a blue shift of 8 nm upon addition of HS− (ε = 391![[thin space (1/6-em)]](https://www.rsc.org/images/entities/char_2009.gif) 138 M−1 cm−1). There was no significant change in the absorption and color of L solution upon addition of other anions and biological thiols (Fig. S5†). The results indicate that L is hardly to recognize H2S via UV-vis measurements. The Stokes shift was found to be 125 nm, such a large Stokes shift and emission wavelength are beneficial to biological imaging because they could efficiently minimize self-absorption and reduce the interference from auto-fluorescence (Fig. 2).44
138 M−1 cm−1). There was no significant change in the absorption and color of L solution upon addition of other anions and biological thiols (Fig. S5†). The results indicate that L is hardly to recognize H2S via UV-vis measurements. The Stokes shift was found to be 125 nm, such a large Stokes shift and emission wavelength are beneficial to biological imaging because they could efficiently minimize self-absorption and reduce the interference from auto-fluorescence (Fig. 2).44
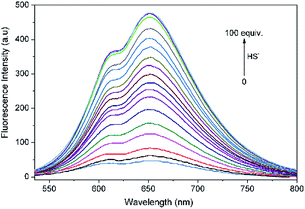 | ||
| Fig. 2 Fluorescence spectrum changes of L (10 μM) upon incremental addition of HS− (0–100 equiv.) in THF–Tris (6/4, v/v) solution (λex = 500 nm). | ||
Fluorescence titration experiments of L with HS− were performed to further explore the sensing behaviors of L. With increasing the added amount of HS− to L solution, the emission intensity of L at 650 nm concomitantly increased and reached a plateau when 100 equiv. of HS− was employed. The intensity of L towards HS− exhibited a good linear correlation with the concentration of HS− ranging from 200 to 550 μM (R2 = 0.9938). Based on the signal to noise ratio, the detection limit (LOD = 3σ/k, σ is the standard deviation of the blank solution; k is the slope of the calibration curve) of L to HS− was calculated to be 7.3 × 10⁻⁷ M (Fig. S6†), indicating that L was highly sensitive to H2S and had a potential applicability for bioimaging of HS−.
To assess the specific nature of L toward HS−, competitive experiments were then performed to estimate the availability of L in complicated systems. As illustrated in Fig. 3, HS− could still produce a significant fluorescence enhancement in the presence of co-existing anions or biothiols, indicating the excellent anti-interference ability of L for HS− recognition. At the same time, we also prove that S22− and p-toluenethiol have no interference for recognition of H2S (Fig. S7†), which is beneficial to its potential applications in complicated biological systems. In addition, the time-dependent fluorescence variations of the probe were also monitored. As shown in Fig. 4, the fluorescence intensity of L increased along with the time and reached a maximum within ∼18 min, which is faster than that of some reported probes (Table S1†), indicative of a fast response of L for H2S detection.
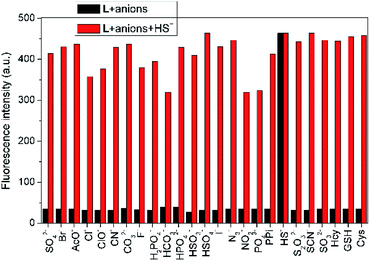 | ||
| Fig. 3 Fluorescence intensity (λem = 650 nm) changes of L (10 μM) in THF–Tris (6/4, v/v) solution upon sequential addition of various anions and biological thiols (100 equiv.) and HS− (100 equiv.). | ||
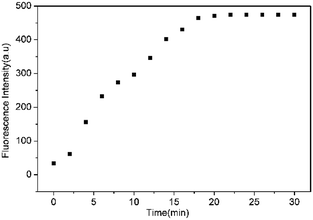 | ||
| Fig. 4 Plot of the emission intensity at 650 nm of L (10 μM) upon addition of HS− (100 equiv.) in THF–Tris (6/4, v/v) solution against with time. | ||
For biological applications, pH dependence of L was examined in THF–Tris (6/4, v/v) solution (Fig. 5). Probe L is pH insensitive in a wide pH range from 2 to 12. However, there is significant fluorescence enhancement with addition of HS− when L is within pH range from 3 to 12, which includes the biologically relevant range of pH 4–8, indicating that L is applicable to detect H2S in the biological system.
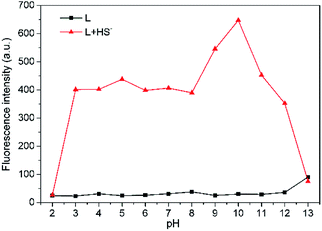 | ||
Fig. 5 Effects of pH on fluorescence intensity at 650 nm of L (10 μM) in THF–Tris (6/4, v/v) solution with ( ) or without ( ) or without ( ) HS−. ) HS−. | ||
The sensing mechanism of L to H2S
Preliminary investigations reveal that the fluorescence spectrum of L + HS− exhibits an almost identical emission pattern as that of free 1 (Fig. S8†), suggesting that HS− can completely cleave the dinitrophenyl ether moiety to release 1.45–47 To further corroborate this reaction process, HRMS of the reaction mixture L + HS− was analyzed (Fig. S9†). The prominent peak observed at m/z = 405.1816 can be ascribed to reaction released compound 1 (Calcd m/z = 405.1815). These results reveal that HS−-triggered thiolysis of dinitrophenyl ether to release fluorescent dye 1 indeed happened. The sensing mechanism of L toward H2S was proposed in Scheme 2.Live cell imaging of L to H2S
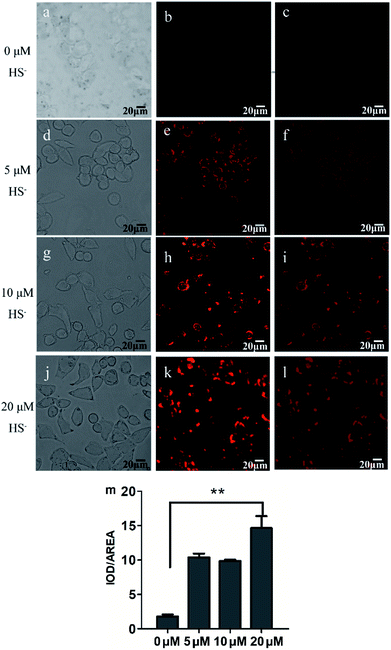
To validate the biological applicability of L, live cell imaging experiments were also performed using MCF-7 cells. Firstly, the cytotoxicity of the probe was evaluated by MTT assay (Fig. S10†). The results showed that the cell viability was estimated to be >88% at 24 h when L was used less than 10 μM. Thus 2 μM of the probe was selected as non-cytotoxic dose for further studies. Subsequently, MCF-7 cells were incubated with L (2 μM) for 30 min at 37 °C and then washed three times with PBS buffer, there was negligible fluorescence signal in the red channel (Fig. 6b). When L-pretreated MCF-7 cells were further incubated with different concentrations of H2S (5, 10, and 20 μM) for 30 min, the brightness of the observed red fluorescence from the red channel gradually increased with increase of H2S concentration (Fig. 6e, h and k). The integrated optical density analysis manifests that the fluorescence intensity was significantly increased after addition 20 μM of HS−, which has prominent statistically significance compared with the control group (P > 0.01, Fig. 6m). These results indicate that L possesses good cell permeability and is capable of imaging HS− in MCF-7 cells.Conclusion
In summary, we reported herein a unique NIR fluorescent turn-on H2S probe based on thiolysis of dinitrophenyl ether. Probe L displays highly selective and sensitive recognition to H2S over various anions and biological thiols with a large Stokes shift in THF/H2O (6/4, v/v, Tris–HCl 10 mM, pH = 7.4) solution. Moreover, probe L is suitable for fluorescence imaging of H2S in living MCF-7 cells. Based on the unique fluorescence feature, the coumarinyl chalcone conjugate (dye 1) will be a promising platform for the development of various NIR fluorescent probes.Conflicts of interest
There are no conflicts to declare.Acknowledgements
This work is supported by the National Key Research and Development Program “Key Techniques of Green Manufacturing of Preservatives and Antioxidants” (2016YFD0400805), the Natural Science Foundation of Liaoning Province (20170540019), the National Natural Science Foundation of China (21304009, 21476029, U1608222) and the Program for Distinguished Professor of Liaoning Province for financial support.Notes and references
- S. Chen, Z.-j. Chen, W. Ren and H.-w. Ai, J. Am. Chem. Soc., 2012, 134, 9589–9592 CrossRef PubMed.
- V. S. Lin, W. Chen, M. Xian and C. J. Chang, Chem. Soc. Rev., 2015, 44, 4596–4618 RSC.
- R. Kaushik, A. Ghosh and D. Amilan Jose, Coord. Chem. Rev., 2017, 347, 141–157 CrossRef.
- C.-t. Yang, L. Chen, S. Xu, J. J. Day, X. Li and M. Xian, Front. Pharmacol., 2017, 8, 664 CrossRef PubMed.
- J. Lee, Y. J. Lee, Y. J. Ahn, S. Choi and G.-J. Lee, Sens. Actuators, B, 2018, 256, 828–834 CrossRef.
- B. Zhao, B. Yang, X. Hu and B. Liu, Spectrochim. Acta, Part A, 2018, 199, 117–122 CrossRef PubMed.
- C. Wu, X. Hu, B. Gu, P. Yin, W. Su, Y. Li, Q. Lu, Y. Zhang and H. Li, Anal. Methods, 2018, 10, 604–610 RSC.
- K.-B. Li, F.-Z. Chen, Q.-H. Yin, S. Zhang, W. Shi and D.-M. Han, Sens. Actuators, B, 2018, 254, 222–226 CrossRef.
- J. R. Hall and M. H. Schoenfisch, Anal. Chem., 2018, 90, 5194–5200 CrossRef PubMed.
- T. Xu, N. Scafa, L.-P. Xu, S. Zhou, K. A. Al-Ghanem, S. Mahboob, B. Fugetsu and X. Zhang, Analyst, 2016, 141, 1185–1195 RSC.
- B. Li, L. Li, K. Wang, C. Wang, L. Zhang, K. Liu and Y. Lin, Anal. Bioanal. Chem., 2017, 409, 1101–1107 CrossRef PubMed.
- V. Vitvitsky and R. Banerjee, in Methods in Enzymology, ed. E. Cadenas and L. Packer, Elsevier Academic Press, 2015, 554, pp. 111–123 Search PubMed.
- F. Yu, X. Han and L. Chen, Chem. Commun., 2014, 50, 12234–12249 RSC.
- W. Chen, A. Pacheco, Y. Takano, J. J. Day, K. Hanaoka and M. Xian, Angew. Chem., Int. Ed., 2016, 55, 9993–9996 CrossRef PubMed.
- C. Zhang, B. Peng, W. Chen, S. Shuang, M. Xian and C. Dong, Dyes Pigm., 2015, 121, 299–304 CrossRef.
- J. Kang, F. Huo and C. Yin, Dyes Pigm., 2017, 146, 287–292 CrossRef.
- B. Peng and M. Xian, Methods in enzymology, ed. E. Cadenas and L. Packer, Elsevier Academic Press, 2015, 554, pp. 47–62 Search PubMed.
- H. A. Henthorn and M. D. Pluth, J. Am. Chem. Soc., 2015, 137, 15330–15336 CrossRef PubMed.
- V. S. Lin, A. R. Lippert and C. J. Chang, Methods in enzymology, ed. E. Cadenas and L. Packer, Elsevier Academic Press, 2015, 554, pp. 63–80 Search PubMed.
- J. Li, C. Yin and F. Huo, RSC Adv., 2015, 5, 2191–2206 RSC.
- Z. Hai, Y. Bao, Q. Miao, X. Yi and G. Liang, Anal. Chem., 2015, 87, 2678–2684 CrossRef PubMed.
- Z. Ye, X. An, B. Song, W. Zhang, Z. Dai and J. Yuan, Dalton Trans., 2014, 43, 13055–13060 RSC.
- A. Zhu, Z. Luo, C. Ding, B. Li, S. Zhou, R. Wang and Y. Tian, Analyst, 2014, 139, 1945–1952 RSC.
- X. Cao, W. Lin, K. Zheng and L. He, Chem. Commun., 2012, 48, 10529–10531 RSC.
- P. Xie, Y. Zhu, X. Huang, G. Gao, F. Guo and G. Yang, Res. Chem. Intermed., 2018, 44, 2823–2837 CrossRef.
- X.-D. Liu, C. Fan, R. Sun, Y.-J. Xu and J.-F. Ge, Anal. Bioanal. Chem., 2014, 406, 7059–7070 CrossRef PubMed.
- S. Chen, H. Li and P. Hou, Sens. Actuators, B, 2018, 256, 1086–1092 CrossRef.
- C. Tang, Q. Zheng, S. Zong, Z. Wang and Y. Cui, Sens. Actuators, B, 2014, 202, 99–104 CrossRef.
- B. Zhu, M. Zhang, L. Wu, Z. Zhao, C. Liu, Z. Wang, Q. Duan, Y. Wang and P. Jia, Sens. Actuators, B, 2018, 257, 436–441 CrossRef.
- B. Zhu, L. Wu, Y. Wang, M. Zhang, Z. Zhao, C. Liu, Z. Wang, Q. Duan and P. Jia, Sens. Actuators, B, 2018, 259, 797–802 CrossRef.
- B. Zhu, L. Wu, M. Zhang, Y. Wang, C. Liu, Z. Wang, Q. Duan and P. Jia, Biosens. Bioelectron., 2018, 107, 218–223 CrossRef PubMed.
- Y. Wang, L. Wu, C. Liu, B. Guo, B. Zhu, Z. Wang, Q. Duan, Z. Ma and X. Zhang, J. Mater. Chem. B, 2017, 5, 3377–3382 RSC.
- D. Maity, A. Raj, P. K. Samanta, D. Karthigeyan, T. K. Kundu, S. K. Pati and T. Govindaraju, RSC Adv., 2014, 4, 11147–11151 RSC.
- Y. Jin, X. Tian, L. Jin, Y. Cui, T. Liu, Z. Yu, X. Huo, J. Cui, C. Sun, C. Wang, J. Ning, B. Zhang, L. Feng and X. Ma, Anal. Chem., 2018, 90, 3276–3283 CrossRef PubMed.
- T. Liu, J. Ning, B. Wang, B. Dong, S. Li, X. Tian, Z. Yu, Y. Peng, C. Wang, X. Zhao, X. Huo, C. Sun, J. Cui, L. Feng and X. Ma, Anal. Chem., 2018, 90, 3965–3973 CrossRef PubMed.
- A. R. Jagtap, V. S. Satam, R. N. Rajule and V. R. Kanetkar, Dyes Pigm., 2011, 91, 20–25 CrossRef.
- Z. Huang, S. Ding, D. Yu, F. Huang and G. Feng, Chem. Commun., 2014, 50, 9185–9187 RSC.
- S. Chen, C. Ma, M.-S. Yuan, W. Wang, D.-E. Wang, S.-W. Chen and J. Wang, RSC Adv., 2016, 6, 85529–85537 RSC.
- D. G. Khandare, M. Banerjee, R. Gupta, N. Kumar, A. Ganguly, D. Singh and A. Chatterjee, RSC Adv., 2016, 6, 52790–52797 RSC.
- S. Feng, X. Li, Q. Ma, B. Liang and Z. Ma, Anal. Methods, 2016, 8, 6832–6839 RSC.
- L. Tang, Z. Zheng, K. Zhong and Y. Bian, Tetrahedron Lett., 2016, 57, 1361–1364 CrossRef.
- A. R. Jagtap, V. S. Satam, R. N. Rajule and V. R. Kanetkar, Dyes Pigm., 2009, 82, 84–89 CrossRef.
- Y. Tang, D. Lee, J. Wang, G. Li, J. Yu, W. Lin and J. Yoon, Chem. Soc. Rev., 2015, 44, 5003–5015 RSC.
- S. Zhang, J. Fan, Z. Li, N. Hao, J. Cao, T. Wu, J. Wang and X. Peng, J. Mater. Chem. B, 2014, 2, 2688–2693 RSC.
- T. Liu, Z. Xu, D. R. Spring and J. Cui, Org. Lett., 2013, 15, 2310–2313 CrossRef PubMed.
- A. K. Das, S. Goswami, C. K. Quah and H.-K. Fun, New J. Chem., 2015, 39, 5669–5675 RSC.
- S. El Sayed, C. d. l. Torre, L. E. Santos-Figueroa, E. Perez-Paya, R. Martinez-Manez, F. Sancenon, A. M. Costero, M. Parra and S. Gil, RSC Adv., 2013, 3, 25690–25693 RSC.
Footnote |
| † Electronic supplementary information (ESI) available. See DOI: 10.1039/c8ra03457e |
| This journal is © The Royal Society of Chemistry 2018 |

