 Open Access Article
Creative Commons Attribution 3.0 Unported Licence
A study on the removal of propyl, butyl, and benzyl parabens via newly synthesised ionic liquid loaded magnetically confined polymeric mesoporous adsorbent†
Masrudin Md Yusoffa,
Noorfatimah Yahayaa,
Noorashikin Md Salehb and
Muggundha Raoov *cd
*cd
aIntegrative Medicine Cluster, Advanced Medical and Dental Institute, Universiti Sains Malaysia, Bertam, 13200 Kepala Batas, Penang, Malaysia
bResearch Centre For Sustainable Process Technology, Chemical Engineering Programme, Faculty of Engineering and Built Environment, Universiti Kebangsaan Malaysia, 43600 UKM Bangi, Selangor, Malaysia
cUniversity of Malaya Centre for Ionic Liquids, Department of Chemistry, Faculty of Science, Universiti Malaya, Kuala Lumpur 50603, Malaysia. E-mail: muggundha@um.edu.my
dDepartment of Chemistry, Faculty of Science, Universiti Malaya, Kuala Lumpur 50603, Malaysia
First published on 18th July 2018
Abstract
This study investigated the effectiveness of ionic liquids (ILs) loaded onto the surface of a polymeric adsorbent (βCD-TDI) grafted with modified magnetic nanoparticles (MNPs) via an analysis of water treatment, which resulted in high removal of selected endocrine-disrupting chemicals (parabens). The syntheses of MNPs, MNP-βCD-TDI, and IL-MNP-βCD-TDI were characterised and compared using Fourier transform infrared (FT-IR) spectroscopy, carbon–hydrogen–nitrogen (CHN) analysis, vibrating sample magnetometry (VSM), scanning electron microscopy (SEM), transmission electron microscopy (TEM), the Brunauer–Emmett–Teller (BET) method, thermogravimetric analysis (TGA), and X-ray diffraction (XRD). The results of SEM and TEM indicated that the pore size distribution exhibited mesoporous characteristics with a small surface area (BET analysis: 42.95 m2 g−1). Furthermore, a preliminary sorption experiment demonstrated the ability of IL-MNP-βCD-TDI to enhance not only the sorption capacity, but also the removal of propyl paraben (PP), butyl paraben (BP), and benzyl paraben (ArP). The adsorption process appeared to be pH-dependent, and hence the optimum pH of 6 was selected for a subsequent batch adsorption study of all the studied parabens with an equilibrium time of 80 min. Next, in an attempt to investigate the interactions that occur between the adsorbent and the adsorbates, adsorption kinetics and isotherm studies were performed. All the studied parabens were found to best fit pseudo-second-order kinetics and the Freundlich isotherm with R2 > 0.98 at room temperature (298 K). The interaction of the host–guest inclusion complex and the π–π interaction between βCD and a selected paraben compound (ArP) were identified by performing 1H nuclear magnetic resonance (NMR), together with ultraviolet-visible (UV-vis) spectroscopic analysis. Finally, the adsorption efficiency of the developed material was practically tested on tap water, drain water, and industrial wastewater, which revealed a significant removal of parabens of up to 60–90% in comparison with a prior analysis.
1. Introduction
Magnetic nanoparticles (MNPs) have appeared to have great potential as sorbents in a number of applications studied by researchers. Besides, they have the ability to amalgamate easily with any pollutant in huge amounts.1 In fact, the term MNPs refers to a class of nanoparticle agglomerates, which resemble particles that are small in size and can be manipulated using an external magnetic field.2 In addition, MNPs have been widely employed by researchers owing to their nanoscale sizes, which are typically around 10–20 nm and correspond to those of mesoporous types of materials. Nanomaterials or nanoparticles are materials with two or more dimensions and unique size dependence in terms of physical and chemical properties.3 Therefore, in order to develop a new promising adsorbent, MNPs alone are insufficient to maximize the adsorption capacity for targeted analytes and require several modifications of the surface of MNPs with other materials.4–12 This may enable exceptional outcomes, especially when dealing with small sample volumes, owing to the large surface areas.13Furthermore, the growing interest in the field of supramolecular chemistry has allowed this study to be carried out. As such, this study represents an experimental study in which MNPs were coated with cyclodextrin (CD) as an effective adsorbent for the removal of parabens. CDs, which are also known as cycloamyloses, are a family of compounds that are composed of sugars bound together in a ring (cyclic oligosaccharides). The widely used applications of CDs in pharmaceuticals, food, drug delivery, and chemicals are highly desirable owing to the unique characteristics of their structure. CDs are produced by cyclomaltodextrin glucanotransferase, whereby three common cyclodextrins are available with 6, 7 or 8 D-glucopyranosyl residues, namely, α-CD (6 glucose units), β-CD (7 glucose units), and γ-CD (8 glucose units), respectively, which are linked in a ring by α-1,4-glycosidic linkages.14 As such, β-cyclodextrin (βCD) is a natural starch derived from molecules that is a torus-shaped cyclic oligosaccharide with an internal hydrophobic cavity.15
βCD was selected for the experimental work in this study because it is low in cost and has the ability to form solid inclusion complexes16,17 via various kinds of interactions18 with different types of guest compounds. Furthermore, βCD can alter its properties via polymerization upon cross-linking, which refers to the process of chemically joining two or more molecules by a covalent bond and transforming the molecule into a water-insoluble molecule.19 βCD can also be cross-linked by a reaction between hydroxyl groups on the chain and a coupling agent to form a water-insoluble network.20,21 Owing to the properties of CD, which contains many hydroxyl groups, the best cross-linking agent is a diisocyanate linker such as toluene 2,4-diisocyanate (TDI)22–26 because of its reactivity towards hydroxyl groups. Hence, TDI was selected to be used in this study in order to transform the βCD molecule into a three-dimensional network polymer (βCD-TDI).
Furthermore, CD polymers have also emerged as an area of interest among academicians, especially in combination with MNPs27–35 such as those with the formula Fe3O4.36 MNP surface modification appears to be a frequently used technique for retaining their internal superior magnetic properties upon combination with polymeric adsorbents. Therefore, the aggregation of MNPs and the transformation of magnetite (Fe3O4) into maghemite (γ-Fe2O3) are attributable to the reaction of Fe(II) cations with oxygen, which can be prevented.29 The unique characteristics of combinations of these types of adsorbents are the inner MNP itself, which possesses the ability to sense and respond to an external magnetic field, whereas the outer CD polymer functions as an inclusion site and a specific container for the adsorption of targeted analytes. Thus, the modification of MNPs with a βCD polymer seems to provide an effective adsorbent for the removal of organic compounds.
In addition, in order to increase the selectivity for targeted analytes, the introduction of an ionic liquid (IL) onto a polymer surface has sparked interest in a number of studies. In conjunction with the properties of βCD, a number of methods have been developed that promote the incorporation of βCD with an IL, mainly because the presence of an IL has been proven to enable more chemical interactions between targeted analytes.37–42 The term IL refers to a type of salt in the form of a liquid below 100 °C or even at room or ambient temperature, of which the latter are also known as room-temperature ionic liquids (RTILs).43 RTILs have begun to gain wide recognition as novel solvents within the field of chemistry owing to the unique non-volatility, non-flammability, low viscosity, and electrochemical stability of ILs, which are beneficial in various types of applications, especially in supramolecular materials.44,45 Therefore, a new approach has been developed in this study by loading an IL onto the surface of MNP-βCD-TDI so as to create a new magnetically confined polymeric mesoporous adsorbent loaded with an ionic liquid (IL-MNP-βCD-TDI).
The newly developed material can be used to remove endocrine-disrupting chemicals (propyl, butyl, and benzyl parabens) from the environment, especially emerging pollutants46 that may cause serious diseases such as cancer.47 Contamination of environmental bodies of water has always been associated with uncontrolled disposal of wastewater from industries, which has an adverse impact upon the health of organisms.48–50 Therefore, adsorption techniques that integrate such a novel approach can be evaluated via an adsorption process. This study has been divided into three principal parts, namely, (1) synthesis of adsorbents, (2) characterisation of adsorbents, and (3) batch removal experiments. The adsorption process was optimised in order to ensure exceptional adsorption of the targeted analytes, as well as to study the mechanism of the interaction between the adsorbent and the adsorbates. Finally, the applicability of the adsorbent was confirmed by treating real environmental water samples.
2. Experimental
2.1 Materials and chemicals
Standard samples of three paraben compounds, namely, propyl paraben (PP), butyl paraben (BP), and benzyl paraben (ArP), 1-butyl-3-methylimidazolium chloride (BMIM-Cl), toluene-2,4-diisocyanate (TDI), and anhydrous dimethyl sulfoxide-d6 (DMSO) were purchased from Sigma-Aldrich (St. Louis, MO, USA). Iron(II) chloride tetrahydrate (FeCl2·4H2O) and iron(III) chloride hexahydrate (FeCl3·6H2O) were purchased from R&M Chemicals (Essex, UK), whereas β-cyclodextrin (βCD, 99%) was commercially available and was purchased from Acros (Hungary). Moreover, acetonitrile (ACN), methanol (MeOH) (HPLC grade, 99.7%), acetone (technical grade), and ammonia solution (25%) were supplied by Friendemann Schmidt (Parkwood, Australia), whereas anhydrous N,N-dimethylformamide (DMF) was purchased from Merck (Kenilworth, NJ, USA). Analytical-grade absolute ethanol (denatured, 99.7%) was purchased from J. Kollin Chemicals (Midlothian, UK), whereas deionised (DI) water (18.2 MΩ cm) was provided by a Sartorius Milli-Q system (Aubagne, France).2.2 Part 1: Synthesis of adsorbents
The adsorbents were prepared in accordance with a procedure detailed in a prior work.51 Co-precipitation was performed under a non-oxidising nitrogen atmosphere in order to generate bare MNPs with a molar ratio of 1![[thin space (1/6-em)]](https://www.rsc.org/images/entities/char_2009.gif) :
:![[thin space (1/6-em)]](https://www.rsc.org/images/entities/char_2009.gif) 2. Next, FeCl2·4H2O (0.86 g) and FeCl3·6H2O (2.34 g) were dissolved in 40 mL of deionised water and stirred for 30 min at 1200 rpm. The solution temperature was increased to 90 °C and 5 mL of NH4OH (25%) was added directly, which was then stirred for an hour. In order to remove any unreacted chemicals, the nanoparticles that formed were washed with deionised water five or six times. The resulting product was isolated using an external magnet and dried in a vacuum oven at 40 °C.
2. Next, FeCl2·4H2O (0.86 g) and FeCl3·6H2O (2.34 g) were dissolved in 40 mL of deionised water and stirred for 30 min at 1200 rpm. The solution temperature was increased to 90 °C and 5 mL of NH4OH (25%) was added directly, which was then stirred for an hour. In order to remove any unreacted chemicals, the nanoparticles that formed were washed with deionised water five or six times. The resulting product was isolated using an external magnet and dried in a vacuum oven at 40 °C.
Next, a CD polymer was synthesised in accordance with a literature method.37,39 βCD (2 g, 1.76 mmol) was dissolved in 50 mL of anhydrous DMF at room temperature. In an inert atmosphere, the TDI linker (2.54 mL, 17.6 mmol) was added and the reaction mixture was stirred for 24 h at 70 °C. The addition of excess acetone caused the precipitation of βCD-TDI. In order to remove residual DMF from the polymer, the precipitate that formed was stirred and allowed to settle in acetone for 10 min. Then, the reaction mixture was filtered and washed with acetone and deionised water several times to remove unreacted cross-linker, and was later dried overnight in a vacuum.
After the drying process, MNP-βCD-TDI was synthesised via a one-step co-precipitation method34,52 by dissolving FeCl2·4H2O (0.86 g, 4.33 mmol), FeCl3·6H2O (2.34 g, 8.66 mmol), and βCD-TDI (1.5 g, 1.30 mmol) in 40 mL of deionised water in a molar ratio of 1![[thin space (1/6-em)]](https://www.rsc.org/images/entities/char_2009.gif) :
:![[thin space (1/6-em)]](https://www.rsc.org/images/entities/char_2009.gif) 2
2![[thin space (1/6-em)]](https://www.rsc.org/images/entities/char_2009.gif) :
:![[thin space (1/6-em)]](https://www.rsc.org/images/entities/char_2009.gif) 0.3, and the reaction mixture was vigorously stirred at a speed of 1200 rpm at 90 °C for 30 min. Next, in order to generate conglomerated nanoparticles, 5 mL of NH4OH (25%) was added after the solution was heated to 90 °C, and the reaction mixture was continuously stirred for 1 h at 90 °C in an inert atmosphere. In order to remove any unreacted chemicals, the nanoparticles that formed were washed with deionised water five or six times. The resulting product was isolated using an external magnet and was later dried in a vacuum oven at 40 °C.
0.3, and the reaction mixture was vigorously stirred at a speed of 1200 rpm at 90 °C for 30 min. Next, in order to generate conglomerated nanoparticles, 5 mL of NH4OH (25%) was added after the solution was heated to 90 °C, and the reaction mixture was continuously stirred for 1 h at 90 °C in an inert atmosphere. In order to remove any unreacted chemicals, the nanoparticles that formed were washed with deionised water five or six times. The resulting product was isolated using an external magnet and was later dried in a vacuum oven at 40 °C.
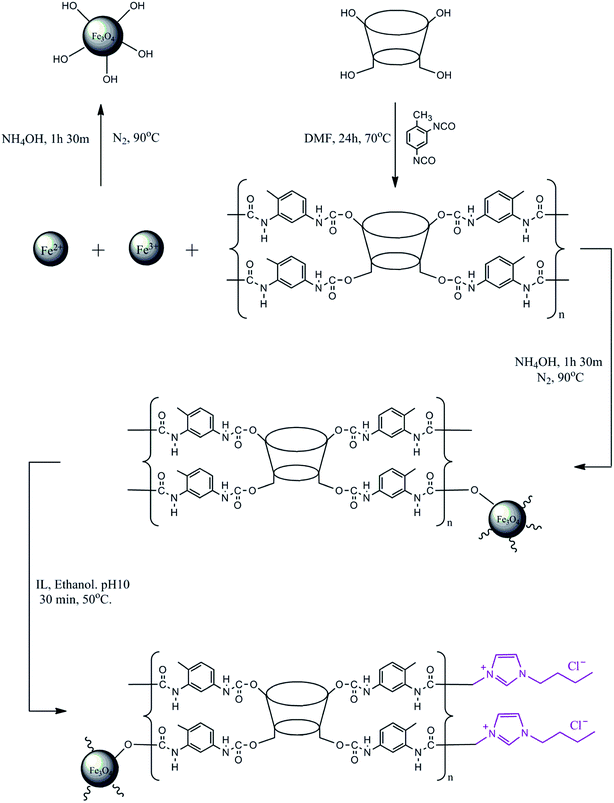
The modification of the surface of MNP-βCD-TDI using an IL was adopted from prior works.32,53,54 BMIM-Cl (4.0 g L−1) was diluted using 25 mL of absolute ethanol (99.7%) with the addition of NaOH (0.01 mol L−1) while the pH of the solution was adjusted to 10.0. After that, MNP-βCD-TDI (0.5 g) was added to the solution and was stirred at 50 °C for 30 min at 280 rpm to allow all the nanoparticles to be suspended in the solution and adhere to the surface of MNP-βCD-TDI in the presence of the IL. The nanoparticles that formed were then washed with 50 mL of ACN and deionised water three times. Finally, the resulting product was isolated using an external magnet and was later dried in a vacuum oven at 40 °C. A complete illustration of the synthesised materials is given in Scheme 1.
2.3 Part 2: Characterisation of adsorbents
Fourier transform infrared spectroscopy (FT-IR; Thermo Nicolet, Madison, WI, USA) was carried out in the wavenumber range between 4000 cm−1 and 400 cm−1. Moreover, carbon–hydrogen–nitrogen analysis (PerkinElmer 2400 Series II CHN analyser, Massachusetts, USA) was performed to determine the amounts of C, H, and N present. Next, the magnetisations of the bare and both modified MNPs were measured using a vibrating sample magnetometer (Lake Shore 7404 series, McCorkle Boulevard, Westerville, OH, USA). The morphology and particle size, on the other hand, were determined using a scanning electron microscope (Quanta FEG650, Oxford Instruments, Hillsboro, USA) and a transmission electron microscope (FEI CM12, Hillsboro, USA). After that, a surface area analyser was employed to determine the surface area and porous properties of the materials via nitrogen adsorption–desorption analysis at 77 K using the Brunauer–Emmett–Teller (BET) method (Quantachrome, Boynton Beach, FL, USA). The thermal stability of the synthesised materials was later investigated by performing thermogravimetric analysis (TGA; PerkinElmer TGA-STA 1500, Massachusetts, USA) at a heating rate of 10 °C min−1 between 30 and 900 °C under a nitrogen atmosphere. X-ray diffraction patterns were recorded using an Empyrean X-ray diffractometer (PANalytical, Almelo, Netherlands) from 2θ = 10° to 90° with Cu Kα radiation (λ = 1.5418 Å) at a scan rate of 0.02° s−1. Finally, nuclear magnetic resonance (NMR, Bruker Avance III 700 MHz, Rheinstetten, Ettlingen, Germany) was employed to characterise the formation of the inclusion complex of βCD with ArP.2.4 Part 3: Batch removal experiments
 | (1) |
The amount of the analytes adsorbed per unit mass of the adsorbent (qe) was calculated as follows:
 | (2) |
3. Results and discussion
3.1 Characterisation of materials
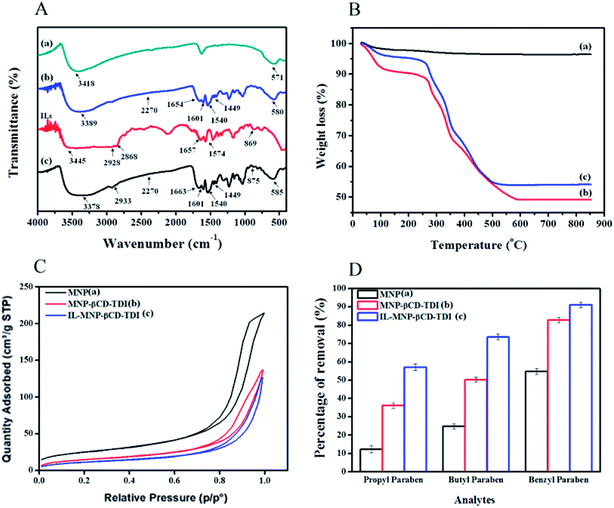
The results of the FT-IR and TGA analyses and the BET hysteresis loops in this study are illustrated in Fig. 1, whereas Table 1 summarises the results of the (a) FT-IR, (b) TGA, (c) BET and (d) CHN analyses in detail. The FT-IR spectra (Fig. 1A) of MNPs, MNP-βCD-TDI, IL (BMIM-Cl), and IL-MNP-βCD-TDI were recorded using the KBr method. As a result, the presence of magnetic properties in the MNPs corresponding to curves (a), (b), and (c) is proven by the appearance of the Fe–O peak, which represents the tetrahedral form of pure MNPs, at about 570–590 cm−1. Furthermore, the absence of a peak at 2270 cm−1 (corresponding to the isocyanate group) in curves (b) and (c) indicates the success of the polymerisation process, together with the presence of a peak due to carbamate (NHCOO) linkages at 1654 cm−1.56 In the case of Fe3O4, the broad absorption peak at around 3400 cm−1 signifies the presence of surface hydroxyl groups (O–H stretching), whereas the broad –OH stretching band of MNP-βCD-TDI at about 3300–3400 cm−1 is attributable to multiple –OH functional groups and appears to decrease owing to cross-linking with TDI. Moreover, as for the FT-IR spectrum of IL-MNP-βCD-TDI in curve (d), the peak broadening observed at 2900–3400 cm−1 indicates the successful loading of the IL onto MNP-βCD-TDI.| Characteristic | MNP | MNP-βCD-TDI | IL-MNP-βCD-TDI |
|---|---|---|---|
| (a) FT-IR spectra (cm−1) | |||
| N–H and O–H stretching | 3418 | 3389 | 3378 (imidazole) |
| Fe–O stretching vibration | 571 | 580 | 585 |
Absence of N![[double bond, length as m-dash]](https://www.rsc.org/images/entities/char_e001.gif) C C![[double bond, length as m-dash]](https://www.rsc.org/images/entities/char_e001.gif) O group O group |
— | 2270 | 2270 |
| NHCO, carbamate linkages | — | 1654, 1540 | 1663, 1540 |
| Aromatic group in TDI | — | 1601, 1449 | 1601, 1449 |
C![[double bond, length as m-dash]](https://www.rsc.org/images/entities/char_e001.gif) C and C C and C![[double bond, length as m-dash]](https://www.rsc.org/images/entities/char_e001.gif) N stretching N stretching |
— | — | 1663, 1601 |
| C–N stretching vibration | — | 869 | 875 |
![[thin space (1/6-em)]](https://www.rsc.org/images/entities/char_2009.gif) |
|||
| (b) TGA analysis | |||
| Water loss/–OH groups | 30–160 °C (3%) | — | — |
| Water loss/–OH groups | — | 30–110 °C (8%) | — |
| Carbamate linkages and βCD | — | 250–350 °C (21%) | — |
| βCD | — | 350–600 °C (19%) | — |
| Water loss/–OH groups | — | — | 30–110 °C (8%) |
| Carbamate linkages and βCD | — | — | 250–350 °C (21%) |
| βCD/combustion of IL | — | — | 350–500 °C (19%) |
![[thin space (1/6-em)]](https://www.rsc.org/images/entities/char_2009.gif) |
|||
| (c) BET analysis | |||
| Surface area (m2 g−1) | 90.14 m2 g−1 | 54.72 m2 g−1 | 42.95 m2 g−1 |
| Pore volume (cm3 g−1) | 0.33 cm3 g−1 | 0.21 cm3 g−1 | 0.19 cm3 g−1 |
| Pore size (nm) | 14.72 nm (mesopore) | 15.49 nm (mesopore) | 18.27 nm (mesopore) |
| N2 adsorption/desorption isotherm | Type IV isotherm with H3-type hysteresis loop | Type IV isotherm with H3-type hysteresis loop | Type IV isotherm with H3-type hysteresis loop |
![[thin space (1/6-em)]](https://www.rsc.org/images/entities/char_2009.gif) |
|||
| (d) CHN analysis (%) | |||
| Carbon (C) | 0.23 | 18.96 | 47.75 |
| Hydrogen (H) | 0.23 | 1.92 | 5.28 |
| Nitrogen (N) | 0.05 | 3.79 | 9.32 |
VSM and XRD analyses were reported in a prior work51 in which the magnetic behaviour of the synthesised adsorbent was determined via VSM analysis. In order to separate the MNPs from the solution, a magnetisation (Ms) of 16.3 emu g−1 seemed scientifically adequate because a higher Ms value facilitates the separation of MNPs from the solution.57 The maximum Ms value of the MNPs in this study was 60.6 emu g−1 (a), but in the presence of the polymeric materials coated on the surface of the MNPs the value of Ms decreased to 46.8 emu g−1 (b).4,58 Upon loading with the IL, the value of Ms appeared to be lower than that of the first coating, namely, 25.0 emu g−1 (c). This confirms the successful coating of the IL onto the surface of MNP-βCD-TDI.
The crystal structures of all the synthesised adsorbents were successfully analysed via XRD. The characteristic diffraction peaks of the MNPs appeared to correspond to those of standard Fe3O4 crystals in accordance with JCPDS card number 19-0629. Diffraction peaks of the MNPs were observed at 2θ = 30.44°, 35.74°, 43.54°, 53.81°, 57.50°, and 63.04°, which corresponded to the (220), (311), (400), (422), (511), and (440) cubic spinel planes of Fe3O4, respectively. The characteristic peaks of MNP-βCD-TDI and IL-MNP-βCD-TDI, however, did not differ from the peaks of the MNPs, which thus confirmed that alteration of the surface of the MNPs did not affect their crystal phase. Furthermore, in terms of intensity, the decrease for MNP-βCD-TDI and the increase for IL-MNP-βCD-TDI are attributable to the presence of an amorphous layer of the βCD polymer, as well as the successful coating of the IL onto the surface of MNP-βCD-TDI.58
The thermal properties (Fig. 1B) of the MNPs were determined from the TGA curves, which indicated a three-stage degradation pattern. Basically, the first step of the degradation process (MNPs) corresponds to the loss of water at lower temperatures (30–160 °C). Next, the second stage of degradation involved both MNP-βCD-TDI and IL-MNP-βCD-TDI owing to the presence of carbamate linkages and βCD (250–350 °C), with a weight loss of 21%. The low weight loss shows that these adsorbents were thermally stable at high temperatures and the transformation of βCD into a polymeric form had increased its stability.38,59 The last stage of the degradation process occurred in the range of 350–600 °C and was perhaps due to the thermal decomposition of CD, which thus confirmed the grafting of the βCD polymer onto the surface of MNPs, with a weight loss of 19% for both materials. Apart from that, the weight loss (350–500 °C) for IL-MNP-βCD-TDI appears to be a result of thermal carbonisation and decomposition of organic groups, such as combustion of the IL.58 The trends in degradation and weight loss are detailed in Table 1(b).
The results of the SEM and TEM analyses are illustrated in Fig. S1 (ESI S1†). The SEM analysis was performed to determine the surface morphologies of the adsorbents. The micrograph that was obtained displayed several similarities in the morphologies because the adsorbents were generally synthesised from the same base, which was magnetic. Fig. S1(a)† shows the surface morphology of the synthesised MNPs, whereas Fig. S1(b)† shows the chemical coating of the βCD polymer onto the surface of MNPs. The polymerization process with TDI led to a morphology that resembled a conglomerate of beads with small cavities surrounding the MNPs. Furthermore, upon the loading of the IL, as shown in Fig. S1(c),† the presence of the IL is clearly indicated on the surface of MNP-βCD-TDI (whitish appearance).
TEM was performed for two primary purposes: (1) to exemplify the core–shell structure of the adsorbents and (2) to confirm the spherical morphology of the agglomerates, as illustrated in Fig. S1(a′)–(c′).† The average diameter of the bare MNPs was approximately 14 nm but increased slightly to 16 nm after coating with the βCD polymer. Subsequently, the presence of the IL on the surface of MNP-βCD-TDI resulted in well-dispersed absorbance and an increase in the particle diameter to 18 nm. Initially, the TEM images were analysed with ImageJ software in order to determine the average diameter from the particle distribution of the adsorbents. This step was carried out prior to the BET analysis so as to ascertain the accuracy of the analysis classification (microporous, mesoporous or macroporous). On the basis of the tabulated histogram data, the average diameter of the particles appeared to be between 2 nm and 6 nm, which corresponded to the mesoporous category (2–50 nm).
Next, Table 1(c) presents the findings obtained from the BET analyses that were performed for all the adsorbents. The surface area of the bare MNPs was 90.14 m2 g−1 and decreased to 54.72 m2 g−1 after they were coated with the polymeric adsorbent. Upon the introduction of the IL, the surface area of the adsorbent decreased to 42.95 m2 g−1, which appeared to be an effect of the coating of the MNPs. In addition, the Barrett–Joyner–Halenda (BJH) model was employed in this study to calculate the pore size distribution of the adsorbents. The average pore sizes of these adsorbents were 14.72 nm for MNPs, 15.49 nm for MNP-βCD-TDI, and up to 18.27 nm upon the loading of the IL, which hence indicated the mesoporous type of adsorbent owing to a decrease in pore volume from 0.33 cm3 g−1 to 0.21 cm3 g−1 and 0.19 cm3 g−1, respectively. Such findings, nevertheless, appear to contradict those of a prior study, in which MNPs coated with βCD and functionalized with an IL for a sensor application displayed increases in both surface area and pore volume.52 Such a contrast may be attributed to the unique properties of CD and the IL. Furthermore, the N2 adsorption/desorption isotherms showed that all the adsorbents exhibited typical type IV isotherms, which correspond to the mesoporous type of material, with H3-type hysteresis loops, which relate to non-rigid aggregates of plate-like particles, as portrayed in Fig. 1C.58
Next, the results obtained from the CHN analyses are tabulated in Table 1(d). The elemental compositions of the adsorbents were determined by a CHN analyser. As a result, the CHN findings confirmed the successful coating of the βCD polymer on the surface of the MNPs, with increases in the following contents: 18.96% of C, 1.92% of H, and 3.79% of N from the low amounts in the MNPs, which were 0.23% of both C and H and 0.05% of N. As indicated in the table, the nitrogen content rose to 9.32% owing to the presence of the IL.60 This demonstrates that the loading of the IL onto the surface of MNP-βCD-TDI was indeed a success, together with increases in elemental percentages to 47.75% of C and 5.28% of H.
3.2 Optimisation of batch experiments
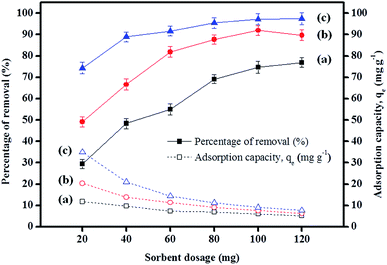
After comparing the types of adsorbents, IL-MNP-βCD-TDI was selected as the adsorbent for this study. As evidenced in Fig. 2, the adsorption efficiency displayed by IL-MNP-βCD-TDI increased but appeared to exhibit slightly similar trends for all the studied parabens (PP, BP, and ArP) from a pH of 3 to a pH of 6. The optimum pH refers to a pH of 6, and a decline in adsorption efficiency was observed from a pH of 7 to a pH of 10. In acidic conditions (pH < 6), the amount of protons was maximized owing to protonation of the remaining hydroxyl groups on the surface of MNPs, which may saturate the sorbent sites and thus generate a more cationic surface of IL-MNP-βCD-TDI.4,58 In addition, the parabens were also in their protonated form as they only participate in π–π interaction and electrostatic repulsion. At a pH of 6, nonetheless, the paraben compounds began to adopt their neutral forms, which hence facilitated their participation in hydrophobic interactions with the βCD polymer cavity, whereas the presence of imidazole rings in the IL suggests π–π interactions and hydrogen bonding. In basic conditions (pH > 6), deprotonation of residual hydroxyl groups on MNPs could make the surface of the adsorbent anionic and hence decrease the hydrophobicity of the adsorbent. Because the pKa values of the parabens are approximately 8.3, they also exist in the anionic form, which thus results in fewer interactions between the targeted analyte and the adsorbent. In brief, as the formation of an inclusion complex is deemed to be impossible with protonated and deprotonated parabens, a pH of 6 appears to be favourable because the parabens are neutral at this pH and can form inclusion complexes with the βCD cavity.
3.3 Adsorption study
The adsorption process refers to the adhesion of elements to a surface that involves physisorption, chemisorption or electrostatic attraction.64 This method enhances water quality by removing toxic organic pollutants or chemical species, including organic compounds and trace metals.37,65
 | (3) |
 | (4) |
| Kinetic model | Parameter | IL-MNP-βCD-TDI | ||
|---|---|---|---|---|
| PP | BP | ArP | ||
| Pseudo-first-order | qe,exp (mg g−1) | 3.0990 | 3.8721 | 4.6271 |
| qe,cal (mg g−1) | 0.6295 | 0.2883 | 0.0812 | |
| k1 (min−1) | 0.0343 | 0.0205 | 0.0177 | |
| Δq (%) | 39.843 | 53.436 | 40.108 | |
| Relative error (%) | 79.687 | 92.554 | 98.245 | |
| R2 | 0.8510 | 0.8734 | 0.8609 | |
| Pseudo-second-order | qe,cal (mg g−1) | 3.2331 | 3.8986 | 4.6104 |
| k2 (min−1) | 0.0852 | 0.2687 | 0.2860 | |
| H | 0.8906 | 4.0840 | 6.0792 | |
| Δq (%) | 1.6355 | 0.2587 | 0.1364 | |
| Relative error (%) | 4.3272 | 0.6844 | 0.3609 | |
| R2 | 0.9984 | 0.9990 | 0.9997 | |
| Elovich | qe,cal (mg g−1) | 3.0836 | 3.8214 | 4.6245 |
| A | 2.4621 × 10³ | 1.0289 × 10⁵ | 3.5744 × 10¹¹ | |
| β | 4.4366 | 4.5579 | 7.1225 | |
| Δq (%) | 0.2222 | 0.5856 | 0.0281 | |
| Relative error (%) | 0.4969 | 1.3094 | 0.0562 | |
| R2 | 0.9969 | 0.9197 | 0.9993 | |
| Intraparticle diffusion | qe,cal (mg g−1) | 3.0451 | 3.8285 | 4.5537 |
| K (mg g−1 min−1) | 0.0832 | 0.0747 | 0.0376 | |
| C (mg g−1) | 2.3009 | 3.1604 | 4.2174 | |
| Δq (%) | 0.6574 | 0.4597 | 0.5996 | |
| Relative error (%) | 1.7393 | 1.1260 | 1.5863 | |
| R2 | 0.9564 | 0.7364 | 0.8201 | |
(a) Pseudo-first-order model. The Lagergren pseudo-first-order equation has been widely applied in the adsorption of various solutes from aqueous solutions onto solid adsorbents.71 Lagergren developed a kinetic equation that describes the adsorption of a liquid–solid system on the basis of the assumption that the rate of solute uptake over time is proportional to the variation in the saturation concentration and the amount of solid adsorbed over time.72 The equation is as follows:
 | (5) |
 | (6) |
ln(qe − qt) = log![[thin space (1/6-em)]](https://www.rsc.org/images/entities/char_2009.gif) qe − k1t qe − k1t
| (7) |
If the experimental data fit this kinetic model, a straight line can be obtained on a graph of ln(qe − qt) versus t, and thus adsorption is followed by diffusion through a boundary.66 Besides, if the data fail to fit this equation, diffusion is excluded as the rate-determining step. The linear plot has k1 as the slope, whereas log![[thin space (1/6-em)]](https://www.rsc.org/images/entities/char_2009.gif) qe is the intercept.
qe is the intercept.
(b) Pseudo-second-order model. The behaviour of a wide range of adsorption processes follows the pseudo-second-order model, which has chemisorption as the rate-determining step and adheres to the assumption that the adsorption mechanism relies on both the adsorbate and the adsorbent.66,68 According to Ho and McKay, if adsorption is in accordance with the pseudo-second-order model, the following equation gives the rate law:73
 | (8) |
Upon integrating eqn (8) with qt = 0 at t = 0, k2 (g mg−1 min−1) is the equilibrium rate constant of the pseudo-second-order model, whereby the equation that is obtained can be rearranged to give:
 | (9) |
By integrating eqn (9) for values of t = t and qt = qt, the integrated rate law is as follows:
 | (10) |
Moreover, eqn (10) can be rearranged into the following linear form:
 | (11) |
 versus t can be generated in which the values of qe, k2, and t1/2 are embedded; hence, a linear plot of
  versus
  gives the slope and intercept of the pseudo-second-order model.
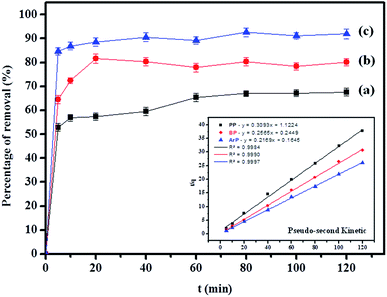
Table 2 shows that the pseudo-second-order model appears to fit the adsorption mechanism for all the paraben compounds more closely in comparison with the other studied models, as shown by its excellent coefficient of determination, R2 > 0.998 (Fig. 3), and lower Δq values of 1.6355% (PP), 0.2587% (BP), and 0.1364% (ArP), with relative errors of 4.3272% (PP), 0.6844% (BP), and 0.3609% (ArP), respectively. In fact, these results can be confirmed by the closeness of the qcal and qexp values in the pseudo-second-order model. In particular, the adsorption process undertaken in this study for all the parabens was controlled by chemisorption,74 which involves valence sharing or the exchange of electrons37,75 and is based on the assumption that the adsorption mechanism depends on both the adsorbate and the adsorbent.66,68 Besides, the pseudo-second-order adsorption rate constants of the paraben compounds (k2) and the initial sorption rates (h) on IL-MNP-βCD-TDI are in the order of ArP > BP > PP.
(c) Elovich model. In an attempt to prove that the adsorption process was indeed based on chemisorption, the Elovich model was incorporated in this study. The Elovich equation is expressed as follows:69
 | (12) |
![[thin space (1/6-em)]](https://www.rsc.org/images/entities/char_2009.gif) t has
t has  and
and  as the slope and intercept, respectively.
The exceptional coefficient of determination, R2 > 0.9, seemed to fit a linear Elovich plot well. Moreover, in determining the occurrence of chemisorption, the Δq values and relative errors appeared to be lower, which indicated a difference in values between qcal and qexp. The values of β, on the other hand, signify the number of sites available for the adsorption process. Furthermore, α represents the adsorbed quantity when ln![[thin space (1/6-em)]](https://www.rsc.org/images/entities/char_2009.gif) t = 0, i.e., when t is 1 min.76 Hence, the models fit the kinetic data for the adsorption of all the studied parabens in the following order: pseudo-second-order > Elovich > pseudo-first-order kinetics.
t = 0, i.e., when t is 1 min.76 Hence, the models fit the kinetic data for the adsorption of all the studied parabens in the following order: pseudo-second-order > Elovich > pseudo-first-order kinetics.
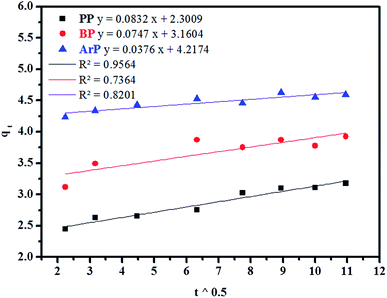
(d) Weber–Morris model. Weber–Morris intraparticle diffusion is defined by the equation below:
| qt = Kt0.5 + c | (13) |
| Analyte | Isotherm model | |||
|---|---|---|---|---|
| Parameter | IL-MNP-βCD-TDI | |||
| 298 K | 318 K | 338 K | ||
| Langmuir | ||||
| PP | qm (mg g−1) | 18.48 | 18.12 | 15.63 |
| b (L mg−1) | 0.0658 | 0.0216 | 0.0130 | |
| RL | 0.1627 | 0.3719 | 0.4959 | |
| R2 | 0.9512 | 0.9770 | 0.7522 | |
| BP | qm (mg g−1) | 28.49 | 25.13 | 19.08 |
| b (L mg−1) | 0.0717 | 0.0414 | 0.0376 | |
| RL | 0.1505 | 0.2348 | 0.2526 | |
| R2 | 0.9589 | 0.9898 | 0.9870 | |
| ArP | qm (mg g−1) | 50.25 | 46.73 | 31.55 |
| b (L mg−1) | 0.1004 | 0.0490 | 0.0463 | |
| RL | 0.1065 | 0.1963 | 0.2054 | |
| R2 | 0.9801 | 0.9709 | 0.9850 | |
![[thin space (1/6-em)]](https://www.rsc.org/images/entities/char_2009.gif) |
||||
| Freundlich | ||||
| PP | qm (mg g−1) | 17.03 | 13.26 | 8.92 |
| KF [(mg g−1) (L mg−1)1/nF] | 2.1145 | 0.5338 | 0.2689 | |
| nF | 2.1004 | 1.3641 | 1.2514 | |
| 1/nF | 0.4761 | 0.7331 | 0.7991 | |
| R2 | 0.9966 | 0.9809 | 0.9572 | |
| BP | qm (mg g−1) | 30.86 | 24.42 | 17.02 |
| KF [(mg g−1) (L mg−1)1/nF] | 2.7714 | 1.3993 | 1.0464 | |
| nF | 1.8182 | 1.5326 | 1.5711 | |
| 1/nF | 0.5500 | 0.6525 | 0.6365 | |
| R2 | 0.9955 | 0.9781 | 0.9829 | |
| ArP | qm (mg g−1) | 87.67 | 59.05 | 34.06 |
| KF [(mg g−1) (L mg−1)1/nF] | 4.8239 | 2.5734 | 1.8256 | |
| nF | 1.5110 | 1.3986 | 1.4975 | |
| 1/nF | 0.6618 | 0.7150 | 0.6678 | |
| R2 | 0.9865 | 0.9700 | 0.9606 | |
![[thin space (1/6-em)]](https://www.rsc.org/images/entities/char_2009.gif) |
||||
| Temkin | ||||
| PP | B | 3.0564 | 3.1254 | 2.3505 |
| KT (L mg−1) | 1.4711 | 0.3877 | 0.2954 | |
| bT (kJ mol−1) | 810.62 | 845.92 | 1195.5 | |
| R2 | 0.9074 | 0.9605 | 0.9072 | |
| BP | B | 4.9155 | 4.6864 | 3.6612 |
| KT (L mg−1) | 1.3806 | 0.6428 | 0.5440 | |
| bT (kJ mol−1) | 504.03 | 564.15 | 767.54 | |
| R2 | 0.9283 | 0.9731 | 0.9642 | |
| ArP | B | 8.7073 | 8.0738 | 5.9534 |
| KT (L mg−1) | 1.8765 | 0.8944 | 0.7054 | |
| bT (kJ mol−1) | 284.54 | 327.46 | 472.02 | |
| R2 | 0.9455 | 0.9648 | 0.9833 | |
(a) Langmuir model. The Langmuir isotherm has been widely used to calculate the adsorption capacity for pollutants. Langmuir developed an equilibrium isotherm to reveal the correlation between the amount of gas adsorbed on the surface and the pressure of the gas.78 According to Langmuir, several assumptions that apply to this model are: (1) adsorption only takes place at specific homogeneous sites within the adsorbent, i.e., all surface adsorption sites have equal adsorption energies; (2) in adsorption, there are a finite adsorption capacity and a saturation point; and (3) adsorption of an adsorbate is directly proportional to its concentration in solution. The linear form of the Langmuir isotherm equation is represented as follows:
 | (14) |
 and an intercept of
  . Moreover, the dimensionless separation factor (RL) can be calculated to determine if the adsorption process is favourable, as shown in the equation below, where Co (mg L−1) represents the initial capacity for the adsorbate at equilibrium:
 | (15) |
Basically, the Langmuir model is applied to monolayer adsorption on a homogeneous system. As for this study, the adsorption process is assumed to follow the Langmuir model because the model appears to fit the experimental data rather well with exceptional coefficients of determination (R2 > 0.95) for all the studied parabens, except for PP at 338 K, which gave a value of 0.7522. This result reflects the lack of hydrophobicity in PP, and hence its interaction with the βCD cavity was disregarded, primarily owing to the higher temperature (338 K), at which the analyte failed to remain in solution any longer and was subjected to degradation. The maximum monolayer adsorption (qm) was 50.251 mg g−1 for the adsorption of ArP, with an RL value of 0.1065 at 298 K. The RL values that were obtained for all the studied parabens seem favourable at all the studied temperatures as they exceeded zero but were less than unity (0 < RL < 1).
(b) Freundlich model. The correlation between the adsorbate and the adsorbent at equilibrium was estimated from the coefficient of determination (R2), which indicated a better linear form that fitted the Freundlich isotherm model, followed by the Langmuir isotherm model. In fact, the Freundlich equation describes the adsorption equilibrium. This model is employed for adsorption on heterogeneous surfaces with various classes of adsorption sites, together with various energy levels of adsorption. The Freundlich equation is expressed as follows:73
 | (16) |
 represents the heterogeneity factor, where nF is determined from the deviation from linear adsorption (adsorption is directly proportional to the concentration of the solution).66 From eqn (16), the following equation can be expressed in a linear form:
 | (17) |
Thus, the experimental data plotted as log![[thin space (1/6-em)]](https://www.rsc.org/images/entities/char_2009.gif) qe versus ln
qe versus ln![[thin space (1/6-em)]](https://www.rsc.org/images/entities/char_2009.gif) Ce were used to determine the intercept KF and the slope
Ce were used to determine the intercept KF and the slope  . The value of
  suggests the process of the adsorption system.79 Besides, Tseng and Wu asserted that if nF < 1 the process is chemical adsorption (unfavourable), whereas nF = 1 indicates linear adsorption, and nF > 1 refers to favourable physical adsorption.
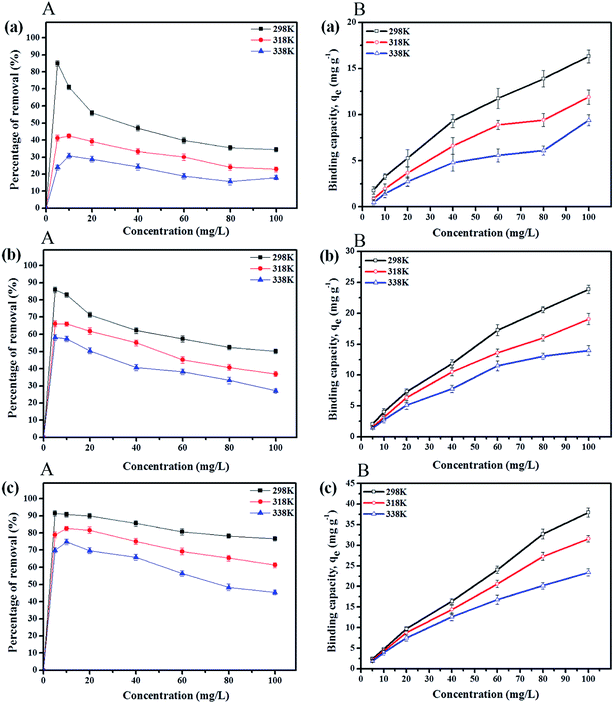
The adsorption of PP, BP, and ArP on IL-MNP-βCD-TDI demonstrated that the R2 value in the Freundlich model exceeded 0.95 at all the studied temperatures. This implies that the adsorption process on IL-MNP-βCD-TDI involves a heterogeneous surface with many cavities (CD), isocyanate groups, and imidazolium rings.37 Moreover, KF and nF are the constants of the Freundlich isotherm that correspond to the adsorption capacity and intensity of the adsorbent, respectively. Hence, the significant decrease in the adsorption capacity (KF) for all the studied parabens as the temperature rose indicates that the adsorption was exothermic, i.e., 2.1145–0.2689 (PP), 2.7714–1.0464 (BP), and 4.8239–1.8256 (ArP), as listed in Table 3. In addition, in order to prove that the adsorption process in this study is indeed favourable at lower temperatures, the intensity of the adsorbent (nF) was calculated from the Freundlich model, whereby the results appeared to be in the range of 1 < nF < 10 for the adsorption of all the studied parabens.
On the other hand, the sorption of ArP seemed to be better than that of BP, followed by that of PP, on IL-MNP-βCD-TDI, and this phenomenon may be explained by the inclusion effect and the π–π interactions between the adsorbent and the adsorbates. Furthermore, the hydrophobicity of parabens depends on the alkyl chain in the parabens, whereby a longer alkyl chain results in higher hydrophobicity. Besides, the ability of βCD to form a stable inclusion complex relies on the hydrophobicity of the analyte, which resulted in higher affinity for ArP owing to its higher hydrophobicity in comparison with that of BP, followed by that of PP. In addition, π–π interactions occur via the imidazolium rings in the IL and the double bonds (aromatic rings) in the parabens. Because ArP possesses more double bonds, the interaction of ArP is stronger in comparison with that of BP, followed by that of PP. In brief, the order of the strength of the adsorption process on IL-MNP-βCD-TDI is ArP > BP > PP, which corresponds to the exothermic nature of the process (298 K > 318 K > 338 K).
(c) Temkin model. Temkin and Pyzhev incorporated the effect of some indirect and adsorbate/adsorbent interactions into the adsorption isotherm.80 It was also suggested that the heat of adsorption for all molecules in the adsorbent surface layer decreases linearly with the coverage. Adsorption is further characterized by a uniform distribution of binding energies up to the maximum binding energy. The Temkin isotherm can be expressed in a linear form, as given in the following equation:
qe = β![[thin space (1/6-em)]](https://www.rsc.org/images/entities/char_2009.gif) ln ln![[thin space (1/6-em)]](https://www.rsc.org/images/entities/char_2009.gif) KT + β KT + β![[thin space (1/6-em)]](https://www.rsc.org/images/entities/char_2009.gif) ln ln![[thin space (1/6-em)]](https://www.rsc.org/images/entities/char_2009.gif) Ce Ce
| (18) |
 , KT represents the equilibrium binding constant, which corresponds to the maximum binding energy (L mg−1), and bT denotes the Temkin constant linked to the heat of adsorption. The constants KT and bT are determined from the intercept and slope, respectively, of a plot of qe versus ln
![[thin space (1/6-em)]](https://www.rsc.org/images/entities/char_2009.gif) Ce.
Ce.The Temkin isotherm model also provides the best fit for the coefficient of determination (R2 > 0.90) for all the studied parabens at 298 K, 318 K, and 338 K. The Temkin constants KT and bT indicate the equilibrium binding constants that correspond to the maximum binding energy (L mg−1) and the heat of sorption (kJ mol−1), respectively. The heat of sorption increased as the temperature rose, from 810.62 to 1195.50 kJ mol−1 (PP), from 504.03 to 767.54 kJ mol−1 (BP), and from 284.54 to 472.02 kJ mol−1 (ArP).
Therefore, in order to confirm the applicability of the isotherm models and to obtain some specific indications of the adsorption behaviour, it is crucial to identify the values of the coefficient of determination (R2) that correspond to all three linear forms of the studied models. Hence, an inspection of the R2 values in Table 3 confirms that the equilibrium adsorption data display the best fit to the isotherm models in the order of Freundlich > Langmuir > Temkin for all the studied parabens (PP, BP, and ArP).
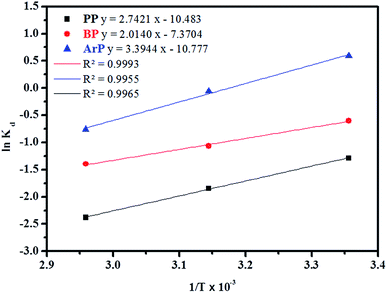
![[thin space (1/6-em)]](https://www.rsc.org/images/entities/char_2009.gif) Kd versus 1/T using eqn (20). In this case, R denotes the universal gas constant (kJ mol−1 K−1) and T is the temperature (K), whereas Kd refers to the equilibrium constant (m3 mol−1), which is determined from eqn (21), of which the results are tabulated in Table 4, whereas Fig. 7 presents the thermodynamic plots (van't Hoff plots) for the adsorption process.
Kd versus 1/T using eqn (20). In this case, R denotes the universal gas constant (kJ mol−1 K−1) and T is the temperature (K), whereas Kd refers to the equilibrium constant (m3 mol−1), which is determined from eqn (21), of which the results are tabulated in Table 4, whereas Fig. 7 presents the thermodynamic plots (van't Hoff plots) for the adsorption process.
ΔGo = −RT![[thin space (1/6-em)]](https://www.rsc.org/images/entities/char_2009.gif) ln ln![[thin space (1/6-em)]](https://www.rsc.org/images/entities/char_2009.gif) Kd Kd
| (19) |
 | (20) |
 | (21) |
| Analyte | T (K) | ΔGo (kJ mol−1) | ΔHo (J mol−1) | ΔSo (J K−1 mol−1) |
|---|---|---|---|---|
| PP | 298 | 25.95 | −22.80 | −87.16 |
| 318 | 27.70 | |||
| 338 | 29.44 | |||
| BP | 298 | 18.24 | −16.74 | −61.28 |
| 318 | 19.47 | |||
| 338 | 20.70 | |||
| ArP | 298 | 26.67 | −28.22 | −89.60 |
| 318 | 28.46 | |||
| 338 | 30.26 |
From the van't Hoff plots, ΔHo was found to be negative (−22.80, −16.74, and −28.22 J mol−1 for PP, BP, and ArP, respectively), which confirms that the adsorption mechanism is indeed exothermic. Moreover, the negative values of ΔSo for all the studied parabens (−87.17, −61.28, and −89.60 J K−1 mol−1, respectively) are attributed to a decrease in the degree of freedom at the solid/solution interface in the adsorption process.81,82 Specifically, in order to confirm the spontaneity of the adsorption process, ΔGo should have a negative value at a given temperature. Nevertheless, the thermodynamic parameters in this study appeared to be positive but low in terms of the value of ΔGo and thus indicated a feasible process that is non-spontaneous.83 Hence, the adsorption process for all the studied parabens can be concluded to be exothermic in nature and feasible, and could be spontaneous if the temperature is sufficiently low.
3.4 Analysis of real samples
The adsorption of PP, BP, and ArP was further investigated using real water samples. As illustrated in Fig. 8, the results for tap water and drain water appeared to be good enough in terms of removal of all the studied parabens. However, a decrease in the percentage removal was noted for industrial wastewater, which was mainly due to the matrix effect of the water itself. Moreover, industrial wastewater is known to contain many types of contaminants, which results in strong competition between unknown analytes and the targeted analytes to saturate the surface of the materials. Therefore, the low removal efficiency for the industrial wastewater sample is no surprise, although the results are still above the acceptable levels of 60%, 70%, and 80% for PP, BP, and ArP, respectively.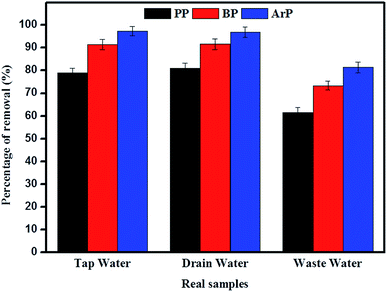 | ||
| Fig. 8 Analysis of removal of PP, BP, and ArP from real samples (conditions: sorbent, 100 mg; initial concentration, 80 mg L−1; adsorption time, 80 min; temperature, 298 K). | ||
3.5 Regeneration of adsorption activity displayed by IL-MNP-βCD-TDI
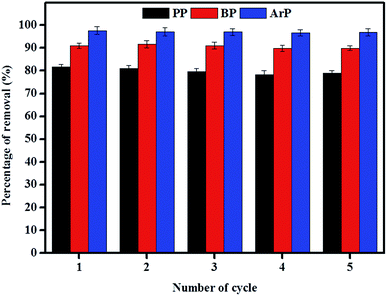
The reuse of adsorbents has become an area of interest among many researchers, and this study area must be taken into consideration owing to its vast range of applications. Therefore, in order to investigate the possibility of the reuse of the material examined in this study, sequential adsorption–desorption experiments in batch mode were performed over five cycles. From the data presented in Fig. 9, an insignificant reduction in removal efficiency was observed after the material had been reused five times. This result indicates that IL-MNP-βCD-TDI is indeed an exceptional and promising material that can be used to remove paraben compounds. The cycling tests were, nonetheless, discontinued in this particular study owing to the limited time available as a result of the time taken for the material to dry, as well as its reusability, which had been tested on three types of paraben compounds (PP, BP, and ArP).3.6 Comparison of various magnetically based adsorbents
As listed in Table 5, various magnetically based adsorbents were compared with various types of analytes, primarily because adsorption studies relating to paraben compounds are rare. The only adsorption study, which was reported by Forte et al. (2015),76 suggested that polyacrylonitrile (PAN) beads have been used to remove methyl paraben, but these are not a magnetically based adsorbent. Therefore, a comparison of the sorbent dosage (mg), initial concentration (Co), equilibrium time, and maximum capacity (qm) was undertaken, and these parameters were compared with those for various magnetically based adsorbents. Because IL-MNP-βCD-TDI forms many types of interactions, a higher adsorption capacity was achieved by using a sorbent dosage of only 20 mg with an equilibrium time of 80 min.| Analytes | Adsorbent | Sorbent dosage (mg) | Initial concentration (mg L−1) | Reaction time (min) | pH | Maximum capacity, qe (mg g−1) | Reference |
|---|---|---|---|---|---|---|---|
| DEHP | Fe3O4@P3TArH | 10 | 15 | 120 | 7 | 52.63 | 6 |
| Cu2+ | CM-β-CD-Fe3O4 | 120 | 50–200 | 30 | 6 | 47.20 | 30 |
| DNA | [C6MIM]-Fe3O4 | 15 | 20 | 10 | 3 | 19.80 | 54 |
| Fluoride | Fe3O4@Al(OH)3 NPs | 100 | 20 | 60 | 6.5 | 88.48 | 84 |
| Reactive red 120 4-(2-pyridylazo)resorcinol | IL-Fe3O4 | 60 | 200 | 2 | 2.5 | 166.67 | 85 |
| 49.26 | |||||||
| PP | IL-MNP-βCD-TDI | 20 | 80 | 80 | 6 | 18.48 | This work |
| BP | 30.86 | ||||||
| ArP | 87.67 |
3.7 Adsorption behaviour of βCD–ArP via formation of inclusion complex
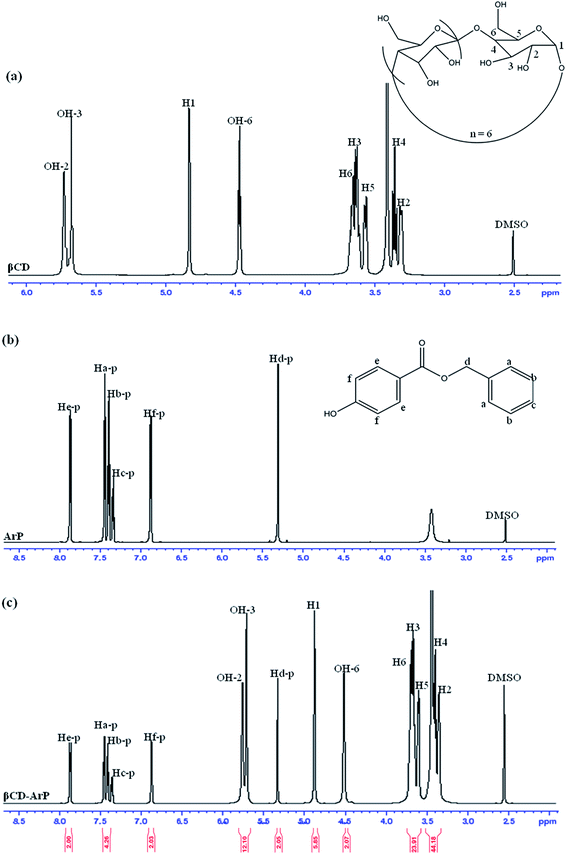
The formation of an inclusion complex can be confirmed by observing differences in chemical shifts (Δδ) based on specific nuclei in the host molecule, because such changes in the microenvironment have been believed to occur in CD in inclusion complexes.17 The boldface values in Table 6 signify the changes in chemical shifts that took place in the reaction. The noted downfield shift for the protons on the inner cavity of βCD, i.e., H3 and H5, corresponds to the encapsulation of the aromatic ring of ArP, which penetrated into the cavity of CD. Moreover, the H4 and H6 protons of βCD are located on the outer part of the cavity but also exhibited a downfield shift, except that they did not exhibit substantial changes upon the encapsulation of the aromatic ring of ArP. Furthermore, changes in the microenvironment of ArP protons led to upfield shifts for Ha-p, Hc-p, Hd-p, He-p, and Hf-p, whereas a downfield shift was observed for Hb-p among these protons. These protons belong to the aromatic rings that are present in the structure of ArP, as illustrated in Fig. 10b. Hence, the 1H signals of both βCD and ArP strongly suggest the formation of inclusion complex interactions, which can be clearly observed in the 1H NMR spectrum of βCD-ArP.| βCD (δ) | ArP (δ) | βCD-ArP (δ) | Δδ | |
|---|---|---|---|---|
| H1 | 4.832 | 4.837 | +0.005 | |
| H2 | 3.313 | 3.313 | +0.000 | |
| H3 | 3.634 | 3.644 | +0.010 | |
| H4 | 3.351 | 3.360 | +0.009 | |
| H5 | 3.620 | 3.630 | +0.010 | |
| H6 | 3.648 | 3.658 | +0.010 | |
| Ha-p | 7.440 | 7.437 | −0.003 | |
| Hb-p | 7.393 | 7.399 | +0.006 | |
| Hc-p | 7.347 | 7.345 | −0.002 | |
| Hd-p | 5.298 | 5.291 | −0.007 | |
| He-p | 7.863 | 7.856 | −0.007 | |
| Hf-p | 6.871 | 6.862 | −0.009 |
3.8 Spectroscopic study
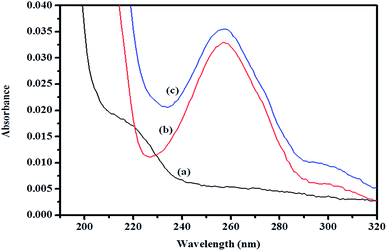 | ||
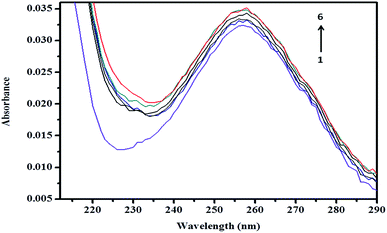
| Fig. 11 Absorption spectra of (a) βCD, (b) ArP, and (c) the βCD–ArP complex with [ArP]: 0.01 mM and [βCD]: 0.004 M at a pH of 7 and 25 °C. | ||
 | (22) |
![[thin space (1/6-em)]](https://www.rsc.org/images/entities/char_2009.gif) :
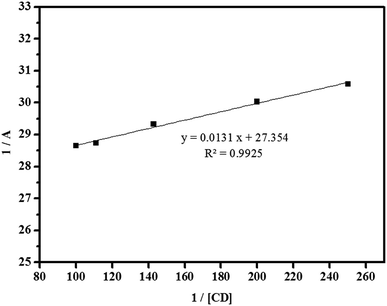
:![[thin space (1/6-em)]](https://www.rsc.org/images/entities/char_2009.gif) 1. In fact, the apparent formation constant is 2.09 × 10³ mol L−1.
1. In fact, the apparent formation constant is 2.09 × 10³ mol L−1.
4. Conclusion
In conclusion, IL-MNP-βCD-TDI was successfully tested as an adsorbent for the adsorption of selected paraben compounds, namely, PP, BP, and ArP. Furthermore, both kinetic and isotherm analyses demonstrated that the pseudo-second-order and Freundlich models provided better correlations for the adsorption of PP, BP, and ArP, with R2 values ranging between 0.980 and 0.999 for both models. In addition, both analyses were found to indicate that the equilibrium time was 80 min with an initial concentration of 80 mg L−1 at room temperature (298 K). Moreover, the negative value of ΔH demonstrated the exothermic nature of the adsorption process for all the studied parabens. In addition, the adsorbent was further analysed using real water samples. IL-MNP-βCD-TDI was also tested for the reusability of the sorbent, and it was found that the sorbent could be reused up to five times. Finally, an adsorption mechanism is proposed by considering the inclusion complex and π–π interaction between βCD and ArP, as proven via experimental analysis of 1H NMR spectra. Spectroscopic analysis also confirmed the formation of the inclusion complex by an enhancement in the absorbance of the guest molecule in UV-vis analysis. In brief, IL-MNP-βCD-TDI appears to be a promising material for the treatment of parabens in water.Conflicts of interest
All authors declare that there is no conflict of interest.Acknowledgements
Grateful thanks to the scholarship provided by MyBrain 15 (MyMaster) from the Ministry of Higher Education (MOHE), Malaysia to one of the authors, Masrudin bin Md Yusoff. The authors would also like to thank the Universiti Sains Malaysia Research Grant (RUi: 1001/CIPPT/811322) and the Fundamental Research Grant Scheme (FRGS: 203/CIPPT/6711557) for their financial support to finish this study.References
- A. H. Lu, E. e. L. Salabas and F. Schüth, Angew. Chem., Int. Ed., 2007, 46, 1222–1244 CrossRef PubMed.
- G. Giakisikli and A. N. Anthemidis, Anal. Chim. Acta, 2013, 789, 1–16 CrossRef PubMed.
- N. Sanvicens and M. P. Marco, Trends Biotechnol., 2008, 26, 425–433 CrossRef PubMed.
- S. K. M. Rozi, S. Bakhshaei, N. S. A. Manan and S. Mohamad, RSC Adv., 2016, 6, 87719–87729 RSC.
- W. Wang, R. Ma, Q. Wu, C. Wang and Z. Wang, J. Chromatogr. A, 2013, 1293, 20–27 CrossRef PubMed.
- S. N. A. Baharin, N. Muhamad Sarih and S. Mohamad, Polymers, 2016, 8, 117 CrossRef.
- E. Tahmasebi, Y. Yamini, A. Mehdinia and F. Rouhi, J. Sep. Sci., 2012, 35, 2256–2265 CrossRef PubMed.
- J. Ding, Q. Gao, D. Luo, Z.-G. Shi and Y.-Q. Feng, J. Chromatogr. A, 2010, 1217, 7351–7358 CrossRef PubMed.
- H. Heidari and H. Razmi, Talanta, 2012, 99, 13–21 CrossRef PubMed.
- Z. Du, M. Liu and G. Li, J. Sep. Sci., 2013, 36, 3387–3394 Search PubMed.
- M. Alcudia-León, R. Lucena, S. Cárdenas and M. Valcárcel, Microchem. J., 2013, 110, 643–648 CrossRef.
- A. Mehdinia, F. Roohi and A. Jabbari, J. Chromatogr. A, 2011, 1218, 4269–4274 CrossRef PubMed.
- T. D. Schladt, K. Schneider, H. Schild and W. Tremel, Dalton Trans., 2011, 40, 6315–6343 RSC.
- Y. He and X. Shen, J. Photochem. Photobiol., A, 2008, 197, 253–259 CrossRef.
- J. Szejtli, Chem. Rev., 1998, 98, 1743–1754 CrossRef PubMed.
- K. P. Sambasevam, S. Mohamad, N. M. Sarih and N. A. Ismail, Int. J. Mol. Sci., 2013, 14, 3671–3682 CrossRef PubMed.
- S. Mohamad, H. Surikumaran, M. Raoov, T. Marimuthu, K. Chandrasekaram and P. Subramaniam, Int. J. Mol. Sci., 2011, 12, 6329–6345 CrossRef PubMed.
- J. Zhang, X. Shen and Q. Chen, Curr. Org. Chem., 2011, 15, 74–85 CrossRef.
- W. Lu, X. Le, J. Zhang, Y. Huang and T. Chen, Chem. Soc. Rev., 2017, 46, 1284–1294 RSC.
- E. Y. Ozmen, A. Sirit and M. Yilmaz, J. Macromol. Sci., Part A: Pure Appl. Chem., 2007, 44, 167–173 CrossRef.
- Y. P. Chin, S. Mohamad and M. R. B. Abas, Int. J. Mol. Sci., 2010, 11, 3459–3471 CrossRef PubMed.
- K. Salipira, R. Krause, B. Mamba, T. Malefetse, L. Cele and S. Durbach, Mater. Chem. Phys., 2008, 111, 218–224 CrossRef.
- A. Romo, F. J. Penas, J. R. Isasi, I. X. Garcia-Zubiri and G. González-Gaitano, React. Funct. Polym., 2008, 68, 406–413 CrossRef.
- S. M. Ng and R. Narayanaswamy, Sens. Actuators, B, 2009, 139, 156–165 CrossRef.
- I. X. García-Zubiri, G. González-Gaitano and J. R. Isasi, J. Colloid Interface Sci., 2009, 337, 11–18 CrossRef PubMed.
- M. Appell and M. A. Jackson, J. Inclusion Phenom. Macrocyclic Chem., 2010, 68, 117–122 CrossRef.
- H. Cao, J. He, L. Deng and X. Gao, Appl. Surf. Sci., 2009, 255, 7974–7980 CrossRef.
- A. Z. M. Badruddoza, G. S. S. Hazel, K. Hidajat and M. Uddin, Colloids Surf., A, 2010, 367, 85–95 CrossRef.
- R. Li, S. Liu, J. Zhao, H. Otsuka and A. Takahara, Polym. Bull., 2011, 66, 1125–1136 CrossRef.
- A. Z. M. Badruddoza, A. Tay, P. Tan, K. Hidajat and M. Uddin, J. Hazard. Mater., 2011, 185, 1177–1186 CrossRef PubMed.
- H. Wang, Y. Zhou, Y. Guo, W. Liu, C. Dong, Y. Wu, S. Li and S. Shuang, Sens. Actuators, B, 2012, 163, 171–178 CrossRef.
- A. R. Kiasat and S. Nazari, J. Mol. Catal. A: Chem., 2012, 365, 80–86 CrossRef.
- A. Z. M. Badruddoza, Z. B. Z. Shawon, D. W. J. Tay, K. Hidajat and M. S. Uddin, J. Chem. Eng., 2013, 27, 69–73 Search PubMed.
- A. Z. M. Badruddoza, Z. B. Z. Shawon, W. J. D. Tay, K. Hidajat and M. S. Uddin, Carbohydr. Polym., 2013, 91, 322–332 CrossRef PubMed.
- A. Gong, W. Ping, J. Wang and X. Zhu, Spectrochim. Acta, Part A, 2014, 122, 331–336 CrossRef PubMed.
- L. Fan, M. Li, Z. Lv, M. Sun, C. Luo, F. Lu and H. Qiu, Colloids Surf., B, 2012, 95, 42–49 CrossRef PubMed.
- M. Raoov, S. Mohamad and M. R. Abas, J. Hazard. Mater., 2013, 263, 501–516 CrossRef PubMed.
- M. Raoov, S. Mohamad and M. R. Abas, Int. J. Mol. Sci., 2013, 15, 100–119 CrossRef PubMed.
- M. Raoov, S. Mohamad, M. R. bin Abas and H. Surikumaran, Talanta, 2014, 130, 155–163 CrossRef PubMed.
- W. Ping, H. Xu and X. Zhu, Biochem. Anal. Biochem., 2013, 2, 1000138 Search PubMed.
- W. Ping, X. Zhu and B. Wang, Anal. Lett., 2014, 47, 504–516 CrossRef.
- X. Qin and X. Zhu, Anal. Lett., 2016, 49, 189–199 CrossRef.
- P. Subramaniam, S. Mohamad and Y. Alias, Int. J. Mol. Sci., 2010, 11, 3675–3685 CrossRef PubMed.
- A. B. McEwen, H. L. Ngo, K. LeCompte and J. L. Goldman, J. Electrochem. Soc., 1999, 146, 1687–1695 CrossRef.
- J. L. Anderson, J. Ding, T. Welton and D. W. Armstrong, J. Am. Chem. Soc., 2002, 124, 14247–14254 CrossRef PubMed.
- J. A. Ocaña-González, M. Villar-Navarro, M. Ramos-Payán, R. Fernández-Torres and M. A. Bello-López, Anal. Chim. Acta, 2015, 858, 1–15 CrossRef PubMed.
- P. D. Darbre and P. W. Harvey, J. Appl. Toxicol., 2014, 34, 925–938 CrossRef PubMed.
- C. Haman, X. Dauchy, C. Rosin and J.-F. Munoz, Water Res., 2015, 68, 1–11 CrossRef PubMed.
- D. Błędzka, J. Gromadzińska and W. Wąsowicz, Environ. Int., 2014, 67, 27–42 CrossRef PubMed.
- S. Sasi, M. P. Rayaroth, D. Devadasan, U. K. Aravind and C. T. Aravindakumar, J. Hazard. Mater., 2015, 300, 202–209 CrossRef PubMed.
- M. M. Yusoff, M. Raoov, N. Yahaya and N. M. Salleh, RSC Adv., 2017, 7, 35832–35844 RSC.
- S. Sinniah, S. Mohamad and N. S. Manan, Appl. Surf. Sci., 2015, 357, 543–550 CrossRef.
- M. Karimi, A. M. Shabani and S. Dadfarnia, J. Braz. Chem. Soc., 2016, 27, 144–152 Search PubMed.
- M. Ghaemi and G. Absalan, Microchim. Acta, 2014, 181, 45–53 CrossRef.
- T. Chatzimitakos, C. Binellas, K. Maidatsi and C. Stalikas, Anal. Chim. Acta, 2016, 910, 53–59 CrossRef PubMed.
- M. Bhaskar, P. Aruna, R. J. G. Jeevan and G. Radhakrishnan, Anal. Chim. Acta, 2004, 509, 39–45 CrossRef.
- Z. Ma, Y. Guan and H. Liu, J. Polym. Sci., Part A: Polym. Chem., 2005, 43, 3433–3439 CrossRef.
- K. S. Sing, Pure Appl. Chem., 1985, 57, 603–619 Search PubMed.
- A. Ismail, D. Adil, B. Erhan and S. Bekir, Chemosphere, 2005, 61, 1263–1272 CrossRef PubMed.
- S. Bakhshaei, M. A. Kamboh, H. R. Nodeh, S. M. Zain, S. K. M. Rozi, S. Mohamad and I. A. M. Mohialdeen, RSC Adv., 2016, 6, 77047–77058 RSC.
- D. Bulgariu and L. Bulgariu, Bioresour. Technol., 2012, 103, 489–493 CrossRef PubMed.
- E. N. El Qada, S. J. Allen and G. M. Walker, Ind. Eng. Chem. Res., 2006, 45, 6044–6049 CrossRef.
- F. Y. Wang, H. Wang and J. W. Ma, J. Hazard. Mater., 2010, 177, 300–306 CrossRef PubMed.
- Y. Wu, E. Hu, W. Dai, Z. Li, Y. Zhong and Y. Hu, RSC Adv., 2017, 7, 5093–5100 RSC.
- G. Crini, Prog. Polym. Sci., 2005, 30, 38–70 CrossRef.
- G. Crini, H. N. Peindy, F. Gimbert and C. Robert, Sep. Purif. Technol., 2007, 53, 97–110 CrossRef.
- G. Crini, Dyes Pigm., 2008, 77, 415–426 CrossRef.
- F. A. Pavan, S. L. Dias, E. C. Lima and E. V. Benvenutti, Dyes Pigm., 2008, 76, 64–69 CrossRef.
- M. d. M. C. López, M. C. Pérez, M. S. D. García, J. M. L. Vilarino, M. V. G. Rodríguez and L. F. B. Losada, Anal. Chim. Acta, 2012, 721, 68–78 CrossRef PubMed.
- M. Kilic, E. Apaydin-Varol and A. E. Pütün, J. Hazard. Mater., 2011, 189, 397–403 CrossRef PubMed.
- H. Yuh-Shan, Scientometrics, 2004, 59, 171–177 CrossRef.
- S. Lagergren, K. Sven. Vetenskapsakad. Handl., 1898, 24, 1–39 Search PubMed.
- Y.-S. Ho and G. McKay, Process Biochem., 1999, 34, 451–465 CrossRef.
- I. Tan, A. Ahmad and B. Hameed, J. Hazard. Mater., 2009, 164, 473–482 CrossRef PubMed.
- V. Vimonses, S. Lei, B. Jin, C. W. Chow and C. Saint, Chem. Eng. J., 2009, 148, 354–364 CrossRef.
- M. Forte, L. Mita, R. Perrone, S. Rossi, M. Argirò, D. G. Mita, M. Guida, M. Portaccio, T. Godievargova and Y. Ivanov, Environ. Sci. Pollut. Res., 2016, 1–13 Search PubMed.
- A. Delle Site, J. Phys. Chem. Ref. Data, 2001, 30, 187–439 CrossRef.
- I. Langmuir, J. Am. Chem. Soc., 1918, 40, 1361–1403 CrossRef.
- R.-L. Tseng and F.-C. Wu, J. Hazard. Mater., 2008, 155, 277–287 CrossRef PubMed.
- M. Temkin and V. Pyzhev, Acta Physicochim. URSS, 1940, 12, 217–222 Search PubMed.
- Y. A. Aydın and N. D. Aksoy, Chem. Eng. J., 2009, 151, 188–194 CrossRef.
- T. A. Saleh, A. Sarı and M. Tuzen, J. Mol. Liq., 2016, 219, 937–945 CrossRef.
- S. Gueu, B. Yao, K. Adouby and G. Ado, Int. J. Environ. Sci. Technol., 2007, 4, 11–17 CrossRef.
- X. Zhao, J. Wang, F. Wu, T. Wang, Y. Cai, Y. Shi and G. Jiang, J. Hazard. Mater., 2010, 173, 102–109 CrossRef PubMed.
- G. Absalan, M. Asadi, S. Kamran, L. Sheikhian and D. M. Goltz, J. Hazard. Mater., 2011, 192, 476–484 CrossRef PubMed.
- H. Y. Wang, J. Han and X. G. Feng, Spectrochim. Acta, Part A, 2007, 66, 578–585 CrossRef PubMed.
Footnote |
| † Electronic supplementary information (ESI) available. See DOI: 10.1039/c8ra03408g |
| This journal is © The Royal Society of Chemistry 2018 |

