
 Open Access Article
 This Open Access Article is licensed under a
 Creative Commons Attribution 3.0 Unported Licence
Isolation of nitrate-reducing bacteria from an offshore reservoir and the associated biosurfactant production†
Fuqiang Fana,
Baiyu Zhang *a,
Penny L. Morrillb and
Tahir Husaina
*a,
Penny L. Morrillb and
Tahir Husaina
aNorthern Region Persistent Organic Pollution Control (NRPOP) Laboratory, Faculty of Engineering and Applied Science, Memorial University of Newfoundland, St. John's, NL, Canada A1B 3X5. E-mail: ff0466@mun.ca; bzhang@mun.ca; thusain@mun.ca
bEarth Sciences, Faculty of Science, Memorial University of Newfoundland, St. John's, NL, Canada A1B 3X5. E-mail: pmorrill@mun.ca
First published on 25th July 2018
Abstract
Biosurfactant producing nitrate-reducing bacteria (NRB) in anaerobic reservoir environments are closely associated with souring (H2S) control in the offshore oil and gas industry. Five NRB strains were screened from offshore produced water samples and all were identified as Pseudomonas stutzeri. Their biosurfactant producing abilities when fed on either glucose or glycerol media were investigated. P. stutzeri CX3 reduced the medium surface tension to 33.5 and 29.6 mN m−1, respectively, while growing on glucose or glycerol media. The CX3 strain was further inoculated to examine its growth performance, resulting in 32.4% and 94.5% of nitrate consumption over 228 hours of monitoring in two media, respectively. The composition analysis of the biosurfactant product generated by P. stutzeri CX3 was conducted through thin-layer chromatography, gas chromatography with a flame ionization detector (FID) and Fourier transform infrared spectroscopy (FT-IR). The biosurfactant product was identified as a mixture of a small part of lipopeptides and a large part of glycolipids while its critical micellar concentration (CMC) was as low as 35 mg L−1. The biosurfactant product demonstrated high stability over a wide range of temperature (4–121 °C), pH (2–10), and salinity (0–20% w/v) concentration. The results provided valuable technical and methodological support for effective offshore reservoir souring control and associated enhanced oil recovery activities.
1. Introduction
The activity of sulfate reducing bacteria (SRB) has long been a major concern in oilfield water systems and offshore petroleum reservoirs because these microorganisms are one of the main causes of reservoir souring (sulfides).1 The undesirable production of sulfides by SRB can result in reduced quality of produced oils, health and safety risks for operators, and increased corrosivity of produced fluids.2,3Although sulfides can be removed chemically after their production, in situ elimination through continuous nitrate/nitrite injection has also proven to be effective, as demonstrated both in model column,4–6 inland7,8 and offshore field studies.9,10 Nitrate injection changes the microbial community in the subsurface from mainly SRB to one enriched in NRB, which include the nitrate-reducing, sulfide-oxidizing bacteria (NR-SOB) that oxidize H2S directly and the heterotrophic NRB (hNRB) that compete with SRB for degradable organic electron donors. Additionally, both types of NRB also promote SRB inhibition via production of nitrite formed in nitrate reduction pathways.11 NRB are well known for their denitrifying capacity in which nitrates or nitrites are converted into nitrogen-containing gases. This function enables NRB to play significant roles in the global nitrogen cycle12 and mitigation and control of sulfide induced reservoir souring problems in offshore oil fields.13 However, understanding of the detailed microbial mechanisms involved in NRB-SRB interactions during nitrate/nitrite injections for offshore reservoirs souring mitigation is currently limited.
Anaerobic, indigenous NRB have the potential to produce specific biosurfactants in deep geological porous offshore reservoirs with diverse physiochemical in situ conditions. Biosurfactants are surface-active compounds with both lipophilic and hydrophilic structural moieties produced by microorganisms, which either adhere to the cell surface or are secreted extracellularly in the growth medium.14 These surface active molecules reduce surface tension at air–water interfaces and interfacial tension in both aqueous solutions and hydrocarbon mixtures.15 Notably, biosurfactants have various advantages over their commercially manufactured counterparts because of their lower toxicity, biodegradable nature, ease of biosynthesis and the effectiveness under extreme conditions such as temperature, pH, and salinity.16,17 Fallon et al.18 have confirmed that biosurfactants can be naturally derived from NRB. As microorganisms capable of utilizing hydrocarbons as carbon and energy sources, NRB will produce surface-active agents as by-products to facilitate hydrophobic degradation.19 The selective surface-active agents or biosurfactants produced by NRB increase the surface area of hydrophobic water-insoluble substrates (low molecular weight biosurfactants) and increase the solubility (high molecular weight biosurfactants), thus improving the bioavailability of hydrocarbons for NRB.17 When emulsion occurs close to the cell surface of NRB, each cluster of cells creates its own microenvironment and stimulate the growth of NRB in oil and gas reservoirs.19 This mechanism enables NRB to out-compete harmful SRB for basic carbon nutrients. The SRB will be inhibited from producing new hydrogen sulfide/iron sulfide, and the existing sulfides will be removed by bacterial degradation, resulting in effective control of offshore reservoir souring. Thus, in this point biosurfactants are interesting by-products involved in the SRB/NRB competition.
To investigate how biosurfactants affect NRB/SRB competition in a reservoir, successful screening of biosurfactant producing NRB and generation of associated biosurfactants are needed. Oil reservoirs could provide a unique hydrocarbon-rich environment for biosurfactant screening and the enrichment of diverse biosurfactant producers.20 The extreme conditions (e.g., high temperature, high pressure, and low oxygen concentration) in oil reservoirs would formulate a microbial community that may be distinguished from others.21 So far, biosurfactant producers identified from oil reservoirs are mainly from inland reservoirs and limited to the genera of Bacillus22–26 and Pseudomonas.27–29 Currently, very limited marine biosurfactant producers from offshore oil and gas fields have been reported and it was unclear whether they were NRB species or not. Cai et al.30 isolated marine biosurfactant producers from crude oil, formation water, drilling mud, and treated produced water samples in offshore oil and gas fields. The genotype and phylogenetic relation of these isolates were investigated and biosurfactant producers were primarily found in the genera of Rhodococcus and Halomonas. However, most of these species reported are general biosurfactant producers and they were screened under aerobic conditions, which were not prevalent in the reducing reservoir environments. Hui et al.31 evaluated the microbial community structure and functionally distinct groups in three kinds of produced water samples from the shallow, mesothermic and low-salinity Daqing oil reservoir using both culture-dependent and culture-independent methods. The isolates affiliated to Pseudomonas stutzeri PTG4-15 (DP26, BP39, and PW5) were initially identified as nitrate-reducing bacteria, biosurfactant-producing bacteria, and polymer-producing bacteria. This indicates that anaerobic indigenous NRB have the potential to produce specific biosurfactants in the reservoir.
Until now, biosurfactant producing NRB isolated from oil reservoirs have been rarely reported, and associated biosurfactant production is extremely limited in the literature. No previous study tackled the isolation of biosurfactant producing NRB from offshore reservoirs and subsequent anaerobic biosurfactant production. Therefore, the aim of this study was to screen NRB strains from an offshore reservoir, and conduct biosurfactant production and characterization. The research outputs will not only help identify NRB and generate biosurfactants under anaerobic conditions, but also provide technical and methodological support for further identifying NRB/SRB interactions and generating methodologies for effective offshore reservoir souring control in the future.
2. Materials and methods
2.1 Source and collection of inoculum
Produced water samples in an offshore water flooding reservoir were collected for screening novel biosurfactant producers. Injection wells on the platforms were injected with nitrate/nitrite to stimulate the growth of indigenous nitrate-reducing microorganisms in the reservoir or exogenous NRB strains from seawater injection process. Produced water was collected in 1 liter sterile glass bottles and then sealed immediately to maintain anoxic conditions. The samples were stored in a refrigerator in darkness before shipping. Subsequently, the samples were packaged with frozen ice packs and transported to the laboratory for enrichments and bacterial isolations. The major constituents of the produced water include (in wt/vol) chloride, 4.0%; sodium, 2.5%; sulfate, 0.13%; calcium 0.12%; and bicarbonate, 0.076%. Water samples were stored at 4 °C and were taken for enrichment culture within one week of collection.2.2 Isolation and identification of NRB
Enrichment was initially conducted in a chamber filled with nitrogen until observable turbidity occurred. The bacterial consortia were then inoculated into new media for further acclimatization. The average bacterial acclimatization period was 15 days. After seven periods, 5 mL of each medium broth were transferred into fresh liquid CSB medium and the citrate medium. The second round of bacterial acclimatization in liquid CSB and citrate medium were conducted through three periods. After that, the consortia were serially diluted to 106, 105, and 104 and then spread on solid CSB and citrate medium agar plate, respectively. The resulting plates were incubated at room temperature in a nitrogen-filled environment.
Routine growth and maintenance of broth isolates were in CSB medium. Bacterial growth status was detected by observing an increase in optical density (at 600 nm) or the cell dry weight filtered from medium broth.
2.3 Screening of the NRB isolates for biosurfactant producers
| E24 = HEL/HS × 100% | (1) |
![[thin space (1/6-em)]](https://www.rsc.org/images/entities/char_2009.gif) 000 rpm for 20 min to remove microbial cells and the supernatant was subject to surface activity measurements. Surface tension was determined with a surface tensiometer (DuNouy Tensiometer, Interfacial, CSC Scientific) at room temperature according to the ring method. The values reported were the mean of triplicate measurements.
000 rpm for 20 min to remove microbial cells and the supernatant was subject to surface activity measurements. Surface tension was determined with a surface tensiometer (DuNouy Tensiometer, Interfacial, CSC Scientific) at room temperature according to the ring method. The values reported were the mean of triplicate measurements.2.4 Performance demonstration of the selected strain
According to the results, one isolate was selected to further demonstrate the performance of biosurfactant production. The two surfactant production media with glycerol and glucose as carbon sources were used to investigate the performance of biosurfactant production. The incubation was conducted at 30 °C while shaking at 200 rpm.The isolate was firstly inoculated into the flask containing 20 mL fresh glucose medium and incubated using the above conditions for 48 h. Then a 200 μL aliquot of the culture broth was inoculated into each flask with 20 mL glycerol or glucose producing medium. The following two tests at time intervals of 0, 12, 24, 36, 48, 60, 84, 128, 156, 180, 204 and 228 h were sampled with the whole flask, respectively. In addition, to investigate the nitrate reduction effect of the isolate on biosurfactant production, initial NaNO3 concentrations at 1, 2, 3, 4 and 5 g L−1 were used on the glycerol producing medium. Samples were collected after 192 h.
The optical density (OD600) of samples was employed as the index of bacterial growth.36 Absorbance was measured at λ = 600 nm using a UV-Visible spectrophotometer. All culture media were shaken for 5 s to homogenize the media before OD600 determination. The absorbance of the freshly autoclaved medium was adjusted to 0 as the blank control. The measurement of OD600 was performed in triplicate by sampling three times.
To observe the nitrate consumption by NRB, nitrate concentration in the culture was determined using a two-wavelength approach.37 A rapid measurement of sample absorption at 220 nm (A220) was conducted in a quartz cuvette and organic matter interference was eliminated through the second measurement at 275 nm (A275). Nitrate concentration was determined from standard curves prepared with NaNO3 (0.2–8 mg L−1). Additionally, surface tension changes over the period were monitored using the methodology mentioned above. Critical micelle dilution (CMD) analysis was conducted to evaluate the concentration of biosurfactant product generated during the investigation of cultivation kinetics.
2.5 Biosurfactant production and characterization
000 rpm for 20 min to remove bacterial cells. The supernatant was then acidified to pH 2.0 with concentrated HCl (1 moL L−1) and kept at 4 °C overnight to reduce the rhamnolipid solubility. The biosurfactant product was further recovered through the addition of two volumes of chloroform:methanol (v/v, 2:1) mixture. After shaking the mixture for 2 h, the lower organic phase was collected and evaporated to dryness by a rotary evaporator. The final precipitate was collected.:CH3OH:H2O (70:10:0.5, v/v/v) as developing solvent system with different color developing reagents. For detection of lipopeptide biosurfactant, ninhydrin reagent (0.5 g ninhydrin in 100 mL anhydrous acetone) was sprayed on the dry plates and red spots were visualized after keeping the plate at 105 °C for 5 min. Anthrone reagent (1 g anthrone in 5 mL sulfuric acid mixed with 95 mL ethanol) was used to reveal the presence of glycolipid biosurfactant in yellow spots. Also, lipid content was further visualized by iodine chamber.:diethyl ether:formic acid (99.95:1:00.05). The rods were developed for 25 minutes, removed from the system for 5 minutes and replaced for 20 minutes. The second development was for 40 minutes in hexane:diethyl ether:formic acid (79:20:1). The final development system had two steps, the first was 100% acetone for two 15 minute time periods, followed by two 10 minute periods in chloroform:methanol:chloroform-extracted water (5:4:1). Before each solvent system, the rods were dried in a constant humidity chamber. After each development system the rods were scanned in the Iatroscan and the data were collected using Peak Simple software (ver 3.67, SRI Inc). The Chromarods were calibrated using standards from Sigma Chemicals (Sigma Chemicals, St. Louis, Mo., USA).3. Results and discussion
3.1 Phylogenetic analysis and morphological characteristics of NRB isolates
These isolates were incubated under anaerobic conditions with acetate as the carbon source and electron donor. Although the screening of biosurfactant producing NRB was performed under the presence of both nitrate and sulfate, only nitrate (i.e., NaNO3) was the electron acceptor in NRB growth. The NRB groups have been noted for their special capability of performing effective denitrification. Far more energy is released during the reduction of nitrate than during that of sulfate,43 which also enables the NRB to utilize nitrate as preferential electron acceptor. The addition of MgSO4·7H2O was mainly used to provide mineral salts for bacterial growth and balance the sulfate levels.44 Most of the isolated NRB species were anaerobically slow-growing and mature colonies were formed around ten days on the CSB medium. As shown in Table 1, with sequences obtained by doing a BLAST search, a similarity of 99% or 100% to Pseudomonas stutzeri was found by the alignment of the 16S rRNA gene sequences of all the selected five NRB strains isolated from offshore produced water.| Isolate ID | Query cover | Identity | Species name with highest match | Liquid medium morphology | Agar plate morphology (shape/margin/elevation/surface texture/color) |
|---|---|---|---|---|---|
| CX1 | 100% | 100% | Pseudomonas stutzeri | Turbidity | Circular/entire/convex/smooth/beige |
| CX3 | 100% | 100% | Pseudomonas stutzeri | Turbidity | Circular/entire/convex/smooth/brown |
| HF5 | 100% | 99% | Pseudomonas stutzeri | Flocculent | Circular/raised/convex/radiate/beige |
| HF6 | 100% | 99% | Pseudomonas stutzeri | Turbidity | Circular/raised/convex/radiate/beige |
| FX8 | 100% | 99% | Pseudomonas stutzeri | Flocculent | Circular/curled/convex/smooth/transparent |
The morphology characteristics of isolates were summarized in Table 1. In general, all the species could be summed into two categories: the brown one with entire margins and the light color or transparent ones with raised or curled margins. Notably, some isolates, HF5 and FX6 formed flocculants in liquid biosurfactant producing medium. The components of the flocculants were studied extensively and were a mixture of polysaccharides, proteins, lipids, glycolipids and glycoproteins.45 Bioflocculants could be produced by various functional microorganisms and are biodegradable, environmentally friendly and harmlessness to humans. Microorganisms with high bioflocculant-producing ability thus can be utilized to produce bioflocculants and be used in industrial fields such as drinking and wastewater treatment, downstream processing, and fermentation processes.46 The flocculated cells were previously reported to be immobilized inside the reactor for a continuous fermentation system without cell separation and recycling units, and the yields from the reactor were clean broths for further ethanol production.47 Viewed from this perspective, the two strains have promising applications in batch, fed-batch or continuous fermentation reactors for industrial nitrate removal activities.
The strain CX3 was noticeable due to its different margin and color in the agar plate during morphology examination when compared with others (Table 1). During the growth on CSB medium, the isolate formed visible regular and glistening colonies with the colony diameters ranging from 1 to 3 mm. The precise taxonomic positions of the microbes were subsequently determined through the genotypic analysis on the basis of partial 16S rRNA sequencing. Unlike other four strains, Pseudomonas stutzeri CX3 occupied a unique branch in the phylogenetic tree generated from the five Pseudomonas stutzeri strains and other Pseudomonas species (Fig. 1). The selected Pseudomonas stutzeri strains formed a stable phyletic group within a heterogeneous cluster of Pseudomonas xanthomarina, and other Pseudomonas stutzeri strains, which distributed in ubiquitous environments and were identified among denitrifiers in natural materials.48 P. stutzeri is a highly diverse species of great physiological and ecological versatility and is paid particular attention due to their specific activities in nitrification and denitrification processes.49 The strains of Pseudomonas stutzeri were also anaerobically isolated from various environmental samples and used in the degradation of aliphatic and aromatic hydrocarbons.50,51
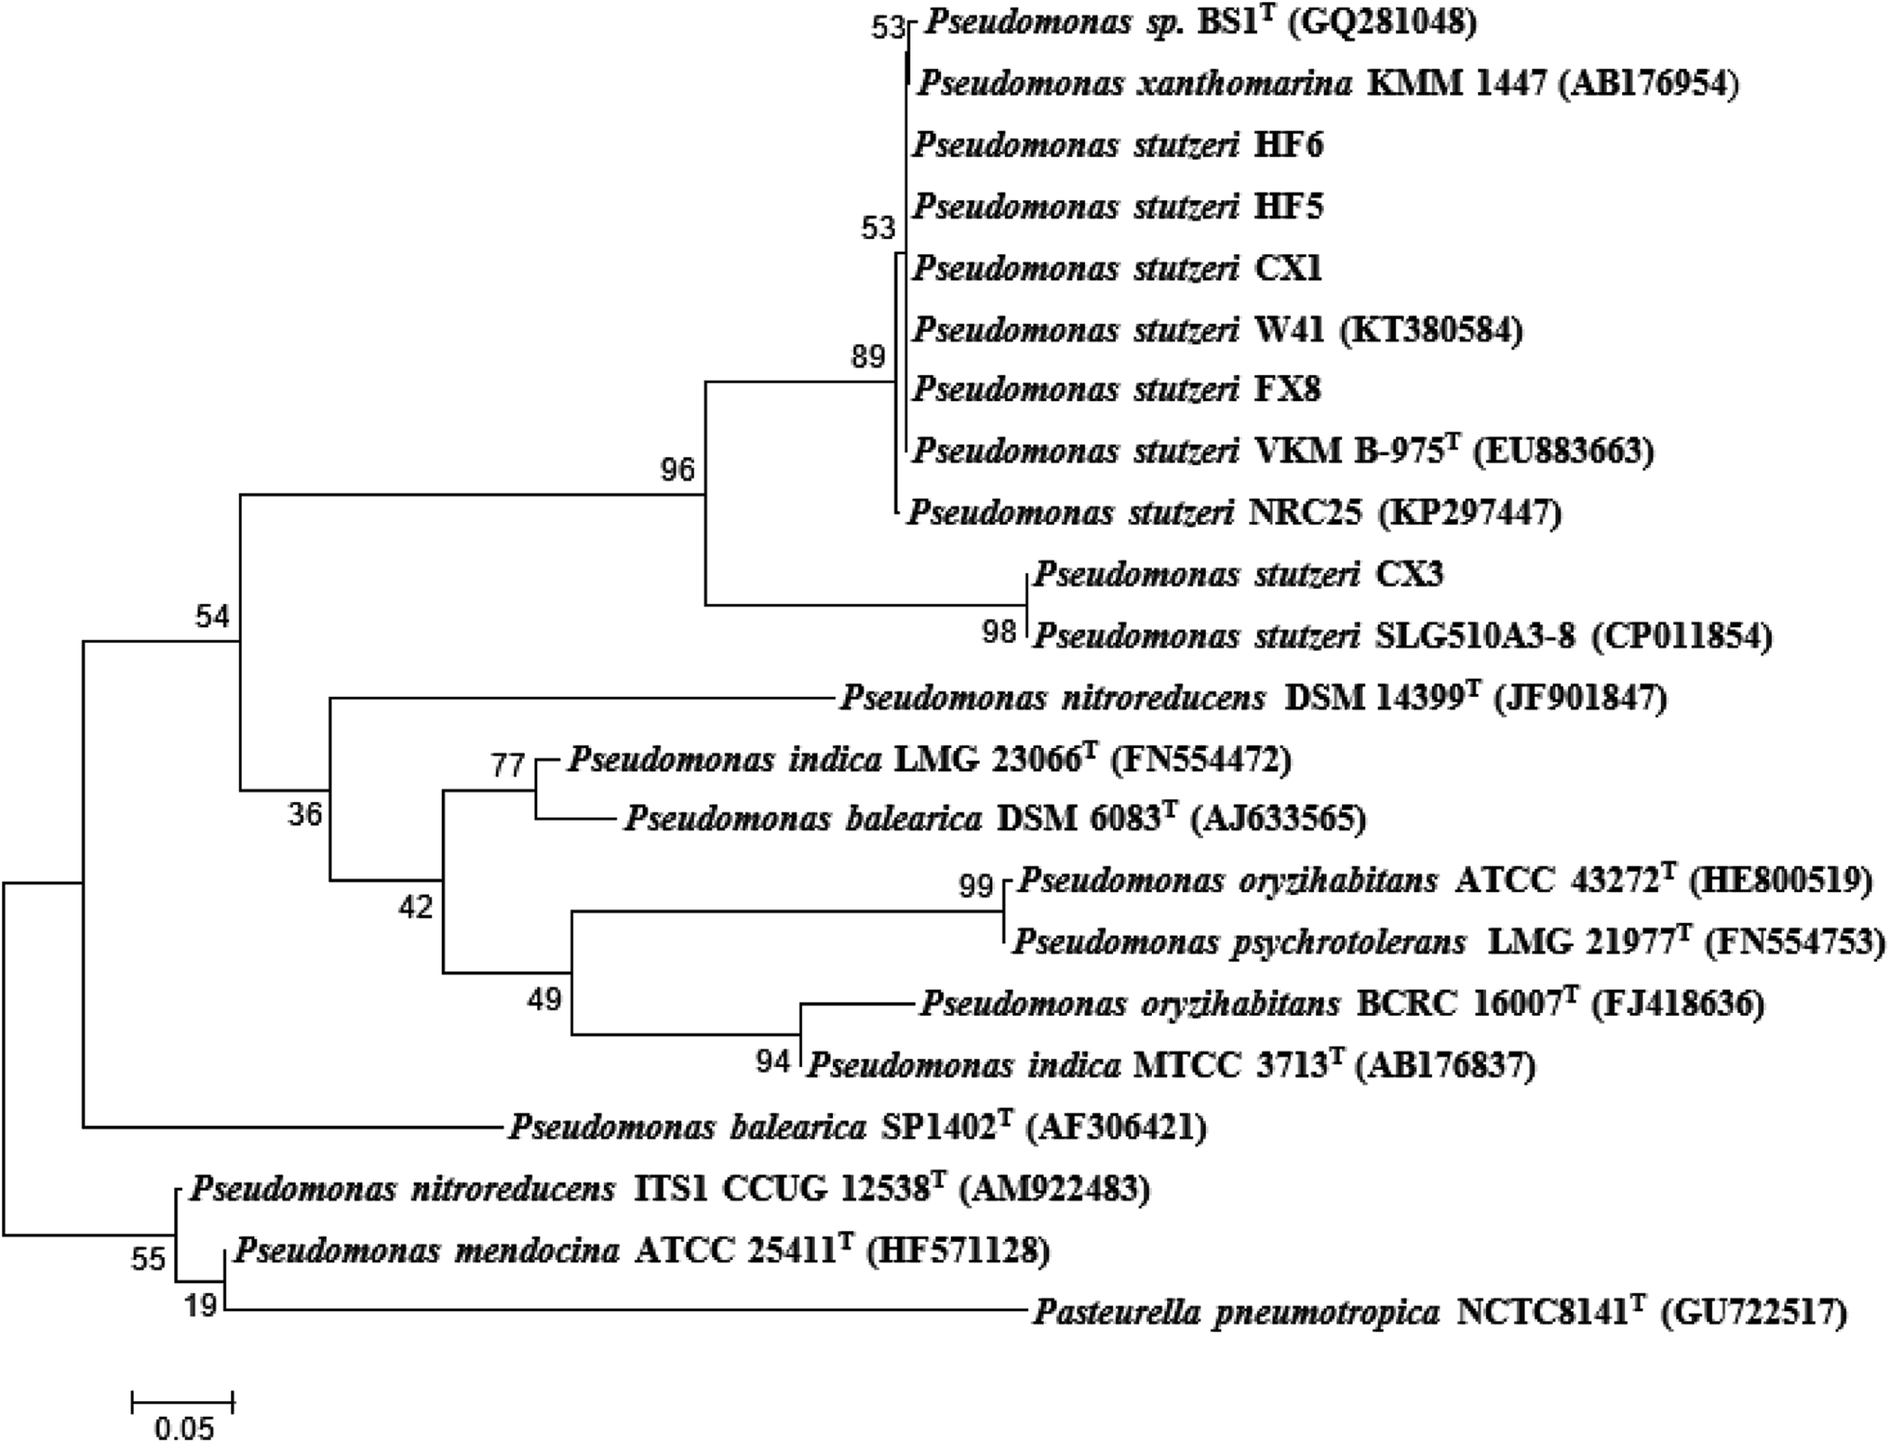 | ||
| Fig. 1 Phylogenetic tree of the isolated species from 16S rRNA gene sequences based on a neighbor-joining analysis of 1000 resampled datasets. The phylogenetic tree was constructed with MEGA 5.0 software based on the homologous 16S rDNA sequences. The GenBank accession numbers of reference species are listed in parentheses. | ||
3.2 Screening of biosurfactant-producing NRB
After 228 hours of incubation, cell-free broths were subjected to a parafilm test for screening of potential biosurfactant producers. The results are presented in ESI Fig. S1† and it can be seen that the producing medium 2 yielded more flattened droplets for the P. stutzeri strains. The possible biosurfactant-producing strains were P. stutzeri CX3, CX1 and FX8. As indicated in Fig. 2a, the surface tension and E24% of the cell free culture of the 5 isolates on the two media were listed. It was observed that only the culture of P. stutzeri CX3 exhibited surface reducing ability on the glycerol and glucose media and lowered the surface tension to around 30 mN m−1 (the dotted line in Fig. 2a indicates the surface tension of 40 mN m−1). Consistent with the results from the parafilm test, all the isolates showed lower surface tension when incubated in the producing medium 2.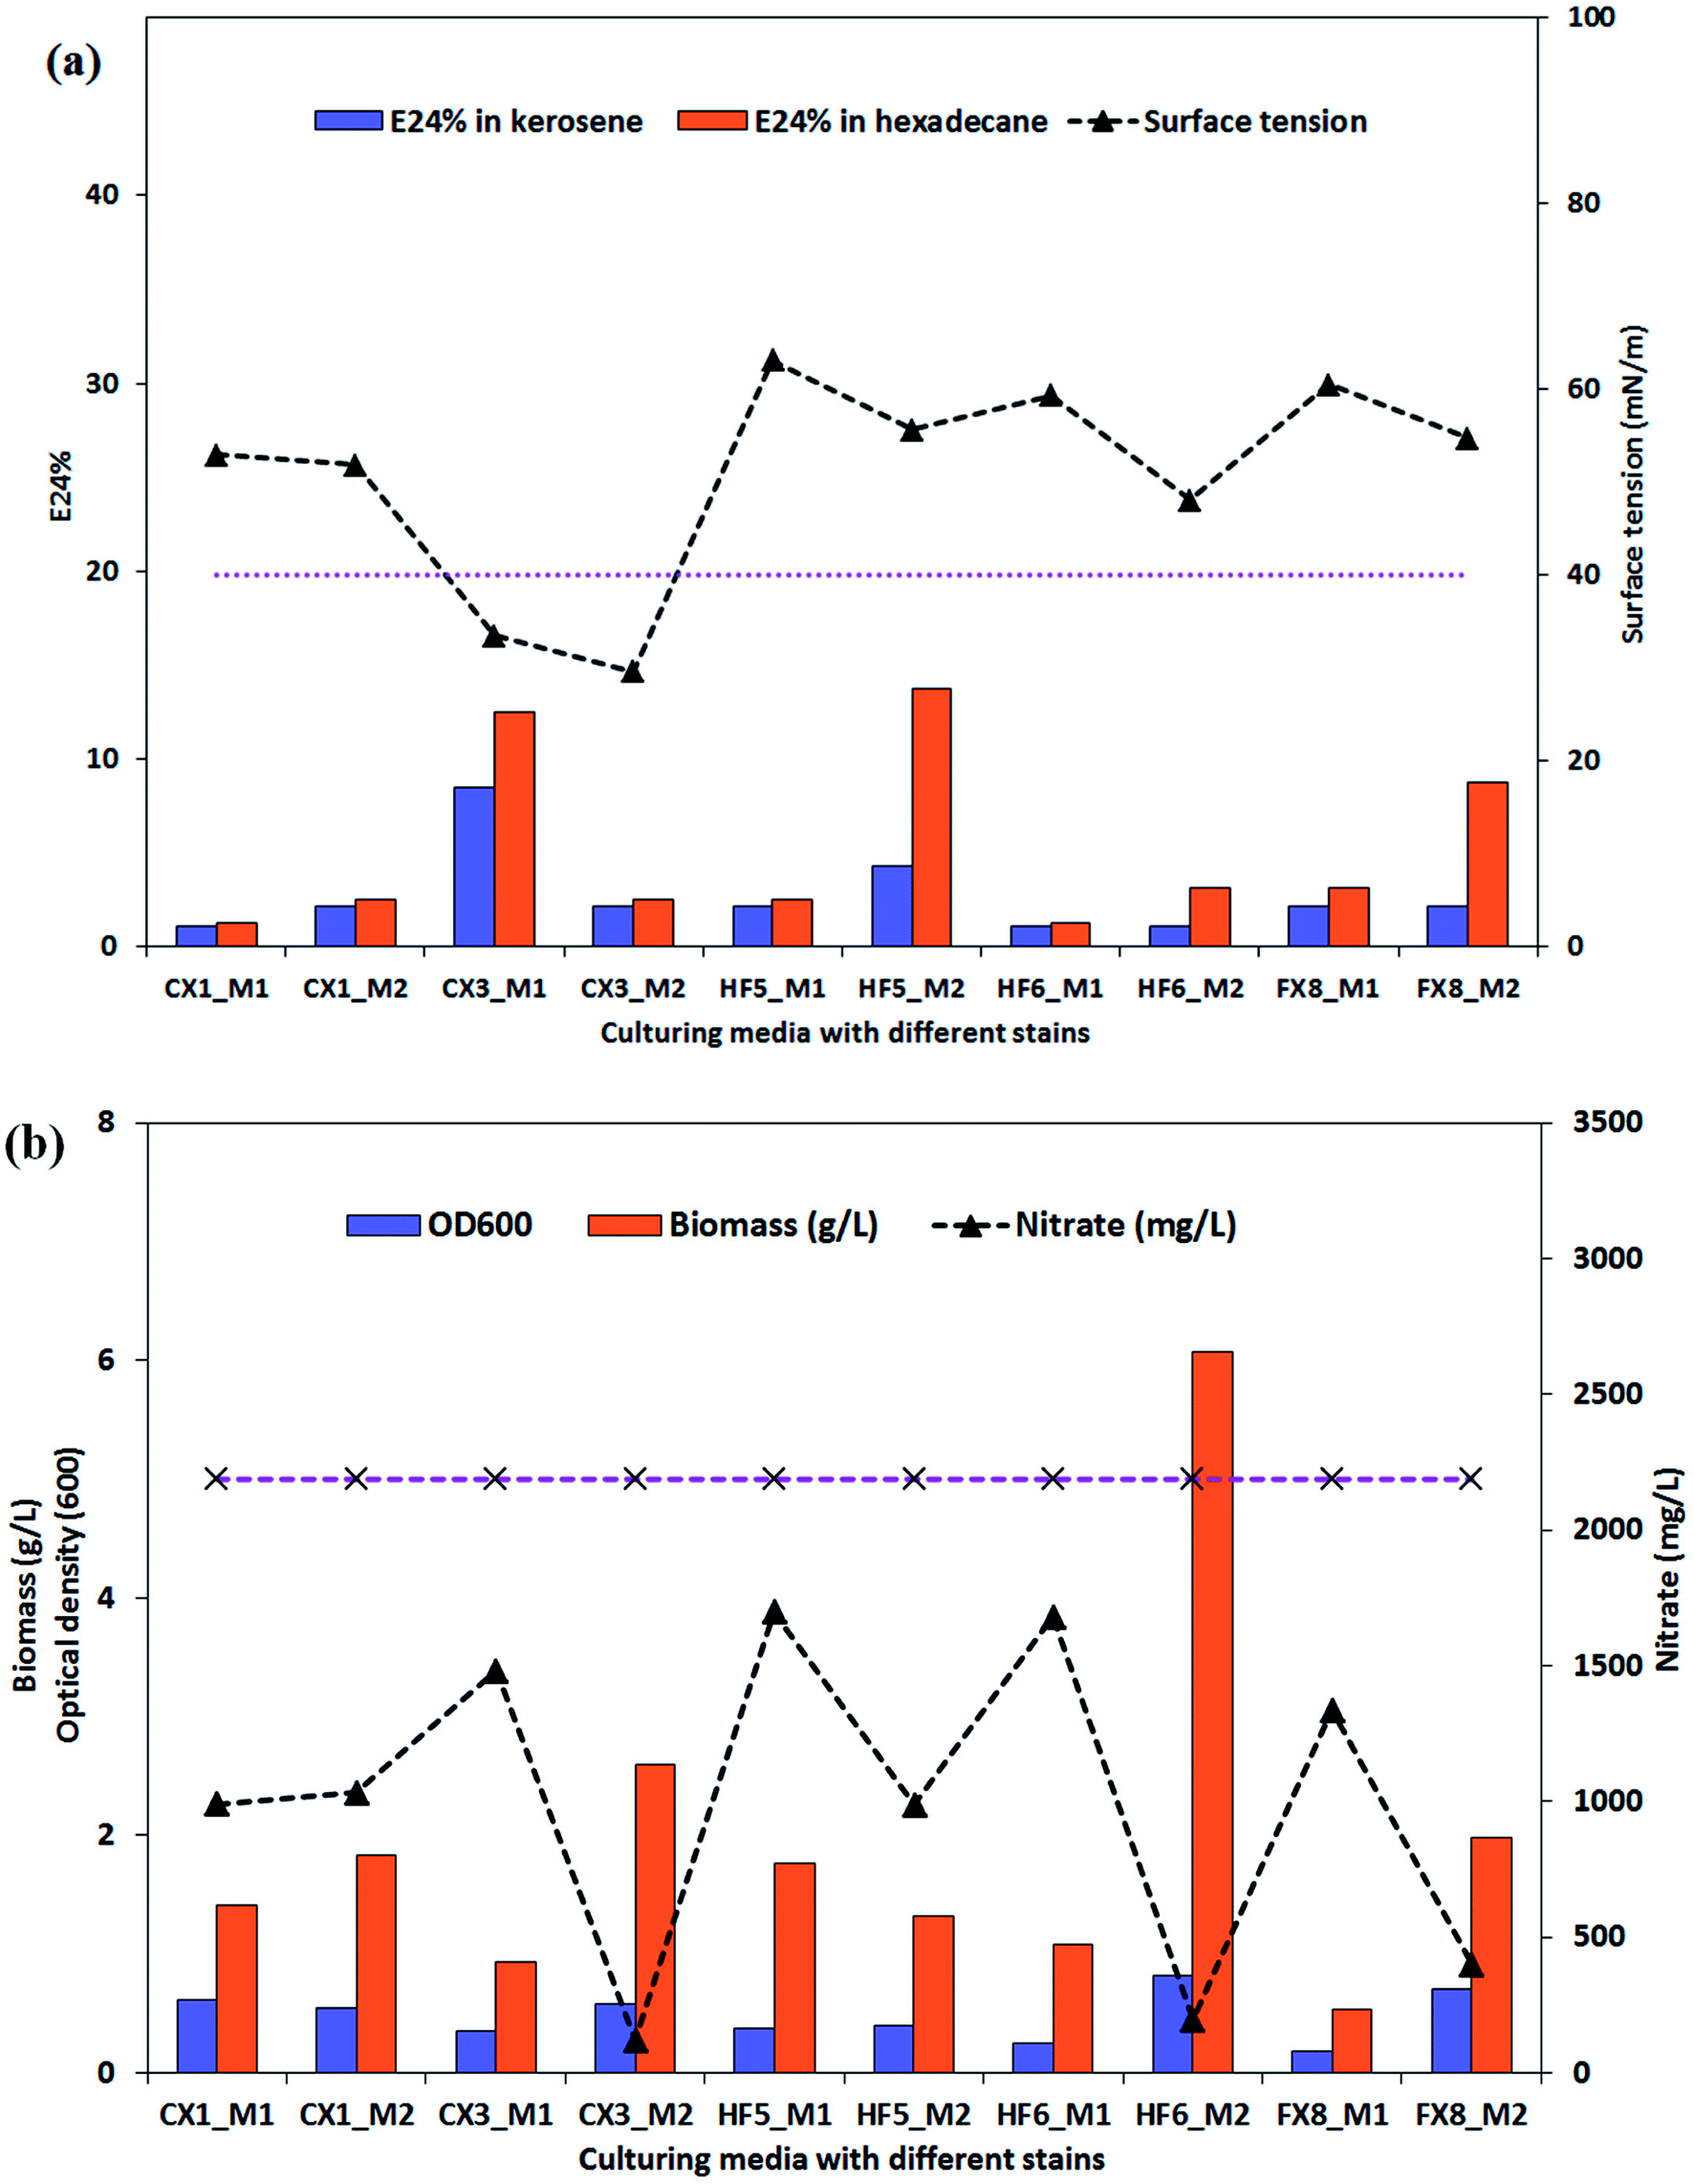 | ||
| Fig. 2 Evaluation parameters of the five Pseudomonas stutzeri strains in two growth media. Surface tension and E24% in kerosene and hexadecane were indicated in (a) while Biomass, OD600 and nitrate consumption were indicated in (b). All the tests were conducted in duplicate and the results were expressed as the average of two measurements. The analytical errors of the methodologies on all the parameters were below 7% and the accuracy was verified through 7 consecutive measurements of one sample. | ||
Although P. stutzeri HF5 presented the highest emulsification ability in hexadecane (13.8%) on producing medium 2, the NRB strains could not significantly emulsify n-hexadecane or kerosene. The biosurfactant-producing isolate CX3 showed very limited emulsification ability on production medium 2, which suggests that the capacity of biosurfactants for surface tension reduction was not necessarily correlated with emulsification capacity for forming and stabilizing emulsions. As surface active molecules, biosurfactants can form micelles at the interface of immiscible liquids by either reduction of surface and interfacial tension, or form stable emulsions between immiscible liquids.52 The former, which lowered surface and interfacial tensions, proved to be low-molecular-weight biosurfactants while the latter, which stabilized oil-in-water emulsions were more commonly high-molecular-weight ones and were referred as bioemulsifiers.53 The amphipathic biosurfactant product generated by isolate CX3 has limited emulsification potentials and are recognized as low-molecular-weight compounds.
The biomass production of the selected isolates and their nitrate consumption were also summarized in Fig. 2. The OD600 of broth samples was also used to evaluate the bacterial growth. As indicated by Fig. 2b, the OD600 values generally accorded with the biomass results, which was the measure of the dry weight of the bacterial cells (granular, flaky or flocculent) in the medium. For 4 of 5 strains, they consumed dramatically more nitrate when cultured on the producing medium 2, and among them CX3, HF6 and FX8 utilized 94.5%, 81.7% and 91.1% of the medium nitrate (the dotted line in Fig. 2b indicates the initial nitrate concentration) and yielded 2.6, 2.0 and 6.1g L−1 biomass by dry weight, respectively. This noticeable nitrate intake by microbes was attributed to nitrate respiration as the nitrate was utilized by bacteria as a terminal electron acceptor to maintain the redox balance (nitrate dissimilation) and as a nutrient (nitrate assimilation).54 Compared with other isolates, the extra nitrate intake in these three strains contributed to large bacterial growth while nitrate served as a nutrient (not electron acceptor) in nitrate assimilation in all media.
3.3 Biosurfactant production by NRB
From the phylogenetic results and the morphological characters of isolates, P. stutzeri CX3 exhibited differential performance when compared with other strains. Only P. stutzeri CX3, whose 16S rRNA sequence was deposited in Genbank under the accession number KY860630, showed significant surface-tension-lowering ability on the two biosurfactant producing media. As shown in Fig. 3a, the surface tension in culture broth gradually decreased to a plateau of around 34.0 mN m−1, while the nitrate concentration gradually decreased to a plateau of around 1500 mg L−1. The bacteria grew very fast during the initial 48 hours without a lag phase at a growth rate of 4.4 × 10⁶ CFU per mL per hour and reached their stationary phase after around 84 hours. The lack of adaption time in the bacterial growth may be due to the fact that NRB were pre-incubated for 48 h in the glucose medium. However, only 32.4% of the total nitrate in the medium was consumed over the study period.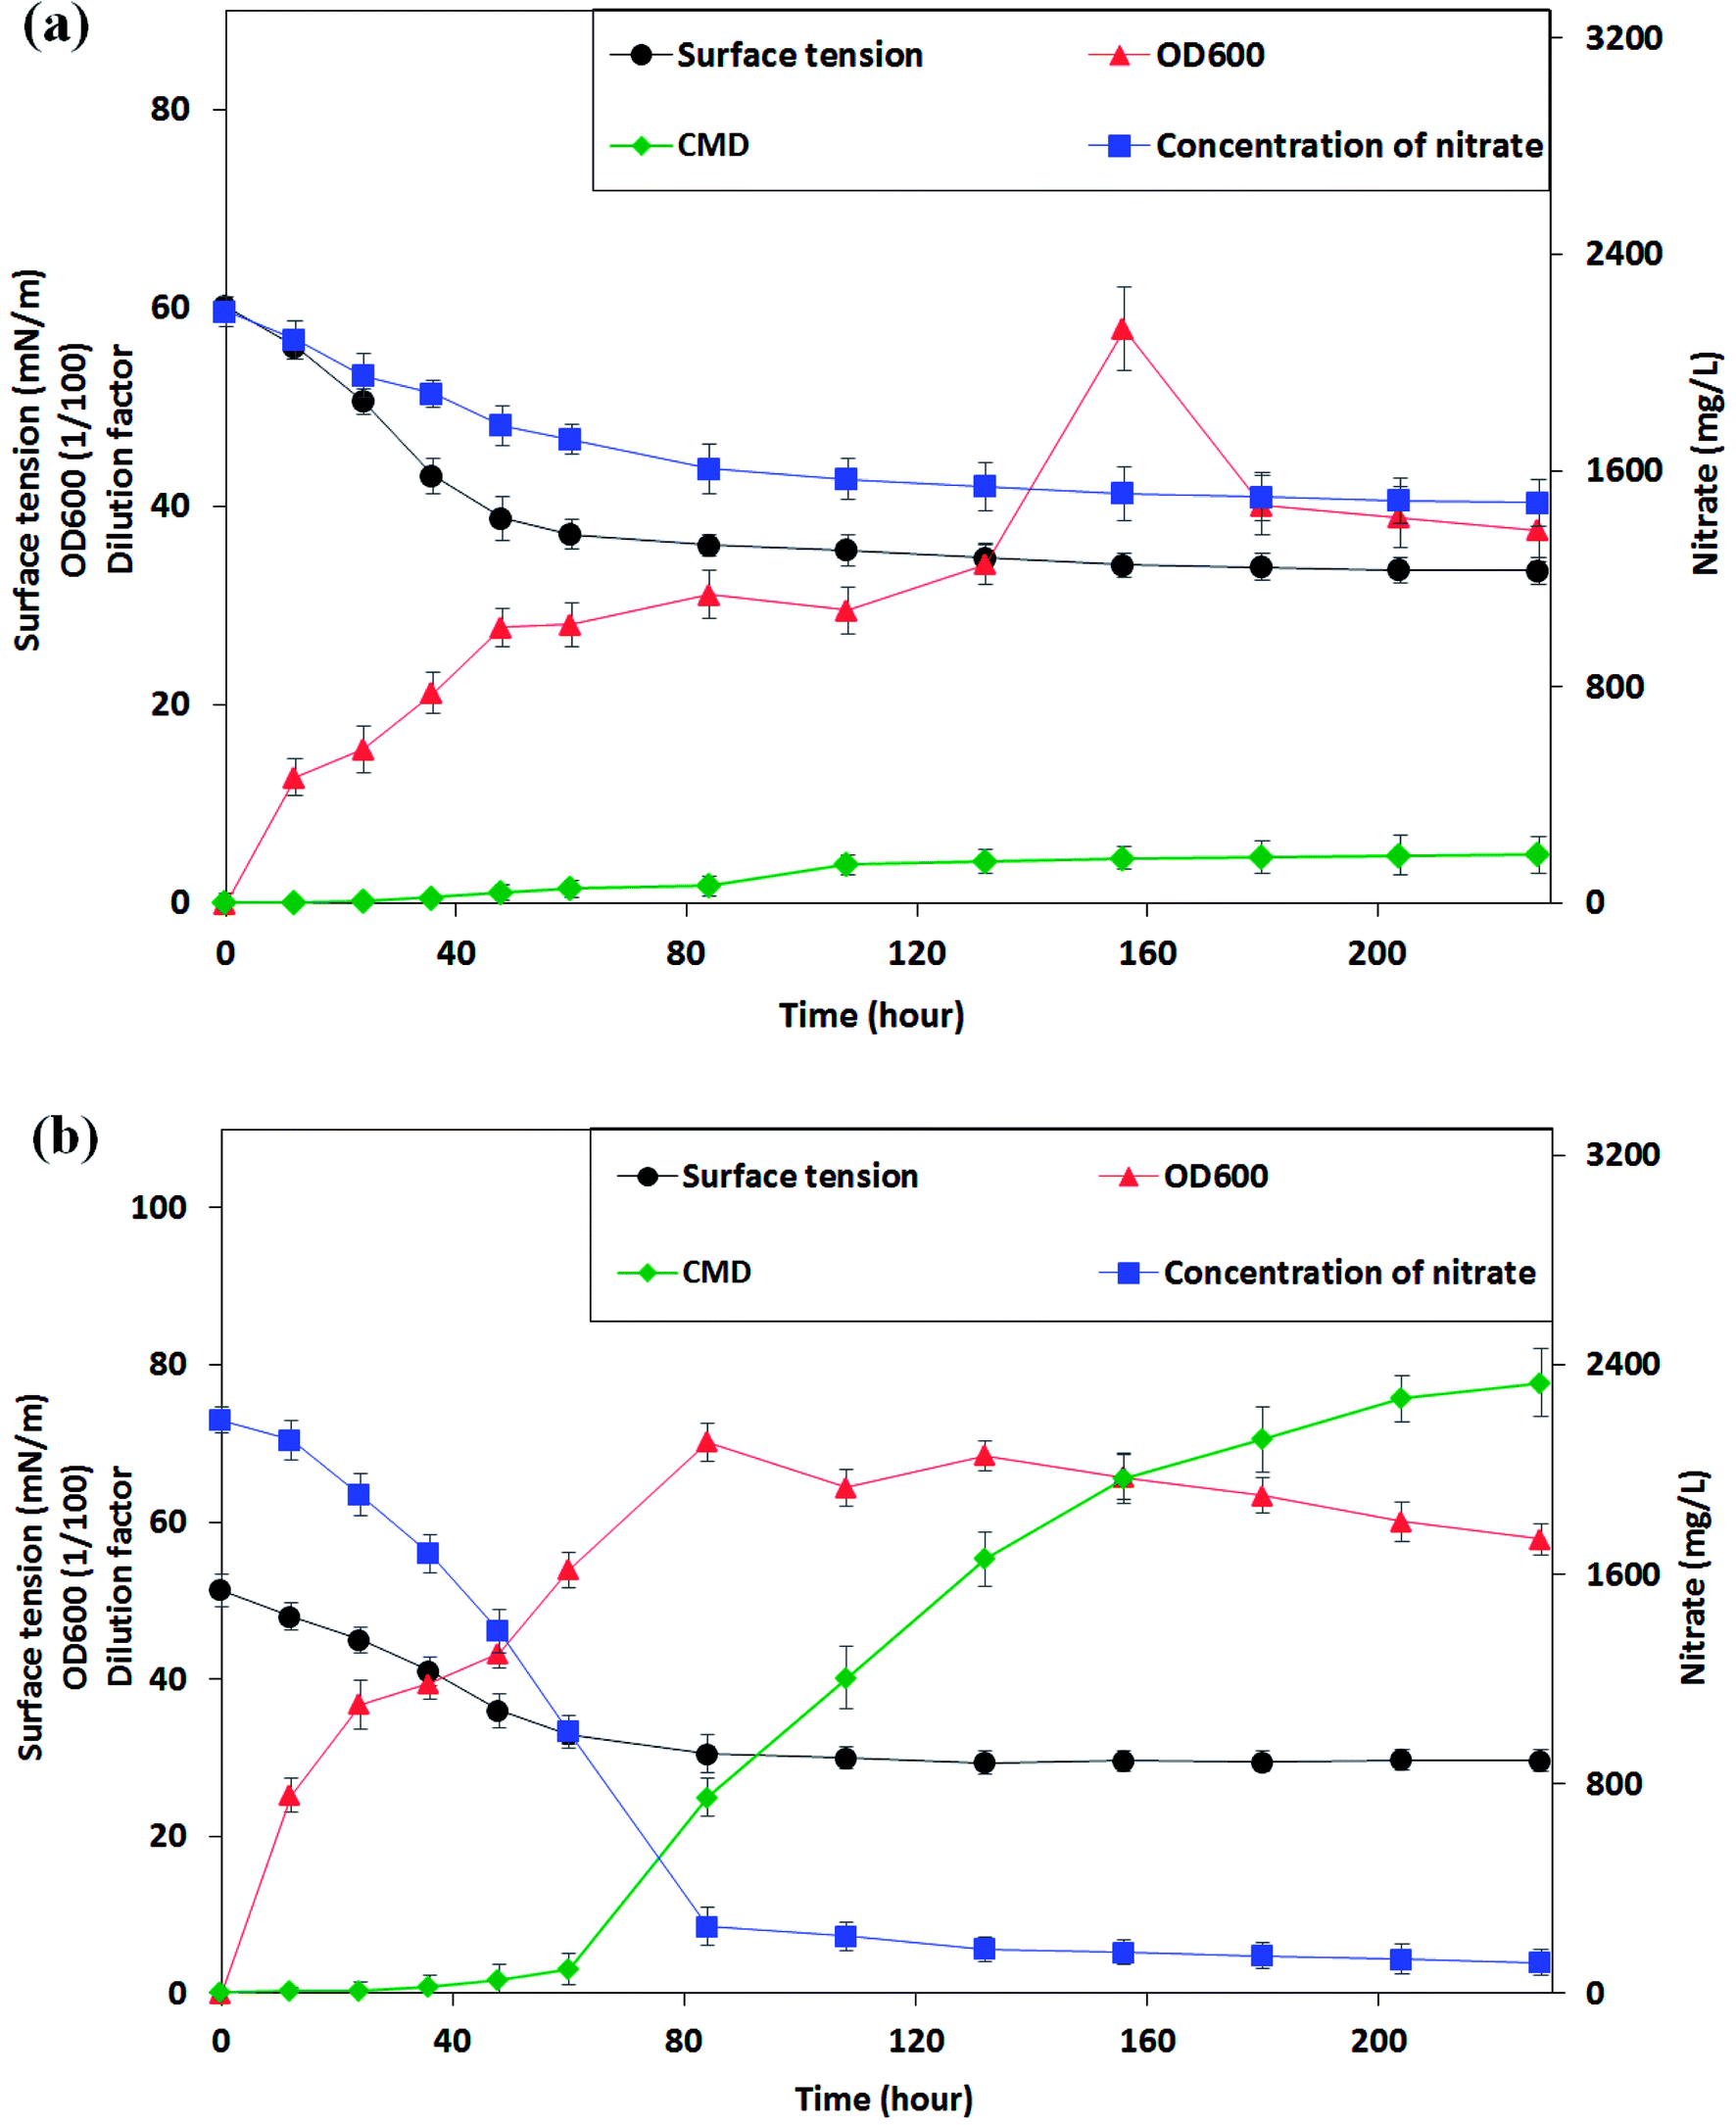 | ||
| Fig. 3 The changes of surface tension, cell growth and nitrate consumption of the Pseudomonas stutzeri CX3 on glucose (a) and glycerol (b) medium versus the incubation time. | ||
CX3 grown on producing medium 2 grew more vigorously and a final nitrate consumption rate of 94.5% reached after 228 hours of incubation. From Fig. 3b, it can be seen that the log phase of NRB growth was extended to 84 hours. The growth rate increased to 6.3 × 10⁶ CFU per mL per hour compared with its growth behavior in glucose medium. During the initial 84 hours, 88.3% of nitrate was consumed at a rate of 23.0 mg (L h)−1 and the biomass reached 0.702 Abs on glycerol medium. In contrast, only 26.6% of nitrate was consumed at a rate of 7.4 mg (L h)−1 when CX3 grew on glucose medium. Low accumulation rates of biosurfactants (0.023 and 0.049 CMC h−1 on medium 1 and 2, respectively) was observed on both of the two mediums within 60 hours when the nutrients of nitrate and substrates were mainly assimilated into body cells. However, the production rate of biosurfactants increased to 0.65 CMC h−1 between the time range of 60 h and 156 h on medium 2 although a low rate of 0.032 CMC h−1 was observed on medium 1 during this period. Interestingly, the results indicated that high-speed yield of biosurfactants starts from the last stage of high rate of biomass accumulation and nitrate consumption (60 h). The surface tension of the CX3 culture broth was finally lowered to 29.6 mN m−1. Zhao et al.33 constructed rhamnolipid-producing recombinant strain Pseudomonas stutzeri Rhl by cloning the rhamnosyltransferase gene rhlABRI from Pseudomonas aeruginosa SQ6 into a facultative anaerobic denitrifying bacterial strain Pseudomonas stutzeri DQ1. They utilized glycerol as carbon source for Pseudomonas stutzeri Rhl and similar surface tension (30.6 mNm−1) was obtained through anaerobically produced rhamnolipid.
3.4 Characterization of NRB-produced biosurfactants
After the extraction, the final concentrated biosurfactant product by P. stutzeri CX3 was with a yellow-brown colour. It could lower the surface tension of distilled water from 72.2 mN m−1 to 30.4 mN m−1. The biosurfactant product was further characterized and the stability under various environmental conditions was also examined to facilitate its potential use in the fields.| Components | Composition (%) |
|---|---|
| Hydrocarbons | 7.3 |
| Ethyl ketones | 0.7 |
| Triacylglycerols | 4.7 |
| Free fatty acids | 7.8 |
| Sterols | 1.0 |
| Acetone mobile polar lipids | 46.7 |
| Phospholipids | 31.9 |
| Fatty acids | Composition (%) | Fatty acids | Composition (%) |
|---|---|---|---|
| 14:0 | 2.3 | 17:0 | 0.3 |
| i15:0 | 2.0 | 17:1 | 3.3 |
| a15:0 | 13.8 | 18:0 | 1.4 |
| 15:0 | 0.2 | 18:1w11 | 0.1 |
| i16:0 | 5.5 | 18:1w9 | 1.0 |
| 16:0 | 15.8 | 18:1w7 | 20.2 |
| 16:1w11 | 0.3 | 18:1w6 | 0.2 |
| 16:1w7 | 11.7 | 18:1w5 | 0.2 |
| 16:1w5 | 11.2 | 18:2w6 | 1.2 |
| i17:0 | 1.7 | 18:3w3 | 1.9 |
| a17:0 | 5.3 | 20:1w9 | 0.1 |
| Phytanic acid | 0.2 | 22:0 | 0.02 |
| Saturated | 20.2 | PUFA | 3.1 |
| MUFA | 48.5 | Bacterial | 32.2 |
Further fatty acid profiles (Table 2) revealed that the fatty acids were mainly monounsaturated fatty acids (MUFA) and bacterial fatty acids (48.5% and 32.2%, respectively). Polyunsaturated fatty acids (PUFA) were found in very limited amount, accounting for only 3.1% of the total. The three most abundant fatty acids from the complex matrix were C18:1w7, C16:0 and a-C15:0, whereas the long-chain acids C16 and C18 contributed up to 70.9% of the total. This phenomenon can be attributed to their metabolic pathway during which the fatty acids were biosynthesized from the stepwise addition of two-carbon units derived from the building-block acetyl-coenzyme A (CoA) to a growing chain.59 During our experiments, the biosynthesis pathway is more relevant to the fatty acid compositions of products than the variations of carbon source. Similar results of fatty acid composition were obtained by Morita et al.34
![[double bond, length as m-dash]](https://www.rsc.org/images/entities/char_e001.gif) O amide I (1632.14 cm−1) and –NH/–CO combination of the amide II bands (1536.67 cm−1). However, just like the presence of phospholipids from lipid analysis results, it might be possible that the two bands at 1632.14 cm−1 and 1536.67 cm−1 resulted from polypeptides originated from cell debris co-precipitated with the biosurfactant product during the extraction process.28 The absorption peaks of 1035.63 and 1107.81 cm−1 were expected to be stretching C–O–C bonds, which indicated the presence of polysaccharide or polysaccharide-like substances in the biosurfactant product. The FTIR spectra provided strong evidence for the presence of glycolipids and lipopeptides in the isolated biosurfactant product.60,61
O amide I (1632.14 cm−1) and –NH/–CO combination of the amide II bands (1536.67 cm−1). However, just like the presence of phospholipids from lipid analysis results, it might be possible that the two bands at 1632.14 cm−1 and 1536.67 cm−1 resulted from polypeptides originated from cell debris co-precipitated with the biosurfactant product during the extraction process.28 The absorption peaks of 1035.63 and 1107.81 cm−1 were expected to be stretching C–O–C bonds, which indicated the presence of polysaccharide or polysaccharide-like substances in the biosurfactant product. The FTIR spectra provided strong evidence for the presence of glycolipids and lipopeptides in the isolated biosurfactant product.60,61
 | ||
| Fig. 4 FT-IR transmittance spectrum of the extracted biosurfactant product generated by Pseudomonas stutzeri CX3 grown on glycerol medium. | ||
The nitrate-reducing capacity of by P. stutzeri CX3 was closely correlated with the amount, kind and component of the biosurfactant product. Fig. 5 showed the FT-IR transmittance spectrum of the extracted biosurfactant products, nitrate consumption and dilution factor of biosurfactant products generated by P. stutzeri CX3 under various initial nitrate conditions. It was revealed that the absorption peaks around 700 cm−1 and 1250 cm−1, which indicated the existence of –CH2 group and –CO deformation vibrations, respectively,60 remained relatively stable under the four nitrate conditions. The absorption peaks around 3350 cm−1, which indicated the existence of stretching OH bonds and N–H bonds of protein, increased with the increased nitrate addition. This is attributed to the fact that sufficient nitrate addition promoted the bacterial growth and the generation of lipopeptides in the isolated biosurfactant products. However, excessive nitrate addition will inhibit the biosurfactant production. As indicated in Fig. 4 and 5e, NaNO3 concentrations at 3 g L−1 yielded the most abundant and diverse biosurfactant product. Interestingly, the final nitrate concentration all reached around 140 mg L−1 regardless of the initial concentrations. Nitrate concentration significantly affected the final proportion of glycolipids and lipopeptides in the isolated biosurfactant product and the associated productivity.
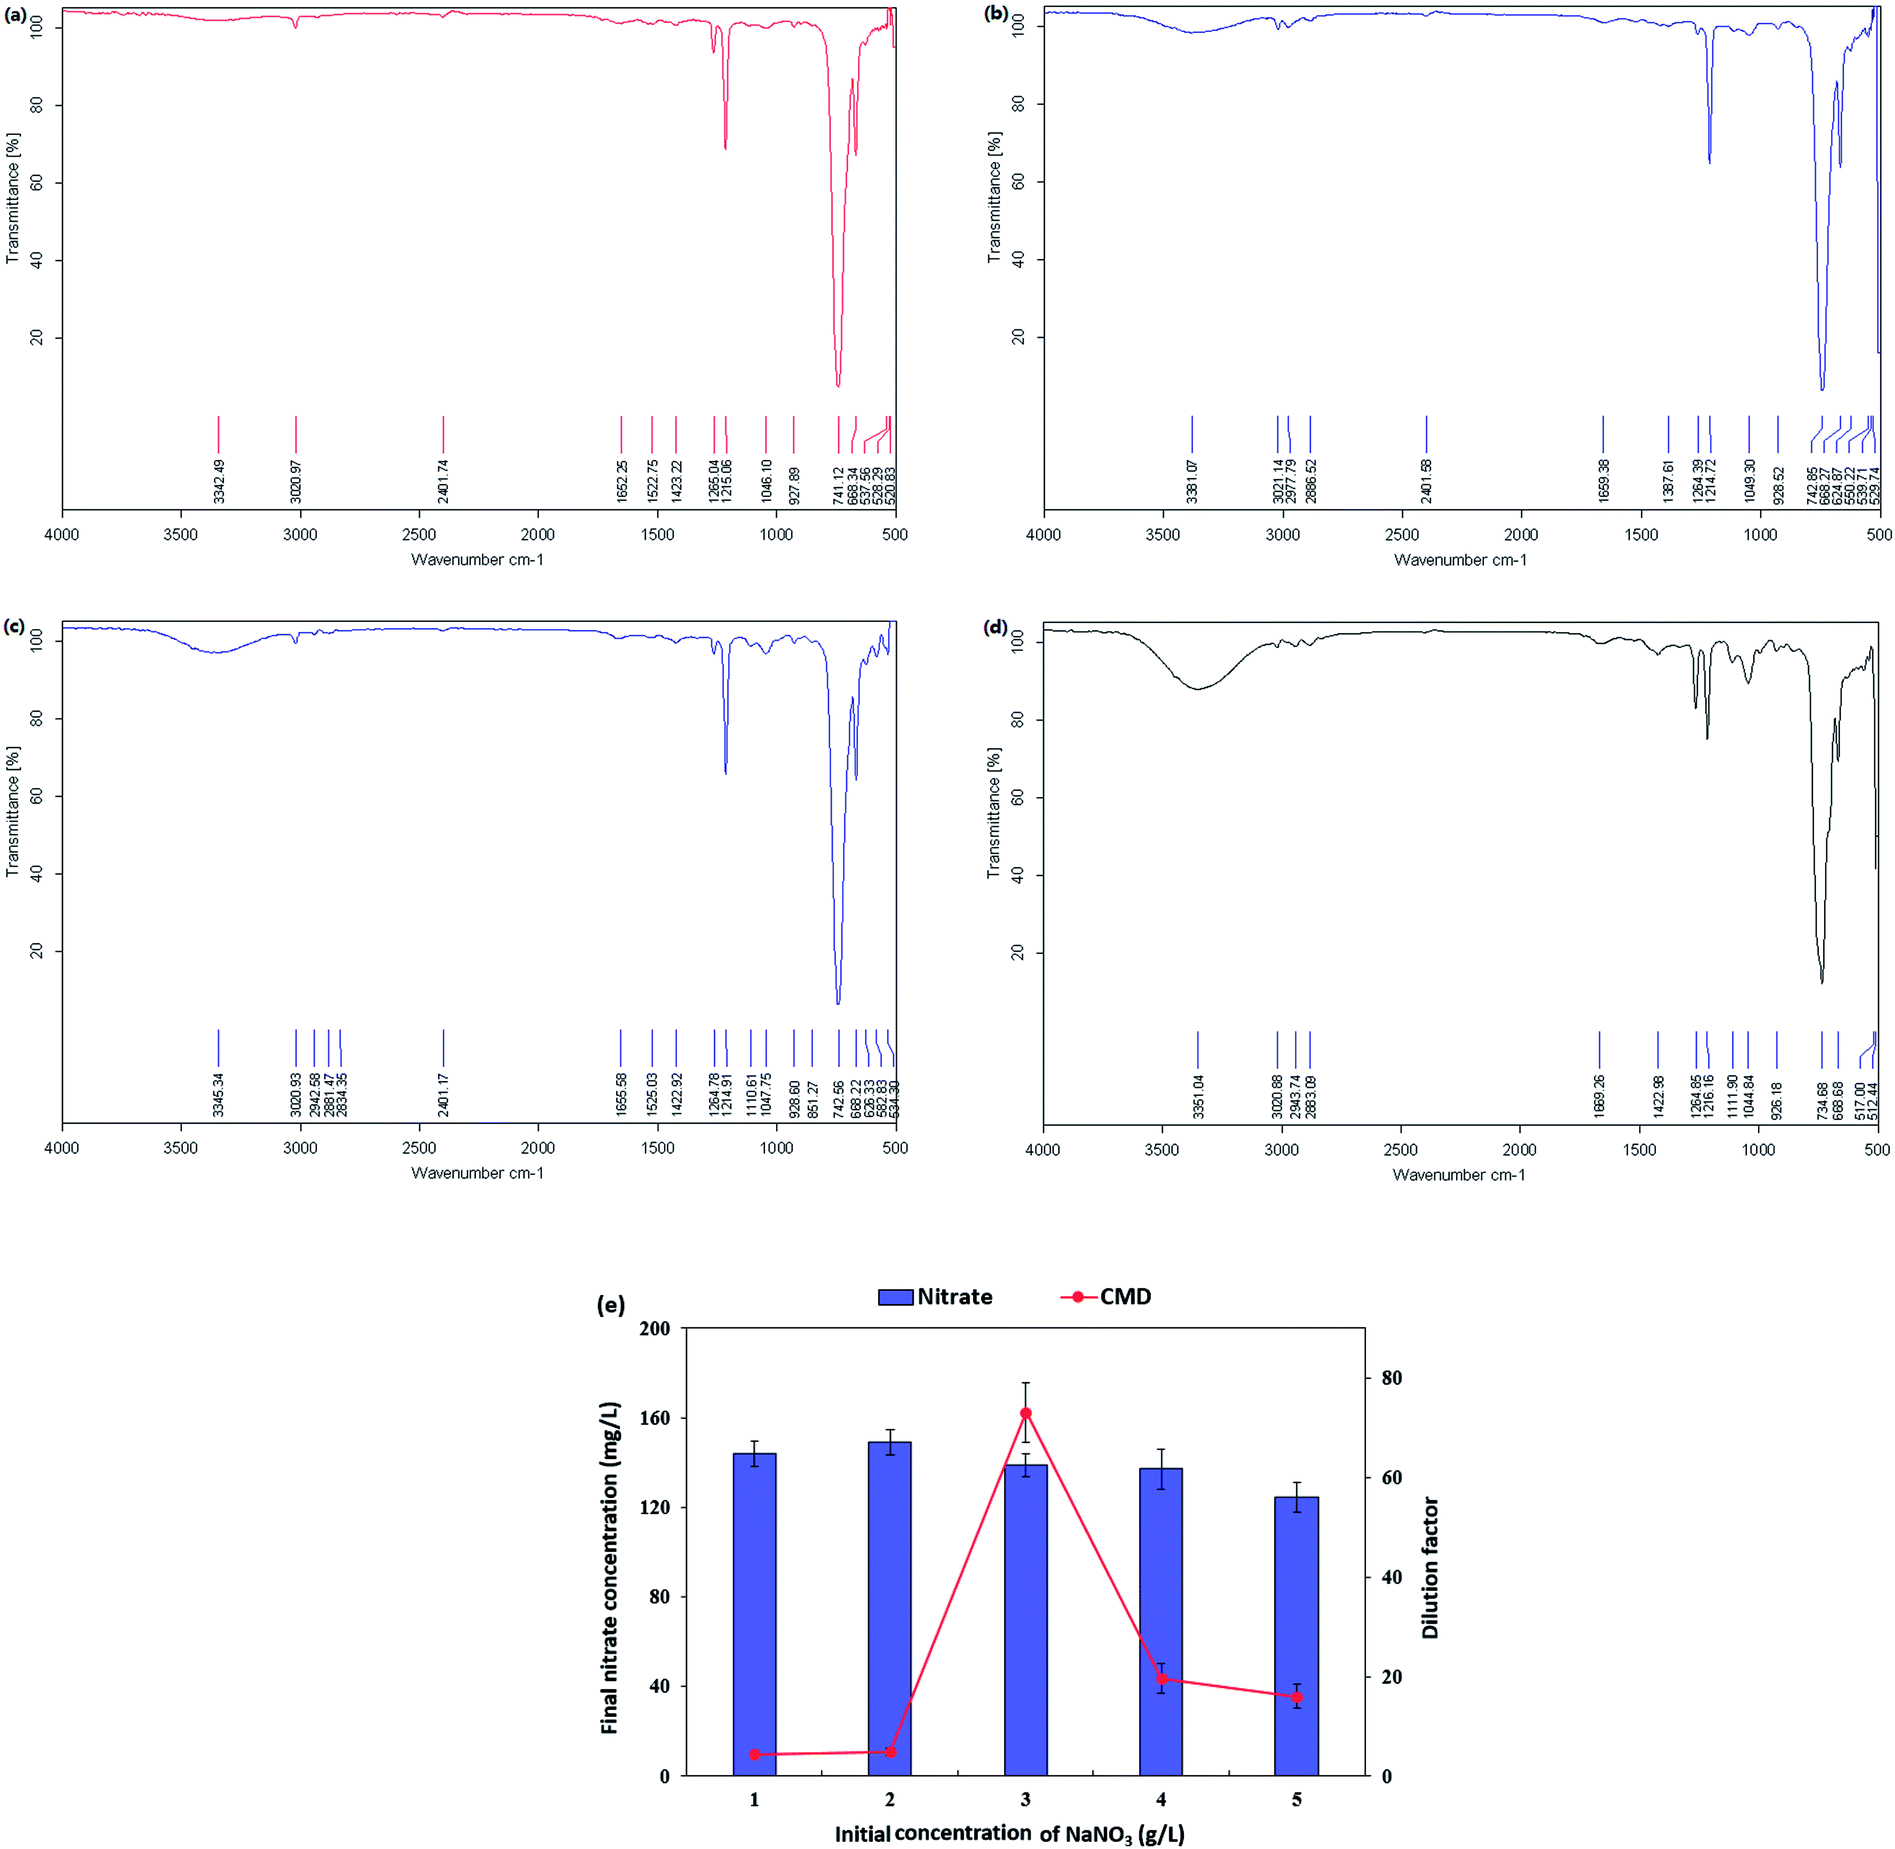 | ||
| Fig. 5 FT-IR transmittance spectrum of the extracted biosurfactant products, nitrate consumption and dilution factor of biosurfactant products generated by Pseudomonas stutzeri CX3 under various nitrate conditions. (a) NaNO3 at 1 g L−1; (b) NaNO3 at 2 g L−1; (c) NaNO3 at 4 g L−1; (d) NaNO3 at 5 g L−1; (e) nitrate consumption and dilution factor of biosurfactant products. | ||
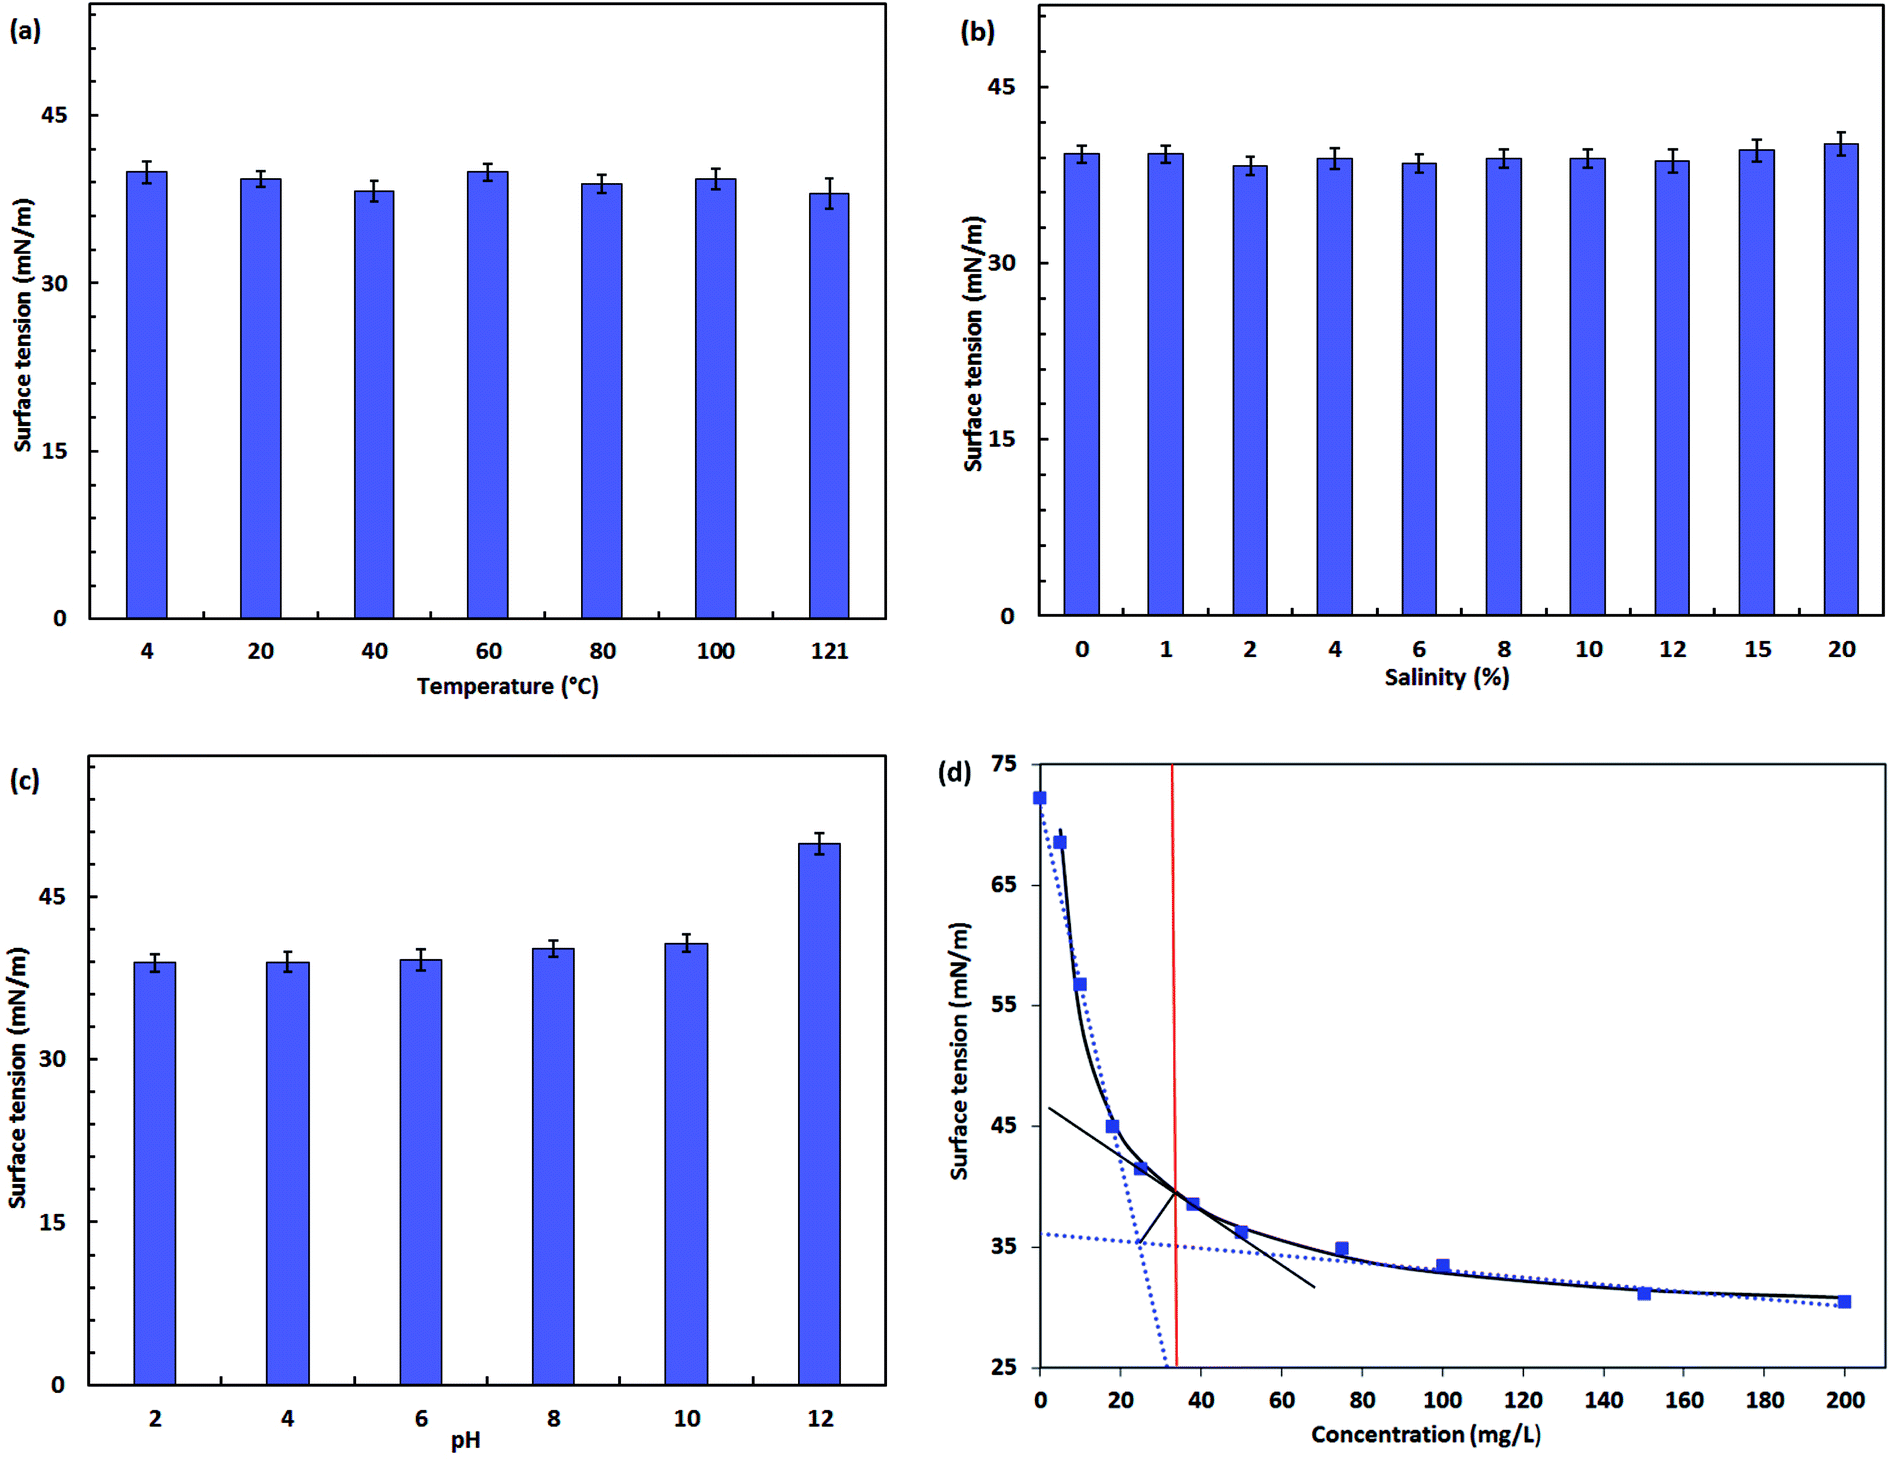 | ||
| Fig. 6 Stability of the biosurfactant product produced by Pseudomonas stutzeri CX3 under various environmental conditions. (a) Temperature; (b) salinity; (c) pH; (d) critical micelle concentration (CMC) of the biosurfactant at 35 mg L−1. | ||
From Fig. 6b, negligible changes were observed in the increased concentration of NaCl up to 20% (w/v). Electrolytes in the bulk solutions will shield the carboxylate groups of the rhamnolipid molecules, causing them to behave more like nonionic than anionic surfactants.66 Although a relatively lower surface tension was obtained at 2% NaCl concentration, the differences over the wide brine concentration levels of 0 to 20% were not significant (<5%). The steady performance of surface tension in salty waters allows the product to be potentially used in reservoir microbial enhanced oil recovery (MEOR) or environmental bioremediations under saline environments. For instance, Singh and Tripathi67 isolated a strain of Pseudomonas stutzeri from the formation water of an Indian coalbed and the isolate produced a copious amount of biosurfactant with the supplementation of coal. The biosurfactant with rhamnolipid nature showed great potential for in situ biotransformation of coal into methane and bioremediation of PAH-contaminated sites.
The surface activity of biosurfactant solution remained relatively stable between pH 2 and 10. A negative biosurfactant performance was observed at pH 12 in which the surface tension raised to 49.9 mN m−1. This detrimental effect is possibly caused by structure alteration of the biosurfactant product under extreme pH conditions. The polar head of anionic rhamnolipids was more negatively charged under more alkaline conditions.38 This is reflected by the fact of increased solubility of the product.
As amphiphilic molecules released extracellularly by microorganisms, biosurfactants are known to be beneficial for their producers in various ways. By promoting wetting, solubilization and emulsification of various types of organics, biosurfactants could increase the surface area between the oil and water phases, thereby increasing the bioavailability of entrapped oil in the porous media.17 Thus, biosurfactants could improve the nutrient conditions of NRB producers and enhance the competence of NRB towards SRB. Additionally, several biosurfactants proved to have antibiotic effects,14 which may have the potential to inhibit the growth of SRB. Moreover, biosurfactants were found to be important agents in the connection between microbial communities and biofilm formations,68 which may synergistically improve the resistance of the NRB producers to harsh environment. Therefore, the generated biosurfactant product, once injected into the soured reservoir externally, has great potential to assist NRB outcompeted SRB through these mechanisms. The effects of NRB produced biosurfactants in offshore reservoir NRB/SRB interactions, coupled with other environmental implications of this product, need to be further investigated.
4. Conclusions
In this study, the offshore petroleum-reservoir brines following nitrate/nitrite injection were used for the anaerobic screening of biosurfactant producing NRB. After periodic enrichment and sophisticated screening of the microorganisms, five typical denitrifying strains were isolated and found to be the species of Pseudomonas stutzeri according to their 16S rRNA sequencing results. The isolates were further screened for possible biosurfactant producers on glycerol and glucose media. The strain P. stutzeri CX3 was confirmed with biosurfactant production capacity through a series of biosurfactant characterization tests (e.g. drop collapsing test, parafilm test and surfaced tension determination). Better surface tension lowering ability was observed from the glycerol medium and the consumption of nitrate by NRB was found in positive correlation with bacterial growth and surface tension reduction. CX3 was selected to further demonstrate the performance of biosurfactant production through two production media over a 228 hour monitoring. The nitrate concentrations and surface tensions on the two media were both reduced to a relatively stable level within 84 hours during which OD600 reached relatively high levels as well over the period. The biosurfactant produced by P. stutzeri CX3 was defined with a CMC as low as 35 mg L−1, and further characterized by TLC, GC-FID and FT-IR analysis. The main components of the biosurfactant product were recognized as glycolipids. The biosurfactant product demonstrated stable performance during different environmental conditions with a wide range of temperature, pH values, and saline environment and have potential applications in environmental bioremediation, petroleum and other various industrial fields. The successful isolation and identification of biosurfactant producing nitrate-reducing bacterium from laborious screenings on offshore reservoir samples, coupled with subsequent biosurfactant characterization would provide new insight into NRB/SRB interactions for offshore reservoir souring control investigations.Conflicts of interest
The authors declare no conflict of interest.Acknowledgements
The authors would like to express the gratitude to Suncor Energy Inc. for their financial support.References
- D. Xu, J. Wen, T. Gu and I. Raad, Corrosion, 2012, 68(11), 994–1002 CrossRef.
- C. Hubert and G. Voordouw, Appl. Environ. Microbiol., 2007, 73(8), 2644–2652 CrossRef PubMed.
- C. Okoro, S. Smith, L. Chiejina, R. Lumactud, D. An, H. S. Park, J. Voordouw, B. P. Lomans and G. Voordouw, J. Ind. Microbiol. Biotechnol., 2014, 41(4), 665–678 CrossRef PubMed.
- C. Hubert, M. Nemati, G. Jenneman and G. Voordouw, Appl. Microbiol. Biotechnol., 2005, 68(2), 272–282 CrossRef PubMed.
- A. A. Grigoryan, S. L. Cornish, B. Buziak, S. Lin, A. Cavallaro, J. J. Arensdorf and G. Voordouw, Appl. Environ. Microbiol., 2008, 74(14), 4324–4335 CrossRef PubMed.
- S. An, K. Tang and M. Nemati, Water Res., 2010, 44(5), 1531–1541 CrossRef PubMed.
- A. Grigoryan, A. Lambo, S. Lin, S. L. Cornish, T. R. Jack and G. Voordouw, J. Can. Pet. Technol., 2009, 48(05), 58–61 CrossRef.
- S. L. Shartau, M. Yurkiw, S. Lin, A. A. Grigoryan, A. Lambo, H. S. Park, B. P. Lomans, E. van der Biezen, M. S. Jetten and G. Voordouw, Appl. Environ. Microbiol., 2010, 76(15), 4977–4987 CrossRef PubMed.
- B. Dunsmore, J. Youldon, D. R. Thrasher and I. Vance, J. Ind. Microbiol. Biotechnol., 2006, 33(6), 454–462 CrossRef PubMed.
- J. Larsen, M. H. Rod and S. Zwolle, Prevention of Reservoir Souring in the Halfdan Field by Nitrate Injection, in NACE International, Corrosion 2004, Houston, TX, 2004 Search PubMed.
- E. A. Greene, C. Hubert, M. Nemati, G. E. Jenneman and G. Voordouw, Environ. Microbiol., 2003, 5(7), 607–617 CrossRef PubMed.
- M. B. Rothenberger, J. M. Burkholder and C. Brownie, Environ. Manage., 2009, 44(3), 505–523 CrossRef PubMed.
- L. M. Gieg, T. R. Jack and J. M. Foght, Appl. Microbiol. Biotechnol., 2011, 92(2), 263–282 CrossRef PubMed.
- L. Rodrigues, I. M. Banat, J. Teixeira and R. Oliveira, J. Antimicrob. Chemother., 2006, 57(4), 609–618 CrossRef PubMed.
- D. Ghribi, L. Abdelkefi-Mesrati, I. Mnif, R. Kammoun, I. Ayadi, I. Saadaoui, S. Maktouf and S. Chaabouni-Ellouze, J. Biomed. Biotechnol., 2012, 2012, 373682 Search PubMed.
- C. N. Mulligan, Environ. Pollut., 2005, 133(2), 183–198 CrossRef PubMed.
- M. Pacwa-Plociniczak, G. A. Plaza, Z. Piotrowska-Seget and S. S. Cameotra, Int. J. Mol. Sci., 2011, 12(1), 633–654 CrossRef PubMed.
- R. D. Fallon, L. L. Hnatow, S. C. Jackson and S. J. Keeler. Method for identification of novel anaerobic denitrifying bacteria utilizing petroleum components as sole carbon source, US pat. 20100044031 A1, Feb 25, 2010 Search PubMed.
- E. Z. Ron and E. Rosenberg, Curr. Opin. Biotechnol., 2002, 13(3), 249–252 CrossRef PubMed.
- N. Christofi and I. B. Ivshina, J. Appl. Microbiol., 2002, 93(6), 915–929 CrossRef PubMed.
- A. Grabowski, O. Nercessian, F. Fayolle, D. Blanchet and C. Jeanthon, FEMS Microbiol. Ecol., 2005, 54(3), 427–443 CrossRef PubMed.
- S. N. Al-Bahry, A. E. Elshafie, Y. M. Al-Wahaibi, A. S. Al-Bemani, S. J. Joshi and A. Al-Lawati, APCBEE Proc., 2013, 5, 242–246 CrossRef.
- Y. H. She, F. Zhang, J. J. Xia, S. Q. Kong, Z. L. Wang, F. C. Shu and J. M. Hu, Appl. Biochem. Biotechnol., 2011, 163(2), 223–234 CrossRef PubMed.
- D. R. Simpson, N. R. Natraj, M. J. McInerney and K. E. Duncan, Appl. Microbiol. Biotechnol., 2011, 91(4), 1083–1093 CrossRef PubMed.
- J. Wang, G. Ji, J. Tian, H. Zhang, H. Dong and L. Yu, Pet. Sci., 2011, 8(3), 353–356 CrossRef.
- N. Youssef, D. R. Simpson, K. E. Duncan, M. J. McInerney, M. Folmsbee, T. Fincher and R. M. Knapp, Appl. Environ. Microbiol., 2007, 73(4), 1239–1247 CrossRef PubMed.
- E. J. Gudiña, J. F. B. Pereira, L. R. Rodrigues, J. A. P. Coutinho and J. A. Teixeira, Int. Biodeterior. Biodegrad., 2012, 68, 56–64 CrossRef.
- T. B. Lotfabad, M. Shourian, R. Roostaazad, A. R. Najafabadi, M. R. Adelzadeh and K. A. Noghabi, Colloids Surf., B, 2009, 69(2), 183–193 CrossRef PubMed.
- V. Pruthi and S. S. Cameotra, J. Surfactants Deterg., 2003, 6(1), 65–68 CrossRef.
- Q. Cai, B. Zhang, B. Chen, X. Song, Z. Zhu and T. Cao, Environ. Monit. Assess., 2015, 187(5), 284 CrossRef PubMed.
- L. Hui, M. Ai, S. Han, Y. Guo, N. Li, R. Shi, X. Zeng, S. Leng, J. Zhao, X. Liu and Y. Zhang, Pet. Sci., 2012, 9(4), 469–484 CrossRef.
- D. Gevertz, A. J. Telang, G. Voordouw and G. E. Jenneman, Appl. Environ. Microbiol., 2000, 66(6), 2491–2501 CrossRef PubMed.
- F. Zhao, M. Mandlaa, J. Hao, X. Liang, R. Shi, S. Han and Y. Zhang, Lett. Appl. Microbiol., 2014, 59(2), 231–237 CrossRef PubMed.
- T. Morita, M. Konishi, T. Fukuoka, T. Imura and D. Kitamoto, Appl. Microbiol. Biotechnol., 2007, 74(2), 307–315 CrossRef PubMed.
- N. H. Youssef, K. E. Duncan, D. P. Nagle, K. N. Savage, R. M. Knapp and M. J. McInerney, J. Microbiol. Methods, 2004, 56(3), 339–347 CrossRef PubMed.
- R. Safari, A. Motamedzadegan, M. Ovissipour, J. M. Regenstein, A. Gildberg and B. Rasco, Food Bioprocess Technol., 2012, 5(1), 73–79 CrossRef.
- R. Gopalan, A. Anad and R. W. Sugumar, Nitrate Nitrogen Brucine Method, in A Laboratory Manual for Environmental Chemistry, I.K. International Publishing House Pvt. Ltd., New Delhi, Bangalore, 2005, pp. 44–45 Search PubMed.
- S. N. Silva, C. B. Farias, R. D. Rufino, J. M. Luna and L. A. Sarubbo, Colloids Surf., B, 2010, 79(1), 174–183 CrossRef PubMed.
- D. W. de Oliveira, I. W. Franca, A. K. Felix, J. J. Martins, M. E. Giro, V. M. Melo and L. R. Goncalves, Colloids Surf., B, 2013, 101, 34–43 CrossRef PubMed.
- C. C. Parrish, Determination of Total Lipid, Lipid Classes, and Fatty Acids in Aquatic Samples, in Lipids in Freshwater Ecosystems, ed. M. T. Arts and B. C. Wainman, Springer New York, New York, NY, 1999, pp. 4–20 Search PubMed.
- M. Heyd, A. Kohnert, T. H. Tan, M. Nusser, F. Kirschhofer, G. Brenner-Weiss, M. Franzreb and S. Berensmeier, Anal. Bioanal. Chem., 2008, 391(5), 1579–1590 CrossRef PubMed.
- M. Abouseoud, A. Yataghene, A. Amrane and R. Maachi, J. Ind. Microbiol. Biotechnol., 2008, 35(11), 1303–1308 CrossRef PubMed.
- A. Marietou, L. Griffiths and J. Cole, J. Bacteriol., 2009, 191(3), 882–889 CrossRef PubMed.
- J. Foriel, P. Philippot, P. Rey, A. Somogyi, D. Banks and B. Ménez, Earth Planet. Sci. Lett., 2004, 228(3), 451–463 CrossRef.
- Y. Zheng, Z.-L. Ye, X.-L. Fang, Y.-H. Li and W.-M. Cai, Bioresour. Technol., 2008, 99(16), 7686–7691 CrossRef PubMed.
- H. Salehizadeh and S. A. Shojaosadati, Biotechnol. Adv., 2001, 19(5), 371–385 CrossRef PubMed.
- S. R. Andrietta, C. Steckelberg and M. d. G. S. Andrietta, Bioresour. Technol., 2008, 99(8), 3002–3008 CrossRef PubMed.
- J. Lalucat, A. Bennasar, R. Bosch, E. Garcia-Valdes and N. J. Palleroni, Microbiol. Mol. Biol. Rev., 2006, 70(2), 510–547 CrossRef PubMed.
- J. Sikorski, N. Teschner and W. Wackernagel, Appl. Environ. Microbiol., 2002, 68(2), 865–873 CrossRef PubMed.
- S. J. Grimberg, W. T. Stringfellow and M. D. Aitken, Appl. Environ. Microbiol., 1996, 62(7), 2387–2392 Search PubMed.
- E. Kaczorek, T. Jesionowski, A. Giec and A. Olszanowski, Biotechnol. Lett., 2012, 34(5), 857–862 CrossRef PubMed.
- T. de Sousa and S. Bhosle, Bioresour. Technol., 2012, 123, 256–262 CrossRef PubMed.
- E. Rosenberg and E. Z. Ron, Appl. Microbiol. Biotechnol., 1999, 52(2), 154–162 CrossRef PubMed.
- A. Romeo, E. Sonnleitner, T. Sorger-Domenigg, M. Nakano, B. Eisenhaber and U. Blasi, Microbiology, 2012, 158(Pt 6), 1543–1552 CrossRef PubMed.
- P. Bharali, S. P. Singh, N. Dutta, S. Gogoi, L. C. Bora, P. Debnath and B. K. Konwar, RSC Adv., 2014, 4(73), 38698–38706 RSC.
- D. Gogoi, P. Bhagowati, P. Gogoi, N. K. Bordoloi, A. Rafay, S. K. Dolui and A. K. Mukherjee, RSC Adv., 2016, 6(74), 70669–70681 RSC.
- M. Nitschke, S. G. Costa and J. Contiero, Biotechnol. Prog., 2005, 21(6), 1593–1600 CrossRef PubMed.
- J. Van der Paal, C. Verheyen, E. C. Neyts and A. Bogaerts, Sci. Rep., 2017, 7, 39526 CrossRef PubMed.
- S. Estelmann, M. Hugler, W. Eisenreich, K. Werner, I. A. Berg, W. H. Ramos-Vera, R. F. Say, D. Kockelkorn, N. Gad'on and G. Fuchs, J. Bacteriol., 2011, 193(5), 1191–1200 CrossRef PubMed.
- A. Aparna, G. Srinikethan and H. Smitha, Colloids Surf., B, 2012, 95, 23–29 CrossRef PubMed.
- S. Joshi, C. Bharucha and A. J. Desai, Bioresour. Technol., 2008, 99(11), 4603–4608 CrossRef PubMed.
- M. Abouseoud, R. Maachi, A. Amrane, S. Boudergua and A. Nabi, Desalination, 2008, 223(1), 143–151 CrossRef.
- A. Khopade, R. Biao, X. Liu, K. Mahadik, L. Zhang and C. Kokare, Desalination, 2012, 285, 198–204 CrossRef.
- A. M. Abdel-Mawgoud, M. M. Aboulwafa and N. A. Hassouna, Appl. Biochem. Biotechnol., 2009, 157(2), 329–345 CrossRef PubMed.
- G. Seghal Kiran, T. Anto Thomas, J. Selvin, B. Sabarathnam and A. P. Lipton, Bioresour. Technol., 2010, 101(7), 2389–2396 CrossRef PubMed.
- S. S. Helvaci, S. Peker and G. Ozdemir, Colloids Surf., B, 2004, 35(3–4), 225–233 CrossRef PubMed.
- D. N. Singh and A. K. Tripathi, Bioresour. Technol., 2013, 128, 215–221 CrossRef PubMed.
- D. Osterreicher-Ravid, E. Z. Ron and E. Rosenberg, Environ. Microbiol., 2000, 2(4), 366–372 CrossRef PubMed.
Footnote |
| † Electronic supplementary information (ESI) available. See DOI: 10.1039/c8ra03377c |
| This journal is © The Royal Society of Chemistry 2018 |