 Open Access Article
Synthesis and characterization of Ca3Lu(GaO)3(BO3)4:Ce3+,Tb3+ phosphors: tunable-color emissions, energy transfer, and thermal stability
Liangling Sun,
Balaji Devakumar,
Bin Li,
Jia Liang,
Heng Guo and
Xiaoyong Huang *
*
Key Lab of Advanced Transducers and Intelligent Control System, Ministry of Education and Shanxi Province, College of Physics and Optoelectronics, Taiyuan University of Technology, Taiyuan 030024, PR China. E-mail: huangxy04@126.com
First published on 26th June 2018
Abstract
Blue-green dual-emitting phosphors Ca3Lu(GaO)3(BO3)4:Ce3+,Tb3+ (CLGB:Ce3+,Tb3+) were synthesized via a traditional solid-state reaction method. The phase of the phosphors was characterized by X-ray diffraction and the luminescence properties were investigated using the excitation and emission spectra, decay curves, temperature-dependent emission spectra, CIE chromaticity coordinates, and the internal quantum efficiency. Under 345 nm UV light excitation, Ce3+ singly doped CLGB phosphors presented intense blue light in the 350–550 nm wavelength region with a maximum peak at 400 nm. In sharp contrast, CLGB:Ce3+,Tb3+ phosphors showed both the blue and green emission wavelengths of Ce3+ and Tb3+ ions, respectively. The overall emission colors can be tuned from blue (0.164, 0.042) to green (0.331, 0.485) via increasing the concentration of Tb3+ ions, due to the energy transfer (ET) from Ce3+ ions to Tb3+ ions. The optimal doping concentration of Tb3+ ions in CLGB:Ce3+,Tb3+ phosphors was found to be 40 mol%. The mechanism of the ET from the Ce3+ to Tb3+ ions was demonstrated to be electric quadrupole–quadrupole interaction. The CLGB:0.04Ce3+,0.40Tb3+ sample possessed a high IQE of 54.2% and excellent thermal stability with an activation energy of 0.3142 eV when excited at 345 nm. The integrated emission intensity of CLGB:0.04Ce3+,0.40Tb3+ at 423 K was found to be about 74% of that at 303 K. Finally, under 300 mA driven current, the fabricated prototype white light-emitting diode showed CIE chromaticity coordinates of (0.3996, 0.3856) and high color rending index of 81.2. Considering all the above characteristics, the obtained CLGB:Ce3+,Tb3+ phosphors can be a type of multicolor emitting phosphor for application in white light-emitting diodes.
1. Introduction
Nowadays, environmental and energy issues are attracting increasing attention, so resource-saving and environment-friendly industries are valued.1–4 In the lighting industry, white light-emitting diodes (w-LEDs) have many advantages in lighting applications, such as having long working lifetimes and high luminous efficiency, and being energy-saving and environment-friendly, which meet the requirements of saving energy and protecting the environment.5–10 At present, two methods have been used to fabricate the w-LEDs; one is combining a blue InGaN chip with commercial yellow phosphor Y3Al5O12:Ce3+, and the other is using an ultraviolet/near ultraviolet (n-UV; 350–420 nm) LED chip and tricolor (red, green, and blue) phosphors.11–16 The former one suffers from low color rendering index and high correlated color temperature, while the latter one has the drawback of adjusting the proportion of the tricolor phosphors in particular applications.17 In fact, the luminescence properties of the w-LEDs based on the tricolor phosphors are greatly affected by the mixing degree, so it is important to explore novel phosphor with single phase to meet the requirement of practical application in w-LEDs.Many rare-earth ions co-doped luminescent inorganic phosphors have been studied due to the energy transfer between a sensitizer (e.g., Dy3+ and Ce3+) and an activator (e.g., Tb3+ and Sm3+), which can broaden the excitation wavelength range and enhance the luminescence performance.18–23 Tb3+ ions are frequently used as an activator because it can give rise to green light at about 541 nm (5D4 → 7F5 transition).24–26 However, Tb3+ ions exhibits a narrow weak band in the n-UV region, because of the spin-forbidden 4f → 4f transitions. On the contrary, Ce3+ ions could show a strong and broad absorption band in the n-UV region when it is doped into particular compounds, owing to the 4f → 5d parity-allowed transition.27,28 Thus considering this situation, Ce3+ ions can be used as sensitizer to intensify Tb3+ ions absorption by ET from Ce3+ to Tb3+ ions. Previous studies have shown that Ce3+ and Tb3+ ions can be well co-doped into various inorganic compounds, such as Na3Sc2(PO4)3:Ce3+,Tb3+,29 Ba2Y3(SiO4)3F:Ce3+,Tb3+,30 LaSi3N5:Ce3+,Tb3+,31 and Na6Ca3Si6O18:Ce3+,Tb3+.32 But few papers have studied the effect of temperature on luminescence. In these articles that have reported the thermal stability, such as CaLa4Si3O13:Ce3+,Tb3+ and BaLu6(Si2O7)2(Si3O10):Ce3+,Tb3+, their luminous intensity remained about 70% and 71.5% at 423 K compared with the initial value at 303 K, respectively, which was lower than the value of 74% in this present paper.27,33
Borates activated by rare-earth ions, such as LaBWO6:Tb3+,Eu3+,34 ZnB4O7:Eu3+,35 Ba2B2O5:Ce3+,Tb3+,Sm3+,36 have been confirmed to be an important class of phosphors with low synthesis temperature and high luminescence efficiency.37–39 In this paper, Ca3Lu(GaO)3(BO3)4 (CLGB) had been selected to be the host material and Ce3+–Tb3+ co-activated CLGB phosphors were prepared. The luminescence properties, thermal stability, the critical distance, chromaticity parameters, and ET mechanism between the Ce3+ and Tb3+ ions were systematically investigated. Importantly, the adjustable color from blue to green were achieved by doping various concentrations of the Tb3+ ions, due to the ET from Ce3+ to Tb3+ ions. Finally, a prototype w-LED device was fabricated by using a 365 nm UV LED chip and the phosphor mixture of CLGB:Ce3+,Tb3+ green phosphors, BaMgAl10O7:Eu2+ blue phosphors, and CaAlSiN3:Eu2+ red phosphors.
2. Experimental
The target materials of CLGB:Ce3+,Tb3+ phosphors were synthesized by high-temperature solid-state reaction method. H3BO3 (analytical reagent, AR), CaCO3 (AR), Ga2O3 (AR), Lu2O3 (99.99%), CeO2 (99.99%), and Tb(NO3)3·6H2O (99.99%) were served as the raw materials and they were weighted according to stoichiometric ratio while H3BO3 exceeded 5 wt%. The raw materials were ground and mixed in an agate mortar. Then, these mixtures were sintered at 1000 °C for 4 h in CO reducing atmosphere to reduce the Ce4+ into Ce3+ ions and prevent Ce3+ ions from being re-oxidized to Ce4+ ion at high temperature. Finally, the prepared mixtures were cooled naturally to room temperature in the furnace.The XRD patterns of CLGB:Ce3+,Tb3+ were examined by Bruker D8 X-ray diffractometer. The morphology properties of the CLGB:0.04Ce3+,0.40Tb3+ phosphors were measured by a field-emission scanning electron microscope (FE-SEM; MAIA3 TESCAN). The diffuse reflectance spectra (DRS) were recorded on a spectrophotometer (Shimadzu 2600UV) using BaSO4 white powder as the reference. The photoluminescence (PL) and PL excitation (PLE) spectra were researched by Edinburgh FS5 fluorescence spectrophotometer equipped with a 150 W Xe lamp as the excitation light source. The thermal stability and internal quantum efficiency (IQE) of CLGB:0.04Ce3+,0.40Tb3+ phosphors were measured on the same spectrophotometer equipped with an temperature-regulating device and an integrating sphere coated with BaSO4 compound, respectively. The luminescence decay curves of Ce3+ ions were measured by utilizing an Edinburgh FPS 920 spectrofluorometer with a 150 W nF900 nanosecond flash-light source. The CLGB:0.04Ce3+,0.40Tb3+ phosphors, commercial blue emitting phosphors BaMgAl10O7:Eu2+, and red emitting phosphors CaAlSiN3:Eu2+ were mixed thoroughly and then coated on a 365 nm LED chip by using silicone to fabricate w-LED device. The photoelectric properties and spectral power distributions of the fabricated devices were measured by using an integrating sphere spectroradiometer system (HAAS-2000, Everfine) and a corrected spectrometer, respectively.
3. Results and discussion
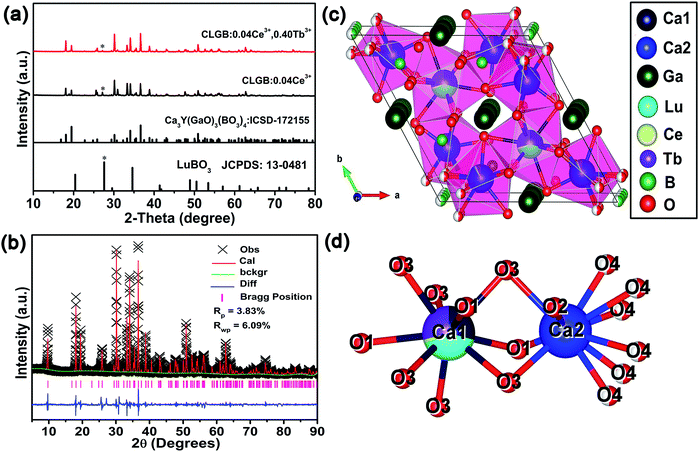
The XRD patterns of the CLGB:0.04Ce3+, CLGB:0.04Ce3+,0.40Tb3+ phosphors, and the stand cards of Ca3Y(GaO)3(BO3)4 (ICSD-172155) and LuBO3 (JCPDS-13-0481) were shown in Fig. 1(a). The standard curve of Ca3Y(GaO)3(BO3)4 host and the dominant diffraction peaks of CLGB:0.04Ce3+ and CLGB:0.04Ce3+,0.40Tb3+ phosphors were well-matched, which indicated the formation of CLGB:Ce3+,Tb3+ phosphors and the iso-structure of CLGB:Ce3+,Tb3+ phosphors and the Ca3Y(GaO)3(BO3)4 material. There was a week miscellaneous peak centered at 2θ ≈ 27°, which was derived from LuBO3 (JCPDS: 13-0481). However, the impurity week peak decreased with the addition of Tb3+ ions, which implied that the pure phase CLGB:Ce3+,Tb3+ samples could be obtained by doping high concentration of Tb3+ ions in CLGB host. Fig. 1(b) depicted the Rietveld refinements of the CLGB:0.04Ce3+,0.40Tb3+ phosphors to further study the crystal structure of the as-prepared sample, and the crystallographic file and refinement parameters of CLGB:0.04Ce3+,0.40Tb3+ phosphors were listed in Table 1. It could be found that the CLGB:0.04Ce3+,0.40Tb3+ phosphors possessed a hexagonal space group P63/m based on the refinement results from Table 1. The crystal structure of CLGB:0.04Ce3+,0.40Tb3+ phosphors and the local environment of the Ca1 and Ca2 sites were showed in Fig. 1(c) and (d), respectively. From the Table 1 and Fig. 1(d), we could know that even though the Ca2 was surrounded by ten oxygen atoms, the Lu3+, Ce3+, and Tb3+ would prefer to occupy the Ca1 site which coordinated by seven oxygen atoms. That was because the four O4 ions which surrounded the Ca2 was shared by the adjacent four B ions. Therefore, the Lu3+, Ce3+, and Tb3+ ions would occupy the Ca1 with the CN sites of 9 (CN: coordination number), not the Ca2 with the CN sites of 7.40| CLGB:0.04Ce3+,0.40Tb3+ | |||||
|---|---|---|---|---|---|
| Crystal system | Hexagonal | ||||
| Space group | P63/m | ||||
| Lattice parameters | a = 10.50796(11) Å, b = 10.50796 Å, c = 5.81483(10) Å, α = β = 90°, γ = 120°, V = 556.038(10) Å3 | ||||
| Atom | x | y | z | Occ. | Uiso (Å2) |
| Ca1/Lu1/Ce1/Tb1 | 0.3333 | 0.6667 | 0.25 | 0.29/0.4/0.025/0.3 | 0.011 |
| Ca2/Lu2/Ce2/Tb2 | 0.1264 | 0.8414 | 0.25 | 0.905/0.016/0.015/0.1 | 0.014 |
| Ga1 | 0.0 | 0.5 | 0.0 | 1 | 0.012 |
| B1 | 0.17543 | 0.81737 | 0.75 | 1 | −0.04826 |
| B2 | 0.0 | 0.0 | 0.117 | 0.5 | 0.02 |
| O1 | 0.05155 | 0.43126 | 0.25 | 1 | 0.02272 |
| O2 | 0.331 | 0.915 | 0.75 | 1 | 0.018 |
| O3 | 0.3021 | 0.477 | 0.539 | 1 | 0.012 |
| O4 | 0.053 | 0.907 | 0.587 | 0.5 | 0.005 |
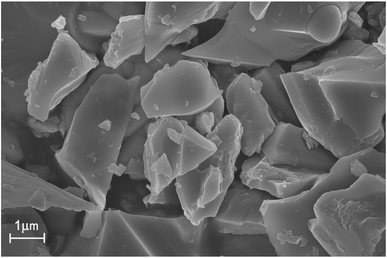
The FE-SEM of the CLGB:0.04Ce3+,0.40Tb3+ phosphors were measured and showed in Fig. 2. It could be seen that the CLGB:0.04Ce3+,0.40Tb3+ phosphors were made up of irregular and agglomerate microparticles with the size ranging from 2 to 8 μm.
Fig. 3(a) illustrated the PLE and PL spectra of CLGB:0.04Ce3+. The PLE spectrum monitored at 400 nm showed a weak excitation band peaking at 281 nm from 250–300 nm wavelength region and an intense broad excitation band peaking at 345 nm from 300–392 nm wavelength region, which were assigned to 4f–5d transition of Ce3+ ions in CLGB:0.04Ce3+ phosphors.41,42 Importantly, the broad excitation band from 300 to 392 nm matched well with the emission spectra of n-UV LED chips.43 The PL spectrum of CLGB:0.04Ce3+ showed an asymmetric blue emission band (contain 5d → 2F5/2 and 5d → 2F7/2 transitions) from 350 to 550 nm and it could be separate into two different Gaussian peaks, peaking at 385 nm (25![[thin space (1/6-em)]](https://www.rsc.org/images/entities/char_2009.gif) 974 cm−1) and 409 nm (24
974 cm−1) and 409 nm (24![[thin space (1/6-em)]](https://www.rsc.org/images/entities/char_2009.gif) 450 cm−1).44,45 Therefore, the energy difference of the two Gaussian peaks was about 1524 cm−1, which was in agreement with the theoretical difference between the 2F5/2 and 2F7/2 levels of Ce3+ ions (about 2000 cm−1).46,47
450 cm−1).44,45 Therefore, the energy difference of the two Gaussian peaks was about 1524 cm−1, which was in agreement with the theoretical difference between the 2F5/2 and 2F7/2 levels of Ce3+ ions (about 2000 cm−1).46,47
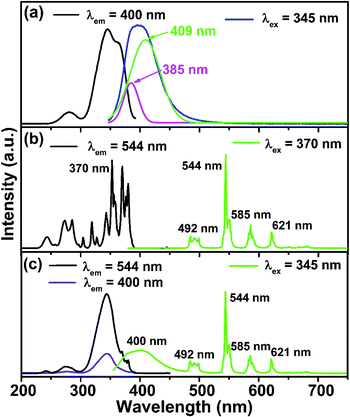 | ||
| Fig. 3 The PLE and PL spectra of CLGB:0.04Ce3+ (a), CLGB:0.40Tb3+ (b), and CLGB:0.04Ce3+,0.40Tb3+ (c) phosphors. | ||
Fig. 3(b) shows the PLE and PL spectra of CLGB:0.40Tb3+. In the PLE spectrum monitored the emission at 544 nm, a broad excitation band in the range of 200–300 nm and a group of narrow PLE lines in the 300–400 nm wavelength range were observed, corresponding to 4f8 → 4f75d1 transition and 4f8–4f8 transitions of Tb3+ ions, respectively.25 Furthermore, the CLGB:0.40Tb3+ phosphors showed green emissions under 370 nm n-UV light excitation. The PL spectrum of CLGB:0.40Tb3+ displayed several emission peaks at 492 nm (5D4 → 7F6 transition), 544 nm (5D4 → 7F5 transition), 585 nm (5D4 → 7F4 transition), and 621 nm (5D4 → 7F3 transition).48,49
According to Dexter's theory, effective ET between activator and sensitizer need to meet two conditions: (1) the PL spectrum of the sensitizer (herein was Ce3+ ions) and the PLE spectrum of the activator (herein was Tb3+ ions) had enough overlap; (2) when monitored at the dominant emission wavelength of the activator, the PLE spectrum of the co-doped sample (herein was CLGB:Ce3+,Tb3+) should have not only the characteristic excitation bands of the activator ions but also the characteristic excitation peaks of the sensitizer ions.50–52 By comparing Fig. 3(a) and (b), it was obvious that the PLE spectrum of CLGB:0.40Tb3+ had large overlap with the PL spectrum of CLGB:0.04Ce3+ between 348 and 400 nm, which met the requirement of the resonance-type ET. Furthermore, as shown in Fig. 3(c), the PLE spectrum of CLGB:0.04Ce3+,0.40Tb3+ monitored at 544 nm (Tb3+ dominant emission peak) have two kind of excitation bands: the broad PLE bands in the 252–380 nm wavelength region were the characteristic excitation bands of Ce3+ ions, while a broad PLE band in the 232–252 nm region (4f8 → 4f75d1 transition) and several sharp PLE peaks in the 366–390 nm wavelength range (4f8–4f8 transitions) belonged to the Tb3+ ions. In contrast, when monitored at Ce3+ dominant emission peak at 400 nm, the PLE spectrum of CLGB:0.04Ce3+,0.40Tb3+ phosphors only displayed the characteristic excitation bands of Ce3+ ions. These results indicated the occurrence of ET from Ce3+ to Tb3+ ions in CLGB:0.04Ce3+,0.40Tb3+. Meanwhile, compared the PLE spectra of CLGB:0.40Tb3+ and CLGB:0.04Ce3+,0.40Tb3+, we could concluded that the absorption intensity in the n-UV region of Tb3+ ions was enhanced with the addition of Ce3+ ions. Under UV light excitation at 345 nm, the PL spectrum of CLGB:0.04Ce3+,0.40Tb3+ displayed the characteristic emission bands of Ce3+ and Tb3+ ions, further showing the presence of ET from Ce3+ to Tb3+ ions in CLGB:Ce3+,Tb3+ phosphors.
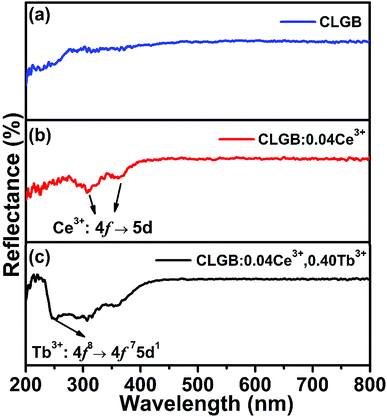
Fig. 4 showed the DRS of the CLGB host, CLGB:0.04Ce3+, and CLGB:0.04Ce3+,0.40Tb3+ phosphors. Compared with the spectral curve of the CLGB host, it could be clearly seen from the spectrum of CLGB:0.04Ce3+ phosphors that two new absorption bands in 270–400 nm appeared, which might be attributed to the 4f → 5d transition of Ce3+ ions. For the DRS of CLGB:0.04Ce3+,0.40Tb3+ phosphors, another absorption peak at 250 nm was observed due to the 4f8 → 4f75d1 transition of Tb3+.25 These results obtained from the DRS were well accordance with the PLE spectra in Fig. 3.
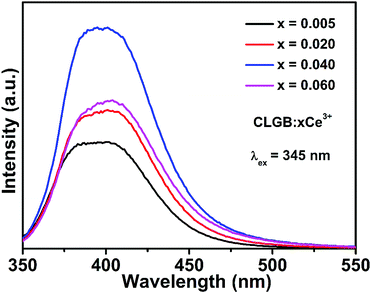
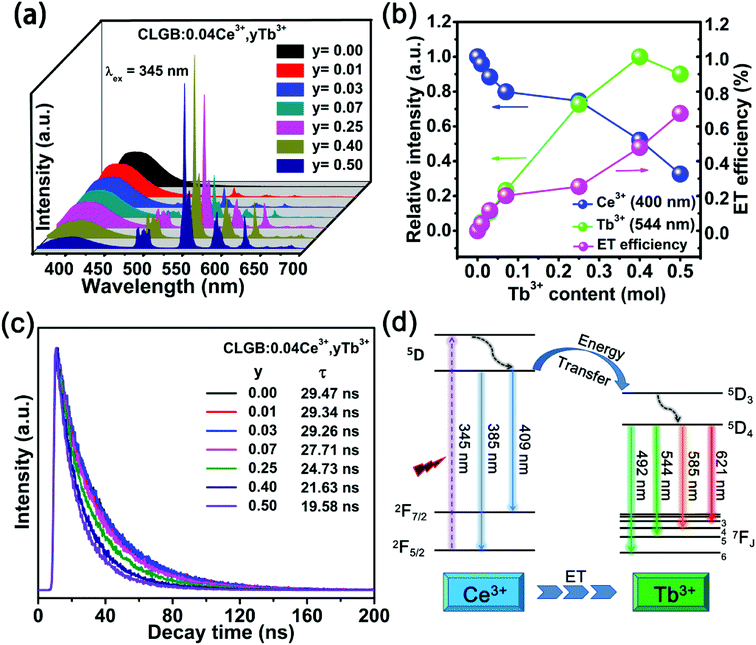
To find the optimal doping concentration of Ce3+ ions in CLGB host, a series of Ce3+ ions single doped CLGB phosphors were synthesized and the PL spectra excited at 345 nm were shown in Fig. 5. The emission intensity of CLGB:xCe3+ (x = 0.005–0.060) reached the maximum at x = 0.04. Therefore, the co-doping concentration of Ce3+ ions was fixed to be 0.04 and then a series of CLGB:0.04Ce3+,yTb3+ (y = 0.00–0.50) phosphors were synthesized and the corresponding PL spectra excited at 345 nm were shown in Fig. 6(a). With the increasing doping concentration of Tb3+ ions in CLGB:0.04Ce3+,yTb3+ (y = 0.00–0.50) phosphors, the emission intensity of Ce3+ ions gradually decreased and the emission intensity of Tb3+ ions markedly enhanced, as can be clearly seen in Fig. 6(a) and (b). Especially, Tb3+ green emission intensity reached the maximum when y = 0.40. This phenomenon illustrated that there existed effective ET from Ce3+ to Tb3+ ions in CLGB:0.04Ce3+,yTb3+ phosphors and the emission intensity of blue light (355–475 nm) and the green light (475–700 nm) could be tuned by doping different concentration of Tb3+ ions. The ET efficiency (ηET) from Ce3+ sensitizers to Tb3+ activators in CLGB:0.04Ce3+,yTb3+ phosphors can be calculated by:53,54
 | (1) |
The decay curves of Ce3+ ions in CLGB:0.04Ce3+,yTb3+ phosphors were measured under 345 nm excitation, as shown in Fig. 6(c). The decay lifetimes were measured by the following double exponential expression:55
 | (2) |
Fig. 6(d) shows a schematic diagram for the ET process from Ce3+ to Tb3+ ions in CLGB:Ce3+,Tb3+ phosphors. Excited by the 345 nm excitation, electrons in the ground state 2F5/2 of Ce3+ ions absorbed energy and then were excited to the excited higher 5d level and finally returned to the lower level of 5d excited state. After that there was two ways for energy releasing. (1) Transitions of Ce3+ ions: a partial of excited electrons released to lower 4f level and gave rise to blue emissions at 385 and 409 nm.56 (2) ET process from Ce3+ to Tb3+ ions: other partial excited energy of Ce3+ ions could be transferred to the 5D3 level of Tb3+ ions due to their similar energy levels.57,58 After that, the excited electrons on the 5D3 energy level will relax to the 5D4 level by non-radiative transitions and then emitted green light at 492, 544, 585, and 621 nm by radiative transitions of 5D4 → 7F6,5,4,3.
In general, the ET from a sensitizer to an activator in certain phosphor may take place via exchange interaction and electric multipolar interaction.56 For the exchange interaction, the critical distance (Rc) between the doping ions (herein were the Ce3+ and Tb3+ ions) should be smaller than 5 Å and it can be obtained by the follow equation:59,60
 | (3) |
 | (4) |
 | (5) |
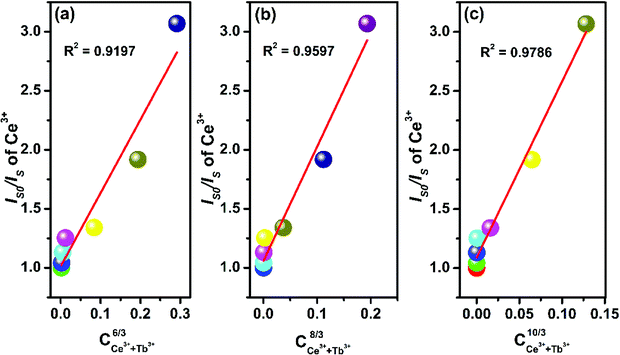 | ||
| Fig. 7 Dependence of Is0/Is of Ce3+ ions on (a) C(Ce3+ + Tb3+)6/3, (b) C(Ce3+ + Tb3+)8/3, and (c) C(Ce3+ + Tb3+)10/3. | ||
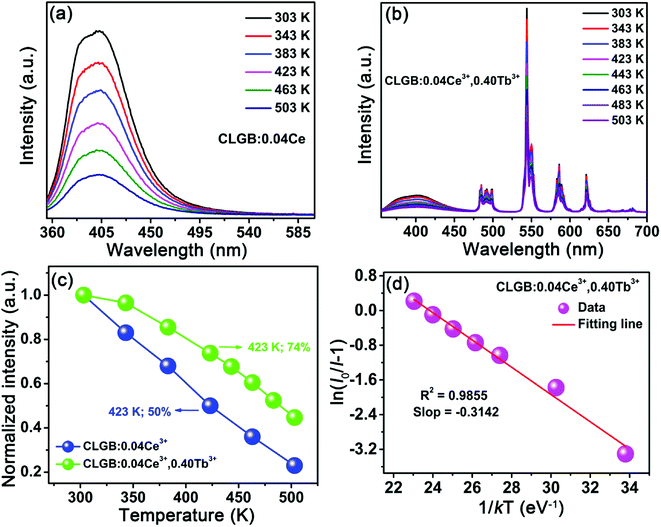
Based on the PL spectra, the CIE chromaticity diagram of CLGB:0.04Ce3+,yTb3+ (y = 0–0.50) was depicted in Fig. 8, and the corresponding CIE coordinates were listed in Table 2. The sample color and CIE coordinates of CLGB:0.04Ce3+,yTb3+ shifted gradually from blue [y = 0.00, CIE:(0.164, 0.042)] to green [y = 0.50, CIE:(0.331, 0.485)] by adjusting Tb3+ ions concentration from 0.00 to 0.50. Table 2 also shows the IQEs of the CLGB:0.04Ce3+,yTb3+ (y = 0.00–0.50) phosphors. The IQE of the obtained CLGB:0.04Ce3+,yTb3+ (y = 0.00–0.50) phosphors reached its maximum value of 57.9 when y = 0.25. To evaluate the application possibility in w-LEDs of the CLGB:Ce3+,Tb3+ compounds, thermal stability is an important technological parameter. The temperature-dependent PL spectra of Ce3+ singly-doped CLGB:0.04Ce3+ and Ce3+–Tb3+ co-doped CLGB:0.04Ce3+,0.40Tb3+ phosphors were measured and plotted in Fig. 9(a) and (b), respectively. Clearly, the PL intensities of CLGB:0.04Ce3+ and CLGB:0.04Ce3+,0.40Tb3+ phosphors decreased with the increasing temperature and they were dropped about 50% (remained 50%) and 26% (remained 74%) at 423 K of that measured at 303 K, respectively (see Fig. 9(c)). Importantly, the thermal stability of the CLGB:0.04Ce3+,0.40Tb3+ phosphors was better than the CLGB:0.04Ce3+ phosphors. Considering the good thermal performance, the activation energy (ΔE) for the thermal quenching of CLGB:0.04Ce3+,0.40Tb3+ phosphors can be calculated by following Arrhenius equation:64–66
 | (6) |
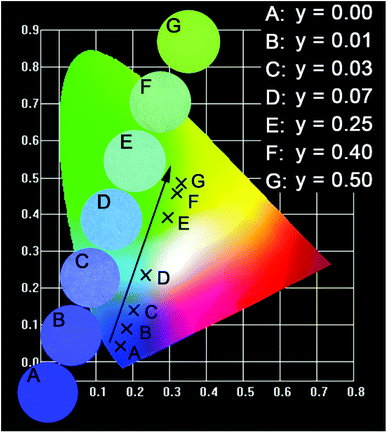 | ||
| Fig. 8 CIE chromaticity coordinates for CLGB:0.40Ce3+,yTb3+ phosphors and digital photos of corresponding samples under 365 nm UV lamp. | ||
| Sample | Tb3+ concentration (y) | CIE coordinates (x, y) | IQE (%) |
|---|---|---|---|
| A | 0.00 | (0.164, 0.042) | 45.1 |
| B | 0.01 | (0.182, 0.090) | 46.3 |
| C | 0.03 | (0.201, 0.140) | 46.3 |
| D | 0.07 | (0.234, 0.235) | 46.5 |
| E | 0.25 | (0.294, 0.391) | 57.9 |
| F | 0.40 | (0.320, 0.458) | 54.2 |
| G | 0.50 | (0.331, 0.485) | 38.7 |
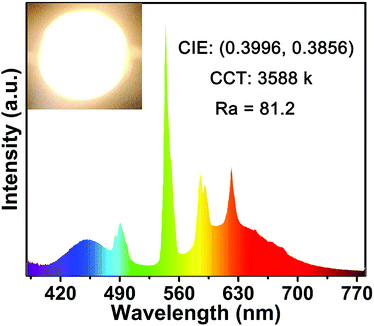
Considering the good thermal performance and high IQE, the research of the fabricate w-LED device was meaningful. Fig. 10 shows the electroluminescent (EL) spectrum of the as-prepared w-LED device. The device exhibited bright white light with CIE chromaticity coordinates of (0.3996, 0.3856), high color rending index (Ra) of 81.2 and correlated color temperature (CCT) of 3588 K. Thus, all the above results show that the CLGB:Ce3+,Tb3+ phosphors have good properties to meet the requirements of practical application in w-LEDs.
4. Conclusions
In summary, novel CLGB:Ce3+,Tb3+ phosphors were successfully synthesized by solid-state reaction at 1000 °C. Fixed the Ce3+ ions concentration x = 0.04, the CLGB:0.04Ce3+,yTb3+ (y = 0.01–0.50) samples exhibited blue emission (355–475 nm) and green emission (475–700 nm) under 345 nm excitation. ET from the Ce3+ to Tb3+ ions was observed in CLGB:0.04Ce3+,yTb3+ phosphors and the ET process occurred by electric q–q interaction. By adjusting the Tb3+ ions concentration, the emission color of the CLGB:0.04Ce3+,yTb3+ phosphors was tuned from blue light (0.164, 0.042) to green light (0.331, 0.485) when the concentration y increased from 0.00 to 0.50. In addition, the IQE of CLGB:0.04Ce3+,0.25Tb3+ reached as high as 57.9%. The temperature-dependent spectra of CLGB:0.04Ce3+,0.40Tb3+ sample revealed that the as-prepared phosphor had good thermal stability with activation energy ΔE of 0.3142 eV. The fabricated prototype w-LED device showed good photoelectric properties with CIE chromaticity coordinates of (0.3996, 0.3856), Ra = 81.2, and CCT = 3588 K. All the results suggest that CLGB:Ce3+,Tb3+ phosphors have potential for application in w-LEDs as a color-tunable phosphor.Conflicts of interest
There are no conflicts to declare.Acknowledgements
The present research work was supported by the National Natural Science Foundation of China (No. 51502190), the Program for the Outstanding Innovative Teams of Higher Learning Institutions of Shanxi, the Start-up Research Grant of Taiyuan University of Technology (No. Tyut-rc201489a), the Excellent Young Scholars Research Grant of Taiyuan University of Technology (No. 2014YQ009, 2015YQ006, and 2016YQ03), and the Open Fund of the State Key Laboratory of Luminescent Materials and Devices (South China University of Technology, No. 2017-skllmd-01).References
- M. Jiao, Q. Xu, C. Yang and H. You, RSC Adv., 2017, 7, 28647–28654 RSC.
- C. C. Lin, A. Meijerink and R. S. Liu, J. Phys. Chem. Lett., 2016, 7, 495–503 CrossRef PubMed.
- S. Liang, M. Shang, H. Lian, K. Li, Y. Zhang and J. Lin, J. Mater. Chem. C, 2016, 4, 6409–6416 RSC.
- M. Peng, X. Yin, P. A. Tanner, M. G. Brik and P. Li, Chem. Mater., 2015, 27, 2938–2945 CrossRef.
- J. Zhong, D. Chen, H. Xu, W. Zhao, J. Sun and Z. Ji, J. Alloys Compd., 2017, 695, 311–318 CrossRef.
- H. Guo, X. Huang and Y. Zeng, J. Alloys Compd., 2018, 741, 300–306 CrossRef.
- X. Huang, B. Li and H. Guo, Ceram. Int., 2017, 43, 10566–10571 CrossRef.
- L. Li, Y. Pan, Y. Huang, S. Huang and M. Wu, J. Alloys Compd., 2017, 724, 735–743 CrossRef.
- W. Dai, Y. Lei, J. Zhou, Y. Zhao, Y. Zheng, M. Xu, S. Wang and F. Shen, J. Am. Ceram. Soc., 2017, 100, 5174–5185 CrossRef.
- R. Cao, T. Fu, Y. Cao, H. Ao, S. Guo and G. Zheng, Mater. Lett., 2015, 155, 68–70 CrossRef.
- M. Hermus, P.-C. Phan and J. Brgoch, Chem. Mater., 2016, 28, 1121–1127 CrossRef.
- P. Du, X. Huang and J. S. Yu, Chem. Eng. J., 2018, 337, 91–100 CrossRef.
- H. Zhang, X. Zhang, Z. Cheng, Y. Xu, J. Yang and F. Meng, Ceram. Int., 2018, 44, 2547–2551 CrossRef.
- X. Huang, B. Li, H. Guo and D. Chen, Dyes Pigm., 2017, 143, 86–94 CrossRef.
- J. Han, L. Li, M. Peng, B. Huang, F. Pan, F. Kang, L. Li, J. Wang and B. Lei, Chem. Mater., 2017, 29, 8412–8424 CrossRef.
- X. Huang, Nat. Photonics, 2014, 8, 748–749 CrossRef.
- H. Xu, Z. Zhou, Y. Liu, Q. Liu, Z. He, S. Wang, L. Huang and H. Zhu, Luminescence, 2017, 32, 812–816 CrossRef PubMed.
- P. Du, L. Krishna Bharat and J. S. Yu, J. Alloys Compd., 2015, 633, 37–41 CrossRef.
- R. Shi, J. Xu, G. Liu, X. Zhang, W. Zhou, F. Pan, Y. Huang, Y. Tao and H. Liang, J. Phys. Chem. C, 2016, 120, 4529–4537 CrossRef.
- P. Xu, Z. Fu, S. Fan, H. Lin, C. Li, G. Yao, Q. Chen, Y. Zhou and F. Zeng, J. Non-Cryst. Solids, 2018, 481, 441–446 CrossRef.
- A. Huang, Z. Yang, C. Yu, Z. Chai, J. Qiu and Z. Song, J. Phys. Chem. C, 2017, 121, 5267–5276 CrossRef.
- M. Zhao, Z. Zhao, L. Yang, L. Dong, A. Xia, S. Chang, Y. Wei and Z. Liu, J. Lumin., 2018, 194, 297–302 CrossRef.
- F. Kang, H. Zhang, L. Wondraczek, X. Yang, Y. Zhang, D. Y. Lei and M. Peng, Chem. Mater., 2016, 28, 2692–2703 CrossRef.
- P. Ma, B. Yuan, Y. Sheng, K. Zheng, Y. Wang, C. Xu, H. Zou and Y. Song, J. Alloys Compd., 2017, 714, 627–635 CrossRef.
- X. Wu, Y. Jiao, O. Hai, Q. Ren, F. Lin and H. Li, J. Alloys Compd., 2018, 730, 521–527 CrossRef.
- Y. Li, W. Chen, L. Zhao, D. Meng, Y. Zhang and C. Wang, New J. Chem., 2017, 41, 14876–14881 RSC.
- S. A. Khan, W. Ji, L. Hao, X. Xu, S. Agathopoulos and N. Z. Khan, Opt. Mater., 2017, 72, 637–643 CrossRef.
- M. Ding, M. Xu and D. Chen, J. Alloys Compd., 2017, 713, 236–247 CrossRef.
- H. Guo, B. Devakumar, B. Li and X. Huang, Dyes Pigm., 2018, 151, 81–88 CrossRef.
- D. Wu, W. Xiao, L. Zhang, X. Zhang, Z. Hao, G.-H. Pan, Y. Luo and J. Zhang, J. Mater. Chem. C, 2017, 5, 11910–11919 RSC.
- F. Du, W. Zhuang, R. Liu, Y. Liu, J. Zhong, P. Gao, X. Zhang, W. Gao and L. Shao, RSC Adv., 2017, 7, 1075–1081 RSC.
- H. Xu, Q. Liu, L. Huang, Z. He, S. Wang, C. Jiang and Q. Peng, Opt. Laser Technol., 2017, 89, 151–155 CrossRef.
- K. Li, H. Lian, Y. Han, M. Shang, R. Van Deun and J. Lin, Dyes Pigm., 2017, 139, 701–707 CrossRef.
- B. Li, X. Huang, H. Guo and Y. Zeng, Dyes Pigm., 2018, 150, 67–72 CrossRef.
- H. N. Luitel, R. Chand and T. Watari, Adv. Condens. Matter Phys., 2015, 2015, 1–9 CrossRef.
- S. Xu, Z. Wang, P. Li, T. Li, Q. Bai, J. Sun and Z. Yang, J. Am. Ceram. Soc., 2017, 100, 2069–2080 CrossRef.
- H. Huang, X. Feng, T. Chen, Y. Xiong and F. Zhang, Luminescence, 2018, 33, 692–697 CrossRef PubMed.
- X. Li, C. Liu, L. Guan, W. Wei, Z. Yang, Q. Guo and G. Fu, Mater. Lett., 2012, 87, 121–123 CrossRef.
- S.-Z. Ma, W.-L. Feng, R. Chen and Z.-Q. Peng, J. Alloys Compd., 2017, 700, 49–53 CrossRef.
- D. Wen, H. Kato, M. Kobayashi, S. Yamamoto, M. Mitsuishi and M. Kakihana, J. Mater. Chem. C, 2017, 5, 4578–4583 RSC.
- M. Ding, H. Zhang, D. Chen, Q. H. Junhua Xi and Z. Ji, J. Alloys Compd., 2016, 672, 117–124 CrossRef.
- M. Ding, J. Hou, Z. Cui, H. Gao, C. Lu, J. Xi, Z. Ji and D. Chen, Ceram. Int., 2018, 44, 7930–7938 CrossRef.
- R. Yu, H. M. Noh, B. K. Moon, B. C. Choi, J. H. Jeong, K. Jang, H. S. Lee and S. S. Yi, Mater. Res. Bull., 2014, 51, 361–365 CrossRef.
- C.-Y. Wang, O. M. t. Kate, T. Takeda and N. Hirosaki, J. Mater. Chem. C, 2017, 5, 8295–8300 RSC.
- M. Hermus, P.-C. Phan, A. C. Duke and J. Brgoch, Chem. Mater., 2017, 29, 5267–5275 CrossRef.
- J. Sun, Y. Sun, J. Zeng and H. Du, J. Phys. Chem. Solids, 2013, 74, 1007–1011 CrossRef.
- N. Guo, Y. Song, H. You, G. Jia, M. Yang, K. Liu, Y. Zheng, Y. Huang and H. Zhang, Eur. J. Inorg. Chem., 2010, 2010, 4636–4642 CrossRef.
- E. Cavalli, P. Boutinaud, R. Mahiou, M. Bettinelli and P. Dorenbos, Inorg. Chem., 2010, 49, 4916–4921 CrossRef PubMed.
- X. Huang, B. Li and H. Guo, J. Alloys Compd., 2017, 695, 2773–2780 CrossRef.
- G. V. Lokeswara Reddy, L. Rama Moorthy, P. Packiyaraj and B. C. Jamalaiah, Opt. Mater., 2013, 35, 2138–2145 CrossRef.
- M. Xin, D. Tu, H. Zhu, W. Luo, Z. Liu, P. Huang, R. Li, Y. Cao and X. Chen, J. Mater. Chem. C, 2015, 3, 7286–7293 RSC.
- Y. Zhang, H. Liu, L. Mei, M. S. Molokeev, Y. Wang and Z. Huang, J. Solid State Chem., 2017, 255, 36–41 CrossRef.
- B. P. Kore, S. Tamboli, N. S. Dhoble, A. K. Sinha, M. N. Singh, S. J. Dhoble and H. C. Swart, Mater. Chem. Phys., 2017, 187, 233–244 CrossRef.
- C. H. Huang, T. W. Kuo and T. M. Chen, ACS Appl. Mater. Interfaces, 2010, 2, 1395–1399 CrossRef PubMed.
- G.-G. Wang, X.-F. Wang, L.-W. Dong and Q. Yang, RSC Adv., 2016, 6, 42770–42777 RSC.
- A. Guan, P. Chen, L. Zhou, G. Wang, X. Zhang and J. Tang, Spectrochim. Acta, Part A, 2017, 173, 53–58 CrossRef PubMed.
- C.-H. Huang, W.-R. Liu, T.-W. Kuo and T.-M. Chen, Chem, 2011, 1, 9–15 Search PubMed.
- G. Mo, Z. Wei, L. Ma and G. Wen, J. Mater. Sci.: Mater. Electron., 2016, 28, 2557–2562 CrossRef.
- J. Zhou and Z. Xia, J. Mater. Chem. C, 2015, 3, 7552–7560 RSC.
- H.-L. Lai, R.-Y. Yang and S.-J. Chang, Ceram. Int., 2017, 43, S688–S693 CrossRef.
- Z. Xia and R.-S. Liu, J. Phys. Chem. C, 2012, 116, 15604–15609 CrossRef.
- B. Wang, Y.-g. Liu, Z. Huang and M. Fang, Chem. Phys. Lett., 2017, 690, 31–37 CrossRef.
- J. Huo, W. Lü, B. Shao, Y. Feng, S. Zhao and H. You, Dyes Pigm., 2017, 139, 174–179 CrossRef.
- Z. Jia and M. Xia, New J. Chem., 2017, 41, 12416–12421 RSC.
- X. Zhang, J. Zhang and Y. Chen, Dyes Pigm., 2018, 149, 696–706 CrossRef.
- F. Kang, M. Peng, D. Y. Lei and Q. Zhang, Chem. Mater., 2016, 28, 7807–7815 CrossRef.
| This journal is © The Royal Society of Chemistry 2018 |

