DOI:
10.1039/C8RA03267J
(Paper)
RSC Adv., 2018,
8, 23727-23741
Polydopamine-wrapped carbon nanotubes to improve the corrosion barrier of polyurethane coating
Received
17th April 2018
, Accepted 11th June 2018
First published on 29th June 2018
Abstract
Nanocomposite reinforced polyurethane (PU) coatings have been prepared by an ultrasonication method with polydopamine-wrapped carbon nanotubes (PDA@CNTs) as the nanofiller. The influence of the PDA@CNTs enhanced PU coating on the corrosion resistance and adhesion strength to Al-alloy was investigated by electrochemical impedance spectroscopy and the pull-off test during cyclic ageing tests, including the salt spraying test, UV irradiation and solution immersion. A comparison of the pristine PU against CNTs modified PU coatings revealed that the higher CNTs loading (2.0 wt%) increased the heterogeneity and porosity of PU, which could deteriorate the corrosion barrier of PU due to the poor dispersity, even though it also increased the adhesion strength of PU. In contrast, the PDA wrapped CNTs could improve the dispersibility of the CNTs in the PU matrix thanks to the greater compatibility of PDA with PU compared to CNTs. Further experiments indicated that increasing the PDA@CNTs loading could improve the adhesion strength, but and also increase the corrosion resistance of the PU coating to 107 Ω cm2 even after 7 cycles of ageing tests. Morphological observations indicated that the PDA@CNTs could increase the compactness and decrease the defects of PU, preventing the initiation and propagation of micro-defects in the PU coating during long-term ageing tests.
1. Introduction
Polyurethane coatings are widely used in corrosion protection because of their relatively low cost and proven efficacy in different erosion environments. However, the combination of many aggressive environments, such as ultraviolet (UV) radiation, seawater, oxygen and temperature fluctuation, could induce significant degradation of the coated systems and thus reduce their protective performance on metal substrates.1 This degradation process is usually caused by the penetration of aggressive ions and the rupture of chain segments in the coating;2–4 it is therefore necessary to improve their resistance to environmental factors.
Nowadays, many researchers have focused on adding anticorrosive fillers to organic coatings to boost their corrosion resistance, bond strength, or other physicochemical performances.5–12 Particularly, the carbon-based fillers, such as carbon black,13,14 graphene15–17 and carbon nanotubes (CNTs),18–21 have been widely evaluated as coating enhancers. CNTs, as one-dimensional nanomaterials with hollow tube structures, have many advantages like large specific surface area, high aspect ratio, high thermal and mechanical stability, electrical and chemical inertness, which make them ideal candidates as barrier fillers to improve coating performance.22–25 Shon et al.26,27 investigated the effect of multi-walled carbon nanotubes (MWCNT) on the hydrophobicity and water transport behavior of epoxy coatings, and proposed that a high MWCNT content decreased the water permeability of epoxy coatings due to high surface hydrophobicity. Wernik et al.28 studied the mechanical strength change of epoxy composites with the addition of 0.5–3% (w/w) of CNTs and concluded that the addition of 1–1.5% (w/w) of CNTs could significantly improve the mechanical properties of composites. According to Asmatulu et al.,29 the polymeric coatings incorporating MWCNTs could reduce UV degradation, lessen surface cracks, and hence increase the lifetime of polymeric coatings.
Previously, researchers often tried to physically mix CNTs with the coating matrix, which easily causes agglomeration of the CNTs and poor dispersion in polymer coatings due to the chemical inertness and high surface energy of CNTs. Recently, researchers30–35 have been paying more attention to how to functionalize CNTs to achieve more homogeneous dispersions. Subramanian et al.36 studied synergistic bonding in epoxy by polydopamine (PDA)/MWCNT and found that PDA increased the interfacial adhesion to the substrate. Cui et al.37 employed poly(2-butylaniline) (PBA) as a dispersant to disperse the MWCNTs in an epoxy matrix via non-covalent functionalization to enhance the corrosion protection and tribological properties of MWCNTs/epoxy nanocomposites. The amino-functionalized CNTs were also found to exhibit higher surface energy and much better wettability with epoxy resin than the pristine CNTs according to Ma et al.38 However, most reports19,26,37,39 have only investigated the effect of CNTs as pigments on the corrosion resistance of polymer coatings in NaCl solution, ignoring the influence of the comprehensive ageing conditions such as UV, salt spray, seawater and high-low temperatures. To date, there is still not sufficient data and systematic research on the corrosion protection of polymer composite coatings filled with CNT under simulated aging conditions.
In the present work, we have dispersed CNTs in a polyurethane (PU) matrix via the PDA modification method. PDA can serve as a functionalized modifier due to its strong surface adhesion abilities to various surfaces.18 Since the surface of CNTs presented substantial functional groups like –OH and –NH2 via PDA modification,40 the PDA wrapped CNTs (PDA@CNTs) could be chemically grafted onto the backbone of PU via hydrogen bonds. In addition, the influence of CNTs content on the corrosion barrier of the PU composite coating was also investigated via cyclic ageing tests composed of salt spray, UV irradiation, and immersion in time sequence, aiming at assessing the performance of PU nanocomposite coatings in natural environments.
2. Experimental
2.1. Preparation of modified CNTs
The pristine multi-walled carbon nanotubes (CNTs), with an outer diameter of 20–30 nm and length of 10–30 μm, and dopamine hydrochloride (DA) (98%) were purchased from Shanghai Aladdin (China). Tris (hydroxymethyl) aminomethane was supplied by Sinopharm Chemical Reagent. The modification of CNTs was performed as follows: 100 mg of CNTs were dispersed into 50 mL ethanol containing 40 mL deionized water in an ultrasonic bath for 60 min. Dopamine (400 mg) was added and the mixture was magnetically stirred for 5 min afterwards, then 100 mL aqueous solution containing 300 mg Tris was added the mixture, and the solution was kept under constant stirring for 24 h at ambient temperature.41–45 The modified CNTs (denoted as PDA@CNTs) were collected by repeated centrifugation, washed with deionized water for 5 times, and finally dried in a vacuum oven at 50 °C for 24 h. As a comparison, the pure PDA was also synthesized following the same procedure.
2.2. Characterization of modified CNTs
The morphology of CNTs and PDA@CNTs was observed by transmission electron microscopy (TEM, Tecnai G2 20, FEI). The specimens were dispersed in ethanol under ultrasonication, and one drop of the dispersion was placed on the carbon-coated copper grid and then dried at 50 °C. The chemical components and functional groups were investigated by Fourier transform infrared (FTIR) and Raman spectroscopy; FTIR spectra were recorded using a VERTEX 70 FTIR spectrometer (Bruker, Germany) in the range of 600–4000 cm−1. Raman spectra were obtained using LabRAM HR800 (Horiba Jobin Yvon, USA) with a 532 nm Nd-YAG laser at 50 mW in the range of 400–4000 cm−1. The percentage of PDA on CNTs was estimated by thermogravimetric analysis (TGA, Pyris1 TGA, PerkinElmer Instruments), in which a 10 mg PDA@CNTs specimen was heated from 40 °C to 800 °C at the rate of 10 °C min−1 under a nitrogen atmosphere.
2.3. Preparation of the nanocomposite coating
The PU composite coatings with pristine CNTs and PDA@CNTs were prepared via physical incorporation. A commercial two-component polyurethane coating (TS01-19) was obtained from Tianjin Beacon Co, China. Firstly, a certain amount of PDA@CNTs powder was added to tetrahydrofuran and then ultrasonically dispersed for 30 min. Then, the dispersed PDA@CNTs was mixed with polyurethane varnish for another 15 min of ultrasonication. The mixed solvent was mechanically stirred at 80 °C for 20 min to remove tetrahydrofuran. Finally, a certain amount of polyurethane hardener with a weight ratio (polyurethane varnish![[thin space (1/6-em)]](https://www.rsc.org/images/entities/char_2009.gif) :hardener) of 3:1 was added to the mixture and sonicated for 30 min. In this work, different weight percentages of PDA@CNTs in PU matrix at 0.5 wt%, 1.0 wt% and 2.0 wt% were investigated, and named PU-0.5% PDA@CNTs, PU-1.0% PDA@CNTs, PU-2.0% PDA@CNTs, respectively. The effect of pristine CNTs and PDA@CNTs on the anti-corrosion performance of PU coating was compared at the same weight percentage.
:hardener) of 3:1 was added to the mixture and sonicated for 30 min. In this work, different weight percentages of PDA@CNTs in PU matrix at 0.5 wt%, 1.0 wt% and 2.0 wt% were investigated, and named PU-0.5% PDA@CNTs, PU-1.0% PDA@CNTs, PU-2.0% PDA@CNTs, respectively. The effect of pristine CNTs and PDA@CNTs on the anti-corrosion performance of PU coating was compared at the same weight percentage.
CNTs modified PU composites were coated by air spray on AA7075 aluminum alloy discs with thickness of 3 mm and diameter of 45 mm. The bottom side and edge of the discs were sealed with epoxy resin, and the top side, namely the working surface was abraded with emery papers (600 and 800 grit). Afterwards all specimens were degreased with ethanol and acetone in turn, and then dried in open air for 7 days. The dry coating thickness was measured with a digital thickness gauge, Elcometer 415, and was controlled at 100 ± 5 μm.
2.4. Adhesion test
Pull-off adhesion tests were performed to evaluate the adhesion strength of PU coatings with varying CNTs and PDA@CNTs contents on Al-alloy discs. The measurements were completed according to the ASTM D 4541 standard method, and an aluminum dolly with diameter of 20 mm was glued on the surface of the PU coating. All the samples were kept at 30 °C for 24 h to make sure the glue was completely cured. After the fixture was loaded, the pull-off test was conducted at a rate of 1.0 MPa s−1 until the PU coating was detached from the Al-alloy by using a pull-off adhesion tester (PosiTest AT-A, Defelsko Co.).
2.5. Accelerated ageing tests
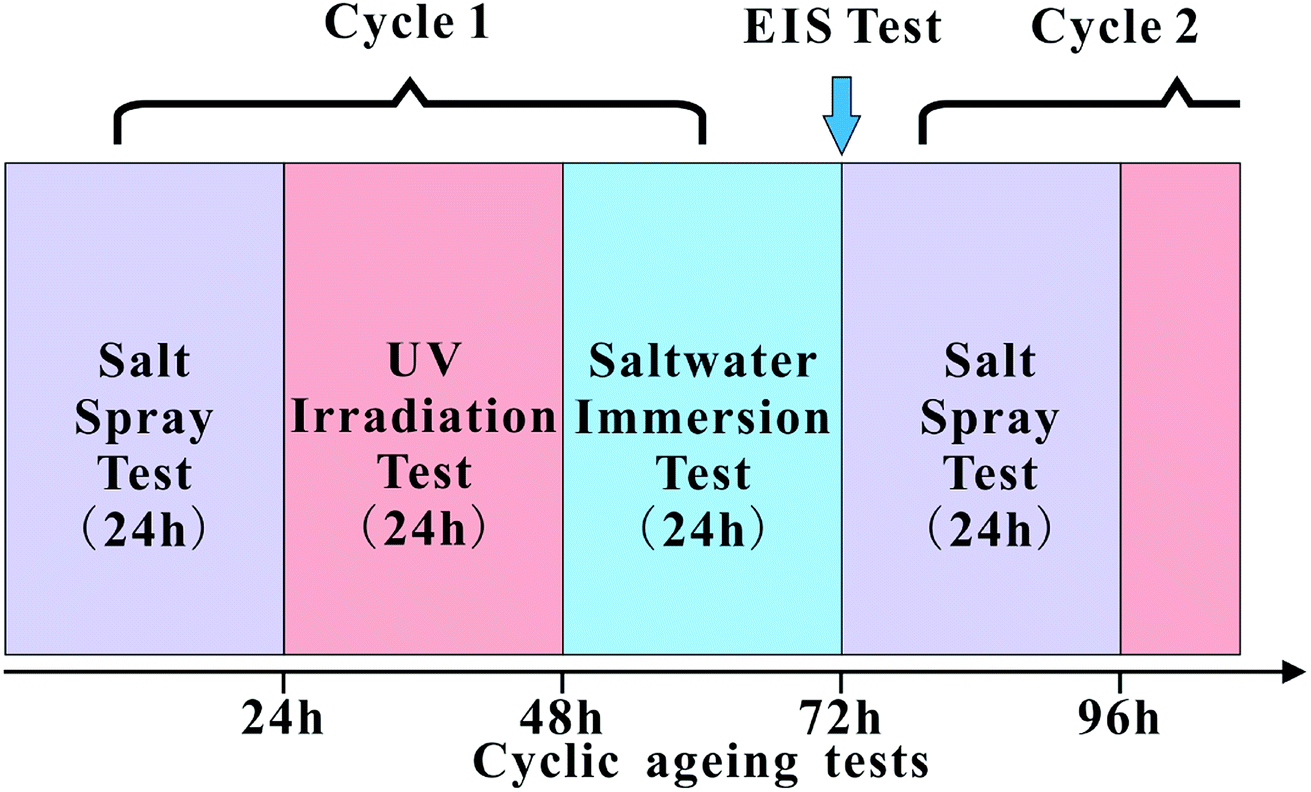
The influence of CNTs and PDA@CNTs on the corrosion barrier of the PU coating was conducted under ageing conditions. The cyclic ageing program consisted of salt spray, ultraviolet (UV) irradiation and salt solution immersion tests. A neutral salt spray test (SST) was conducted according to the ISO 7253 standard in a salt spray chamber. All samples were exposed to neutral 5 wt% NaCl spray, with the chamber temperature maintained at 35 ± 2 °C. UV testing was performed in a UVA chamber, in which distilled water was heated at the bottom to maintain the temperature at 50 °C, while fluorescent lamps with irradiance of 0.77 W m−2 (at 340 nm) were used according to ASTM G154. The salt solution immersion test was conducted at 40 °C with all samples being immersed in 3.5 wt% NaCl aqueous solution. All coating samples were tested for 24 h under each ageing condition. The cyclic ageing program is shown in Fig. 1.
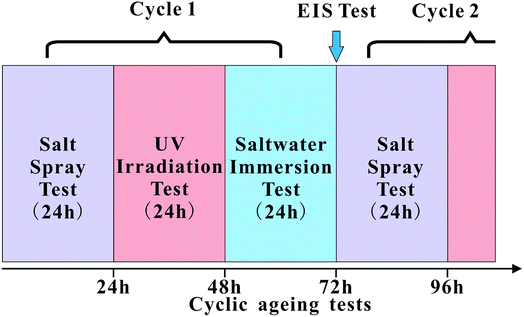 |
| | Fig. 1 Schematic of the cyclic ageing tests composed of the salt spray test (SST), UV irradiation (UV) and salt solution immersion test (IT). | |
2.6. EIS measurements
Electrochemical impedance spectroscopy (EIS) was applied to assess the influence of the CNTs on the corrosion barrier of PU coating. A conventional three-electrode cell was employed for electrochemical measurements in 3.5 wt% NaCl solution, with the PU coated Al disc acting as the working electrode with an exposed area of 9.6 cm2, platinum mesh as the counter electrode and Ag/AgCl as the reference electrode. The testing cells were made of a PMMA cylinder with 35 mm inner diameter, in which the PU sample was clamped to the bottom of the cylinder via a rubber gasket for fast mounting and dismounting of the coated sample. EIS measurement was conducted via an electrochemical workstation (CS350, Corrtest, China) at open circuit potential in the frequency range from 105 Hz to 10−2 Hz with 20 mV sinusoidal amplitude. All EIS measurements of PU coated samples were carried out after each ageing cycle.
2.7. Characterization
Differential scanning calorimetry (DSC) was performed to determine the glass transition temperature (Tg) of the PU coating with different contents of CNTs and PDA@CNTs. The measurements were carried out via a Diamond DSC (PerkinElmer Instruments) thermal analyser in nitrogen atmosphere at a scanning rate of 10 °C min−1 from −30 °C to 150 °C. The chemical structures of PU coatings before and after cyclic ageing tests were characterized by Fourier transform infrared (FTIR) spectrum with an attenuated total reflectance (ATR) accessory (VERTEX 70 FTIR spectrometer, Bruker, Germany) in the wavenumber range from 650 cm−1 to 4000 cm−1. Total 64 scans were performed on each specimen with a resolution of 8 cm−1. The morphologies of the PU composite coatings, before and after cyclic ageing tests, were observed via field emission scanning electron microscopy (FE-SEM, FEI, Sirion 200, Netherlands) and atomic force microscope (AFM, SPM 9700, Shimadzu, Japan).
3. Results and discussion
3.1. Modification of CNTs
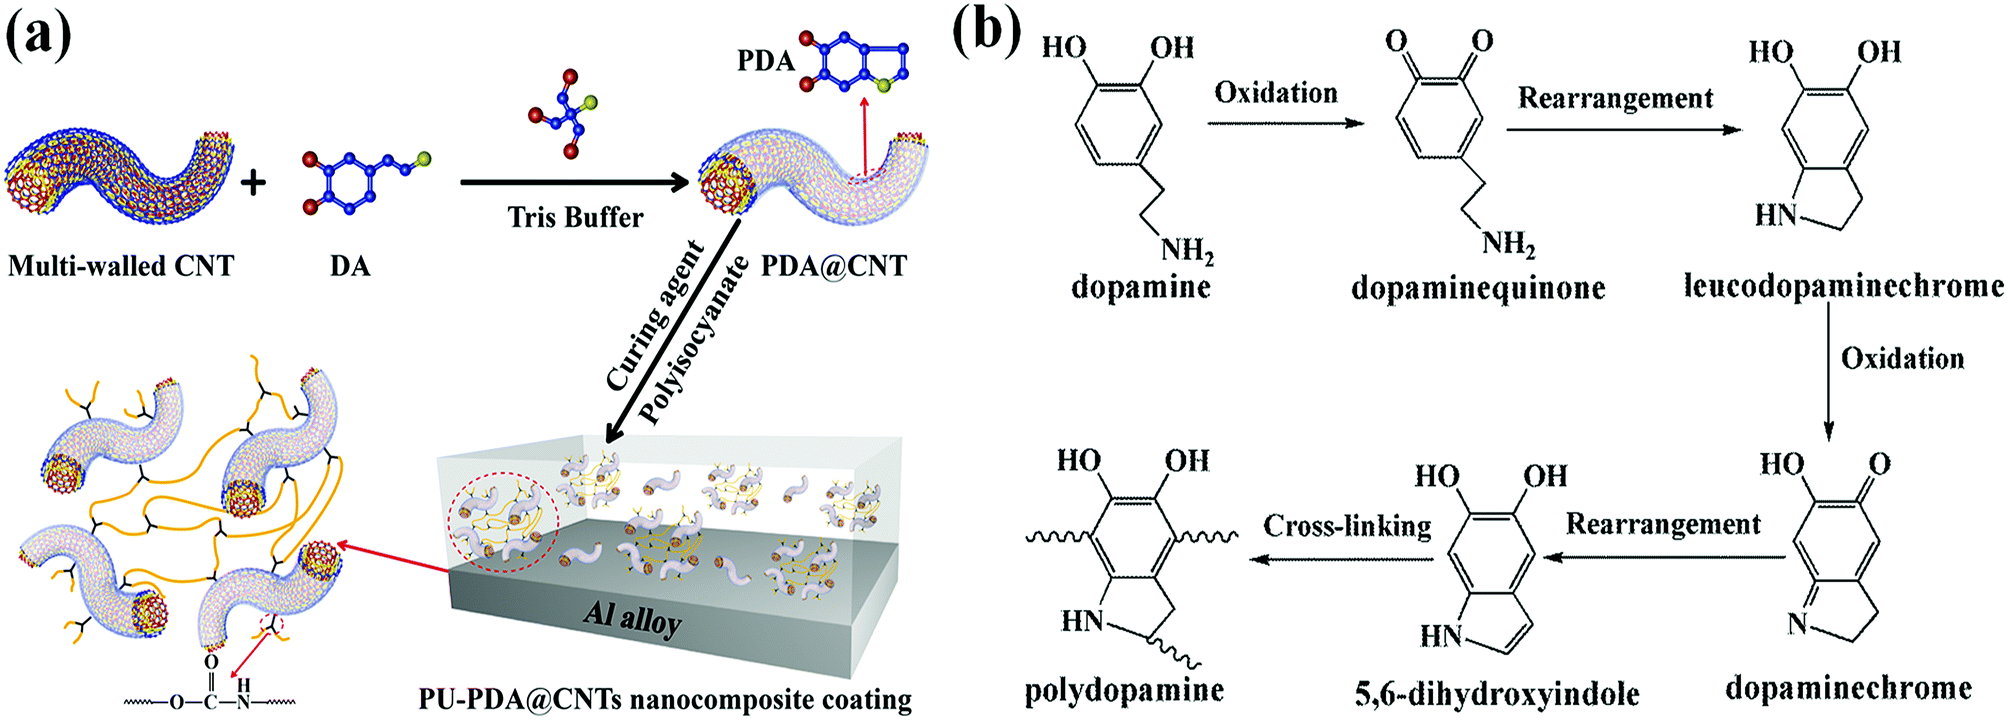
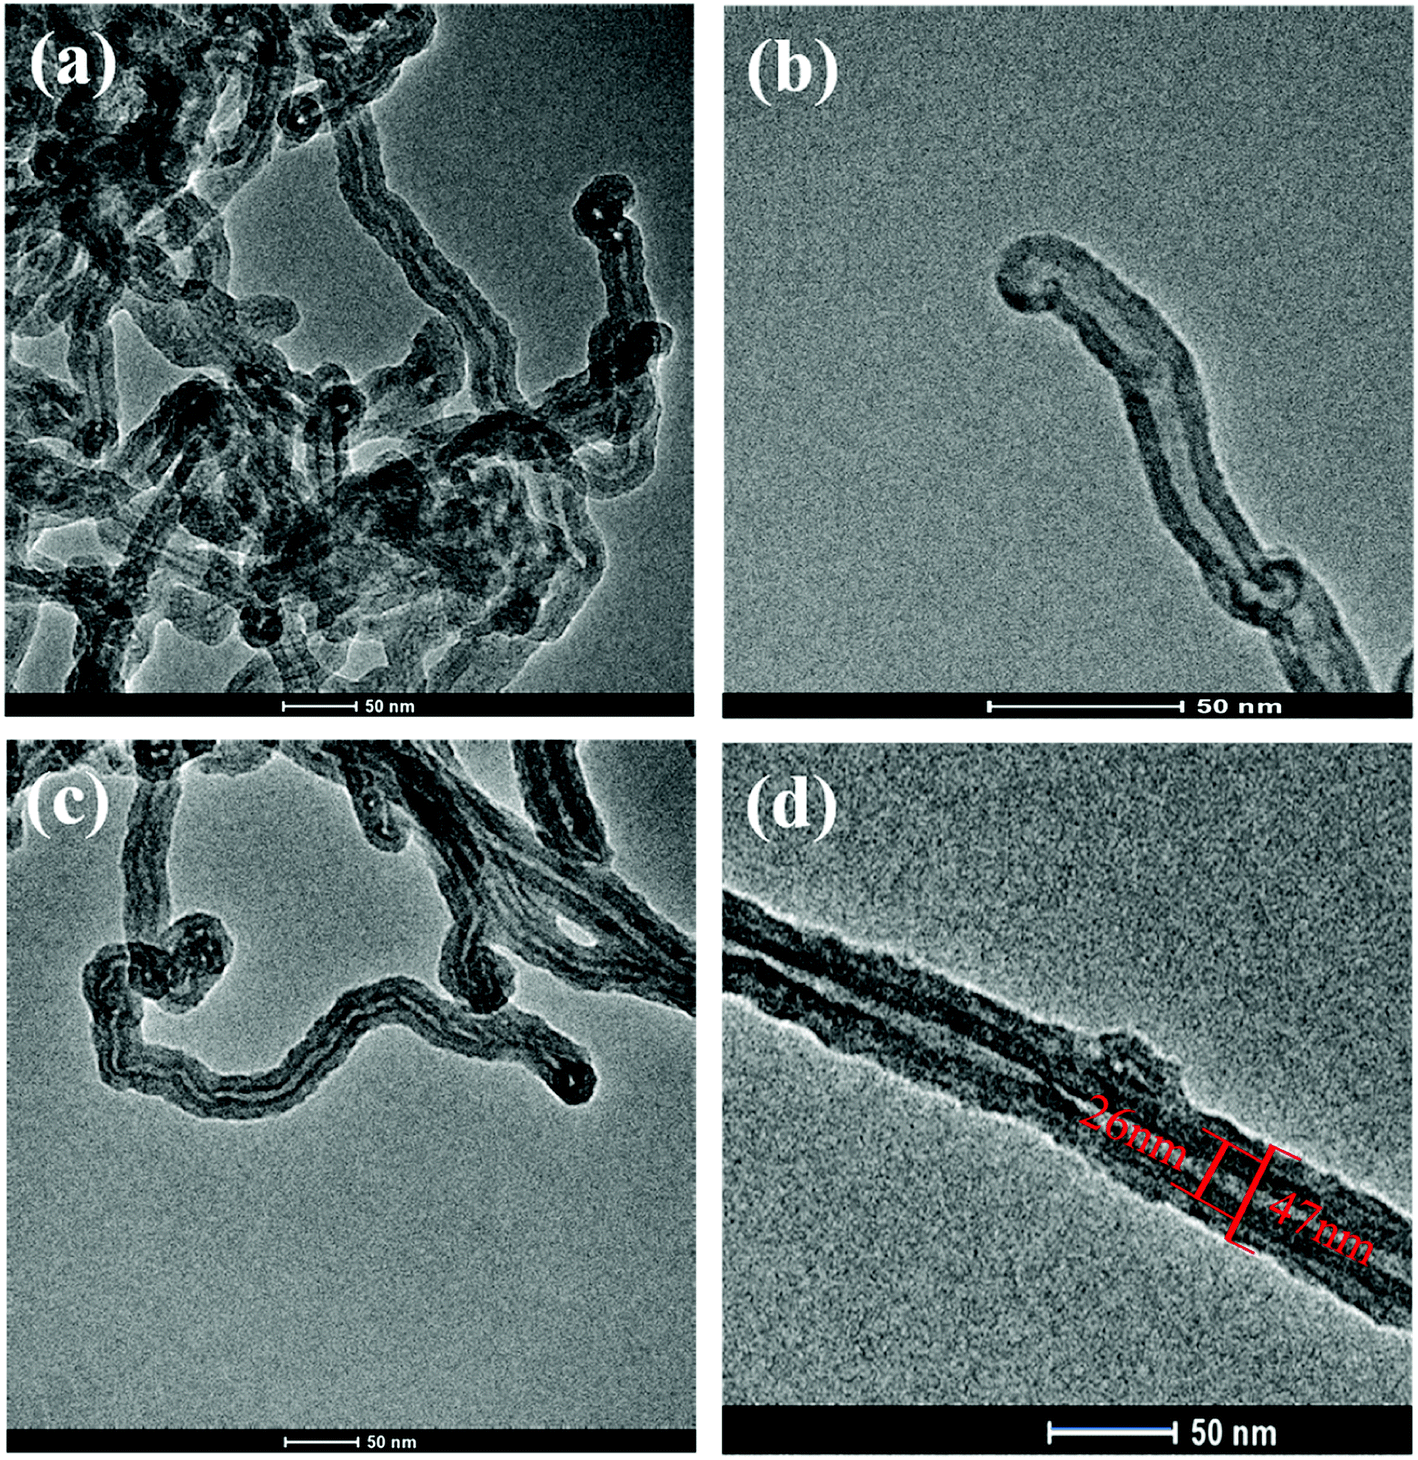
The dopamine monomer can be oxidized and self-polymerized to form a thin surface coating on the surface of CNTs in the alkaline buffer solution. The dopamine modified CNTs and PU-PDA@CNTs composite coating were prepared as schematically shown in Fig. 2a. The formation mechanism41,46–51 of PDA from DA is shown in Fig. 2b. First, DA was oxidized to dopamine quinone, which could be recombined into leucodopaminechrome by intramolecular cyclization via 1,4-Michael addition. Then, the leucodopaminechrome was oxidized to dopaminechrome. PDA was finally generated by the polymerization reactions of 5,6-dihydroxyindole obtained from the intramolecular rearrangement of dopaminechrome. During the formation of PDA layer, the presence of catechol groups could promote the adhesion and compatibility of PDA@CNTs in the PU matrix. Fig. 3 shows the TEM images of pristine CNTs and PDA@CNTs. It can be clearly observed that the CNT sidewall is almost uniformly wrapped by a 10 nm thick PDA layer, which exhibited a lower density and lighter colour than the CNT sidewall.42
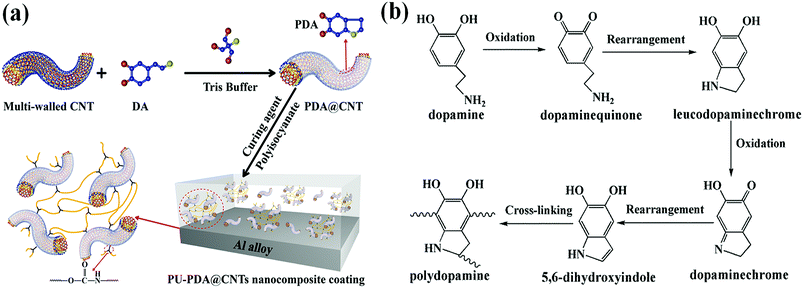 |
| | Fig. 2 (a) Schematic illustration of the CNT modification and the preparation of the PU-PDA@CNTs nanocomposite coating. (b) The formation mechanism of polydopamine from dopamine. | |
 |
| | Fig. 3 TEM images of (a) and (b) pristine CNTs and (c) and (d) PDA@CNTs. | |
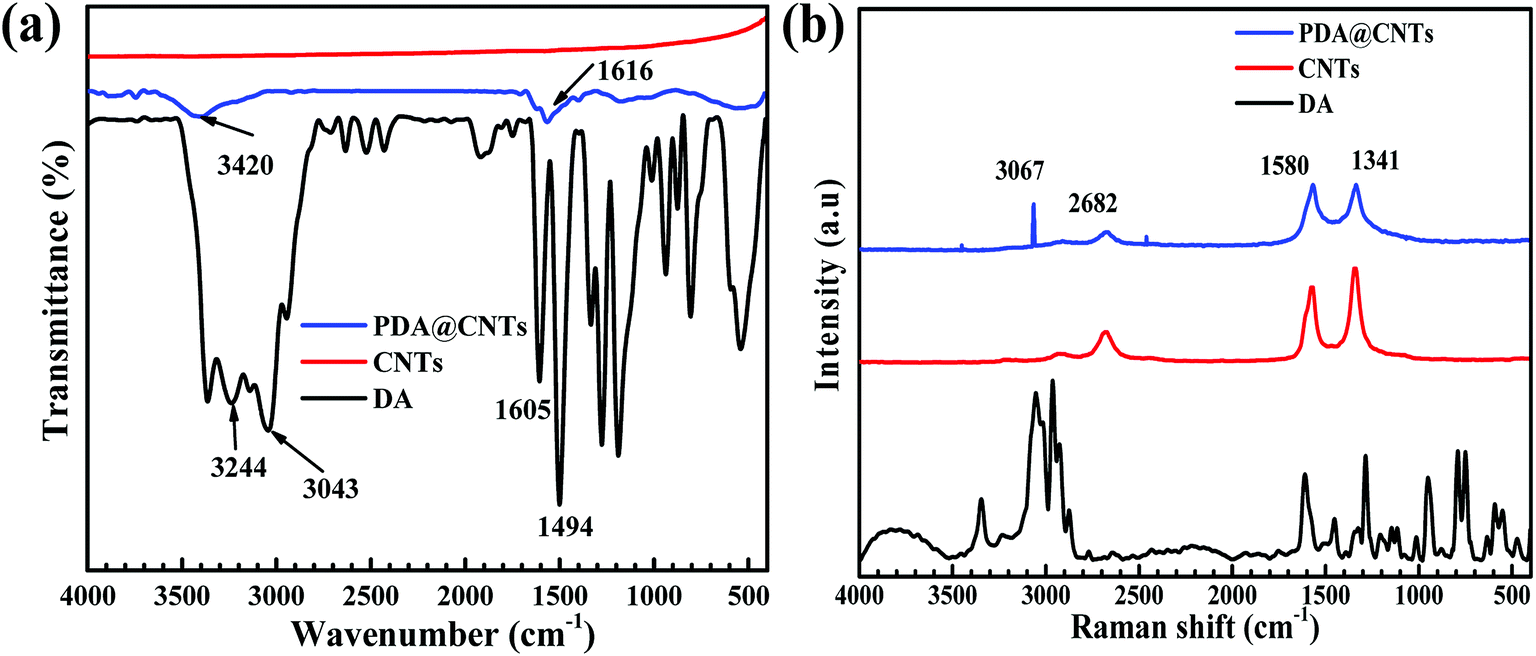
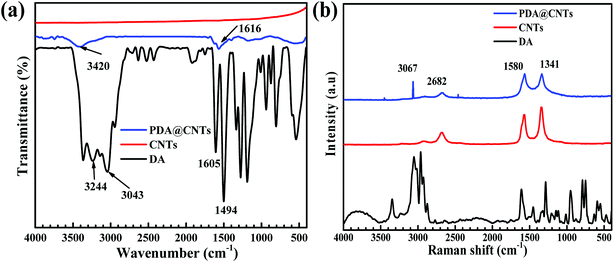
More evidence for the successful modification of CNTs was found from the FTIR and Raman spectra, as shown in Fig. 4. It can be seen that the pristine CNTs show almost no peaks except a weak absorption feature at 1581 cm−1, which is related to benzene rings on the graphite wall of multi-walled carbon nanotubes. For dopamine molecules, there are several characteristic peaks of catechol groups at 3043 cm−1 and 3244 cm−1 and aromatic rings at 1620 cm−1. In contrast, the prepared PDA@CNTs nanoparticles show some new absorption peaks at 3420 cm−1 and 1616 cm−1, which are attributed to N–H and O–H, respectively,18,43,44 indicating that the PDA layer could introduce abundant surface amino and hydroxy groups. The Raman spectrum in Fig. 4b shows the graphene structure of the featured G and D bands at 1580 cm−1 and 1341 cm−1 in pristine CNTs. In addition, the dopamine seems to exhibit similar peaks at 1590 cm−1 and 1330 cm−1, but this pair of peaks could have originated from the aliphatic C–O bonds and benzene rings rather than the G and D bands of CNTs. The PDA@CNTs showed a new peak at 3067 cm−1, relevant to catechol groups;42 hence, FTIR and Raman spectra further confirmed that PDA was successfully grafted on CNTs.
 |
| | Fig. 4 (a) FTIR and (b) Raman spectra of DA, CNTs and PDA@CNTs. | |
3.2. Thermal analysis
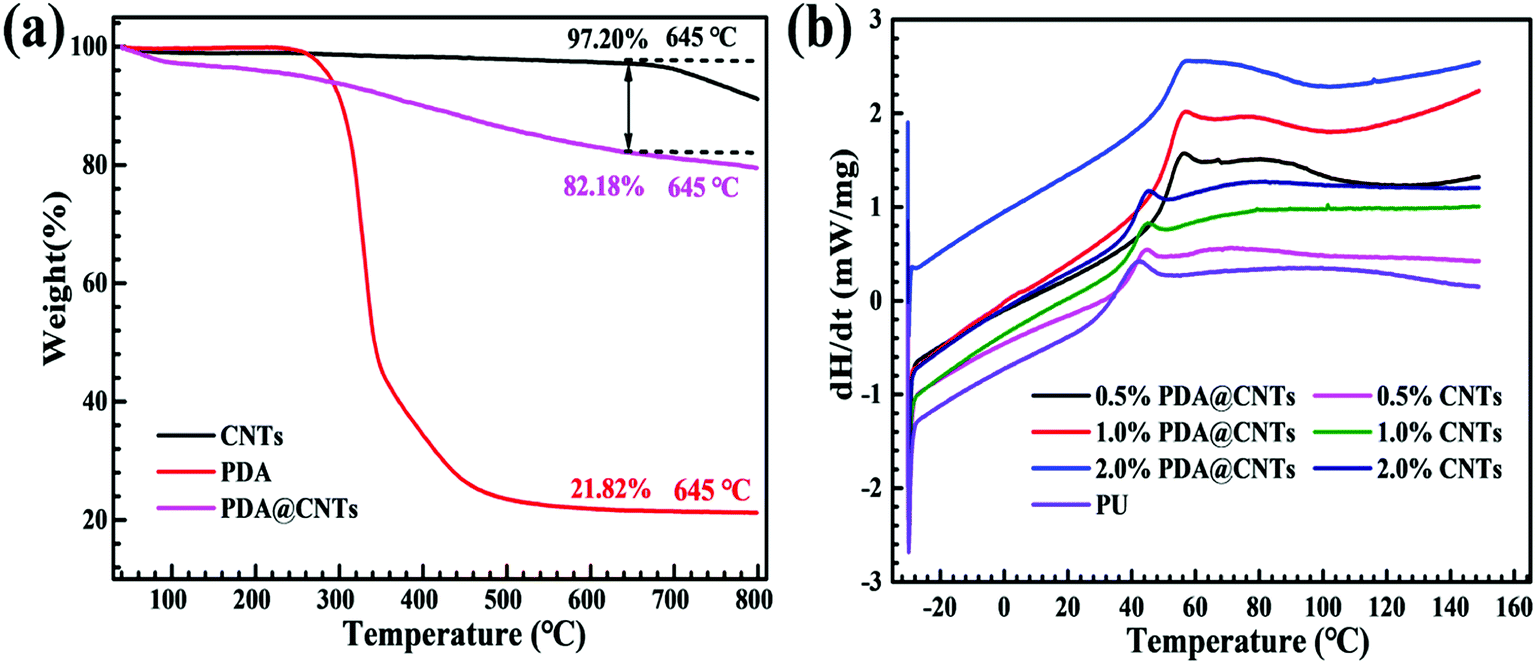
TGA analysis was employed to quantify the amount of PDA wrapped on the CNTs (Fig. 5a). For the pristine CNTs, the TGA plots show that its weight loss was only about 2.8 wt% at 645 °C, while, the weight loss of PDA@CNTs at 645 °C was about 17.82 wt%. Apparently, the additional weight loss of 15 wt% can be ascribed to the decomposition of PDA. Further, considering that the PDA itself has 78.2 wt% weight loss at the same temperature, the loading amount of PDA was calculated to be ∼19.9 wt% in the PDA wrapped CNTs nanomaterials.
 |
| | Fig. 5 (a) TGA curves of CNTs, PDA and PDA@CNTs and (b) DSC curves of PU coating, PU-CNTs and PU-CNTs@PDA nanocomposite coatings. | |
The DSC plot in Fig. 5b shows the effects of CNTs and PDA@CNTs nanofiller content on the glass transition temperature (Tg) of PU coating. The characteristic points of DSC curves are summarized in Table 1. It can be observed that the heat flow value (dH/dt) of DSC curves gradually moved up with increasing CNTs or PDA@CNTs content, and the rising amplitude was much higher for the PU coating filled with PDA@CNTs compared to that filled with pristine CNTs at the same addition amount. As for the Tg values, it increased with the addition of pristine CNTs or PDA@CNTs nanofiller, and the Tg of PU-PDA@CNTs coatings increased more than that of PU-CNTs coating at the same content. The maximum Tg of PU-CNTs coatings was 41.86 °C at 1.0 wt% CNTs loading amount, but it increased to 52.79 °C for PU-PDA@CNTs coatings at the same loading.
Table 1 The glass transition temperature (Tg) and its onset (TOnset) and end (TEnd) temperatures of DSC
| Sample |
TOnset (°C) |
TEnd (°C) |
Tg (°C) |
| PU |
32.80 |
39.37 |
36.91 |
| PU-0.5% CNTs |
38.15 |
42.99 |
40.68 |
| PU-1.0% CNTs |
39.45 |
43.33 |
41.86 |
| PU-2.0% CNTs |
38.60 |
43.93 |
41.37 |
| PU-0.5% PDA@CNTs |
48.89 |
54.36 |
51.56 |
| PU-1.0% PDA@CNTs |
48.91 |
54.90 |
52.19 |
| PU-2.0% PDA@CNTs |
48.68 |
55.65 |
52.79 |
Generally, a higher Tg value means a higher degree of crosslinking for organic polymers. It therefore demonstrates that the PDA@CNTs could better improve the crosslinking degree of PU coatings compared to the CNTs nanofiller, which may be attributed to the hydrophilic PDA layer facilitating the more homogeneous dispersion of the PDA@CNTs nanofiller in the PU matrix. Meanwhile, through π–π stacking interactions and covalent linkage, the PDA layer also provides an additional cross-linking effect on the PU matrix;18 hence, the above two aspects could enhance the crosslinking degree of PU coating.
3.3. Measurement of adhesion strength
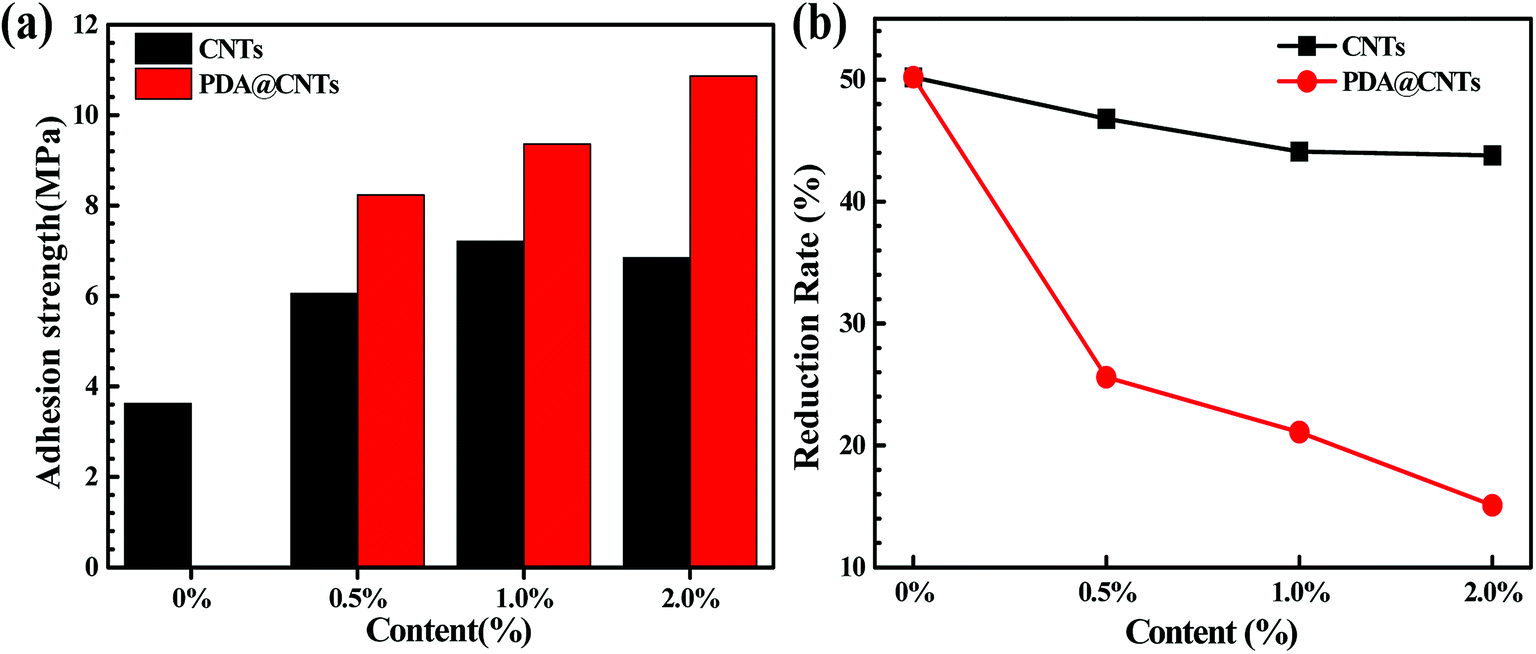
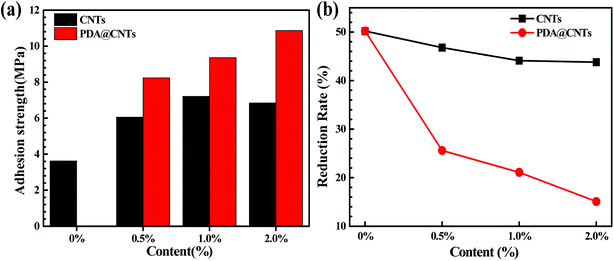
Adhesion strength was calculated from the failure load divided by the adhesive bond area measured after sample failure. Fig. 6a shows the adhesion strength of fresh PU coatings as a function of CNTs and PDA@CNTs loading before the cyclic ageing tests. Obviously, the adhesion strength of the PU coating containing CNTs or PDA@CNTs increased a lot compared to that of the PU coating without nanofiller. Moreover, the increasing amplitude of the PU-PDA@CNTs coating was much higher than that of PU-CNTs coating. The maximum adhesion strength (7.21 MPa) was achieved at 1.0 wt% CNTs loading for the PU-CNTs coatings, and the adhesion strength slightly at 2.0 wt% CNTs loading. However, for the PU-PDA@CNTs coating, the adhesion strength increased monotonously with the increase in PDA@CNTs content in the experiment. It is also worth pointing out that the adhesion strength was still as high as 8.23 MPa, even at 0.5 wt% PDA@CNTs loading, which is much higher than that of PU-CNTs coatings, indicating that the PDA molecules play a key role on the adhesion strength of the PU coating. Fig. 6b shows the reduction rate of the adhesion strength of PU coating after 7 cycles of ageing testing, where the reduction rate decreased slowly with increasing CNTs or PDA@CNTs content. The loss rate of adhesion strength was approximately 50% for the pristine PU coating, and it was more than 40% for all PU-CNTs coatings, which is much higher than that for the PU-PDA@CNTs coatings. However, the adhesion strength loss was only 15% for the PU-2.0% PDA@CNTs coatings, suggesting that the PDA wrapped CNTs could increase the adhesion durability of the PU coating.
 |
| | Fig. 6 Comparison of (a) adhesion strength and (b) reduction rate of the adhesion strength of PU coatings with increasing loading of CNTs and PDA @CNTs after 7 cycles of ageing tests. | |
The above results clearly indicate that both pristine CNTs and modified PDA@CNTs have positive effects on the adhesion strength of the PU coating, and their anti-stripping ability was still high after 7 cycles of ageing testing. This can be ascribed to the nanofiller-enhanced interfacial adhesion between the coating and the Al alloy substrate. Generally, the shear stress at the coating/substrate interface is the main factor for the decrease in adhesion strength, and the shear stress originated from the residual stress inside the coating during the coating curing process. The incorporation of CNTs as a second component in the PU matrix can relax the residual stress inside coating by shearing the weakly bound carbon aggregates against the PU matrix.13,19,52 Hence, the added CNTs could improve the adhesion strength of the PU composite coating on the underlying Al-alloy. However, the pristine CNTs with high hydrophobicity are difficult to disperse in polar polymers such as polyurethane. As a result, the agglomeration of pristine CNTs in the PU-CNTs nanocomposite coatings could weaken the positive effect of the CNTs on the adhesion strength. On the other hand, the PDA@CNTs could be evenly dispersed in the PU matrix via the inherent bonding between PDA molecules and the –NH2 groups in polyurethane due to the availability of abundant –OH moieties on the PDA layer.36 Therefore, the adhesion strength of PU-PDA@CNTs coatings could increase with increasing PDA@CNTs content.
3.4. Measurement of the corrosion protection
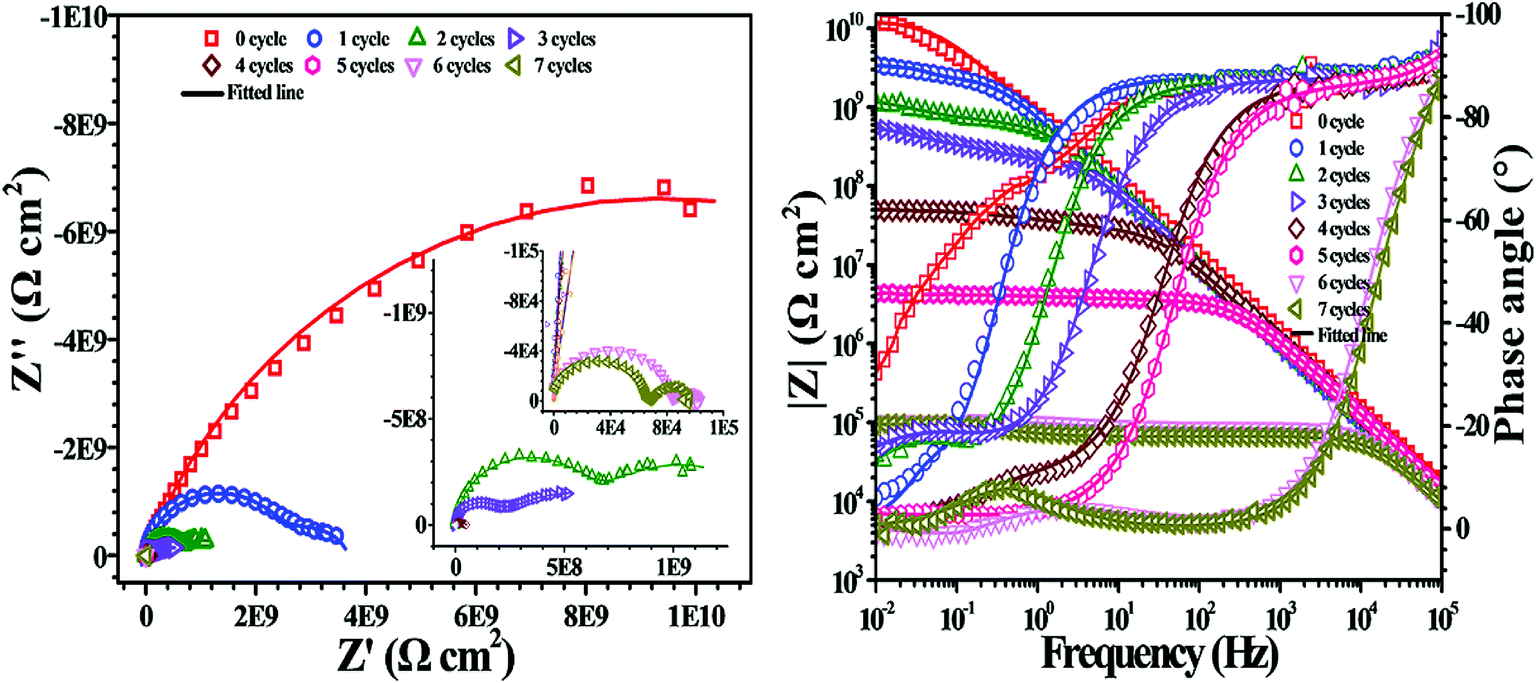
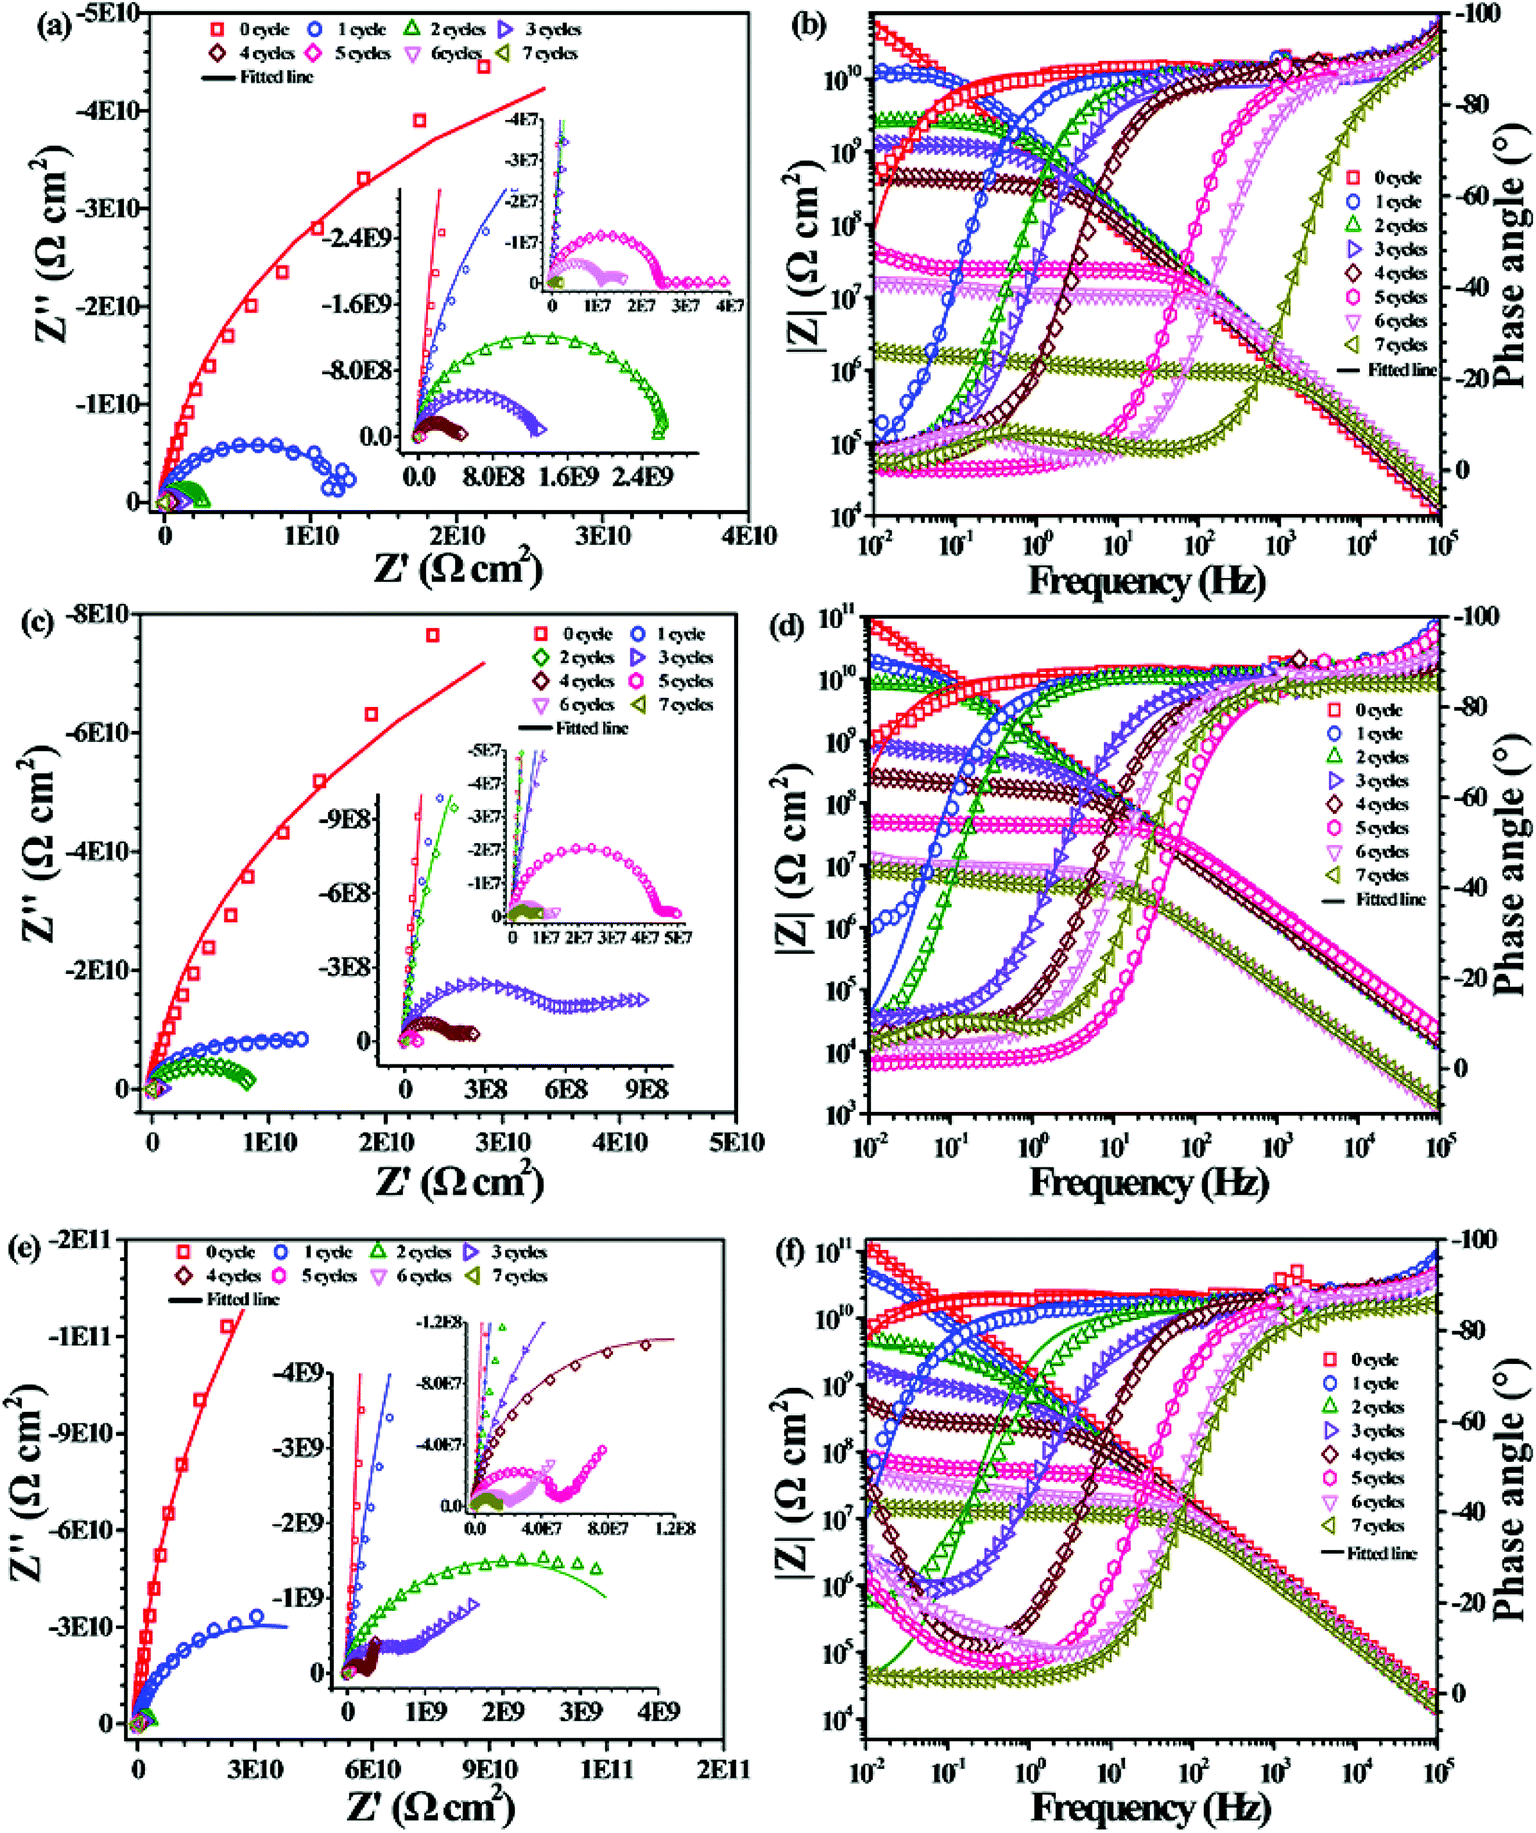
The corrosion resistance of PU nanocomposite coatings incorporating CNTs and PDA@CNTs was evaluated by EIS during the cyclic ageing tests. Fig. 7 shows the Nyquist and Bode plots for the pristine PU coating as a function of the number of cycles in the ageing tests. It was found that the Nyquist plot had only a single semicircle with the impedance at the low frequency (0.01 Hz, named Z10 mHz) close to 1010 Ω cm2 before the cyclic ageing test, and the semicircle gradually shrank with prolonged ageing tests. After two ageing test cycles (144 h), a second semicircle appeared in the low-frequency region. The Nyquist plot of the PU coating contained a nearly complete semicircle corresponding to the bulk properties of the PU coating in the high-frequency region, and an incomplete semicircle in the low-frequency region corresponding to the double-layer capacitance and charge transfer resistance at the Al substrate/electrolyte interface. The second semicircle was attributed to the corrosion of the Al substrate after water and aggressive ion migration to the interface of the coating/Al substrate. From Fig. 7, the Z10 mHz of the PU coating remained at 107 Ω cm2 during the first 5 cycles of the ageing test, and then was abruptly reduced to below 105 Ω cm2, indicating that the PU coating failed to protect the Al-alloy substrate after 360 h.
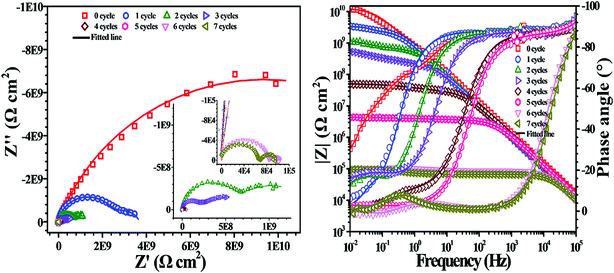 |
| | Fig. 7 EIS of pristine PU coating as a function of cycles of ageing tests. | |
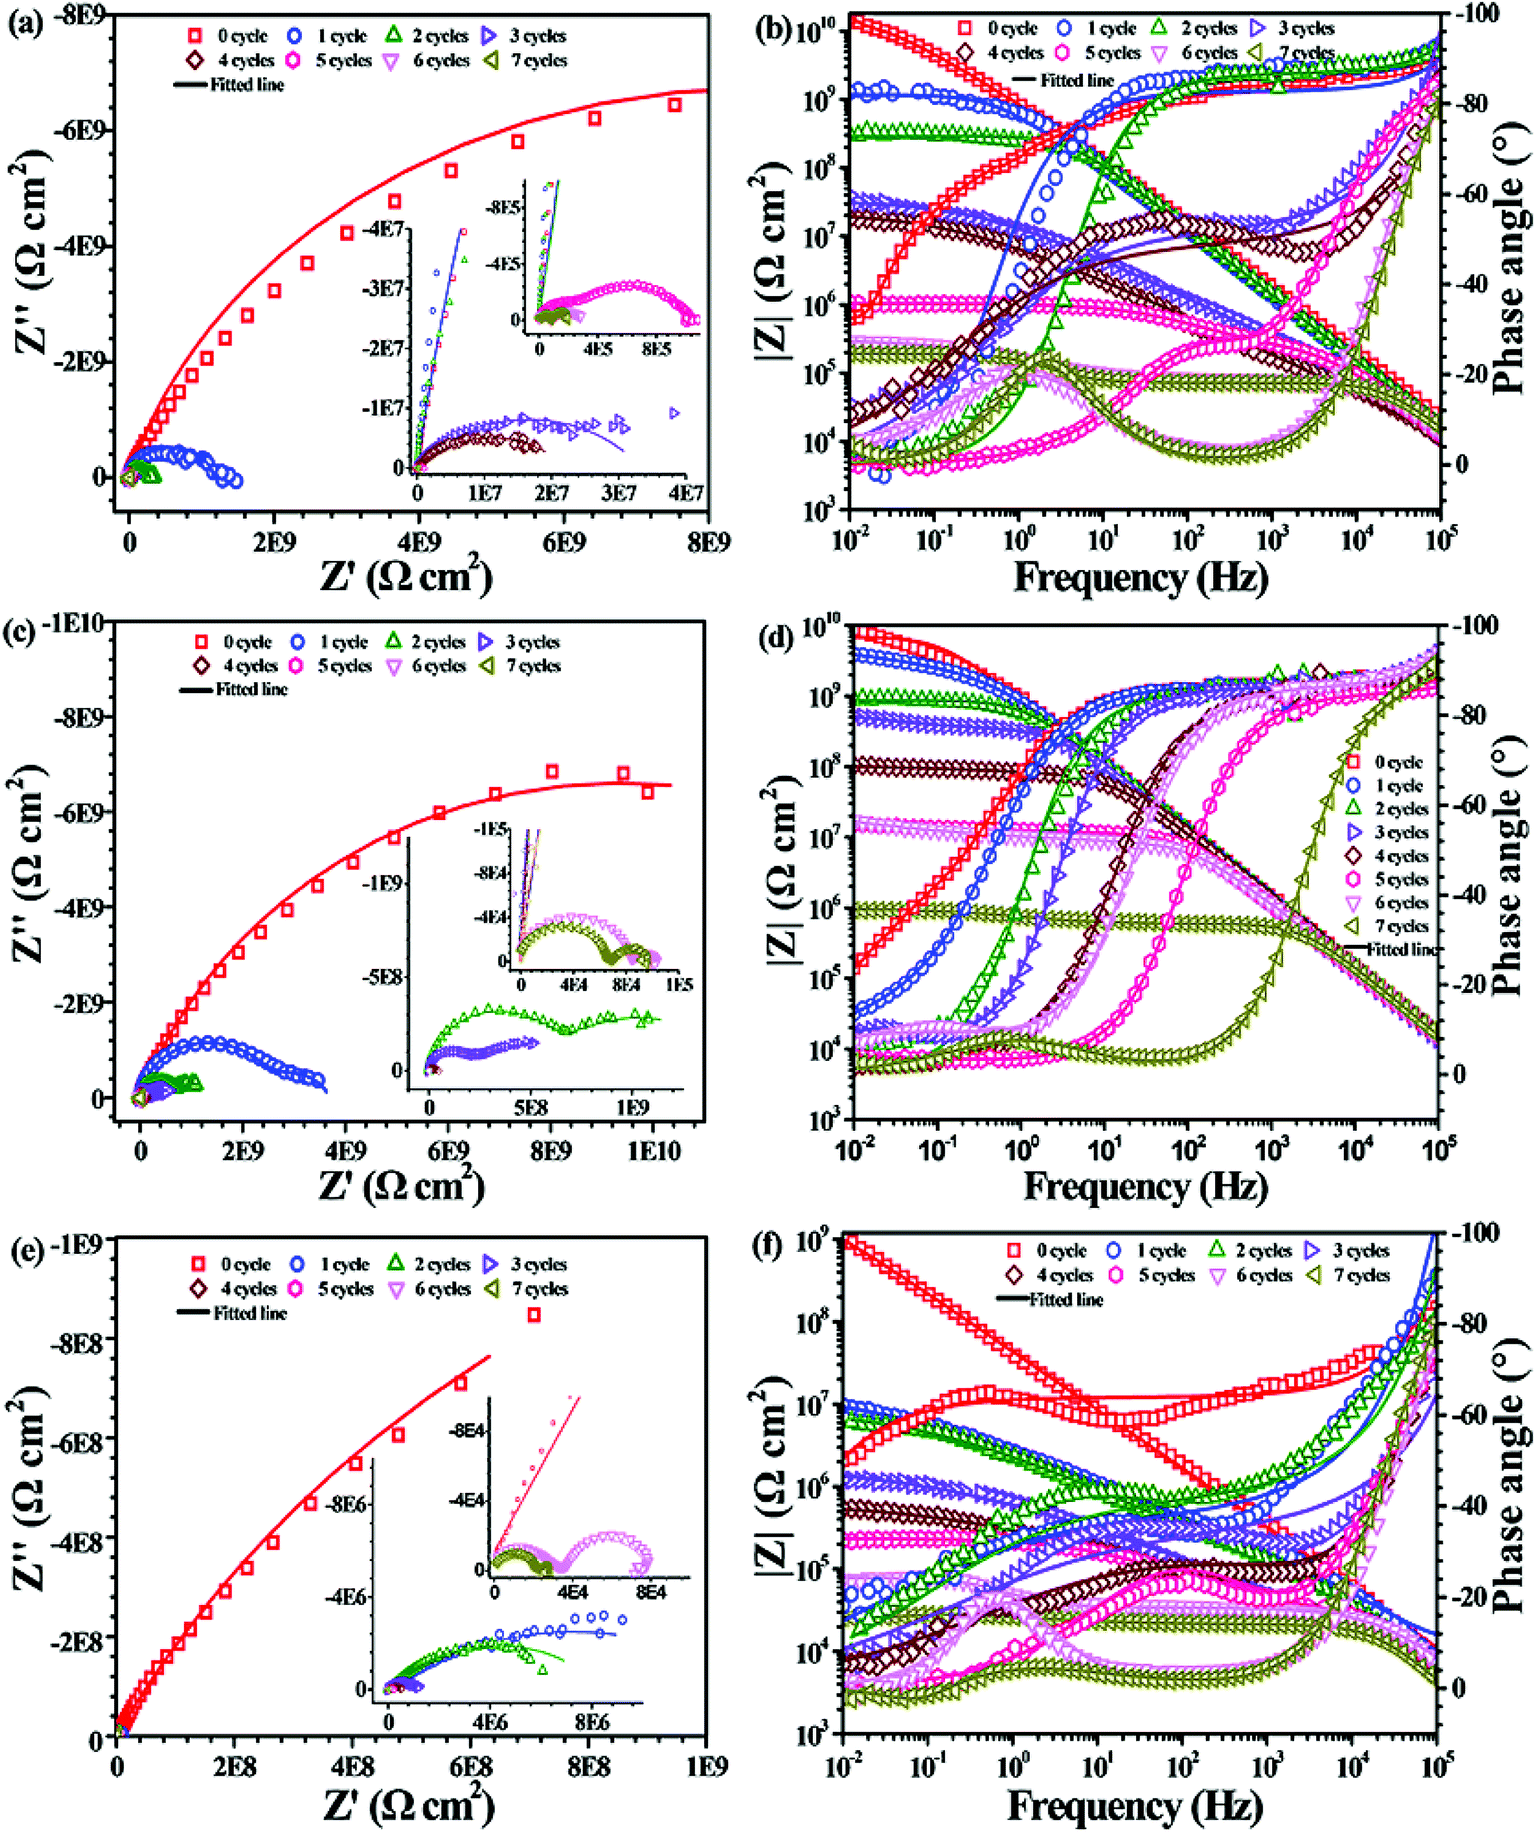
Fig. 8 shows the EIS of the PU nanocomposite coating with different CNTs contents against prolonged cyclic ageing tests. It shows that the PU-CNTs nanocomposite coating with 0.5 wt% and 1.0 wt% CNTs loading could improve the overall corrosion resistance. The low-frequency impedance of the PU-0.5% CNTs coating had a faster decrease than that of pristine PU coating before the first 4 cycles of the ageing test, but it was still higher than that of the PU coating even after 7 cycles. As for the PU-1.0% CNTs coating, the low-frequency impedance had a significant improvement compared to the pure PU coating (Fig. 7) and PU-0.5% CNTs coating (Fig. 8a). The Z10 mHz was still greater than 107 Ω cm2 after 6 cycles, indicating that the incorporation of CNTs had a positive effect on the corrosion barrier of the PU coatings. However, when the CNTs loading in the PU coating increased to 2.0 wt%, Z10 mHz was reduced to 107 Ω cm2 after the first cyclic ageing test. It continued to decrease with ageing cycles and finally dropped to 5 × 10⁴ Ω cm2 after 7 cycles of ageing tests; it was supposed that an overdose of CNTs (2.0 wt% here) could deteriorate the corrosion barrier of the PU coating. This may be attributed to the poor dispersity of pristine CNTs in the coating matrix. In addition, serious aggregations also cause plenty of through-pore defects in the PU coating, which provides easy pathways for aggressive ions to ingress.
 |
| | Fig. 8 EIS of the PU nanocomposite coating with different CNTs loadings as a function of cycles of ageing tests: (a and b) 0.5 wt% CNTs, (c and d) 1.0 wt% CNTs, (e and f) 2.0 wt% CNTs. | |
Fig. 9 shows the EIS of the PU nanocomposite coatings containing different PDA@CNTs nanofillers with prolonged cyclic ageing tests. The corrosion barrier of ingress PU-0.5% PDA@CNTs coating improved significantly compared to the PU coating. For example, the Z10 mHz of the former was above 108 Ω cm2 after 4 cycles of ageing tests and it remained at >106 Ω cm2 after 7 cycles, as shown in Fig. 9a and b. Furthermore, the PU-PDA@CNTs nanocomposite coatings with 1.0 wt% and 2.0 wt% PDA@CNTs filler loading also exhibited better corrosion resistance than the PU coating and PU-CNTs coating at the same filler loading. The Z10 mHz of the PU-2.0% PDA@CNTs coating remained above 107 Ω cm2 even after 7 cycles of ageing tests. The Nyquist plot shows a semicircle at the high-frequency region and a 45° slope at the low-frequency region after 3 cycles, indicating that the oxygen diffusion through the PU composite coating dominated the corrosion of the Al substrate. After 7 cycles, the second semicircle appeared, as shown in Fig. 9e, demonstrating that the PU coating containing PDA@CNTs has a better anti-corrosion performance, possibly due to the nanofiller blocking the ingression of water and aggressive ions.
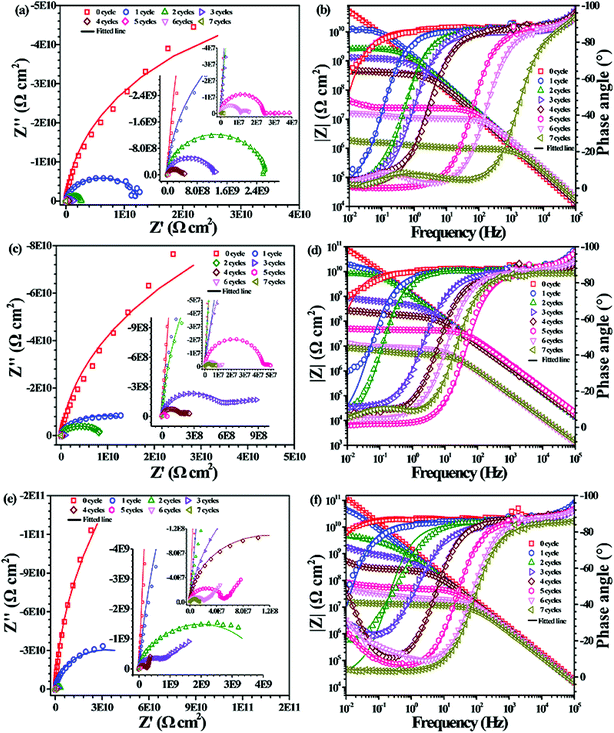 |
| | Fig. 9 EIS of the PU nanocomposite coating with different PDA @CNTs loadings as a function of cycles of ageing tests: (a and b) 0.5 wt% PDA @CNTs, (c and d) 1.0 wt% PDA @CNTs, (e and f) 2.0 wt% PDA @CNTs. | |
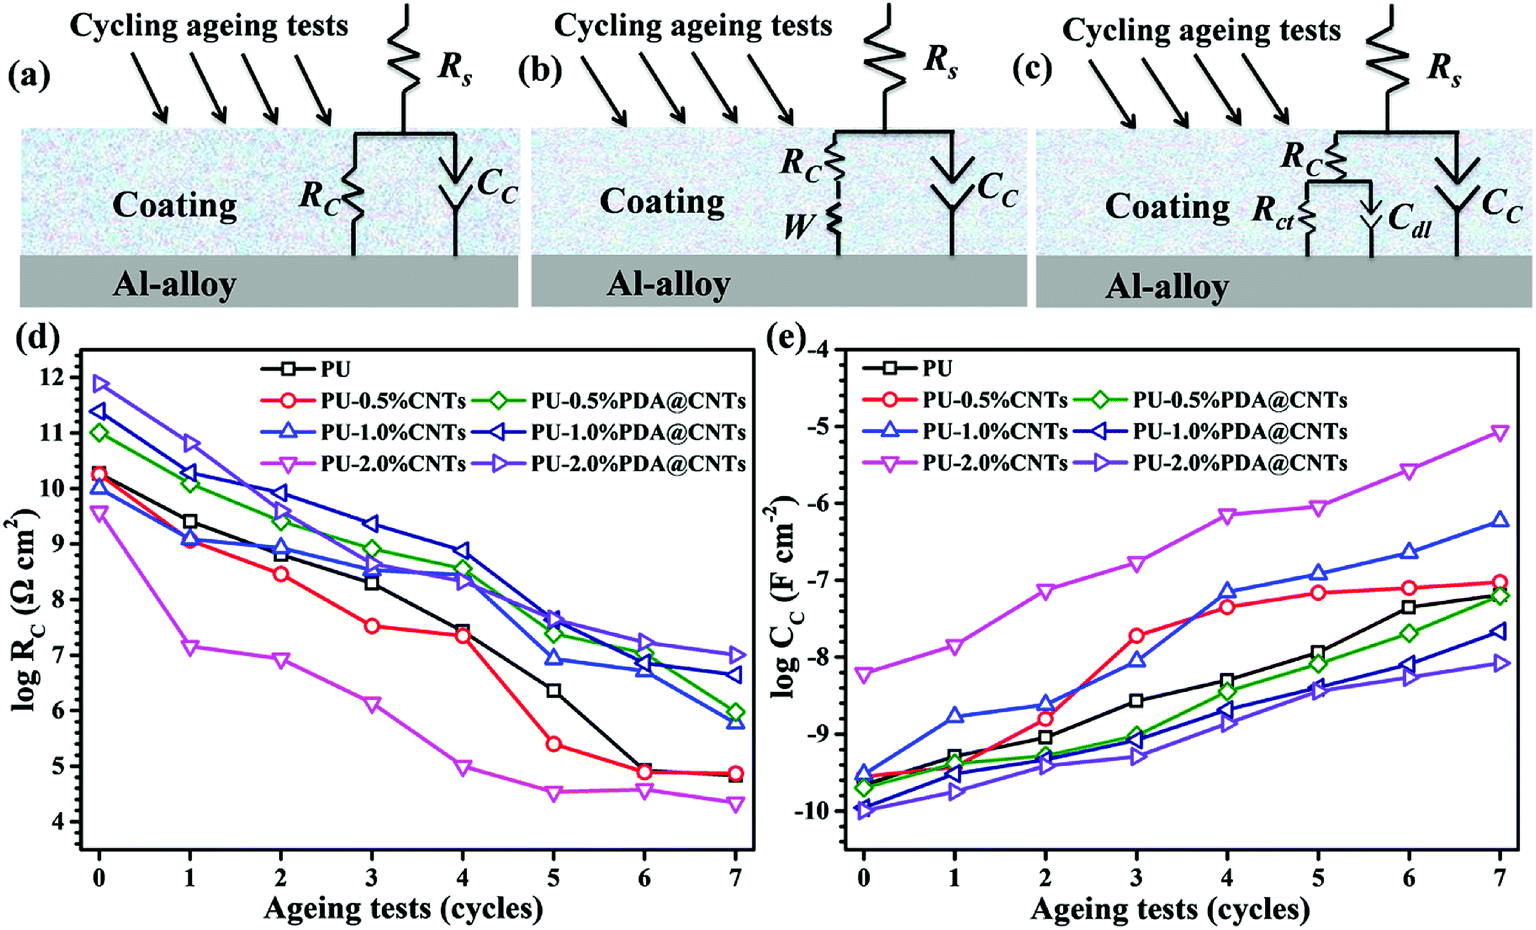
Equivalent electrical circuits (EECs) in Fig. 10a–c were used to fit the EIS data of the PU and PU nanocomposite coatings at different ageing stages. The EEC in Fig. 10a is suitable for single-semicircle EIS curves corresponding to an intact coating, and those in Fig. 10b and c are often employed to fit the EIS of a partially degraded (featuring a semicircle at high frequency and a slope at low frequency regions) and a fully degraded coating (with two semicircles), respectively. Considering the current dispersion effect of coated electrodes, all capacitive elements were replaced by constant phase angle elements (CPE) in the above EECs. Accordingly, the corresponding fitting curves are shown as solid lines in Fig. 7–9, and the corresponding EIS data are shown in Tables 2–4. Fig. 10d and e shows the values of RC and CC versus the cycle number of ageing tests. It is found that RC was reduced quickly and CC increased with prolonged cyclic ageing tests for the pristine PU coating. The rates of decreasing RC and increasing CC for PU-1.0% CNTs and PU-2.0% CNTs coatings were higher than those of PU coating. However, the rates for the PU-0.5% CNTs coating were lower than those of the PU coating, suggesting that 0.5 wt% CNTs is beneficial to the corrosion resistance of the PU based coating, whereas the overdosed CNTs loading could be harmful. On the other hand, the PU-PDA@CNTs nanocomposite coating exhibited the lower trend of RC decrease and CC rise compared with the pristine PU coating and PU-CNTs nanocomposite coatings, and the PU coating with 2.0% PDA@CNTs had better durability for anti-corrosion than the PU coating with lower PDA@CNTs loading. The EIS results fully demonstrated that the PDA modified CNTs could dramatically enhance the corrosion resistance of PU coating.
 |
| | Fig. 10 (a–c) Equivalent circuit models used to fit the EIS plots. Rc: coating resistance, CC: coating capacitance, Rct: charge transfer resistance, Cdl: double layer capacitance, W: short Warburg element, and variations of (d) Rc and (e) CC versus cycles of ageing tests. | |
Table 2 Fitting results of EIS of PU coatings under cycling ageing tests
| |
0 cycle |
1 cycle |
2 cycles |
3 cycles |
4 cycles |
5 cycles |
6 cycles |
7 cycles |
| RC (Ω cm2) |
1.87 × 10¹⁰ |
2.57 × 10⁹ |
6.49 × 10⁸ |
1.98 × 10⁸ |
2.70 × 10⁷ |
2.32 × 10⁶ |
8.43 × 10⁴ |
6.83 × 10⁴ |
| CC (F cm−2) |
2.21 × 10⁻¹⁰ |
5.15 × 10⁻¹⁰ |
9.04 × 10⁻¹⁰ |
2.70 × 10⁻⁹ |
5.01 × 10⁻⁹ |
1.15 × 10⁻⁸ |
4.45 × 10⁻⁸ |
6.45 × 10⁻⁸ |
| CC-n |
0.92 |
0.92 |
0.96 |
0.97 |
0.96 |
0.95 |
0.97 |
0.96 |
| Rct (Ω cm2) |
|
1.12 × 10⁹ |
8.42 × 10⁸ |
6.89 × 10⁸ |
2.48 × 10⁷ |
7.16 × 10⁵ |
2.41 × 10⁴ |
2.18 × 10⁴ |
| Cdl (F cm−2) |
|
4.81 × 10⁻⁹ |
9.41 × 10⁻⁹ |
9.46 × 10⁻⁹ |
1.82 × 10⁻⁸ |
1.99 × 10⁻⁶ |
8.60 × 10⁻⁶ |
1.74 × 10⁻⁵ |
| Cdl-n |
|
0.76 |
0.71 |
0.61 |
0.65 |
0.63 |
0.63 |
0.82 |
Table 3 Fitting results of EIS of PU-CNTs nanocomposite coatings under cycling ageing tests
| |
|
0 cycle |
1 cycle |
2 cycles |
3 cycles |
4 cycles |
5 cycles |
6 cycles |
7 cycles |
| PU-0.5% CNTs |
RC (Ω cm2) |
1.81 × 10¹⁰ |
1.17 × 10⁹ |
2.91 × 10⁸ |
3.34 × 10⁷ |
2.23 × 10⁷ |
2.52 × 10⁵ |
7.87 × 10⁴ |
7.40 × 10⁴ |
| CC (F cm−2) |
2.81 × 10⁻¹⁰ |
3.75 × 10⁻¹⁰ |
1.57 × 10⁻⁹ |
1.90 × 10⁻⁸ |
4.46 × 10⁻⁸ |
6.86 × 10⁻⁸ |
7.94 × 10⁻⁸ |
9.48 × 10⁻⁸ |
| CC-n |
0.91 |
0.92 |
0.91 |
0.88 |
0.89 |
0.91 |
0.95 |
0.96 |
| Rct (Ω cm2) |
|
|
|
|
|
7.83 × 10⁵ |
2.25 × 10⁵ |
1.20 × 10⁵ |
| Cdl (F cm−2) |
|
|
|
|
|
2.97 × 10⁻⁸ |
2.51 × 10⁻⁶ |
1.24 × 10⁻⁶ |
| Cdl-n |
|
|
|
|
|
0.66 |
0.62 |
0.89 |
| PU-1.0% CNTs |
RC (Ω cm2) |
1.01 × 10¹⁰ |
1.23 × 10⁹ |
8.59 × 10⁸ |
3.42 × 10⁸ |
2.78 × 10⁸ |
8.54 × 10⁶ |
5.20 × 10⁶ |
5.92 × 10⁵ |
| CC (F cm−2) |
3.01 × 10⁻¹⁰ |
1.68 × 10⁻⁹ |
2.42 × 10⁻⁹ |
4.95 × 10⁻⁹ |
7.06 × 10⁻⁸ |
1.21 × 10⁻⁷ |
2.27 × 10⁻⁷ |
5.92 × 10⁻⁷ |
| CC-n |
0.94 |
0.96 |
0.91 |
0.95 |
0.95 |
0.90 |
0.95 |
0.96 |
| Rct (Ω cm2) |
|
|
|
3.23 × 10⁸ |
4.10 × 10⁸ |
7.19 × 10⁷ |
1.13 × 10⁷ |
3.77 × 10⁵ |
| Cdl (F cm−2) |
|
|
|
1.61 × 10⁻⁸ |
2.63 × 10⁻¹⁰ |
1.98 × 10⁻⁷ |
2.42 × 10⁻⁷ |
1.12 × 10⁻⁶ |
| Cdl-n |
|
|
|
0.60 |
0.52 |
0.51 |
0.56 |
0.63 |
| PU-2.0% CNTs |
RC (Ω cm2) |
3.81 × 10⁹ |
1.46 × 10⁷ |
8.54 × 10⁶ |
1.38 × 10⁶ |
9.96 × 10⁴ |
3.44 × 10⁴ |
3.80 × 10⁴ |
2.21 × 10⁴ |
| CC (F cm−2) |
6.16 × 10⁻⁹ |
1.43 × 10⁻⁸ |
7.45 × 10⁻⁸ |
1.70 × 10⁻⁷ |
7.14 × 10⁻⁷ |
9.04 × 10⁻⁷ |
2.74 × 10⁻⁶ |
8.65 × 10⁻⁶ |
| CC-n |
0.89 |
0.76 |
0.73 |
0.77 |
0.76 |
0.84 |
0.77 |
0.92 |
| Rct (Ω cm2) |
|
|
|
|
6.27 × 10⁵ |
2.03 × 10⁵ |
4.42 × 10⁴ |
9.07 × 10³ |
| Cdl (F cm−2) |
|
|
|
|
1.04 × 10⁻⁶ |
3.42 × 10⁻⁶ |
7.85 × 10⁻⁶ |
3.84 × 10⁻⁵ |
| Cdl-n |
|
|
|
|
0.37 |
0.57 |
0.86 |
0.51 |
Table 4 Fitting results of EIS of PU-PDA @ CNTs nanocomposite coatings under cycling ageing tests
| |
|
0 cycle |
1 cycle |
2 cycles |
3 cycles |
4 cycles |
5 cycles |
6 cycles |
7 cycles |
| PU-0.5% PDA @ CNTs |
RC (Ω cm2) |
1.02 × 10¹¹ |
1.23 × 10¹⁰ |
2.58 × 10⁹ |
8.21 × 10⁸ |
3.59 × 10⁸ |
2.44 × 10⁷ |
1.08 × 10⁷ |
9.44 × 10⁵ |
| CC (F cm−2) |
2.01 × 10⁻¹⁰ |
4.14 × 10⁻¹⁰ |
5.25 × 10⁻¹⁰ |
9.61 × 10⁻¹⁰ |
3.58 × 10⁻⁹ |
8.19 × 10⁻⁹ |
2.05 × 10⁻⁸ |
6.31 × 10⁻⁸ |
| CC-n |
0.97 |
0.97 |
0.96 |
0.93 |
0.94 |
0.97 |
0.97 |
0.97 |
| Rct (Ω cm2) |
|
|
|
|
1.10 × 10⁸ |
1.73 × 10⁷ |
5.88 × 10⁶ |
7.99 × 10⁵ |
| Cdl (F cm−2) |
|
|
|
|
6.63 × 10⁻⁸ |
9.32 × 10⁻⁸ |
2.31 × 10⁻⁷ |
6.84 × 10⁻⁷ |
| Cdl-n |
|
|
|
|
0.71 |
0.72 |
0.74 |
0.54 |
| PU-1.0% PDA @ CNTs |
RC (Ω cm2) |
2.46 × 10¹¹ |
1.93 × 10¹⁰ |
8.36 × 10⁹ |
2.32 × 10⁹ |
7.58 × 10⁸ |
4.34 × 10⁷ |
7.18 × 10⁶ |
4.41 × 10⁶ |
| CC (F cm−2) |
1.10 × 10⁻¹⁰ |
3.06 × 10⁻¹⁰ |
4.65 × 10⁻¹⁰ |
8.36 × 10⁻¹⁰ |
2.08 × 10⁻⁹ |
4.05 × 10⁻⁹ |
8.11 × 10⁻⁹ |
2.17 × 10⁻⁸ |
| CC-n |
0.96 |
0.91 |
0.97 |
0.92 |
0.94 |
0.95 |
0.96 |
0.95 |
| Rct (Ω cm2) |
|
|
|
6.38 × 10⁸ |
1.40 × 10⁸ |
8.51 × 10⁷ |
1.22 × 10⁷ |
4.56 × 10⁶ |
| Cdl (F cm−2) |
|
|
|
8.47 × 10⁻⁹ |
1.58 × 10⁻⁸ |
2.22 × 10⁻⁸ |
7.18 × 10⁻⁸ |
3.79 × 10⁻⁷ |
| Cdl-n |
|
|
|
0.57 |
0.56 |
0.48 |
0.44 |
0.63 |
| PU-2.0% PDA @ CNTs |
RC (Ω cm2) |
7.73 × 10¹¹ |
6.57 × 10¹⁰ |
3.99 × 10⁹ |
4.43 × 10⁸ |
2.14 × 10⁸ |
4.44 × 10⁷ |
1.71 × 10⁷ |
1.01 × 10⁷ |
| CC (F cm−2) |
1.01 × 10⁻¹⁰ |
1.78 × 10⁻¹⁰ |
3.86 × 10⁻¹⁰ |
5.11 × 10⁻¹⁰ |
1.37 × 10⁻⁹ |
3.61 × 10⁻⁹ |
5.45 × 10⁻⁹ |
8.38 × 10⁻⁹ |
| CC-n |
0.97 |
0.95 |
0.91 |
0.94 |
0.97 |
0.97 |
0.97 |
0.94 |
| W (Ω cm2) |
|
|
|
7.00 × 10⁹ |
1.73 × 10⁸ |
2.64 × 10⁷ |
4.81 × 10⁷ |
|
| W-n |
|
|
|
0.37 |
0.43 |
0.31 |
0.36 |
|
| W–T (Fcm−2) |
|
|
|
177.72 |
65.98 |
47.41 |
30.81 |
|
| Rct (Ω cm2) |
|
|
|
|
|
|
|
2.30 × 10⁷ |
| Cdl (F cm−2) |
|
|
|
|
|
|
|
2.61 × 10⁻⁷ |
| Cdl-n |
|
|
|
|
|
|
|
0.53 |
3.5. Surface characterization
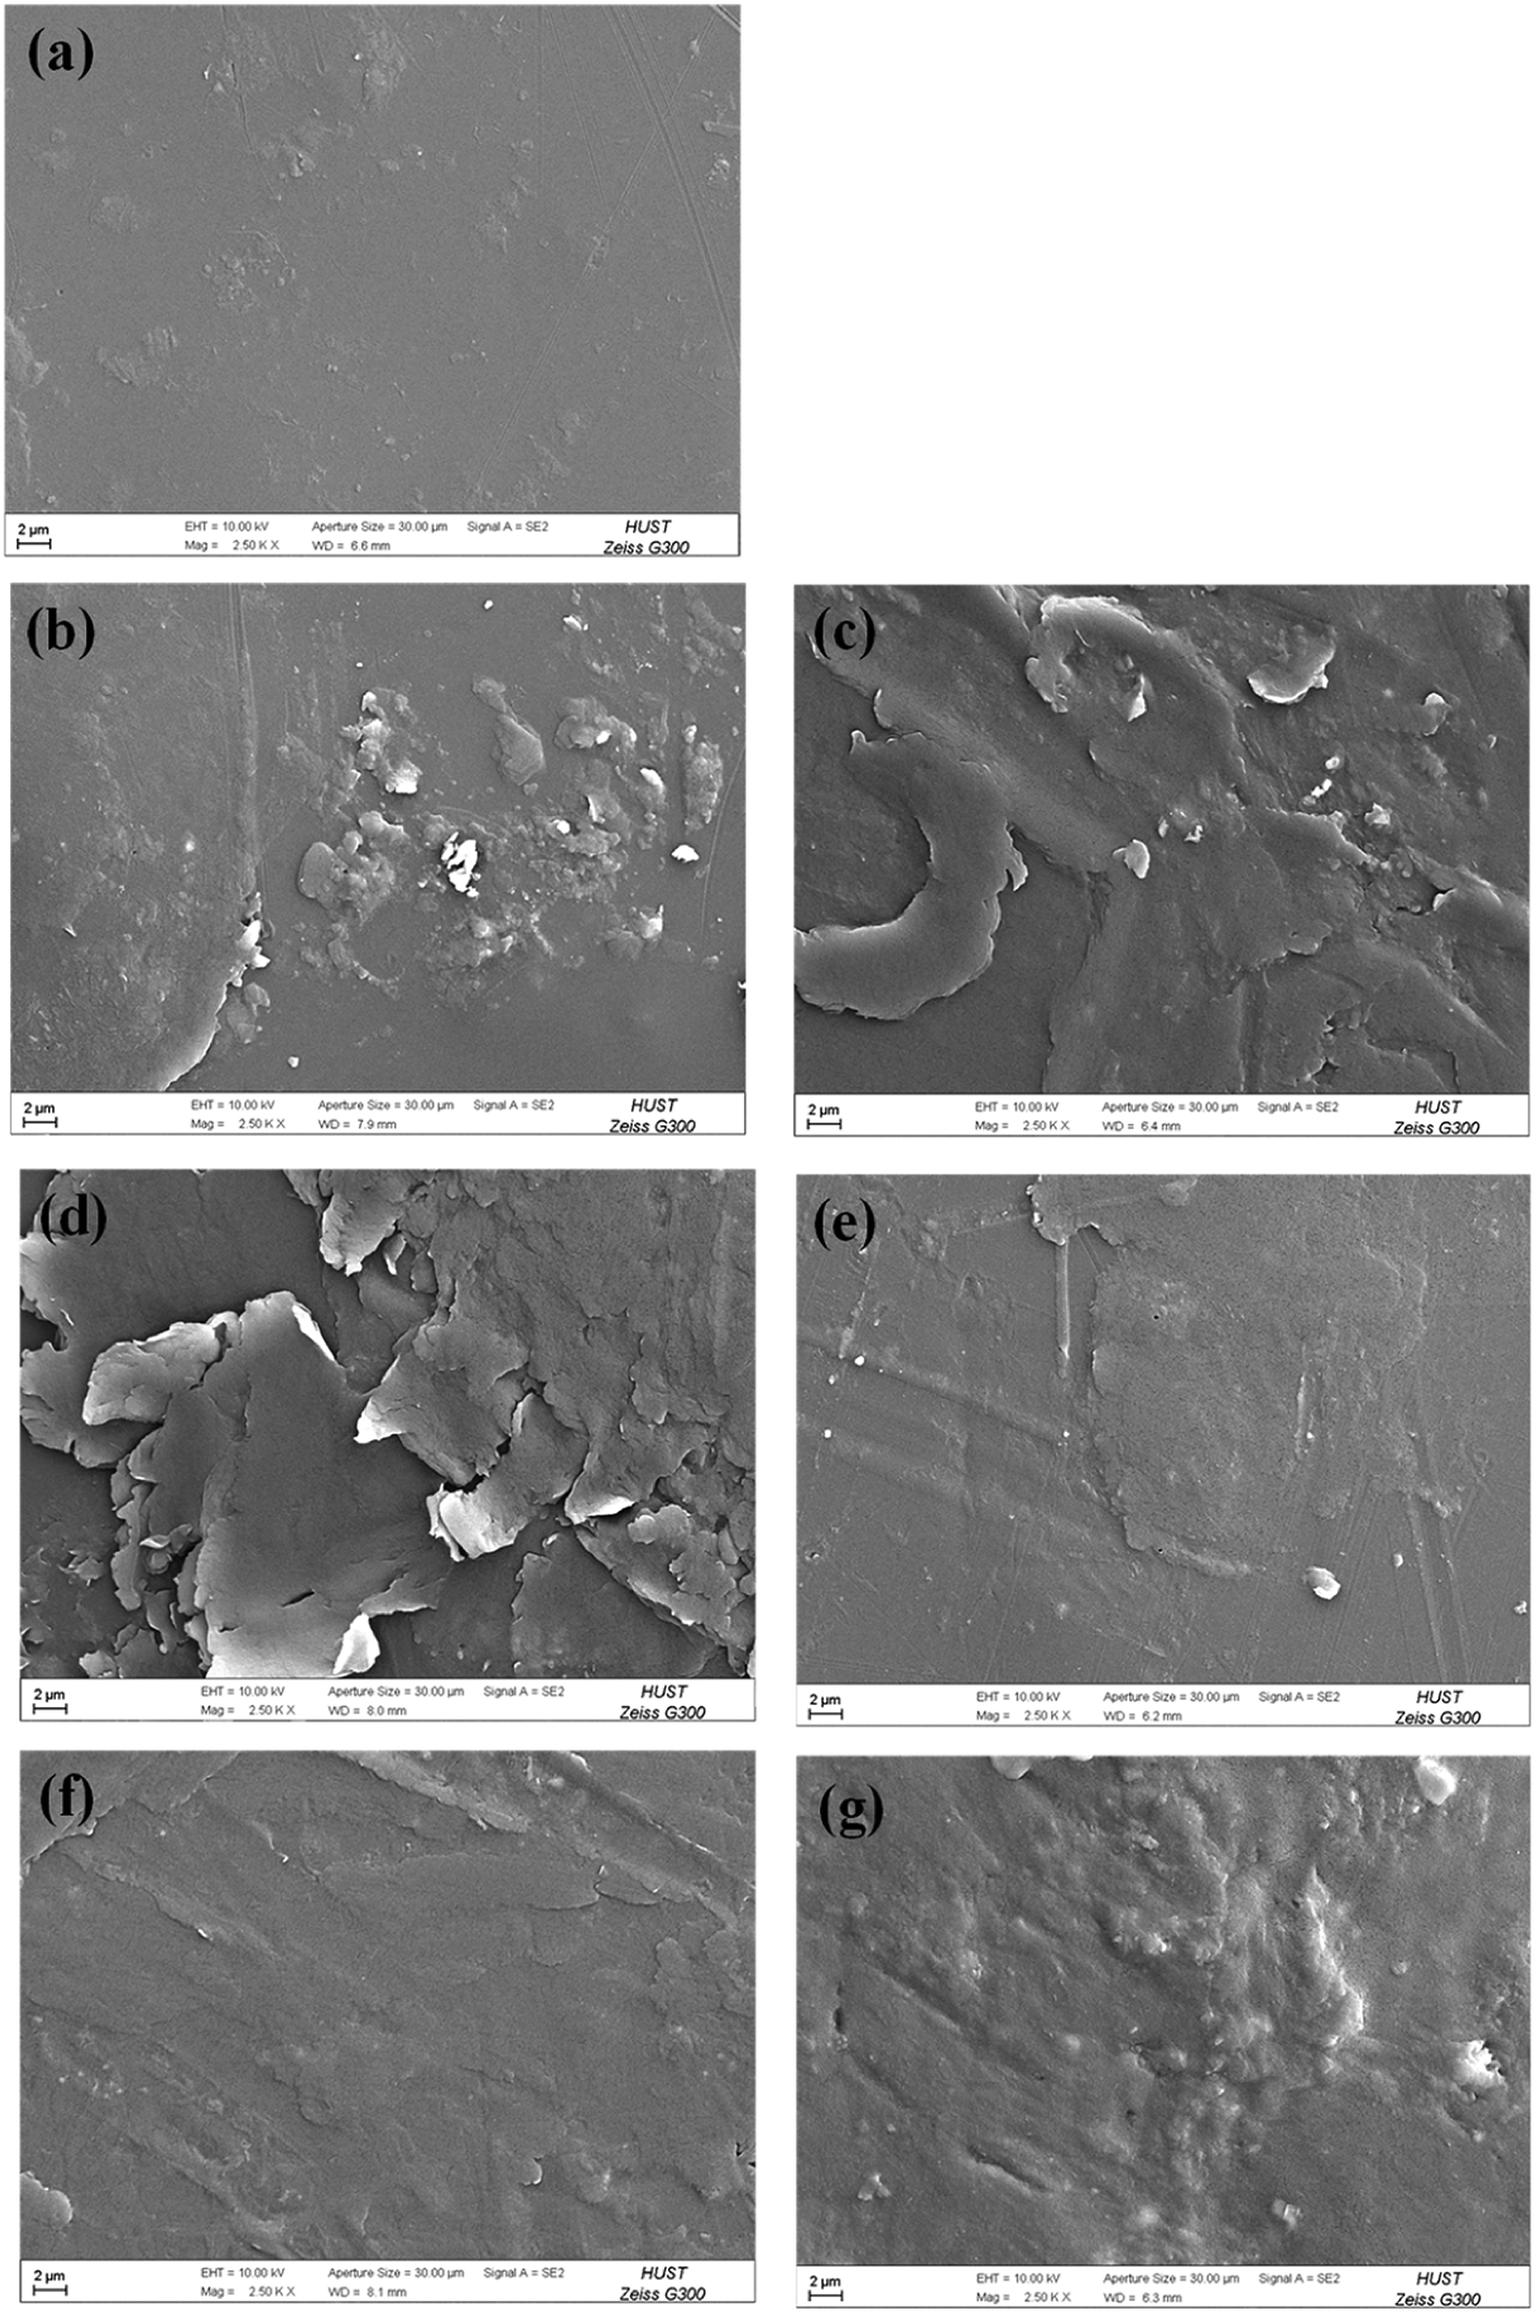
The surface morphologies of the PU coating with different loadings of CNTs and PDA@CNTs were observed by SEM, as shown in Fig. 11. The surface of the pristine PU coating was smooth and uniform with a few small bumps. For the PU-CNTs nanocomposite coatings, bumps and wrinkles became increasingly obvious with the increase of CNTs loading (Fig. 11b–d), indicating that high CNTs loading causes a high level of defects on the coating surface as a result of the poor dispersion and agglomeration of pristine CNTs in the PU matrix. For the PU-PDA@CNTs coatings (Fig. 11e–g), the surface was smoother than the PU coating filled with the unmodified CNTs, which is possibly attributed to the better dispersity of the PDA@CNTs nanofiller compared to the pure CNTs nanofiller at the same loading amount in the bulk PU coating. The results clearly demonstrate that the polydopamine-modified CNTs can improve the dispersion within the PU matrix.
 |
| | Fig. 11 FE-SEM images of (a) PU coating, PU nanocomposite coatings with CNTs loading at (b) 0.5 wt%, (c) 1.0 wt%, (d) 2.0 wt%, and PU nanocomposite coatings with PDA@CNTs loading at (e) 0.5 wt%, (f) 1.0 wt%, (g) 2.0 wt%. | |
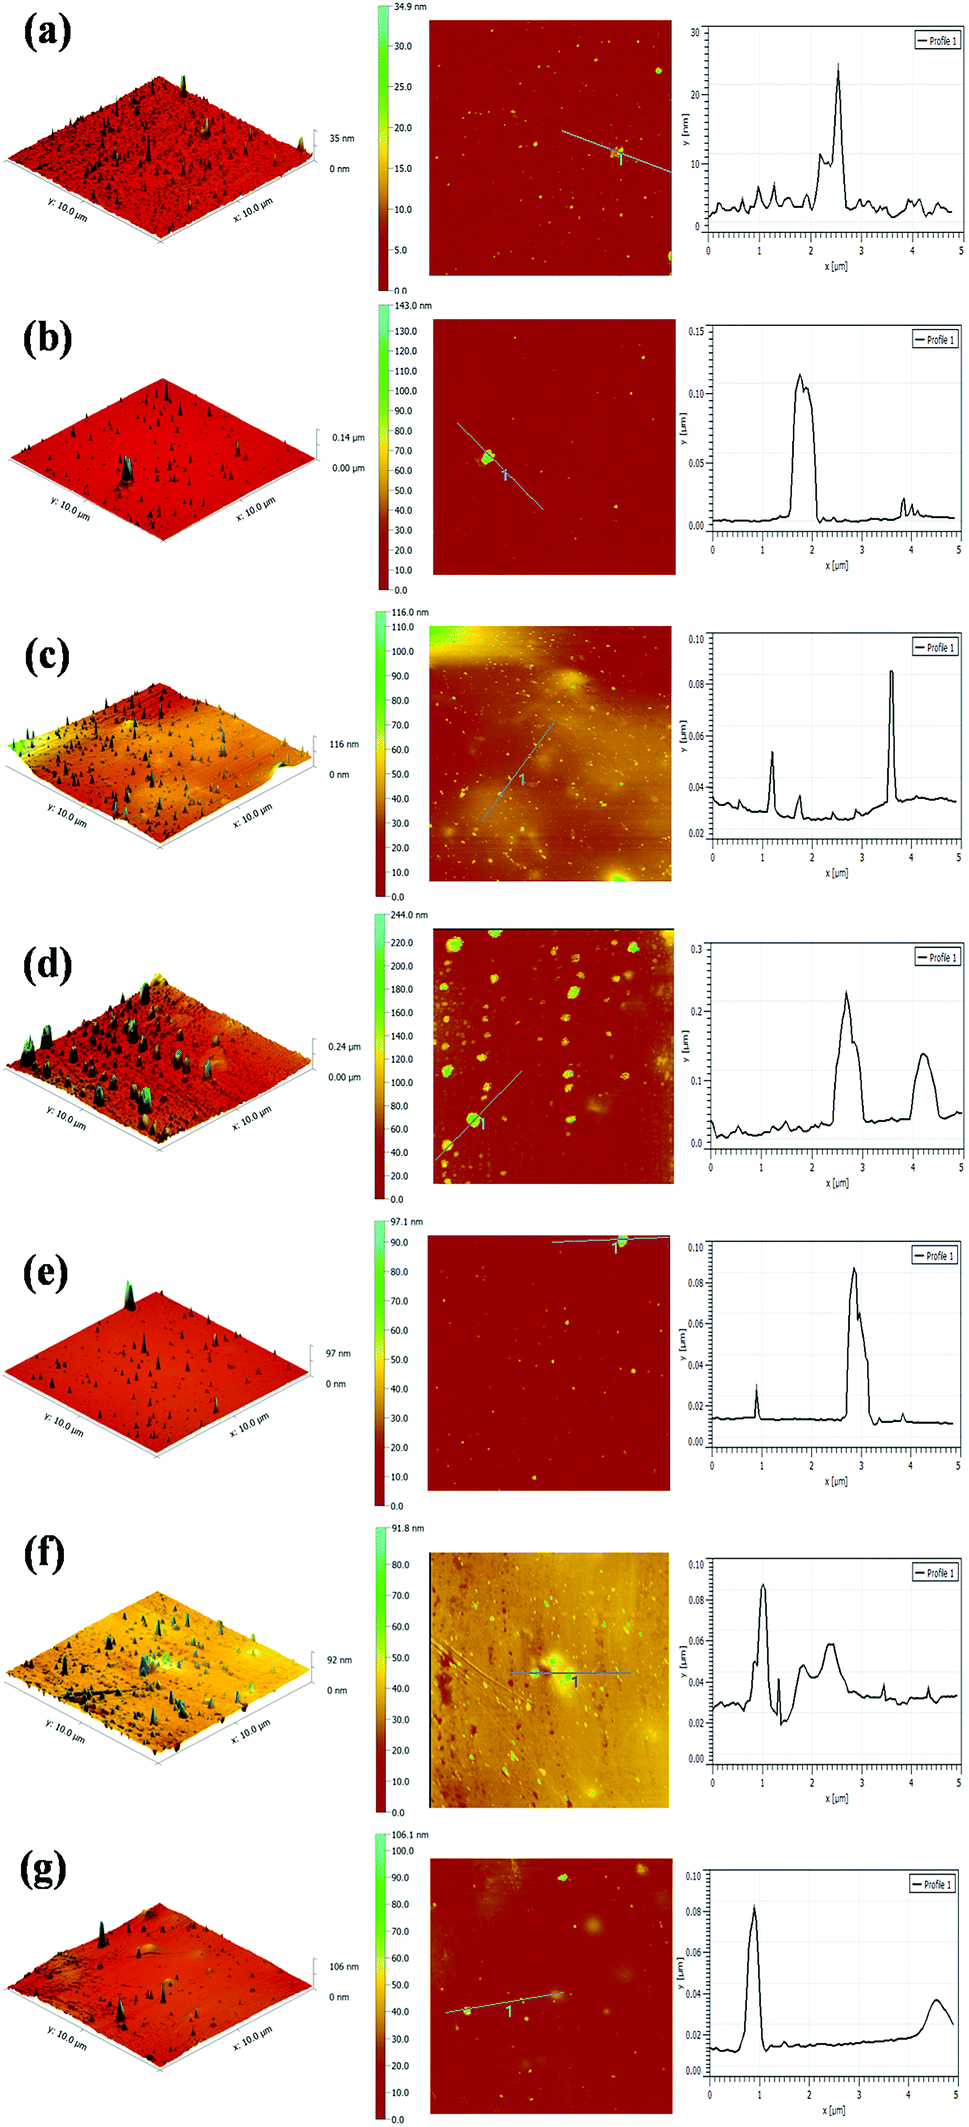
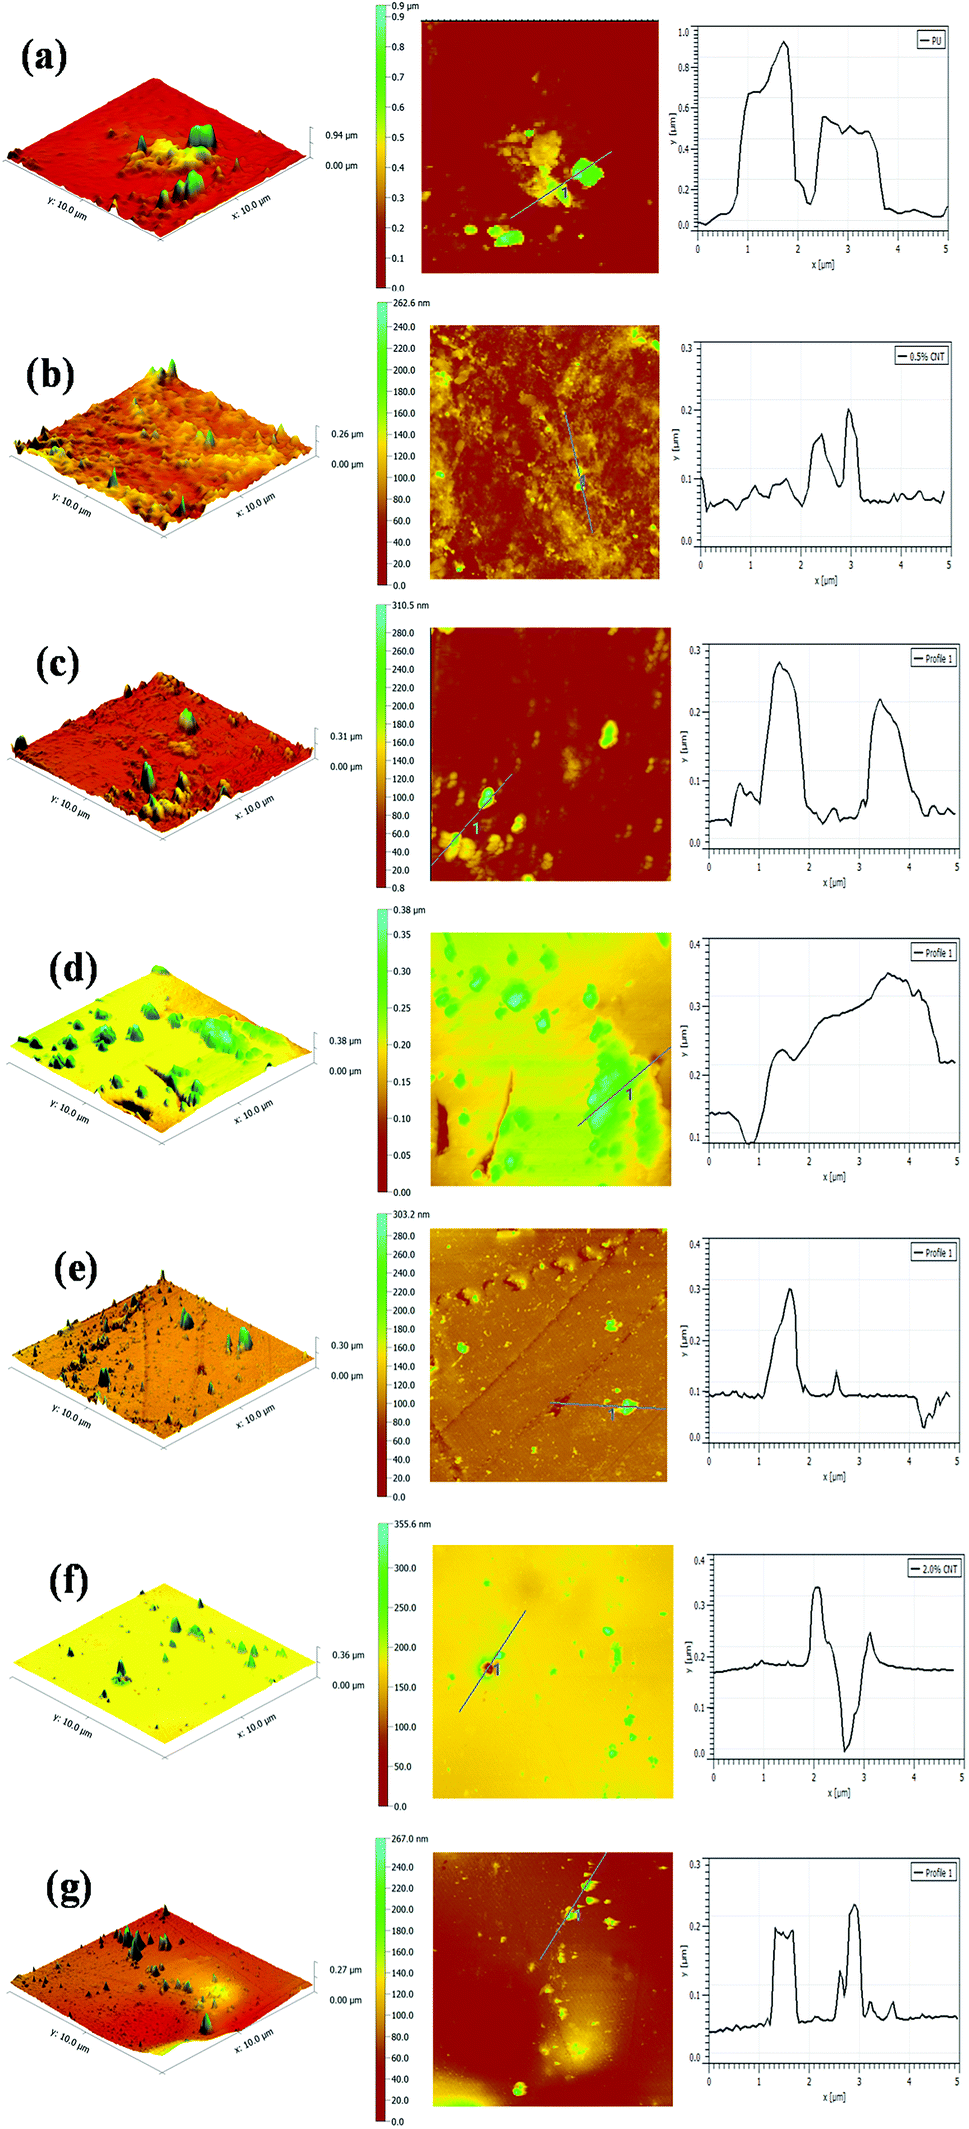
The topographies of the PU coating filled with CNTs or PDA@CNTs were measured by AFM before and after the ageing tests, as shown in Fig. 12 and 13 respectively, and the root mean square (RMS) values of the surface roughness are presented in Table 5 (RMS is the average of five measurements). The surface of the pure PU coating was flat and intact as shown in Fig. 12(a), and the RMS value was as low as 1.07 nm. For the PU-CNTs coatings in Fig. 12b–d, many small flaws and bulges were observed on the coating surface, and the surface asperities increased with the CNTs loading in the PU matrix.13 The results suggest that the pristine CNTs have low compatibility with the PU matrix, which leads to poor dispersion and aggregation of CNTs in the PU coating. Unfortunately, these flaws could provide through channels for the aggressive ions, therefore accelerating the degradation of the PU coating. Contrary to the PU-CNTs coatings, the PU-PDA@CNTs coatings exhibit more homogenous and smoother surface with fewer aggregation (Fig. 12e–g). Hence, the AFM images further demonstrate that the PDA modified CNTs have better dispersion and compatibility in PU matrix due to the fact that the PDA layer could improve the affinity of the hydrophobic CNTs with the isocyanate groups of PU.
 |
| | Fig. 12 3D and 2D AFM micrographs of (a) PU coating, PU nanocomposite coatings with CNTs loading at (b) 0.5 wt%, (c) 1.0 wt%, (d) 2.0 wt% and PU nanocomposite coatings with PDA@CNTs loading at (e) 0.5 wt%, (f) 1.0 wt%, (g) 2.0 wt% without prior ageing test. | |
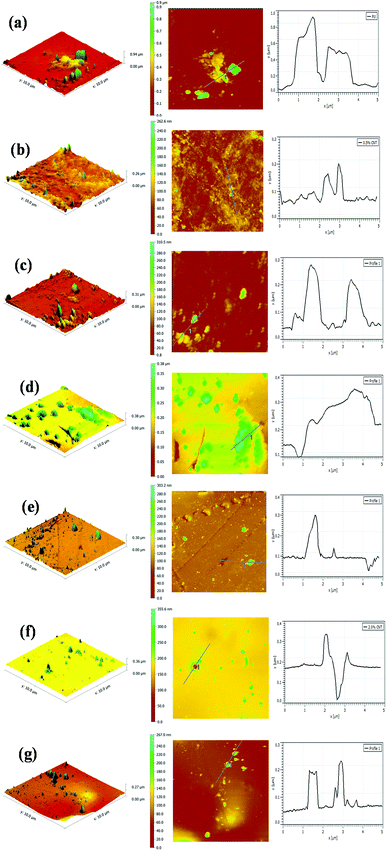 |
| | Fig. 13 3D and 2D AFM micrographs of (a) PU coating, PU nanocomposite coatings with CNTs loading at (b) 0.5 wt%, (c) 1.0 wt%, (d) 2.0 wt% and PU nanocomposite coatings with PDA@CNTs loading at (e) 0.5 wt%, (f) 1.0 wt%, (g) 2.0 wt% after 7 cycles of ageing tests. | |
Table 5 Surface roughness (RMS) of PU nanocomposite coatings with CNTs and PDA@CNTs nanofiller
| Cycles of ageing tests |
RMS (nm) |
| PU |
PU-CNTs |
PU-PDA@CNTs |
| 0.5% |
1.0% |
2.0% |
0.5% |
1.0% |
2.0% |
| 0 cycle |
1.07 |
4.02 |
11.37 |
22.42 |
1.19 |
2.08 |
4.22 |
| 7 cycles |
113.23 |
21.91 |
25.53 |
40.46 |
15.18 |
16.82 |
23.96 |
Fig. 13 shows the AFM images of the PU nanocomposite coating after 7 cycles of ageing tests. A large number of blisters and defects are obviously observed on the surface of the pristine PU coating, and the corresponding RMS also increased to 132.23 nm (Table 5). These severe defects suggest a gradual loss of the corrosion resistance of the pristine PU coating during the cyclic ageing tests (Fig. 13a). For the PU-CNTs nanocomposite coatings, there were also many bumps and defects on the coating surface, especially at 2.0 wt% loading (Fig. 13b–d), and the RMS values were lower than pristine PU coating. The increased defect density at high loading of CNTs illustrates that the aggressive ions more easily penetrate the interface of the coating/metal substrate, causing the corrosion resistance of the PU coating to deteriorate. However, there were fewer defects and smaller bulges on the surface of the PU-PDA@CNTs coatings compared with the PU and PU-CNTs coatings (Fig. 13e–g). The RMS value of the PU-PDA@CNTs coatings is lower than that of PU-CNTs coating at the same loading (Table 5). The lower defect density reflects that the PDA modified CNTs could enhance the barrier of PU coating under accelerated ageing conditions. The above results indicate that the poor dispersity damages the benefits of pristine CNTs on the corrosion barrier of the PU coating. The good compatibility of the PDA@CNTs with the PU matrix increases the compactness of the PU coating and stops the penetration of corrosive species to the interface of the coating/Al-alloy substrate. Therefore, it enhances the durability of the PU-PDA@CNTs coating in harsh environments. Apparently, the morphology of the PU coating is in agreement with its corrosion resistance by EIS analysis before and after the cyclic ageing tests.
3.6. Corrosion barrier mechanism
Although the CNTs nanofiller can improve the corrosion resistance of the PU coating by increasing the adhesive and cohesive strength of the PU matrix, their high hydrophobicity results in poor dispersity in polar solvents, which causes many microscopic flaws on the coating surface with increased pristine CNTs loading. In addition, as high electrical conductive nanomaterials, CNTs may form an electrically conductive network inside the coating. When a thin electrolytic layer forms on the coating, the CNTs exposed to air act as the cathode, and the metal substrate in contact with the CNTs as the anode, which facilitates galvanic corrosion between the CNTs and the metal substrate. In contrast, the PDA modified CNTs efficiently overcome these problems because the PDA layer with a lot of –NH2 and –OH groups could make the PDA@CNTs act as a chain extender and crosslinker to graft to the isocyanate groups in the PU coating and then improve the compatibility between the CNTs and the polymer matrix. Consequently, the crosslinking density and cohesive strength of PU nanocomposite coating are significantly increased by PDA@CNTs. The reinforced structure prevents the development of defects and slows down the penetration of water and aggressive ions into the interface of coating/metal substrate. In addition, PDA, as an electrical insulation layer on CNTs, also prevents the acceleration of the galvanic corrosion of metal substrate. Therefore, the anti-corrosion performance of the PU coating is obviously promoted with the PDA@CNTs loading.
Meanwhile, the CNTs also could enhance the resistance to photodegradation by UV irradiation during the cyclic ageing tests. Fig. 14 shows the ATR-FTIR spectra of PU-CNTs and PU-PDA@CNTs nanocomposite coatings before and after the ageing tests. The C![[double bond, length as m-dash]](https://www.rsc.org/images/entities/char_e001.gif) O stretching vibration in the characteristic spectral band I of the primary amide was at 1685 cm−1 and the amide II of the N–H stretching vibration was at 1521 cm−1. The characteristic bands of the C–N stretching vibration were at 1210 cm−1 and 1163 cm−1, and the C–H symmetric stretching vibration and –CH2 stretching were at 2933 cm−1 and 2862 cm−1, respectively. For the pristine PU coating, the intensity of the functional groups decreased significantly after 7 cycles of ageing tests, especially for the CO at 1685 cm−1 and the C–N at 1210 cm−1 due to the hydrolysis by salt spray and bond rupture by UV irradiation, respectively. The intensity of the bands of the PU-PDA@CNTs nanocomposite coatings remained somewhat stable, demonstrating that the PDA@CNTs nanofiller could dramatically improve the UV resistance of the PU coating. In fact, dopamine, as a free radical scavenger, can provide UV stability to materials containing it36 and therefore, it enhances the UV irradiation and corrosion barrier of the PU-PDA@CNTs nanocomposite coatings under harsh environments.
O stretching vibration in the characteristic spectral band I of the primary amide was at 1685 cm−1 and the amide II of the N–H stretching vibration was at 1521 cm−1. The characteristic bands of the C–N stretching vibration were at 1210 cm−1 and 1163 cm−1, and the C–H symmetric stretching vibration and –CH2 stretching were at 2933 cm−1 and 2862 cm−1, respectively. For the pristine PU coating, the intensity of the functional groups decreased significantly after 7 cycles of ageing tests, especially for the CO at 1685 cm−1 and the C–N at 1210 cm−1 due to the hydrolysis by salt spray and bond rupture by UV irradiation, respectively. The intensity of the bands of the PU-PDA@CNTs nanocomposite coatings remained somewhat stable, demonstrating that the PDA@CNTs nanofiller could dramatically improve the UV resistance of the PU coating. In fact, dopamine, as a free radical scavenger, can provide UV stability to materials containing it36 and therefore, it enhances the UV irradiation and corrosion barrier of the PU-PDA@CNTs nanocomposite coatings under harsh environments.
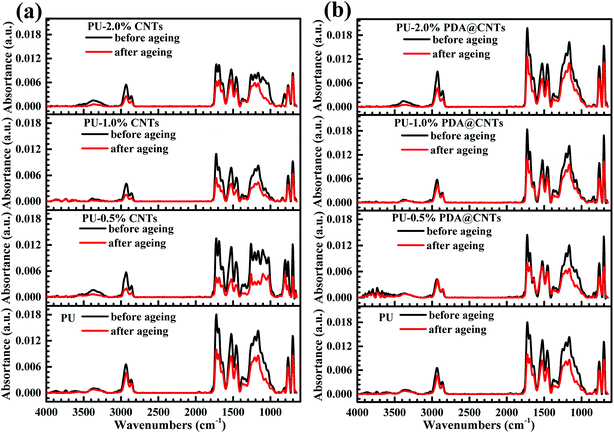 |
| | Fig. 14 ATR-FTIR spectra of (a) PU-CNTs and (b) PU-PDA@CNTs nanocomposite coatings before and after 7 cycles of ageing tests. | |
4. Conclusions
Pristine CNTs are found to increase the adhesion strength and corrosion resistance of PU coating on Al-alloy, but their poor dispersibility and intensive aggregation ability also lead to the rapid loss of anticorrosion performance during cyclic ageing tests. PDA-modified CNTs nanofiller can increase the hydrophilicity of CNTs and thus improves the compatibility between CNTs and PU coating. The surface morphology indicates that the PDA@CNTs nanofiller has good dispersity in PU coating and enhances the structural compactness of coating.
The adhesion strength of PU-PDA@CNTs coatings on Al-alloy markedly increases with PDA@CNTs loading, whether before or after the cyclic ageing tests. EIS demonstrates that PU-PDA@CNTs coating has better corrosion resistance than the pure PU coating and PU-CNTs nanocomposite coatings during the cyclic ageing tests. Moreover, AFM proves that the PU-PDA@CNTs coating has a smoother surface and fewer microdefects than pristine PU and PU-CNTs nanocomposite coatings. The better resistance to UV irradiation degradation was achieved for PU coating with 2.0 wt% PDA@CNTs loading. Therefore, it was confirmed that with the addition of CNTs modified by PDA, the PU-PDA@CNTs coating could exhibit higher resistance to salt spray, UV irradiation and salt solution immersion than pristine CNTs during the long-term accelerated aging test.
Conflicts of interest
There are no conflicts of interest to declare.
Acknowledgements
The authors want to thank the following foundations for the financial supports to this work: the National Natural Science Foundation of China (grant No. 51371087, No. 51771079) and the Innovative Foundation of HUST (grant No. 2017KFYXJJ164).
References
- Y. Zhu, J. Xiong, Y. Tang and Y. Zuo, Prog. Org. Coat., 2010, 69, 7–11 CrossRef.
- J. T. Zhang, J. M. Hu, J. Q. Zhang and C. N. Cao, Prog. Org. Coat., 2004, 49, 293–301 CrossRef.
- C. Zhu, R. Xie, J. Xue and L. Song, Electrochim. Acta, 2011, 56, 5828–5835 CrossRef.
- S. Bhargava, M. Kubota, R. D. Lewis, S. G. Advani, A. K. Prasad and J. M. Deitzel, Prog. Org. Coat., 2015, 79, 75–82 CrossRef.
- Y. Liu, X. Zhou, S. B. Lyon, R. Emad, T. Hashimoto, A. Gholinia, G. E. Thompson, D. Graham, S. R. Gibbon and D. Francis, Prog. Org. Coat., 2017, 102, 29–36 CrossRef.
- L. G. Ecco, M. Fedel, A. Ahniyaz and F. Deflorian, Prog. Org. Coat., 2014, 77, 2031–2038 CrossRef.
- H. R. Asemani, P. Ahmadi, A. A. Sarabi and H. Eivaz Mohammadloo, Prog. Org. Coat., 2016, 94, 18–27 CrossRef.
- T. T. X. Hang, N. T. Dung, T. A. Truc, N. T. Duong, B. Van Truoc, P. G. Vu, T. Hoang, D. T. M. Thanh and M.-G. Olivier, Prog. Org. Coat., 2015, 79, 68–74 CrossRef.
- C. Wang, H. Wang, M. Li, Z. Liu, C. Lv, Y. Zhu and N. Bao, J. Taiwan Inst. Chem. Eng., 2018, 85, 248–256 CrossRef.
- P. Haghdadeh, M. Ghaffari, B. Ramezanzadeh, G. Bahlakeh and M. R. Saeb, J. Taiwan Inst. Chem. Eng., 2018, 86, 199–212 CrossRef.
- Y. C. Chen, A. Y. Lu, P. Lu, X. Yang, C. M. Jiang, M. Mariano, B. Kaehr, O. Lin, A. Taylor, I. D. Sharp, L. J. Li, S. S. Chou and V. Tung, Adv. Mater., 2017, 29, 1703863 CrossRef PubMed.
- Y. Hao, L. A. Sani, T. Ge and Q. Fang, Appl. Surf. Sci., 2017, 419, 826–837 CrossRef.
- N. W. Khun, B. C. R. Troconis and G. S. Frankel, Prog. Org. Coat., 2014, 77, 72–80 CrossRef.
- M. Liu and A. R. Horrocks, Polym. Degrad. Stab., 2002, 75, 485–499 CrossRef.
- J. Li, J. Cui, J. Yang, Y. Li, H. Qiu and J. Yang, Compos. Sci. Technol., 2016, 129, 30–37 CrossRef.
- K.-C. Chang, M.-H. Hsu, H.-I. Lu, M.-C. Lai, P.-J. Liu, C.-H. Hsu, W.-F. Ji, T.-L. Chuang, Y. Wei, J.-M. Yeh and W.-R. Liu, Carbon, 2014, 66, 144–153 CrossRef.
- C. Cui, A. T. O. Lim and J. Huang, Nat. Nanotechnol., 2017, 12, 834–835 CrossRef PubMed.
- C. Mu, L. Zhang, Y. Song, X. Chen, M. Liu, F. Wang and X. Hu, Polymer, 2016, 92, 231–238 CrossRef.
- D. Song, Z. Yin, F. Liu, H. Wan, J. Gao, D. Zhang and X. Li, Prog. Org. Coat., 2017, 110, 182–186 CrossRef.
- R. S. Ruoff and D. C. Lorents, Carbon, 1995, 33, 925–930 CrossRef.
- E. T. Thostenson, Z. Ren and T.-W. Chou, Compos. Sci. Technol., 2001, 61, 1899–1912 CrossRef.
- Y. Zhao, S. Zhao, H. Guo and B. You, Prog. Org. Coat., 2018, 117, 47–55 CrossRef.
- Y. H. Wei, L. X. Zhang and W. Ke, Corros. Sci., 2007, 49, 287–302 CrossRef.
- C. Vosgien Lacombre, D. Trinh, G. Bouvet, X. Feaugas, S. Mallarino and S. Touzain, Electrochim. Acta, 2017, 234, 7–15 CrossRef.
- A. Saadat-Monfared and M. Mohseni, Colloids Surf., A, 2014, 441, 752–757 CrossRef.
- S. Park and M. Shon, J. Ind. Eng. Chem., 2015, 21, 1258–1264 CrossRef.
- H. Jeon, J. Park and M. Shon, J. Ind. Eng. Chem., 2013, 19, 849–853 CrossRef.
- J. M. Wernik and S. A. Meguid, Mater. Des., 2014, 59, 19–32 CrossRef.
- R. Asmatulu, G. A. Mahmud, C. Hille and H. E. Misak, Prog. Org. Coat., 2011, 72, 553–561 CrossRef.
- X. Ling, Y. Wei, L. Zou and S. Xu, Colloids Surf., A, 2014, 443, 19–26 CrossRef.
- J.-M. Thomassin, I. Huynen, R. Jerome and C. Detrembleur, Polymer, 2010, 51, 115–121 CrossRef.
- A. Kumar, P. K. Ghosh, K. L. Yadav and K. Kumar, Composites, Part B, 2017, 113, 291–299 CrossRef.
- S. Pegel, P. Pötschke, G. Petzold, I. Alig, S. M. Dudkin and D. Lellinger, Polymer, 2008, 49, 974–984 CrossRef.
- P.-C. Ma, N. A. Siddiqui, G. Marom and J.-K. Kim, Composites, Part A, 2010, 41, 1345–1367 CrossRef.
- M.-H. Chung, L.-M. Chen, W.-H. Wang, Y. Lai, P.-F. Yang and H.-P. Lin, J. Taiwan Inst. Chem. Eng., 2014, 45, 2813–2819 CrossRef.
- A. S. Subramanian, N. T. Ju, L. Zhang, H. N. Bo, S. Roy, J. Wei and X. M. Hu, Polymer, 2016, 82, 285–294 CrossRef.
- M. Cui, S. Ren, S. Qiu, H. Zhao, L. Wang and Q. Xue, Surf. Coat. Technol., 2018, 340, 74–85 CrossRef.
- P.-C. Ma, S.-Y. Mo, B.-Z. Tang and J.-K. Kim, Carbon, 2010, 48, 1824–1834 CrossRef.
- M. A. Deyab, Prog. Org. Coat., 2015, 85, 146–150 CrossRef.
- Y. C. Jung, H. Muramatsu, K. Fujisawa, J. H. Kim, T. Hayashi, Y. A. Kim, M. Endo, M. Terrones and M. S. Dresselhaus, Small, 2011, 7, 3292–3297 CrossRef PubMed.
- R. A. Zangmeister, T. A. Morris and M. J. Tarlov, Langmuir, 2013, 29, 8619–8628 CrossRef PubMed.
- B. Fei, B. Qian, Z. Yang, R. Wang, W. C. Liu, C. L. Mak and J. H. Xin, Carbon, 2008, 46, 1795–1797 CrossRef.
- Y. Ling, W. Li, B. Wang, W. Gan, C. Zhu, M. A. Brady and C. Wang, RSC Adv., 2016, 6, 31037–31045 RSC.
- H. Hu, B. Yu, Q. Ye, Y. Gu and F. Zhou, Carbon, 2010, 48, 2347–2353 CrossRef.
- J. Y. Kim and Y. J. Park, Sci. Rep., 2017, 7, 8610 CrossRef PubMed.
- Z. Z. Yin, S. W. Cheng, L. B. Xu, H. Y. Liu, K. Huang, L. Li, Y. Y. Zhai, Y. B. Zeng, H. Q. Liu, Y. Shao, Z. L. Zhang and Y. X. Lu, Biosens. Bioelectron., 2018, 100, 565–570 CrossRef PubMed.
- F. Soyekwo, Q. Zhang, L. Zhen, L. Ning, A. Zhu and Q. Liu, Chem. Eng. J., 2018, 337, 110–121 CrossRef.
- F. Bernsmann, V. Ball, F. Addiego, A. Ponche, M. Michel, J. J. Gracio, V. Toniazzo and D. Ruch, Langmuir, 2011, 27, 2819–2825 CrossRef PubMed.
- Y. Li, M. Liu, C. Xiang, Q. Xie and S. Yao, Thin Solid Films, 2006, 497, 270–278 CrossRef.
- D. R. Dreyer, D. J. Miller, B. D. Freeman, D. R. Paul and C. W. Bielawski, Langmuir, 2012, 28, 6428–6435 CrossRef PubMed.
- J. Jiang, L. Zhu, L. Zhu, B. Zhu and Y. Xu, Langmuir, 2011, 27, 14180–14187 CrossRef PubMed.
- J. Mijovic and K.-F. Lin, J. Appl. Polym. Sci., 1986, 32, 3211–3227 CrossRef.
|
| This journal is © The Royal Society of Chemistry 2018 |
Click here to see how this site uses Cookies. View our privacy policy here. 
 Open Access Article
 This Open Access Article is licensed under a Creative Commons Attribution-Non Commercial 3.0 Unported Licence
 *a
*a