 Open Access Article
Modeling of the surface plasmon resonance tunability of silver/gold core–shell nanostructures
Dab Chahinez a,
Thomas Reji
 b and
Ruediger Andreas*ac
aNanophotonics-Nanoelectronics, Institut National de la Recherche Scientifique INRS-EMT, 1650 Boul. Lionel-Boulet, Varennes J3X 1S2, Canada. E-mail: ruediger@emt.inrs.ca
bDivision of Research and Development, Lovely Professional University, G.T. Road, Phagwara, Punjab 144411, India
cDepartment of Electrical Engineering and Information Technology, Université de Sherbrooke, 2500, Boul. Université, Sherbrooke J1K 2R1, Canada
First published on 29th May 2018
Abstract
Tunable plasmonic noble metal nanoparticles are indispensable for chemical sensors and optical near field enhancement applications. Laser wavelengths within the absorption spectrum of the nanoparticle and Localized Surface Plasmon Resonances (LSPR) in the visible and near infrared range are the key points to be met for the successful utilization in the field of aforementioned high sensitivity sensors. This way, Surface Enhanced Raman Spectroscopy (SERS) has been pushed to the sensitivity level of single molecule. The tunability, i.e. the modulation of the surface plasmon resonance wavelength as a function of the ambient refractive index is one of the important criteria to be understood clearly. Among various noble metals, gold and silver nanoparticles have the strongest surface enhancement factors for the Raman signal and their tunability for many practical applications has been experimentally demonstrated. We present a comprehensive numerical investigation by means of a finite element analysis on Ag/Au core–shell nanospheres including agglomerated and non-agglomerated dimers. Tunability as a function of shell thickness, total nanosphere radius and fraction of overlap between the dimer is discussed. Our studies show that tunability is considerably affected by the nanosphere radius rather than the shell thickness. These findings may be helpful in the synthesis of nanoplasmonic structures, especially related to an optimized use of gold as the shell material for the targeted application.
Introduction
The quantitative understanding of the plasmonic nature of metallic nanostructures has led to the design of highly sensitive nano-antennas by the proper selection of materials along with the optimization of size, shape anisotropy and surface chemistry of the structures. However, their performance relies on the excitation of the localized surface plasmon resonance (LSPR) that is able to alter, confine, and reinforce light–matter interaction. Plasmonic nanostructures have met with tremendous successes in nanoelectronic,1 chemistry,2,3 biology,4 catalysis and electro-catalysis5 and in biomedical6 fields. Then, metal–dielectric core–shell structures had been successfully introduced to passivate the surface and to tune the surface plasmon resonance wavelength.7–9 More recently, bimetal core–shell structures have also attracted attention. The appeal of bimetal core–shell structures is mainly due to the evolution of new optical and physical properties including new plasmonic resonances. In particular, these nanoparticles exhibit a remarkable sensitivity of the resonance wavelength as a function of ambient refractive index, a prerequisite for high tunability. This was well reviewed elsewhere for a silver core and a gold shell geometry.10–12 The properties of surface plasmon depends on the overall geometry including the thickness of the shell,7,11 the shape anisotropy7 and the distance of separation between a dimer of core–shell nanospheres.13 The separation also considered for aggregated or overlapping nanospheres, which are nothing but ‘negative separation distance’.Gold and silver remain the strongest contenders for LSPR experiments as they provide a high density of electrons and low losses in the relevant spectral range of interest. In the present work, the electromagnetic enhancement phenomenon is considered. Also, chemical enhancement through charge transfer between the sample and the nanoantenna may account for additional signal amplification. The local electromagnetic field near the surface of a plasmonic nanostructure (nanoantenna) can exceed that of the incoming field by several orders of magnitude. The field enhancement has been proven critical in a wide range of applications like in surface enhanced Raman scattering14 or tip-enhanced Raman spectroscopy.15 The advent of bimetallic nanostructure represents a new class in plasmonics colloids, as reported by C. J. DeSantis,16 both core and shell determine the optical enhancement and plasmonic resonance. At present, the field of plasmonic core–shell nanoparticles progresses theoretically as well as experimentally. On the theoretical side, better understanding and prediction of properties, whereas on the experimental side custom made exact geometry by improving the growth control and size-dispersion of these nanospheres. This manuscript therefore discusses the sensitivity of certain optical parameters, in particular the sensitivity of the plasmon resonance wavelength on the core–shell geometry and ambient refractive index.17–21
We describe LSPR behaviour in the interparticle junction of plasmonic core–shell nanospheres through a finite element simulation. This method not only explained the mixed modes but also provided a quantitative description of the electric field distribution surrounding the Ag cores/Au shells at the nanoscale. Therefore, we suggest a model of separated and overlapping Ag cores/Au shells to investigate the enhancement factor, absorption cross-section, LSPR sensitivity and tunability. We revisit the conclusion in ref. 22 about the impact of the shell thickness on the tunability and subdivide this investigation into a variation of the shell thickness for constant external radius and a constant shell thickness with variable external radius of the nanoparticles.
Methods
We performed a two dimensional simulation based on finite element methods (FEM) with numerically stable edge element discretization and solutions of Maxwell's equation. COMSOL's FEM were used and quantitatively investigated nanoscale electromagnetics as compared to analytical solutions, e.g. multiple expansion.13 We are aware that the electromagnetic approach discards contributions from chemical enhancement in surface enhanced Raman spectroscopy. The dependence of the relative permittivity of gold on the frequency is introduced by the following equation εr(ω) = (n(ω) − ik(ω))2 = ε′(ω) − iε′′(ω) where n and k are real numbers, defines the refractive index and the extinction coefficient, respectively and ω denotes the excitation frequency of the incident light.23,24 ε′ and ε′′are the real and imaginary parts of the relative permittivity, respectively. In the simulation, the two dimensional space is discretized using a non-uniform mesh method with a unit cell size 1 × 1 nm2 within the dimer gap (resolution in this study). Maxwell's equation used in this study is therefore represented as follows:
 | (1) |
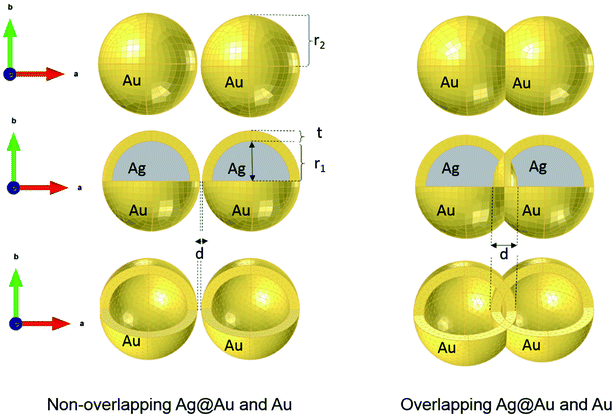
 where c0 is the speed of light in vacuum. The model under consideration consists of two silver cores and gold shells excited with an electromagnetic wave with 632.8 nm wavelength. Those two silver cores, coated with two gold shells are at a distance of separation d (nm) (see Fig. 1). Negative distances express overlapping (fusioned) nanoparticles. The silver cores/gold shells have a total diameter between 50 nm and 80 nm, adequate for nanoplasmonic applications. Ag cores/Au shells present a very stable mechanical structure with high potential in applications.25–27
The plasmonic electromagnetic effect is contributing dominantly to the enhancement of electromagnetic field (e.g. in SERS). The effect of nanoparticle geometry on the plasmonic properties including the resonance wavelength is generally well understood in terms of material, diameter, shape anisotropy, polarization and in particular dimer (core/shell) arrangement.7,10–12 Dimers create nanoscale regions, often referred as ‘hot spots’ with exceptionally high electromagnetic field enhancement and, as we shall see, excellent tunability.
When varying the distance d between the nanoshells (and as a result between the nanocores), plasmon modes exhibit a complex dependence. The electromagnetic effect occurs therefore in two fundamental steps; first, around the plasmonic nanoparticle, the local field is further enhanced and a dipole is induced leading to the enhancement of the Raman scattering from the molecule in the nanogap. This enhancement is described according to the following equation: G1 = [Eloc(ω0)/E0(ω0)]2 where Eloc and E0 are the local electric fields in the presence and absence of nanoparticle, respectively. We set the incident field E0 to unity. Then, in the second step, a mutual excitation from the system of the nanoparticles at a resonant frequency ωr induces an enhanced apparent Raman polarizability according to this equation: G2 = [Eloc(ωr)/E0(ωr)]2. As a result, the enhanced Raman scattered light from the nanoparticles (G enhancement factor) is:28
 | (2) |
Strictly speaking, the approximation only holds true for small Raman shifts for which the enhancement of the excitation wavelength and the signal wavelength can be expected to have the same enhancement factor. This SERS enhancement factor G depends on the gap size between the dimer nanoparticles, it is thus increased as the distance of separation is reduced from 10 nm to 2 nm.29–31 There is a critical gap size, below which the enhancement factor is limited (for a sub-nanometer scale where a quantum effect dominates32–34 and by which energy dissipation by electron tunneling might be encountered). Given that this range of distances only represents a small subset, which would require a quantum mechanical approach, we treated all simulations classically. In this study, we first solve G enhancement factor (the maximum of the electric field) in the gap between the two Au nanoshells for non-overlapping and overlapping Au shells as well as the absorption cross section (αabs) of the complex nanostructure. The equation of absorption is implemented in the model in order to study the dependence of the LSPR modes on the surrounding medium. Secondly, for the tunability investigation, the overlapping Ag cores/Au shells are suspended in media with different refractive indices to determine the dependence of the LSPR on the refractive index. Finally, we determined the key factor in the tunability of these nanostructures in a set of simulations that independently vary the shell thickness, the total nanosphere radius and the overlap of two core–shell nanostructures. Even though we know that hollow gold nanoparticles have excellent tunability, we however opted for core–shell structures in this simulation due to their mechanical stability (e.g. during exposure to shear forces in microfluidic systems). Thus, the core-dimer is essential for practical application in this field as it is easier to synthesize compared to shell without core. In the design of the overlapping nanospheres, the gold shells remain intact i.e. they overlap inside the particle. This has a negligible effect for shell-thicknesses above 5 nm as discussed below.
Results and discussion
We start our numerical simulations with a qualitative description of dipole and multipole modes as previously reported in core–shell plasmonic nanostructures.11 This followed by a quantitative simulation of the experimental findings for the tuning sensitivity as given in ref. 35, which is illustrated in Section 3 in detail. The tuning sensitivity (Δλmax/Δn) is defined as the change of the plasmon resonance peak position (Δλmax), expressed in nm, as a function of refractive index change (Δn), expressed in Refractive Index Unit (RIU). We will then compare the effect of different geometrical core–shell dimer parameters in terms of their influence on the tuning sensitivity. For this purpose, we reproduce the simulations of ref. 22 and 36 in which a constant core diameter and a variable shell thickness were modeled for individual nanoparticle. We emphasize that under these conditions, two geometrical parameters are varied at the same time: the shell thickness and the external nanosphere diameter. In the present case, we will therefore separate the effect of the shell thickness from the effect of the external diameter through dedicated simulations in which only one of these parameters is varied at a time.1. Non-overlapping core/shell nanospheres
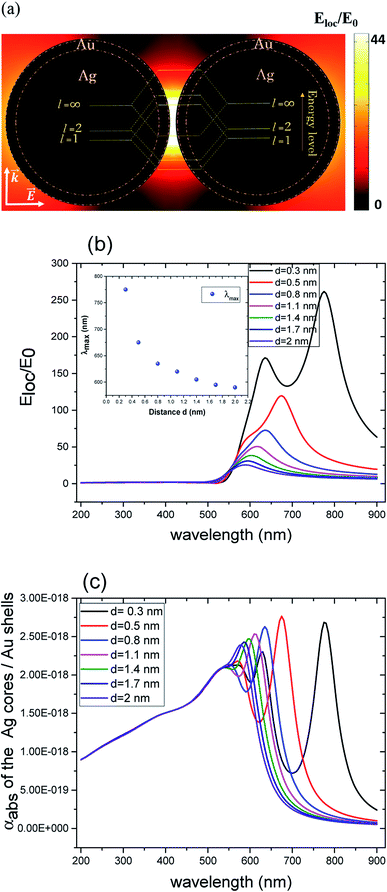
Compared to solid nanoparticle geometry, the core–shell nanoparticles have attracted increasing attention and recently, the scope of the investigation has been extended to the plasmon resonance tunability as well. The plasmon resonance tunability had been experimentally investigated on Ag core, Au shell (Ag@Au) single nanoparticles.35,37 We extend that investigation to the variation of the distance d between the surfaces of nanoshells while keeping the dimensions of cores/shells fixed (22 nm core radius and 3 nm shell thickness) and evaluating the electric field enhancement in the surface of the shells for the wavelength range between 200–900 nm. Fig. 2 a depicts the model that shows the local field distribution (Eloc/E0) on the surface of the two non-overlapping silver core-gold shell nanostructures with 1 nm gap between them them and for 610 nm wavelength. The polarization vector is along the longitudinal axis of the dimer. The core/shell nanostructures were immersed in aqueous solution of refractive index n1 = 1.33. For 1 nm gap, the enhancement factor is in the range of 8. The figure raises the question about the dominant contribution of the plasmon modes of the silver cores and gold shells on the enhancement process that will be explained when varying the distance d. The computed curves of the electric field enhancement on the surface of non-overlapping Au shells are plotted in Fig. 2b as a function of the distance, with the inset displaying the shift of the LSPR. The figure clearly depicts a blue shift of the resonance bands with increasing distance, as well as a decrease of the Eloc/E0 on the surface of the shell; extreme values are observed for the smallest physically meaningful gap of 0.3 nm distance that corresponds approximately to the bond length between two gold atoms Au–Au which is 288.9 pm.38 It should be noted that there is a wide dynamic range in Emax(λ), from 25.5 to a maximum of 270 even for a small range of distance (d = 0.3 to 2 nm). Fig. 2c shows the corresponding absorption cross section of the Ag cores/Au shells for different gaps between the surfaces of the nanoshells. Interestingly, as can be seen in the figure, a second resonance peak of LSPR appears for distances below 1 nm (for 0.3, 0.5 and 0.8 nm). For larger gaps (d ≫ 1 nm), the shift of the plasmon modes in the core/shell dimers follows the interaction energy between two classical dipoles . However, when the nanoshells distance d decreases (0 ≤ d < 1 nm) strong coupling between the interparticle junction, bonding (symmetrically coupled) and antibonding (antisymmetrically coupled) modes becomes dominant.39–42 In this case, the splitting increases and the multipolar order plasmon modes of the nanoshells are mixed with the gold cores modes. The energy level diagram in Fig. 2a explains the contribution of the different cores/shells modes for non-overlapping shells with a small gap of 1 nm, following the identification of the mode energies in ref. 11.
2. Overlapping core/shell nanospheres
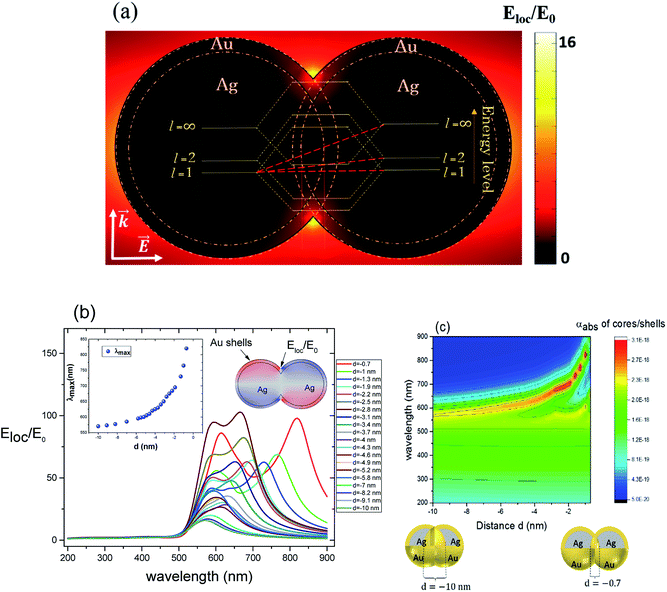
For non-overlapping core/shell nanospheres, in the previous section, and for a very small gap under 1 nm, we find new modes appearing due to the mixing and hybridization of the core and shells mode. In this section, we further decrease the ‘distance’ between the nanosphere surfaces below 0 nm (d < 0 nm) in order to better understand the behavior of the electric field enhancement and the absorption cross section as a function of overlap (cores and eventually shells). We investigate this structure by fixing the silver core radius to 22 nm, the gold shell thickness to 3 nm and solving Eloc/E0 at the surface of the shells as a function of the separation distance d between them. However, in this case the separation distance d will be negative and it is decreased from d = −0.7 nm, deemed as sufficiently far, to d = −10 nm, which might already turn out to be difficult to synthesize in practice,11 but interesting to understand from a modeling perspective. The dimer system is therefore well coupled. The core/shell nanostructures were immersed in aqueous solution of refractive index n1 = 1.33. Fig. 3a depicts the simulated model of the electric field enhancement (Eloc/E0) between two silver core–gold shell nanostructures for a distance d = −10 nm and for 570 nm wavelength. For this given distance the enhancement factor obtained is in the range of 16. The energy level diagram that explains the different mode coupling for overlapping shells is presented as well. The red dashed lines shows the strong interaction of the lower energy level with the highest one between the silver core/gold shell nanospheres. For touching nanoshells, in Fig. 3b and c that presents the electric field enhancement and the absorption cross section for an overlapped Ag core/Au shell nanospheres, respectively, spectra showed LSPR between 550 nm and 850 nm wavelengths. However, LSR showed blue shift as the distance between the nanoshells decreased and is in contrast with non-overlapping nanospheres, where we observed a red shift. This becomes clearer when we consider the extreme cases of infinitely separated nanospheres on one side and perfectly overlapping nanospheres on the other side. Both cases represent the same physical reality of an individual, non-coupled nanosphere. The change of capacitive coupling to conductive coupling between the nanospheres in the interparticle junction is responsible for this behaviour.11 In terms of quantity, we notice that |Emax(λ)| decreases when the cores/shells are more overlapped. The location at which we determined the enhancement factor for overlapping shells is located in direct proximity of the point of strongest concave curvature on the surface as depicted in Fig. 3b. We also point out that a new plasmon mode around 600 nm wavelength appears in the two curves of Fig. 3 b and c. The inset in Fig. 3b shows the LSPR variation as a function of the distance between the shell surfaces. The existence of additional modes and their disappearance for progressive overlap is clearly visible. We tried therefore to look for the critical distance of overlapping shells for which the structure loses this mode. Interestingly, we find that for a distance d between −4 nm and −10 nm the structure again loses this plasmon mode.3. LSPR wavelength tunability
| ε′ = −2n2sol | (3) |
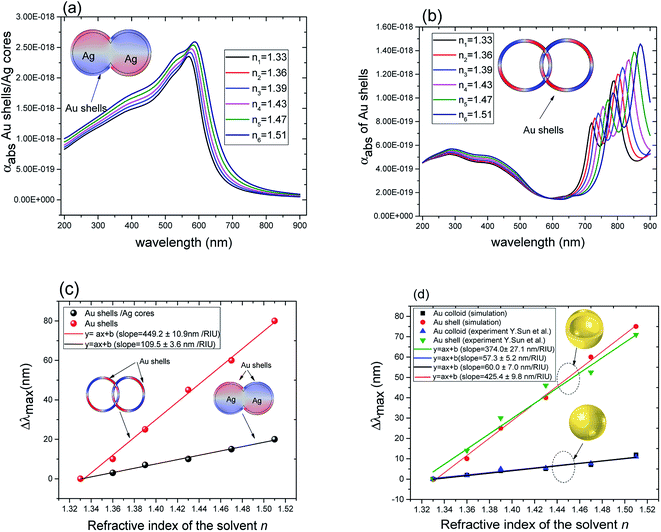 | ||
| Fig. 4 (a) Absorption cross section as a function of wavelength for overlapping Au@Ag nanospheres (r1 = 22 nm, r2 = 25 nm). (b) Absorption cross section as a function of wavelength for overlapping hollow Au shells (same dimensions as in (a)). (c) Comparison of the relative peak position (Δλmax with reference to that of gold shells in water) for Au@Ag nanospheres and hollow Au shells as a function of the refractive index of the solvents. (d) Comparison between experiment35 and simulation of Δλmax for solid Au (50 nm of diameter) and hollow Au shells (50 nm of diameter and 4.5 nm of thickness (t = 4.5 nm)) as a function of the refractive index of the solvents. | ||
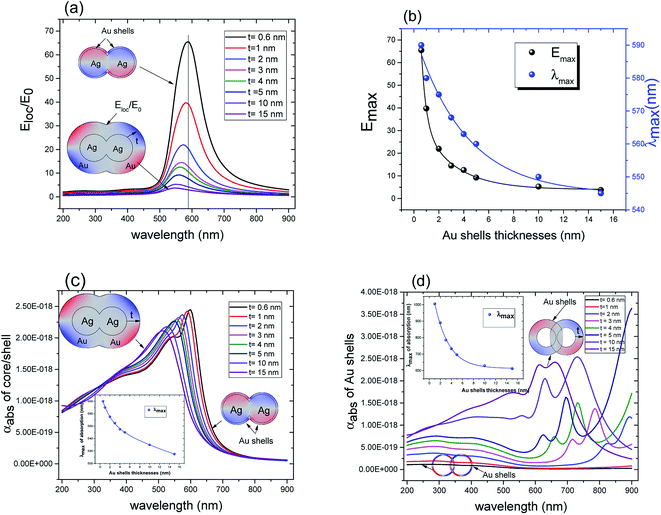
The plasmon resonance tunability was investigated for a fixed silver cores radius r1 = 22 nm, by varying the gold shells thickness t from (0.6 nm to 15 nm) while keeping the inter-particle distance d between the surface of the cores fixed at −5 nm for an overlapping cores/shells configuration. The Eloc/E0 values were then evaluated at the surface of gold shell for the wavelength range between 200 nm and 900 nm. The computed curves of the electric field enhancement as a function of wavelength for different shells thicknesses are plotted in Fig. 5a and the corresponding Emax and λmax in Fig. 5b. Those figures highlight the variation of Emax and λmax resonance bands with increasing gold shells thickness. As the Au shells thickness decreases, the maximum of the electric field enhancement Emax on the surface of the gold shells is increased (3.71 for t = 15 nm to 65.4 for t = 0.6 nm Au shells thicknesses). Similarly, a redshift of λmax was also found (545 nm for t = 15 nm to 590 nm for t = 0.6 nm shells thicknesses).
To describe the possible coupling between different modes we go back to Fig. 3a. Several methods and expressions have verified and demonstrated the sensitivity of the plasmon resonance frequency on the geometry (dimension and shape) of the cores/shells structure, especially, on their dependence on the inner and outer radii of the metallic shell used.35,46,47 One such expression describing the electron gas deformations that can be decomposed as spherical harmonics of order l, in the inner (r1) and outer (r2) surface of the shell is presented in eqn (4). We distinguish two hybridized plasmon modes for l > 0: the first mode ω+ corresponds to the symmetric coupling between surface plasmon on the inner and outer surface of the shell whereas the second mode ω− corresponds to their antisymmetric coupling.42,48
 | (4) |
For a given azimuthal number m, ωs represents the surface plasmon frequency  with n0 is the charge density, e is the electron charge.
Accordingly, Fig. 5c presents the absorption cross section as a function of wavelength for different gold shells thicknesses. As can be seen from the figure, a new mode appears for thicknesses bellow 1 nm in the 550 nm wavelength range and that too exhibited a redshift as the thickness of the gold shells decreased. A similar redshift of the spectral band of LSPR as the thickness of shells decreases is found when using hollow gold shells filled with water as depicted in the calculated absorption spectra in Fig. 5d. Interestingly, the LSPR band position in this case is between 600 nm and 900 nm which reflects a better and high level sensitivity of the plasmon resonance when using hollow gold shells. However, the absorption spectra in this case, exhibits a few LSPR peaks with respect to their solid counterparts that are mainly attributed to the plasmon resonant coupling of dipole, quadrupole and multipole modes, respectively.10,49 Those modes, redshift because of the plasmon hybridization that are excited simultaneously in the inner and outer surface of the gold hollow shells. As a result, two different modes occur between the gold shells and the cavity: a high-energy mode that corresponds to the antisymmetric coupling (antibonding mode) and a low energy mode that corresponds to the symmetric coupling (bonding mode) listed in the eqn (4). In Fig. 5d as the two gold shells thicknesses decreases the interactions between the plasmons is enhanced and produces a larger energy separation between the high energy and the low energy modes. Consequently, the LSPR band position redshifts.
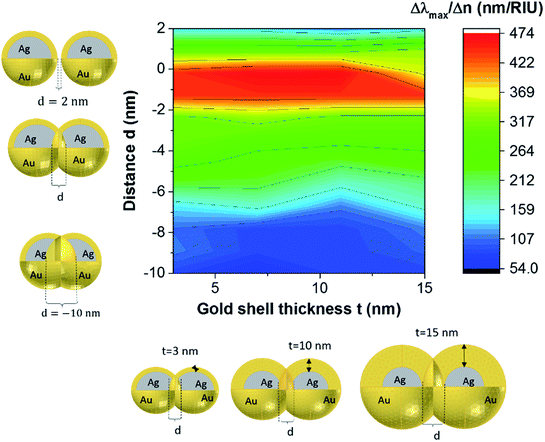
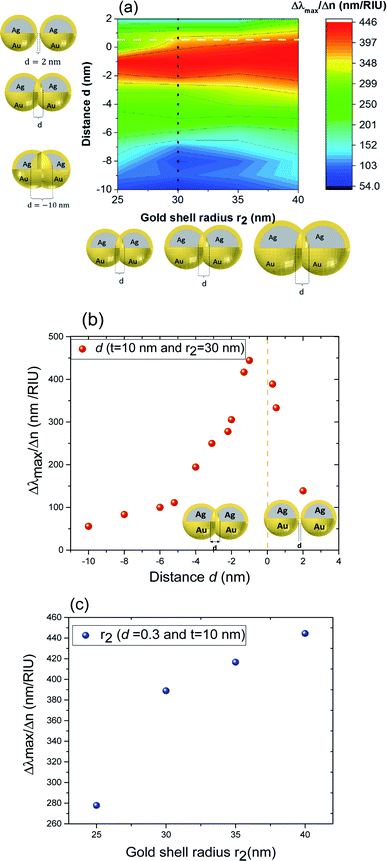
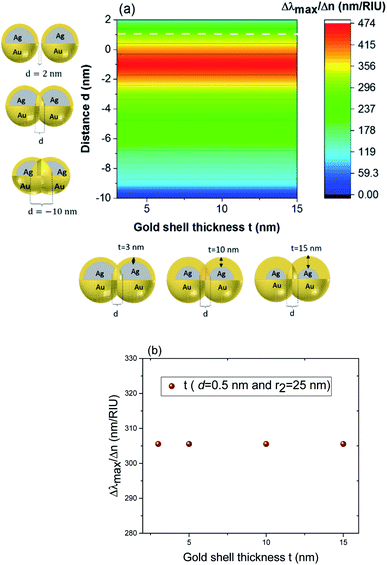
These results underline the principle interest in these dimer core–shell structures. However, it raises questions about the dominating effect responsible for the shift in the LSPR and that will be investigated in detail as follows. For this, we chose only two medium, and refractive indices of these two mediums were 1.33 and 1.51. Fig. 6 present a contour map of the sensitivity factor for two solvents (n1 = 1.33 and n6 = 1.51). The color expresses the sensitivity factor (tunability) with red being high and blue being relatively weak. These values are expressed as a function of two varied parameters. We chose to vary the overlap (d) along the y-axis only. Fig. 6 illustrates the effect of simultaneously increasing gold shell thickness and external diameter, previously reported for individual nanospheres.35 From the figure, for a particular thickness of the gold shell, the sensitivity factor Δλmax/Δn increases as d increases and reaches a maximum (red area), then further enlargement in d results in the reduction of the sensitivity factor. Interestingly, at this range of distance d, sensitivity factor is almost independent of the gold shell thickness. Precisely, for gold shell thickness between 3 and 10 nm, the maximum of the sensitivity factor obtained is Δλmax/Δn = 474 nm per RIU for moderate overlap (d between −2 and 0 nm). For gold shell thickness beyond 10 nm, the same maximum of tunability is obtained for distances between −1 and −2 nm. As mentioned before, it will be inappropriate to assign this behavior to the thickness of gold shell alone, as the size effects of the nanoparticles also a contributing factor. To separate the effect of external nanosphere diameter r2 (from 25 nm to 40 nm) from that of shell thickness t (from 3 nm to 15 nm) the contour map of the sensitivity factor for two solvents (n1 = 1.33 and n6 = 1.51) again simulated for shell thickness (t) and external diameter (r2) as function of distance (d). These results are illustrated in Fig. 7a and 8a, compared and analyzed. As can be seen, such a direct comparison of both contour maps of the sensitivity factor straight away eliminated the influence of shell thickness on the tunability. The maximum of sensitivity is obtained for a moderate overlap between the core/shell (Ag/Au), Δλmax/Δn = 446 nm per RIU for a varied external radius and fixed shell thickness (Fig. 7a). However, for fixed external radius and varied shell thickness, the sensitivity factor is 474 nm per RIU (Fig. 8a).
Three geometry factors of plasmonic nanostructures, distance between the dimer, external radius of the nanosphere and thickness of the gold shell (d, r2 and t) are varied independently and depicted in Fig. 7b, c and 8b, respectively for its sensitivity. In the Fig. 7b (cross section with black dotted line from Fig. 7a), the overlap of the core–shell nanospheres is varied for a constant shell thickness (t = 10 nm) and fixed external diameter (r2 = 30 nm). In this case, the tunability factor increased and attained a maximum value of 450 nm per RIU, as the overlap between the core/shell decreased (increasing distances), and dropped thereafter for further increase in distance. At positive distances (d = 2 nm), the tunability deceases to 120 nm per RIU. In the Fig. 7c (cross section with the white dashed line from Fig. 7a), the external diameter is varied for a constant shell thickness (t = 10 nm) and fixed overlap (d = 0.3 nm). The curve shows an increase of the tunability as the external diameter increases. The tunability factors Δλmax/Δn are 280 and 445 nm per RIU for 25 and 40 nm of gold shell radius, respectively, suggesting strong dependence of tunability on the size of the nanostructures.
In the Fig. 8b (cross section with the white dashed line from Fig. 8a), the gold shell thickness is varied for a constant external diameter (r2 = 25 nm) and fixed overlap (d = 0.5 nm). The curve shows that the tunability remains constant, Δλmax/Δn = 305 nm per RIU when the gold shell thickness increases. It becomes evident that the effect of the shell thickness is negligible on the tunability and it is in fact the total nanosphere diameter that determines the tunability. This has important implications for the synthesis routines. This observation might turn out to be useful for the synthesis of an optimized geometry with as little need for costly noble metals.
The simulations are quantitative and correspond well with experimental values reported in literature35 it should however be stated that our simulation is based on idealized conditions without experimental uncertainties such as fabrication tolerances and surface roughness.
Conclusions
We have presented a modeling framework to predict the sensitivity factor around the plasmonics overlapping core–shell dimer nanostructures (Au nanoshells–Ag cores and hollow Au nanoshells). The geometry under-consideration allowed us to understand (qualitatively and quantitatively) the resonant modes of aforementioned nanostructures. We find that for strong interacting nanoshells, new modes appear in the energy level diagram, where the lowest modes of the shells will interact with higher-level mode of the cores. We simulated the effect of overlapping nanospheres and the “peanut”-shaped nanostructure has showed the strongest tunability for moderate overlap. A dedicated geometrical analysis reveals that the total nanoparticle diameter has a much stronger influence on the tunability of the LSPR than the shell thickness. Thick gold shells being a possible cost and processing concern, we suggest a constant shell thickness in the range of 10 nm. The strongest dependence of the tunability, which now extends over several hundred nanometers from the visible to the NIR range, has been observed for the overlapping nanosphere structures. The overlap does not only affect the tunability but also the maximum enhancement factor, both of which decrease for increasing overlaps beyond certain limit. In this sense, the ideal geometry for high tunability and strong electromagnetic enhancement factors appears to be with very small overlap of barely adhering nanospheres.Conflicts of interest
There are no conflicts to declare.Acknowledgements
C. Dab gratefully acknowledges partial financial support through a Tunisia-INRS scholarship; A. Ruediger acknowledges generous support through CMC microsystems and an NSERC discovery grant.Notes and references
- X. Peng, M. C. Schlamp, A. V. Kadavanich and A. P. Alivisatos, J. Am. Chem. Soc., 1997, 119, 7019–7029 CrossRef.
- J. Li, J. Camardese, R. Shunmugasundaram, S. Glazier, Z. Lu and J. R. Dahn, Chem. Mater., 2015, 27, 3366–3377 CrossRef.
- J. Huang, Y. Hou, C. Liu, L. Jing, T. Ma, X. Sun and M. Gao, Chem. Mater., 2015, 27, 7918–7925 CrossRef.
- L. R. Volpatti, U. Shimanovich, F. S. Ruggeri, S. Bolisetty, T. Müller, T. O. Mason, T. C. T. Michaels, R. Mezzenga, G. Dietler and T. P. J. Knowles, J. Mater. Chem. B, 2016, 4, 7989–7999 RSC.
- M. B. Gawande, A. Goswami, T. Asefa, H. Guo, A. V Biradar, D. Peng, R. Zboril and R. S. Varma, Chem. Soc. Rev., 2015, 44, 7540–7590 RSC.
- J. Z. Zhang, J. Phys. Chem. Lett., 2010, 1, 686–695 CrossRef.
- M. B. Cortie and A. M. McDonagh, Chem. Rev. (Washington, DC, U. S.), 2011, 111, 3713–3735 CrossRef PubMed.
- A. Guerrero-Martínez, J. Pérez-Juste and L. M. Liz-Marzán, Adv. Mater., 2010, 22, 1182–1195 CrossRef PubMed.
- L. R. Hirsch, A. M. Gobin, A. R. Lowery, F. Tam, R. A. Drezek, N. J. Halas and J. L. West, Ann. Biomed. Eng., 2006, 34, 15–22 CrossRef PubMed.
- W. Lai, J. Zhou, Z. Jia, L. Petti and P. Mormile, J. Mater. Chem. C, 2015, 3, 9726–9733 RSC.
- J. B. Lassiter, J. Aizpurua, L. I. Hernandez, D. W. Brandl, I. Romero, S. Lal, J. H. Hafner, P. Nordlander and N. R. Hales, Nano Lett., 2008, 8, 1212–1218 CrossRef PubMed.
- M. Sastry, A. Swami, S. Mandal and P. Selvakannan, J. Mater. Chem., 2005, 15, 3161 RSC.
- C. G. Khoury, S. J. Norton and T. Vodinh, ACS Nano, 2009, 3, 2776–2788 CrossRef PubMed.
- S.-Y. Ding, E.-M. You, Z.-Q. Tian and M. Moskovits, Chem. Soc. Rev., 2017, 46, 4042–4076 RSC.
- J. Plathier, A. Merlen, A. Pignolet and A. Ruediger, J. Raman Spectrosc., 2017, 48, 1863–1870 CrossRef.
- C. J. Desantis, R. G. Weiner, A. Radmilovic, M. M. Bower and S. E. Skrabalak, J. Phys. Chem. Lett., 2013, 4, 3072–3082 CrossRef.
- C. Khoury and T. Vo-Dinh, J. Phys. Chem. C, 2008, 112, 18849–18859 Search PubMed.
- X. L. Tang, P. Jiang, G. L. Ge, M. Tsuji, S. S. Xie and Y. J. Guo, Langmuir, 2008, 24, 1763–1768 CrossRef PubMed.
- C. J. Orendorff, L. Gearheart, N. R. Jana and C. J. Murphy, Phys. Chem. Chem. Phys., 2006, 8, 165–170 RSC.
- Q. Min, M. J. L. Santos, E. M. Girotto, A. G. Brolo and R. Gordon, J. Phys. Chem. C, 2008, 112, 15098–15101 Search PubMed.
- J. Grand, S. Kostcheev, J. L. Bijeon, M. L. De la Chapelle, P. M. Adam, A. Rumyantseva, G. Lérondel and P. Royer, Synth. Met., 2003, 139, 621–624 CrossRef.
- Y. Wang and S. Schlücker, Analyst, 2013, 138, 2224 RSC.
- A. D. Rakic, A. B. Djurisic, J. M. Elazar and M. L. Majewski, Appl. Opt., 1998, 37, 5271–5283 CrossRef PubMed.
- L. Gao, F. Lemarchand and M. Lequime, Thin Solid Films, 2011, 520, 501–509 CrossRef.
- A. X. Wang and X. Kong, Materials, 2015, 8, 3024–3052 CrossRef PubMed.
- B. Goris, G. Guzzinati, C. Fernández-López, J. Pérez-Juste, L. M. Liz-Marzán, A. Trügler, U. Hohenester, J. Verbeeck, S. Bals and G. Van Tendeloo, J. Phys. Chem. C, 2014, 118, 15356–15362 Search PubMed.
- F. Lu, Y. Tian, M. Liu, D. Su, H. Zhang, A. O. Govorov and O. Gang, Nano Lett., 2013, 13, 3145–3151 CrossRef PubMed.
- C. Dab, C. Awada, A. Merlen and A. Ruediger, Phys. Chem. Chem. Phys., 2017, 19, 31063–31071 RSC.
- Y. Tanaka, A. Sanada and K. Sasaki, Sci. Rep., 2012, 2, 1–5 Search PubMed.
- J. M. McMahon, S. K. Gray and G. C. Schatz, Phys. Rev. B: Condens. Matter Mater. Phys., 2011, 83, 1–5 CrossRef.
- C. Dab, G. Kolhatkar, J. Plathier, R. Thomas and A. Ruediger, Plasmonics, 2016, 12, 1–8 Search PubMed.
- W. Zhu and K. B. Crozier, Nat. Commun., 2014, 5, 5228 CrossRef PubMed.
- J. Zuloaga, E. Prodan and P. Nordlander, Nano Lett., 2009, 9, 887–891 CrossRef PubMed.
- K. J. Savage, M. M. Hawkeye, R. Esteban, A. G. Borisov, J. Aizpurua and J. J. Baumberg, Nature, 2012, 491, 574–577 CrossRef PubMed.
- Y. Sun and Y. Xia, Anal. Chem., 2002, 74, 5297–5305 CrossRef PubMed.
- M. Hu, J. Chen, Z.-Y. Li, L. Au, G. V. Hartland, X. Li, M. Marquez and Y. Xia, Chem. Soc. Rev., 2006, 35, 1084 RSC.
- K. S. Lee and M. A. El-Sayed, J. Phys. Chem. B, 2006, 110, 19220–19225 CrossRef PubMed.
- N. W. Egon Wiberg, Inorganic Chemistry, Academic Press, 2001 Search PubMed.
- Q. Li and Z. Zhang, Sci. Rep., 2016, 6, 19433 CrossRef PubMed.
- M. Jahn, S. Patze, I. J. Hidi, R. Knipper, A. I. Radu, A. Mühlig, S. Yüksel, V. Peksa, K. Weber, T. Mayerhöfer, D. Cialla-May and J. Popp, Analyst, 2016, 141, 756–793 RSC.
- P. Nordlander, C. Oubre, E. Prodan, K. Li and M. I. Stockman, Nano Lett., 2004, 4, 899–903 CrossRef.
- E. Prodan, C. Radloff, N. J. Halas and P. Nordlander, Science, 2003, 302, 419–422 CrossRef PubMed.
- J. A. Faucheaux, A. L. D. Stanton and P. K. Jain, J. Phys. Chem. Lett., 2014, 5, 976–985 CrossRef PubMed.
- G. Kolhatkar, J. Plathier and A. Ruediger, J. Mater. Chem. C, 2018, 6, 1307–1319 RSC.
- Y. Wang, H. Chen, S. Dong and E. Wang, J. Chem. Phys., 2006, 125 Search PubMed.
- S. J. Oldenburg, R. D. Averitt, S. L. Westcott and N. J. Halas, Chem. Phys., 1998, 288, 243–247 Search PubMed.
- S. L. Westcott, R. D. Averitt, J. a. Wolfgang, P. Nordlander and N. J. Halas, J. Phys. Chem. B, 2001, 105, 9913–9917 CrossRef.
- E. Prodan and P. Nordlander, Nano Lett., 2003, 3, 543–547 CrossRef.
- P. Mulvaney, Langmuir, 1996, 12, 788–800 CrossRef.
| This journal is © The Royal Society of Chemistry 2018 |

