
 Open Access Article
 This Open Access Article is licensed under a Creative Commons Attribution-Non Commercial 3.0 Unported Licence
Characteristics of negative DC discharge in a wire–cylinder configuration under coal pyrolysis gas components at high temperatures
Quanlin Chen ,
Mengxiang Fang,
Jianmeng Cen* and
Jiajia Liu
,
Mengxiang Fang,
Jianmeng Cen* and
Jiajia Liu
State Key Laboratory of Clean Energy Utilization, Zhejiang University, Hangzhou 310027, P. R. China. E-mail: jmcen@zju.edu.cn
First published on 20th June 2018
Abstract
This work aims to provide a comprehensive understanding of negative DC discharge under coal pyrolysis gas components (CO2, H2, N2, CH4, CO) and air. The characteristics of negative DC discharge were studied in a wire–cylinder configuration at an ambient temperature range of 20–600 °C by analyzing V–I characteristics, discharge photographs, and gas composition. With increasing temperature, corona onset voltage, spark breakdown voltage and operational voltage range for corona discharge decrease, but discharge current and electron current ratio increase. Discharge current of CO2 is higher than that of air due to the difference of electronegativity. During CO2 discharge, with the increase of output voltage, three types of discharge are successively observed, namely corona, glow and arc. However, during H2 discharge, only glow discharge is observed. Temperatures significantly affect the capability of CO to attach electrons. The discharge characteristic of CO is similar to the electronegative gas media at 20 °C and the non-electronegative gas media when the temperature exceeds 350 °C. Chemical reactions and carbon generation are observed during the CH4 and CO discharge process. The product of carbon filaments under the CH4 gas medium leads to discharge current volatility and short circuit. These results assist in understanding the property of ESP at high temperatures.
1. Introduction
High-temperature gas cleaning is a key challenge for advanced power generation technologies, such as pressurized fluidized bed combustion and integrated gasification combined cycle.1,2 High-temperature particle removal technologies include high-temperature cyclone separators, ceramic filters, granular filters, and high-temperature electrostatic precipitators (ESP). The advantages of a cyclone separator include having a simple structure and stable operation, but the fine particle collection efficiency is low and can only be used as a pretreatment.3 Ceramic filter exhibits high particle removal efficiency but can be broken at high temperature because of thermal shock explosion.4 The pressure drop and energy consumption for the granular filter are relatively high, besides, granular materials are difficult to regenerate at high temperature.5 The ESP has the advantages of high particle removal efficiency, low pressure decrease, and wide adaptability; it is widely used in coal-fired power plants at temperatures less than 150 °C.6 However, research on the property of ESP at temperatures above 350 °C is limited.Corona discharge is a fundamental process for ESP, because the ions produced in this process play an important role in particle charging, thereby affecting particle collection efficiency.7–14 Xiao15 studied the characteristics of DC negative corona discharge in a wire–cylinder configuration at an ambient temperature range of 350–850 °C and concluded that the ratio of the electron current to the total discharging current increases with increasing temperature. Because of the electron current, the maximum collection efficiency decreases and energy consumption increases as temperature increases.16 Xu3 studied the relationship of applied voltage and collection efficiency, and concluded that both onset and spark voltages decreased with an increase in temperature and resulted in a decrease in particle collection efficiency. To solve this problem, Yan6,10 studied the effect of discharge device structure on operation voltage range and concluded that the operating voltage range increases with increasing discharge gap, and the ribbon electrodes produce sparks more easily compared with the wire and spiral electrodes. In addition to temperature and discharge device structure, gas media are also an important factor affecting the discharge characteristics. Wang15,17 studied the discharge characteristics at high temperatures in the atmosphere of O2, CO2, and N2 and concluded that the discharge current in the mixture of CO2 and N2 gas media increases when the content of CO2 increases.
The main components of coal pyrolysis gas are CO2, H2, N2, CH4, and CO.1 Gas media are an important factor that influences discharge characteristics. However, there is almost no research on discharge characteristics under coal pyrolysis gas media. Thus, this work investigates characteristics of negative DC discharge in a wire–cylinder configuration under coal pyrolysis gas media at high temperatures, thereby assisting in the understanding of the property of ESP at high temperatures.
2. Experimental setup
The schematic of the experimental system is shown in Fig. 1. The system consists of five parts, namely, gas cylinders, a high voltage power supply, a wire–cylinder negative DC discharge configuration, a temperature-controlled furnace, and a measurement system.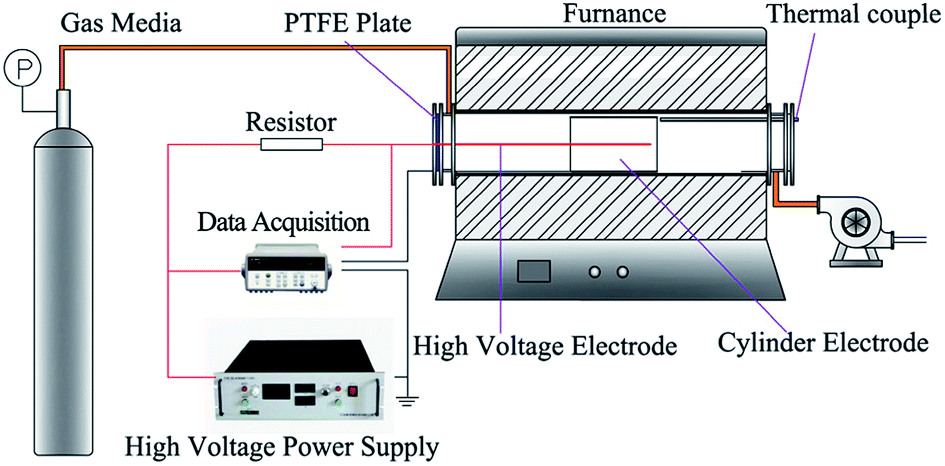 | ||
| Fig. 1 Schematic of the experimental setup. | ||
2.1 Discharge device
The wire–cylinder discharging device is placed on the middle of the corundum tube, which is heated by the furnace. The length of the corundum tube is 1.2 m and its inner diameter is 74 mm. The stainless sleeve tube is connected with the corundum tube using flanges. The outer diameter of the stainless sleeve tube is identical to the inner diameter of the corundum tube.The wire–cylinder discharge configuration consists of a discharge electrode and a cylinder electrode, which was made of stainless steel 310s. The effective length of the discharge electrode is 180 mm, and the diameter is 2 mm. The anode is a stainless tube with a length of 180 mm and an inner diameter of 60 mm. Thus, the inter-electrode gap of this discharging device is 29 mm. The effective discharge electrode is the part of the cathode wire within the cylinder.
At high temperature, the insulation performance of insulating materials decreases. Therefore, in this work, a polytetrafluoroethylene plate is placed on the sleeve tube flanges, through which two holes are cut to allow the anode and cathode conducting wires to traverse without connecting.
2.2 Electric circuit
The high voltage power supply provides an adjustable DC negative voltage of 0–60 kV and a maximum output current of 20 mA. In this work, the voltage supplied by a high voltage power supply is called output voltage, and the voltage between the anode and the cathode is called the port voltage, which is measured by a high voltage probe and Agilent 34970A data acquisition. Port voltages are the real voltages between the anode and cathode, thus they are widely used to present the results of discharge characteristics. An 800 kΩ resistor is used to protect the power supply when spark breakdown occurs. Electric current is measured through the Agilent 34970A data acquisition with the minimum accuracy of 1 nA.2.3 Temperature measure and control
The silicon molybdenum electric heating elements, which are connected to the programmable temperature controller, heat the corundum tube. An S-type thermocouple is used to measure the temperature of the furnace, which is then fed back to the programmable temperature controller to adjust the heating power of the electric heating elements.There is a large temperature difference inside and outside the corundum tube, and the temperature has great influence on the discharge characteristics. Thus, in this work, a K-type thermocouple is stuck into the corundum tube through the stainless steel sleeve to measure the temperature of the discharging device and gas media. The K-type thermocouple does not contact with the corundum tube, so the temperature measured by the thermocouple mainly comes from the convective heat transfer of the gas and the radiative heat transfer of the corundum tube. The gas flow rate is 100 L h−1 and the diameter of corundum tube is 74 mm, thus the airflow velocity is about 0.006 m s−1 at room temperature. The length of the corundum tube is 1.2 m and the discharge device is placed on the middle of corundum tube. Therefore, the heating time is about 30–100 s, enough to heat the gas to the set temperature.
2.4 Experimental procedure
The gas flow rate is adjusted to 100 L h−1 by using a flow meter, and the pressure in the furnace is maintained at 1 atm. The gas media used in the experiments are the main components of coal pyrolysis gas, namely, CO2, H2, N2, CH4, and CO. Air is also investigated in this work for comparison with other gas media. The testing temperatures on each gas media are set at room temperature (20 °C) and high temperatures set from 350 °C to 600 °C at 50 °C interval. The furnace temperature is increased at a rate of 3–5 °C per minute after setting a program and pressing the start key. Simultaneously, the gas tank valve is opened, and the gas flow is allowed into the furnace. Then, the negative high voltage power supply is started, and the output voltage is adjusted when the temperature has reached the setting value. The corona onset voltage is determined when the first corona occurred. The corona current is detected and recorded once the corona is set, and the output voltage is increased by intervals of 1 or 0.5 kV. The spark voltage is determined when the discharge current increased sharply. Glow discharges, instead of corona discharges, are occurred under non-electronegative gas media. The threshold voltage is determined when the first glow occurred. Each test condition is maintained for 5 min to record the results. Certain tests are repeated to check the repeatability of the experimental data. The results highlight the good performance of the experimental system.3. Result and discussion
3.1 Effect of temperature
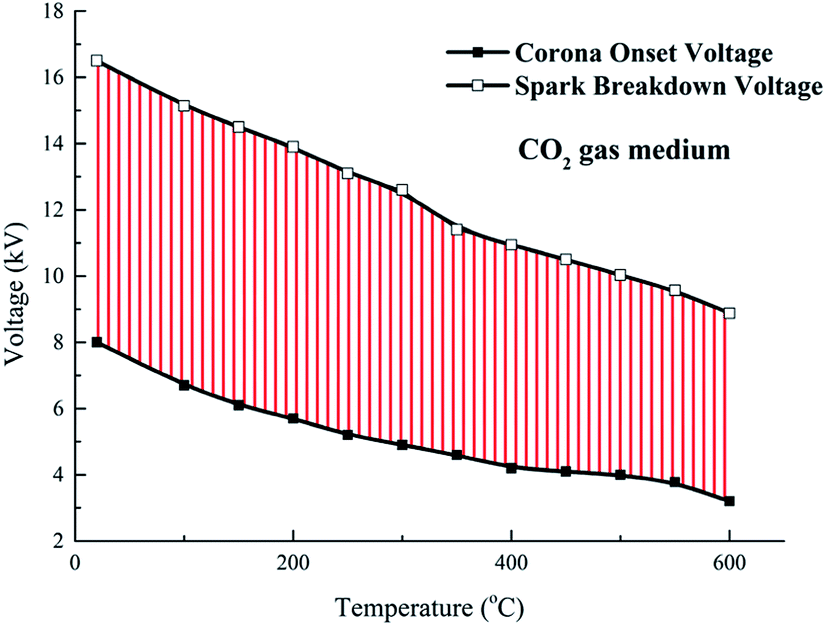 | ||
| Fig. 2 Effect of temperature on corona onset and spark voltages. | ||
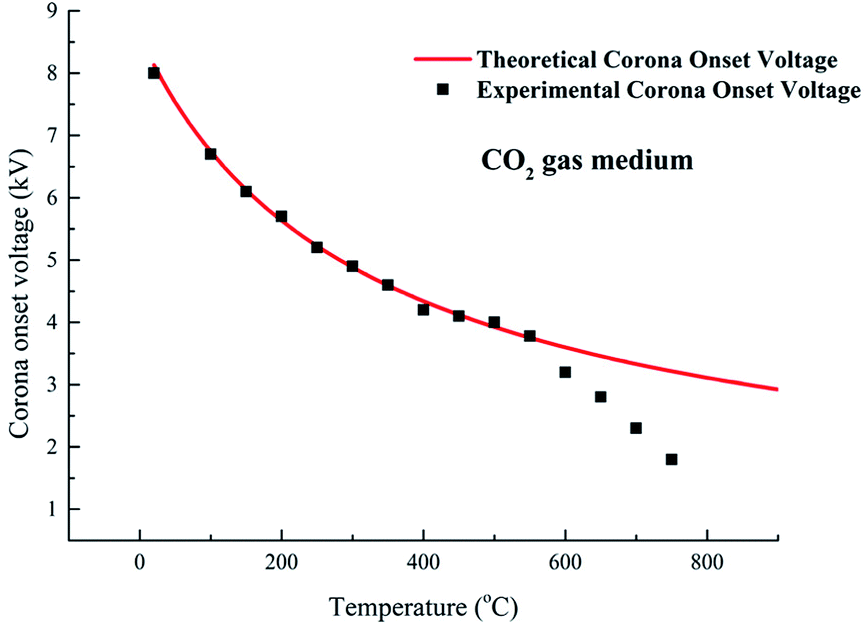
Fig. 3 compares the theoretical corona onset voltages with the experimental data at different temperatures. The theoretical corona onset voltage is calculated through Peek's formula as expressed in eqn (1).
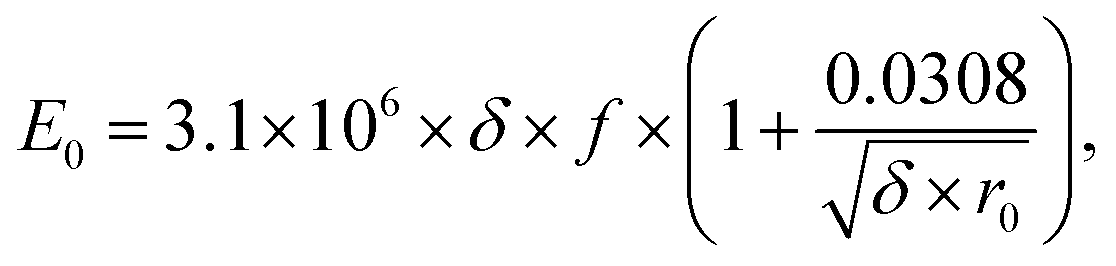 | (1) |
 | (2) |
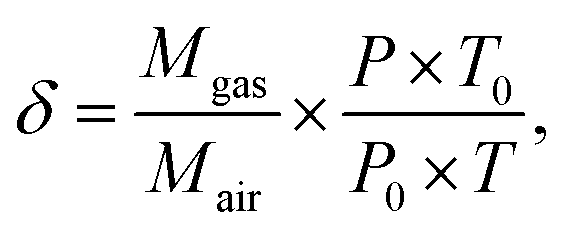
![[thin space (1/6-em)]](https://www.rsc.org/images/entities/char_2009.gif) 325 Pa, T0 = 298 K.
325 Pa, T0 = 298 K.
 | ||
| Fig. 3 Experimental corona onset voltages and Peek's formula at different temperatures. | ||
The experimental onset voltages match well with the theoretical onset voltage at relatively low temperature (equal or below 550 °C). However, the experimental onset voltage is apparently lower than the theoretical onset voltage at a relatively high temperature (equal or above 600 °C). At 600 °C, the experimental onset voltage is 3.2 kV, while the theoretical onset voltage is 3.6 kV. Similarly, Xiao15 and Yan6 reported the difference between theoretical and experimental onset voltage at high temperatures. These results show that Peek's formula suits other electronegative gas media well by adjusting relative density, although this formula is induced from air gas medium. The deviation that occurred at high temperature can be attributed to Peek's formula being determined at room temperature, where the discharge current is mainly composed of ion currents, while the electron current plays an important role on discharge current at high temperature.
 | (3) |
 | (4) |
 | ||
| Fig. 4 Effect of temperature on V–I characteristics. | ||
Temperature affects not only the ionization process but also the electron attachment process. According to Christophorou,24 with the increase of temperature, the non-dissociative attachment efficiency decreases, while the dissociative attachment efficiency increases. For gas medium such as CO2 which attach electrons both non-dissociative and dissociative, the attachment efficiency first decreases and then increases with the temperature increasing. However, compared to the influence of temperature on ionization, the influence on attachment can be neglected.11
Fig. 5 compares the calculated saturation unipolar ion currents with the experimental corona currents at different temperatures. According to Sigmond,19 the saturation unipolar ion density is expressed in eqn (5). Thus, the maximum possible unipolar ion current at a given port voltage UP and a wire–cylinder configuration are provided in eqn (6).
 | (5) |
 | (6) |
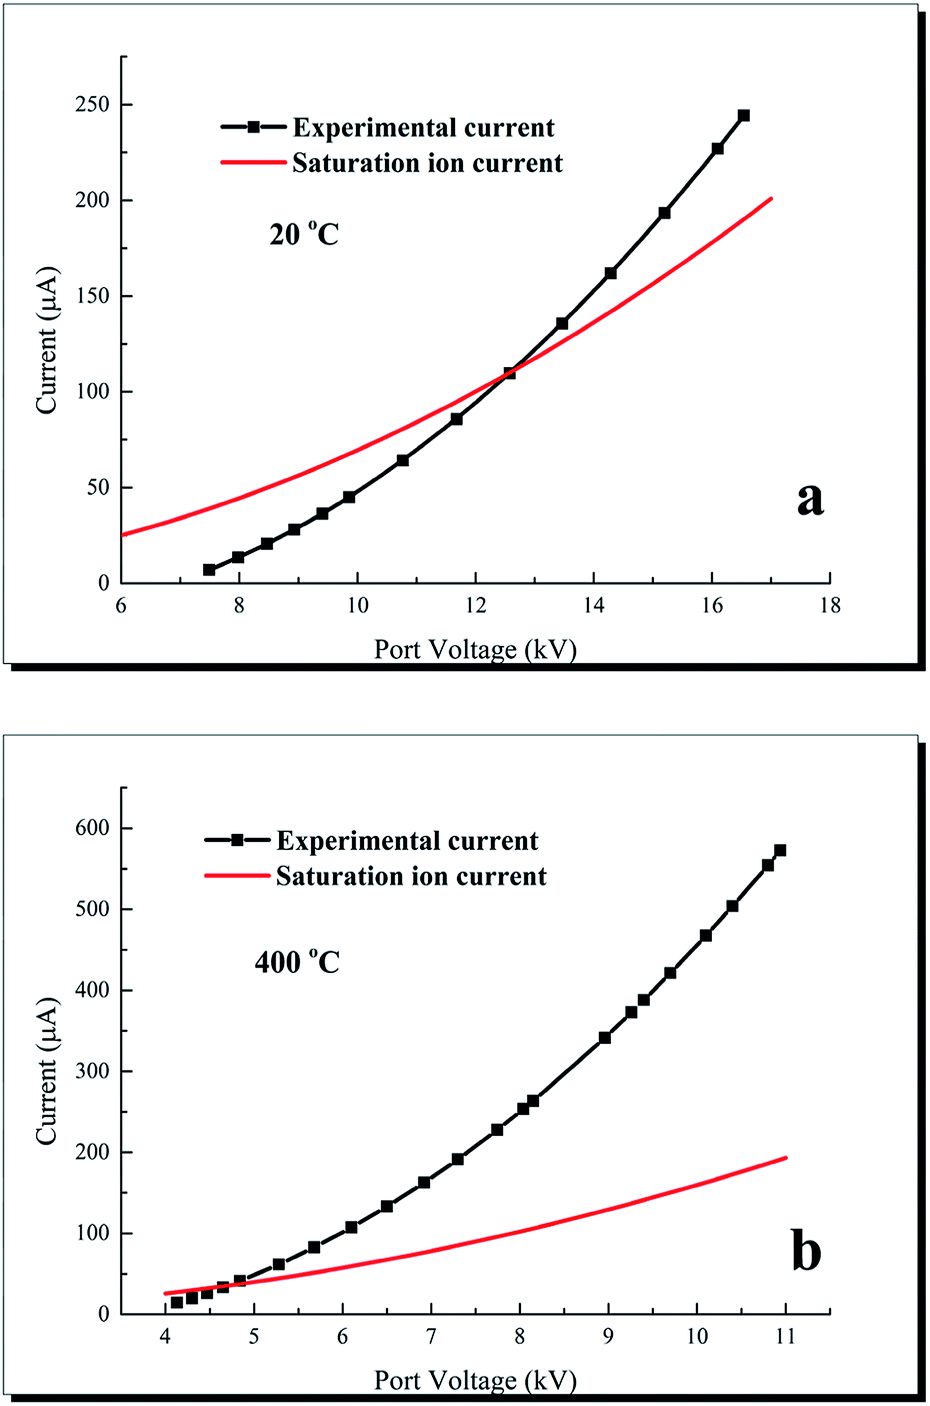 | ||
| Fig. 5 Comparison of experimental corona current and saturation ion current at different temperatures. | ||
Ion mobility is assumed to be independent of the electric field. It is a function of the relative density. For negative ions, the mobility is 2.7 × 10⁻⁴/δ m2 v−1 s−1.
At 20 °C, the experimental currents are smaller than the corresponding saturation ion currents when the port voltage is below 12.58 kV, thus indicating the absence of electron-carried currents. When the port voltage exceeds 12.6 kV at 20 °C, the experimental corona currents exceed the corresponding saturation ion currents. At 400 °C the corona currents are higher than the saturation ion currents when the port voltage is above 5 kV. These results indicate that the electron currents cannot be ignores in these cases, and the discharge currents comprise ion currents and electron currents. The electron current Ie can be calculated through I − Is. The electron current ratio, which means the proportion of electron current in the total current, can be calculated through Ie/I. On the port voltage of 10 kV, discharge current at 20 °C is 48 μA while the corresponding saturation ion current is 69.5 μA, thus, the electron current ratio (Ie/I) is 0. When the temperature increases to 400 °C and the port voltage remains 10 kV, discharge current is 457 μA while the corresponding saturation ion current is 159.7 μA, thus the electron current ratio is 0.65. These results indicate that electron current ratio increases as temperature increases. Yan6 and Xiao11,17 also found the existence of electron current, and the reason is that the ionization coefficient increases with the increases of temperature, while the attachment effect is basically unchanged. Electron current not only exists in the process of high temperature discharge, but also occurs in the discharge process of short inter-electrode distance. Ferreira25 established a point-to-plane discharge device and reported the existence of electron current when the distance below 1.5 cm.
In the process of electrostatic precipitation, dust particles are charged through the collision with charged ions, and move to the dust collecting plate under the action of electric field force. Therefore, ion current is important for dust charging. The existence of electron current only increases energy consumption but cannot improve the efficiency of dust removal. Thus, reducing the proportion of electronic current is conducive to improving the efficiency of dust removal and reducing energy consumption.
3.2 Effect of gas media
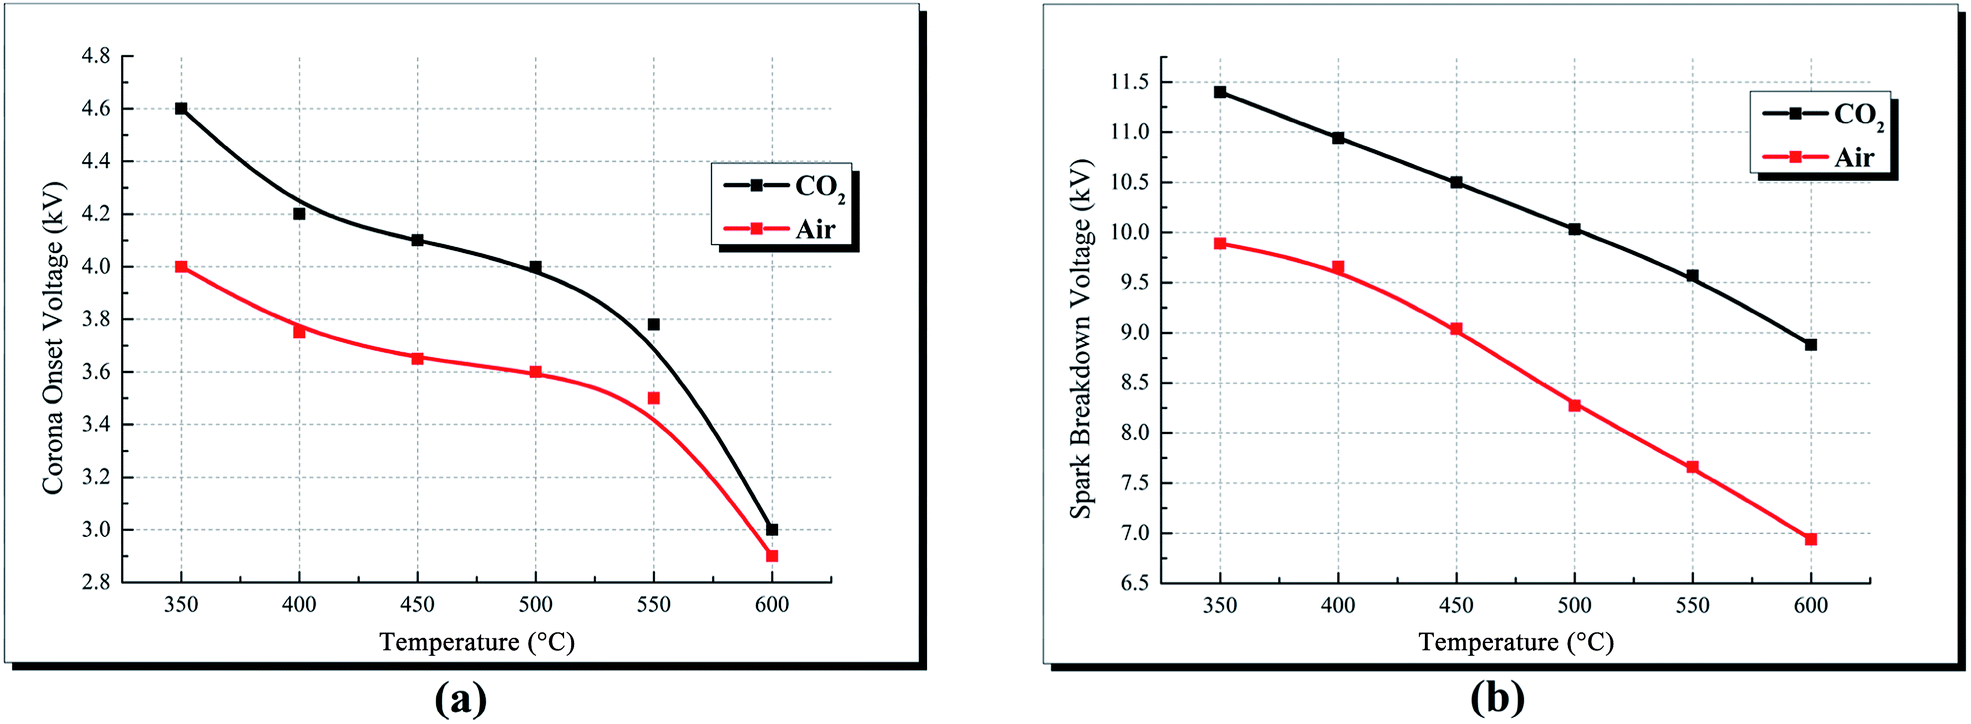 | ||
| Fig. 6 Corona onset voltage and spark breakdown voltage vs. increasing ambient temperature in different atmospheres. (a) Corona onset voltage and (b) spark breakdown voltage. | ||
The spark breakdown voltage of CO2 atmosphere is constantly higher than that of air atmosphere at the ambient temperature of 350–600 °C, as shown in Fig. 6(b). However, Xiao11 reported that the spark breakdown voltage of air is higher than that of CO2, because the attachment ability of air to electrons is stronger than that of CO2. The glow discharge is usually formed after the gas breakdown. According to the glow discharge theory, the glow discharge is caused by the secondary emission of the cathode, and the higher the ionization potential of gas media, the more easily the glow discharge is produced, that is, it is easier to breakdown. The ionization potential for CO2, O2 and N 2 are 13.3 eV,20 12.06 eV21 and 15.6 eV22 respectively. The ionization potential of N2 is higher than that of CO2, and N2 is the main component of air. Thus, compared with CO2, air is easier to breakdown and the breakdown voltage of air is lower.
Fig. 7 compares the V–I characteristics of air and CO2 at different temperatures. Corona discharge currents of CO2 are constantly higher than that of air. At 350 °C and on the port voltage of 7.75 kV, the corona discharge current of CO2 is 171 μA while the current of air is 68 μA. Similarly, Xiao15 studied the discharge characteristics under air and CO2 gas media, and attributed the difference of currents to the electronegativity difference between air and CO2. However, Suriyawong26 studied the characteristics of electrostatic precipitation under O2–CO2 and O2–N2 atmosphere, and reported that the discharge current decreased with the increase of CO2 concentration under O2–CO2 atmosphere during positive discharge. The results of Suriyawong's work imply that CO2 is more difficult to be ionized compared to O2. However, apart from ionization, electronegativity plays an important role in discharge current during negative corona discharge. In air, O2 molecules may directly attach electrons to form O2−, and the required electron energy is 0.058 eV;15,21 in CO2, its molecules attach electrons through a two-step reaction (shown in eqn (7)), and the required electron energy is 3.85 eV.15,20 Gas molecules with high electronegativity (low required electron energy in the attachment reactions) can attach additional electrons at the drift region, thereby reducing the mean velocity of charges and the discharge current.
| CO2 + e− → CO + O + e−, O + e− → O− | (7) |
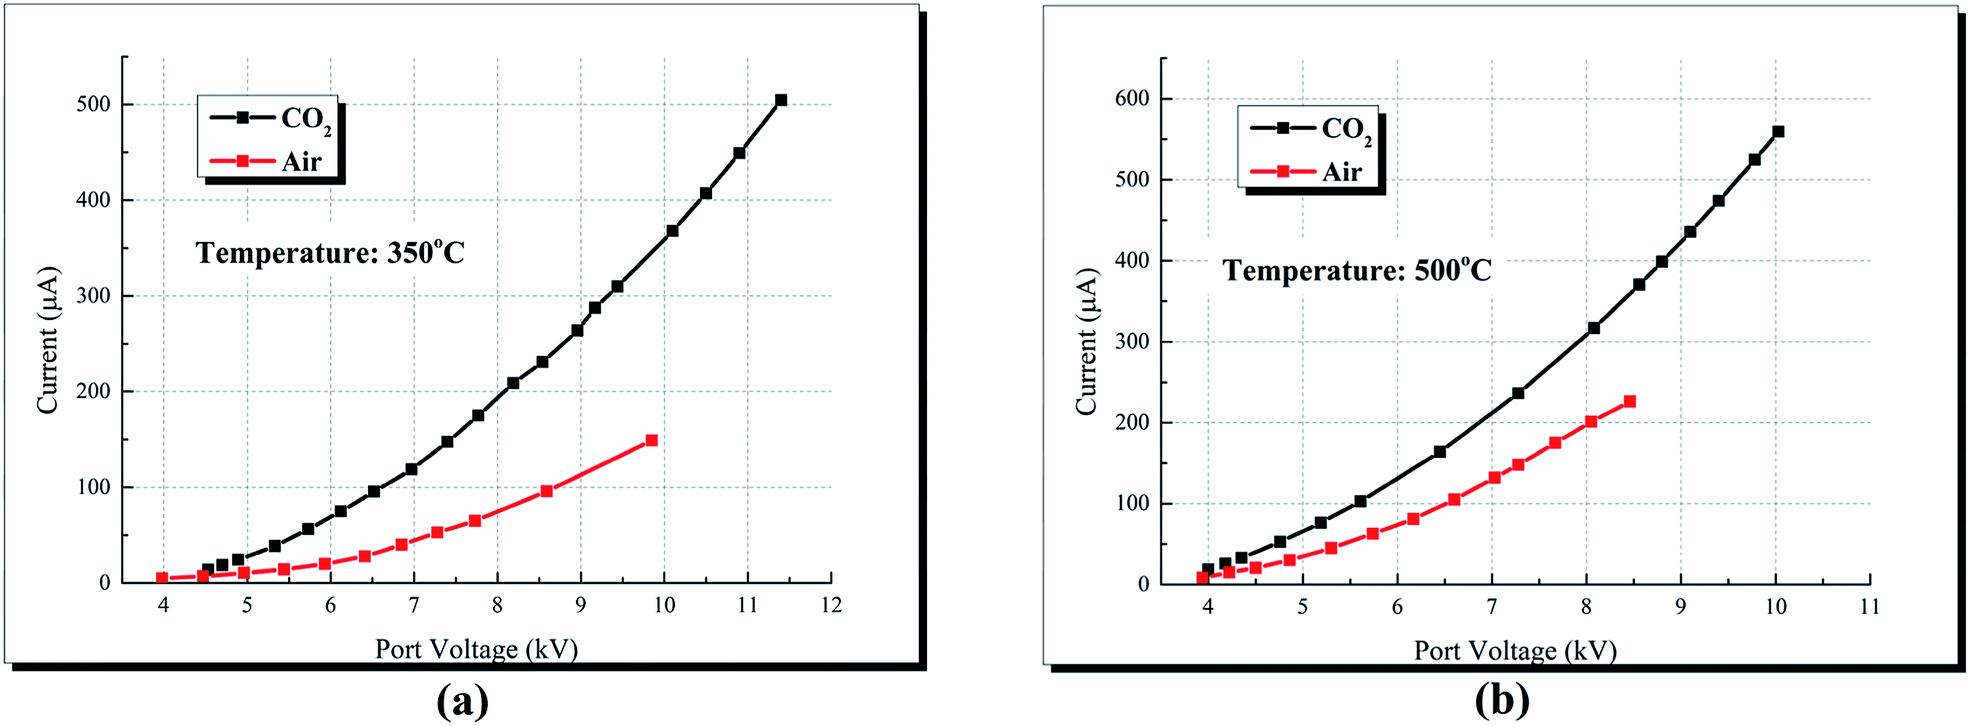 | ||
| Fig. 7 Effect of gas media on corona discharge current at different temperature. (a) 350 °C and (b) 500 °C. | ||
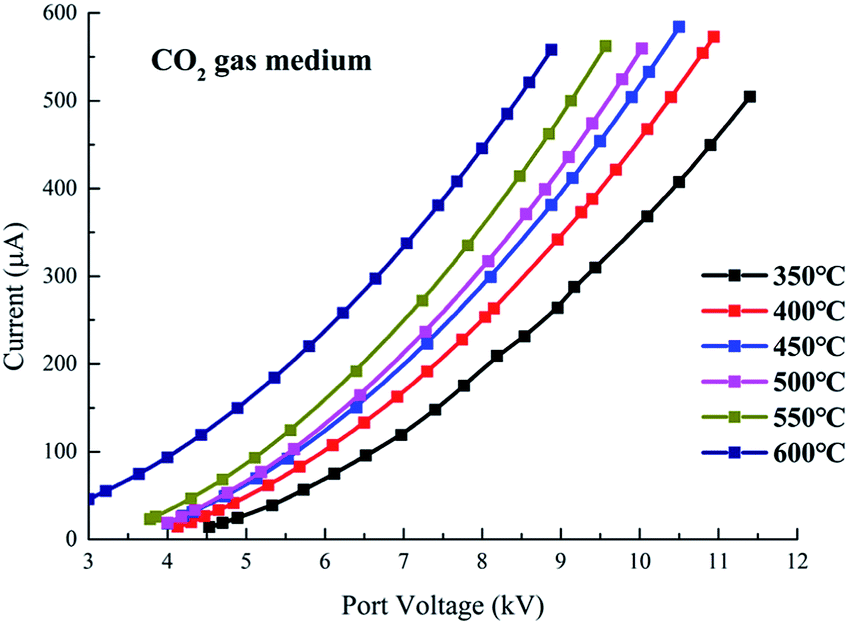
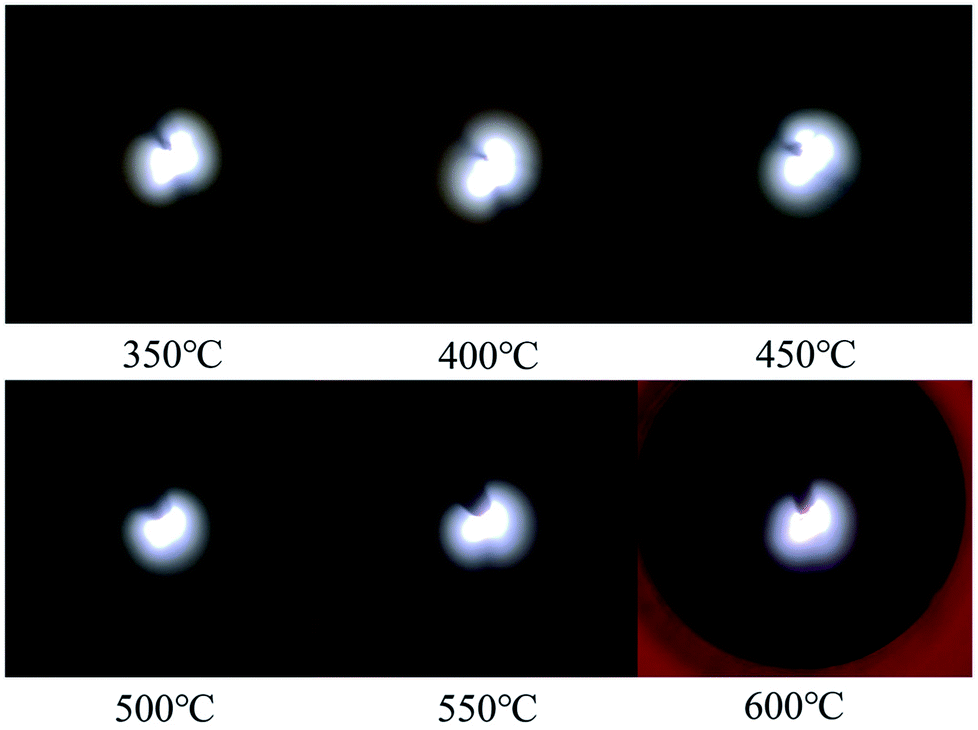
The V–I characteristics of a wire–cylinder configuration under CO2 gas medium at different temperatures are shown in Fig. 8 and photographs of the discharge are shown in Fig. 9. The corresponding port voltages and currents are listed in Table 1. When the temperature is within the range of 350–550 °C, with the increase of output voltage, three types of discharge are observed. Photographs no. 1, no. 4 and no. 7 show cathode heads surrounded by faint light, depicting corona discharges before breakdown. After breakdown, a discontinuous optical channel connecting the two electrodes appears, indicating that the glow discharge begins, as shown in photographs no. 2, no. 5 and no. 8. As the output voltage increases, the brightness of the luminous channel increases and the channel becomes continuous, which represents the arc discharge, as shown in photographs no. 3, no. 6 and no. 9. Corona refers to the phenomenon of partial discharge on the surface of charged body in gas medium. Glow discharge refers to the process during which the residual positive ions are accelerated in the electric field, obtaining enough kinetic energy to bombard the cathode, producing the secondary electrons, and the electrons will generate more charged particles through the avalanche to make the gas conductive. Arc discharge refers to the phenomenon of intense light and heat. As discussed above, corona discharge is partial discharge and occurs before gas breakdown. However, glow discharge and arc discharge occur after gas breakdown. There are two main differences between the glow discharge and arc discharge: (1) glow discharge is caused by the secondary electrons emission, while arc discharge is caused by thermal ionization; (2) during glow discharge, the optical channel bridging the two electrodes is discontinuous, while during arc discharge, the optical channel is continuous.
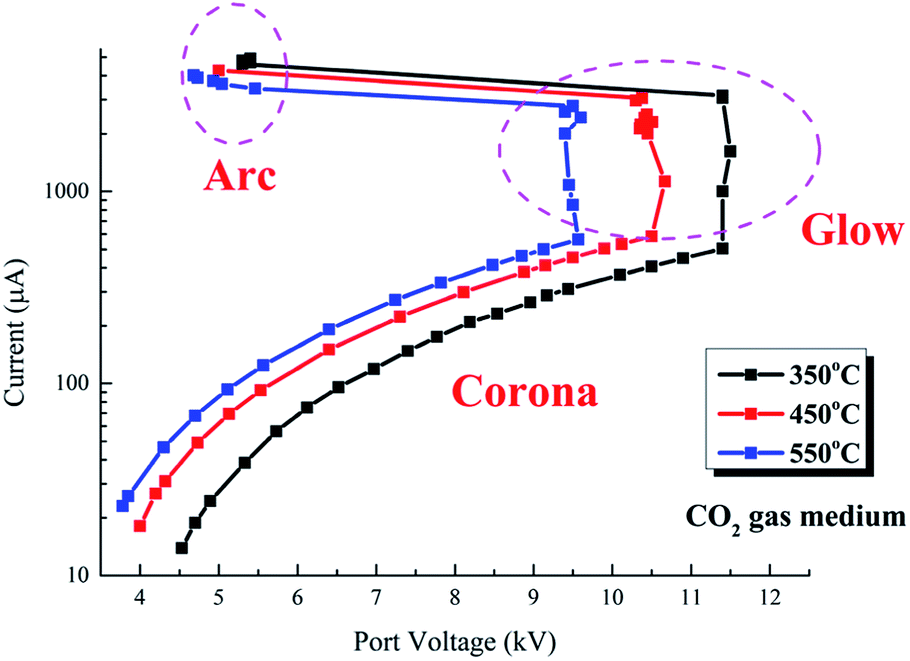 | ||
| Fig. 8 V–I characteristics of CO2 discharge at high temperatures. | ||
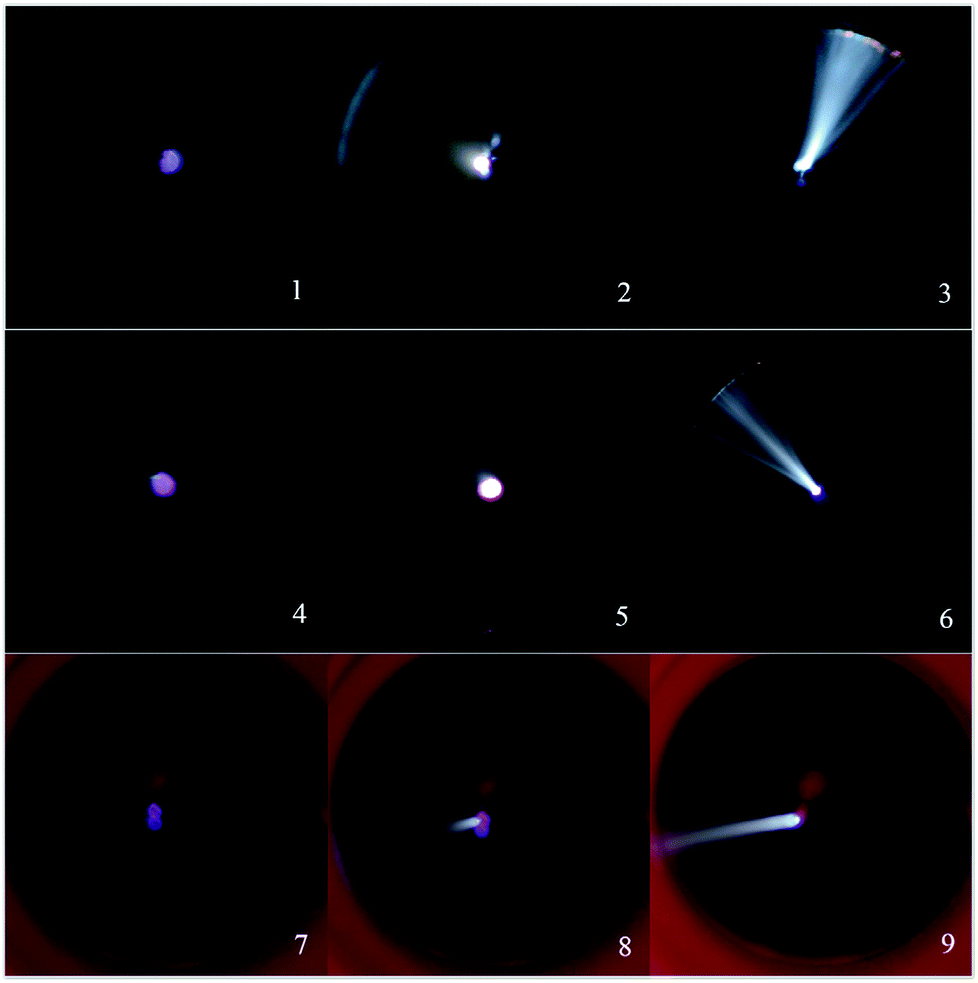 | ||
| Fig. 9 Discharge photographs of CO2 discharge at high temperatures. | ||
| Temperature (°C) | Corona | Glow | Arc |
|---|---|---|---|
| Port voltage (kV)/current (μA) (no.) | Port voltage (kV)/current (μA) (no.) | Port voltage (kV)/current (μA) (no.) | |
| 350 | 9.44/337.1 (1) | 11.15/3078.6 (2) | 5.4/4694 (3) |
| 450 | 9.15/395 (4) | 10.38/3057 (5) | 5/4262 (6) |
| 550 | 8.57/306.7 (7) | 9/2195.4 (8) | 4.68/4015 (9) |
The three discharge stages can be clearly distinguished in the V–I characteristics, as shown in Fig. 8. Taking the V–I characteristics at 550 °C as an example, with the port voltage increasing to 3.78 kV, corona discharge starts. Under this stage, as the port voltage increases, the currents increase and the corona currents are on the order of several tens to several hundred microamperes. As the port voltage increases to about 9.5 kV, spark breakdown occur and glow discharge starts. At the glow discharge stage, the port voltage remains almost unchanged with the increase of current. As the current increases to 3431 μA, the port voltage drops to 5.46 kV immediately and arc discharge starts. At the arc stage, the port voltage decreases with increasing current.
The V–I characteristics and photographs of the same device under H2 gas medium are shown in Fig. 10 and 11 respectively. The photographs (port voltages and currents are listed in Table 2) shown in Fig. 11 are different from these displayed in Fig. 9. Fig. 10 shows that the port voltage increases with the increase of current, suggesting that it is not arc discharge. Negative corona discharge does not occur in H2.7 Thus, it is determined that the discharge shown in Fig. 11 is glow discharge. Taking the V–I characteristics under H2 gas medium at 550 °C as an example, it begins to discharge at 2.05 kV and quickly breakdown, and the current reaches 164 μA to form bright glow discharge. With the increase of port voltage, the discharge current increases greatly. When the port voltage increases to 5.87 kV, the discharge current increases to 8472 μA.
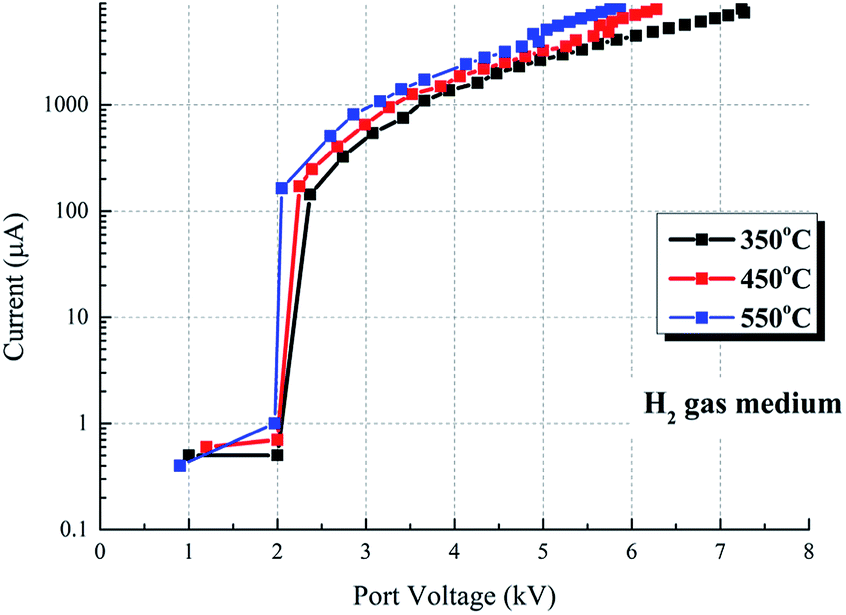 | ||
| Fig. 10 V–I characteristics of H2 discharge at high temperatures. | ||
 | ||
| Fig. 11 Discharge photographs of H2 discharge at high temperatures. | ||
| Temperature (°C) | Port voltage (kV)/current (μA) |
|---|---|
| 350 | 6.94/6520 |
| 400 | 6.38/7212 |
| 450 | 6.17/7479 |
| 500 | 5.97/7708 |
| 550 | 5.76/7972 |
| 600 | 5.57/8223 |
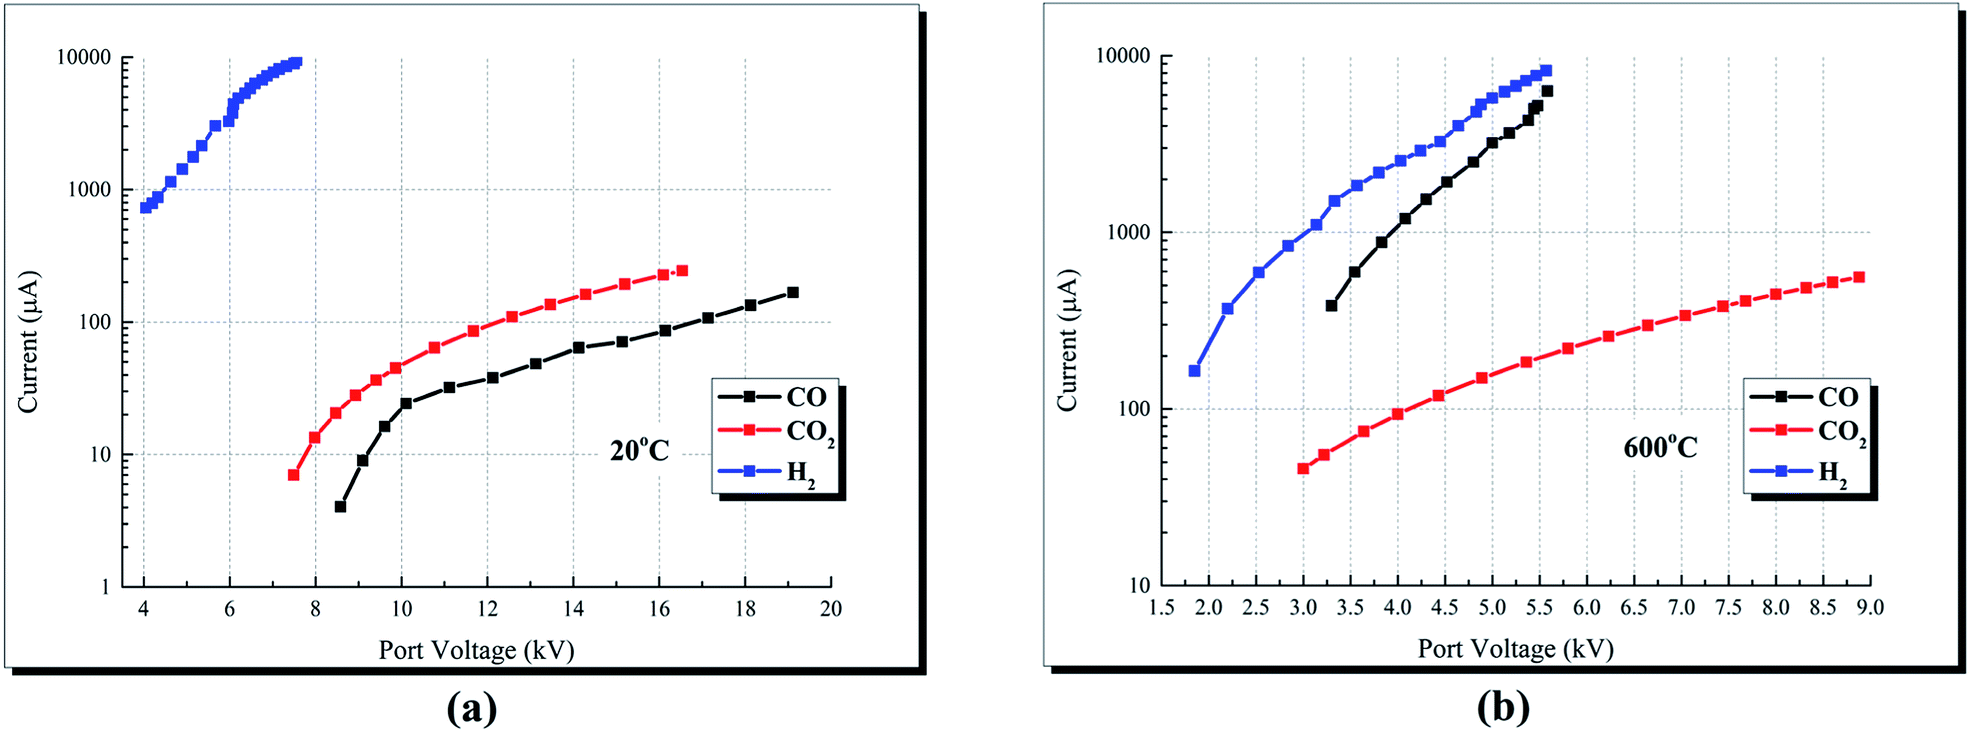 | ||
| Fig. 12 Comparison of CO, H2 and CO2 at different temperature: (a) 20 °C, (b) 600 °C. | ||
| Temperature (°C) | CO | H2 | CO2 |
|---|---|---|---|
| Port voltage (kV)/current (μA) | Port voltage (kV)/current (μA) | Port voltage (kV)/current (μA) | |
| 20 | 8.6/4.2 | 4.9/1427 | 8.6/23 |
| 20 | 15.2/73 | 7.56/9484 | 15.2/193 |
| 600 | 3.5/580 | 3.5/1720 | 3.5/71 |
| 600 | 5.48/5200 | 5.48/7800 | 5.48/189 |
3.3 Effect of chemical reactions
Table 4 displays the gas compositions after the CH4 discharge process when the temperature is 500 °C, the output voltage is 20 kV, and the residence time is approximately 8.73 s. Gaseous products, such as H2, C2H4, and C2H6, and solid productions, i.e., carbon filaments, are produced through the CH4 discharge process| Composition | Volume fraction (%) |
|---|---|
| CH4 | 98.44 |
| H2 | 1.35 |
| C2H4 | 0.12 |
| C2H6 | 0.09 |
Fig. 13(b) presents the current curve at 20 °C and on the output voltage of 5.5 kV, and Fig. 13(a) depicts the discharge photographs of the current curve (time and currents are listed in Table 5). In the first photograph, glow discharge begins in the CH4 gas medium when the high voltage is applied to the discharge configuration. Carbon filaments and other gaseous products are produced when high energy electrons collide with CH4 molecules, and the discharge points move from the cathode to the endpoints of the carbon filaments. The second and third photographs show that the number and length of the carbon filaments increase simultaneously with the discharge and the corresponding currents. In the fourth photograph, the carbon filaments become unstable and collapse with the discharge current from the cathode when the length of the carbon filaments increases.
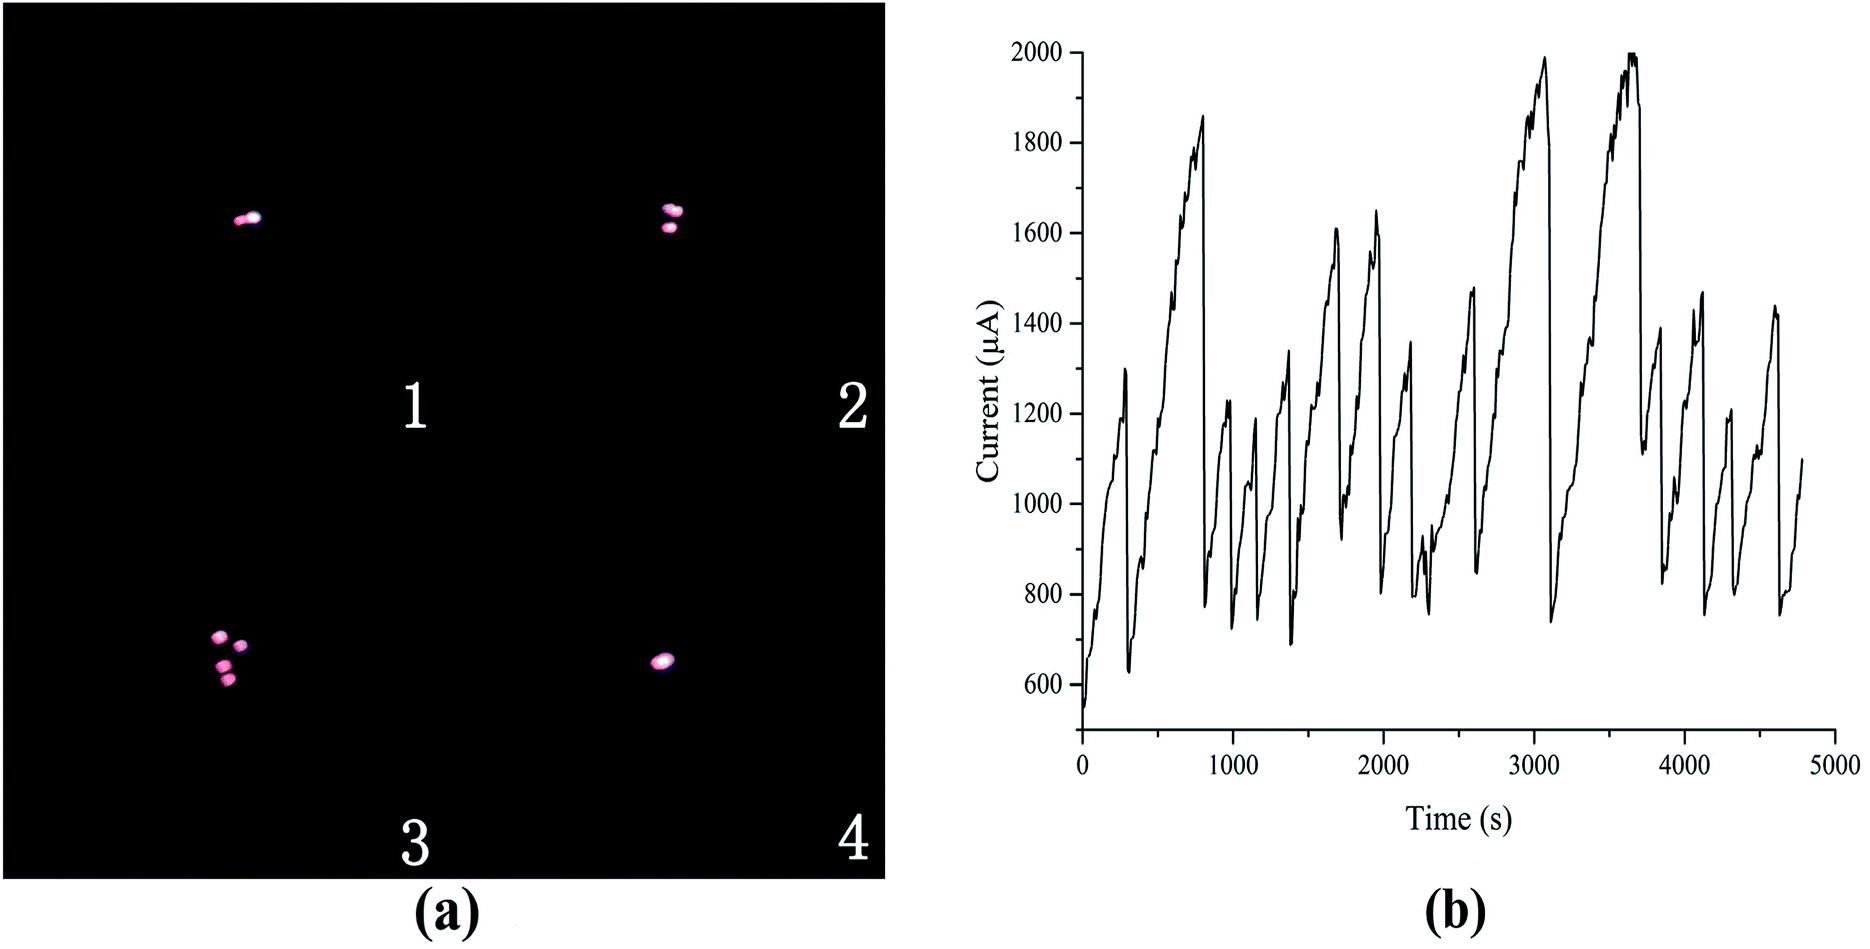 | ||
| Fig. 13 (a) Discharge photographs and (b) its current curve at 20 °C and on the output voltage of 5.5 kV. | ||
| Number | Time (s) | Current (μA) | Port voltage (kV) |
|---|---|---|---|
| 1 | 360 | 700 | 4.9 |
| 2 | 610 | 1430 | 4.39 |
| 3 | 790 | 1840 | 4.07 |
| 4 | 820 | 770 | 4.9 |
In addition to the collapse, another result for carbon filaments is depicted in Fig. 14 and Table 6. The carbon filaments reach the anode eventually when the length of the carbon filaments extends and connects the electrodes. At this moment, the port voltage decreases to 0.12 kV, and the output voltage decreases below 20 kV because the maximum output current is 20 mA.
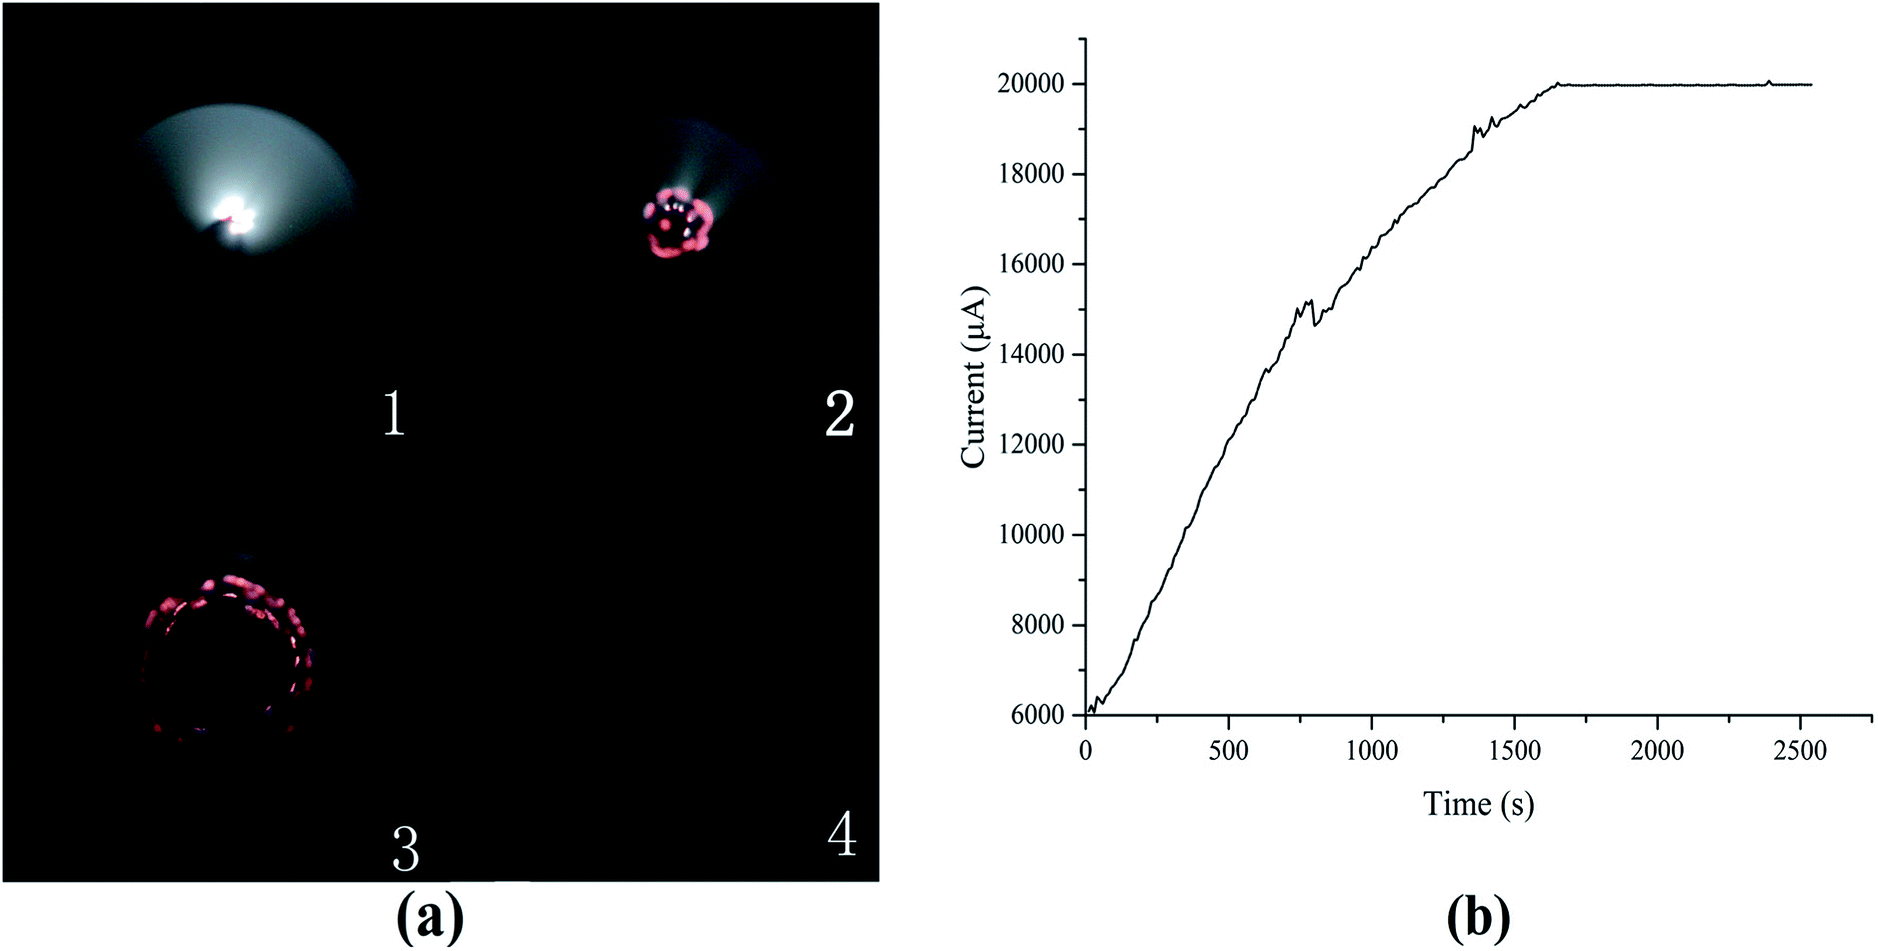 | ||
| Fig. 14 (a) Discharge photographs and (b) its current curve at 20 °C and on the output voltage of 20 kV. | ||
| Number | Time (s) | Current (μA) | Port voltage (kV) |
|---|---|---|---|
| 1 | 310 | 9500 | 12.6 |
| 2 | 930 | 15740 |
7.53 |
| 3 | 2090 | 19970 |
2.72 |
| 4 | 2420 | 19980 |
0.12 |
Fig. 15 illustrates the comparison of the V–I characteristics with the different voltage increasing rates. The red line represents the V–I curve where the voltage increment is 0.5 kV, and each point takes 5 min to record, while the black line represents the V–I curve where the voltage increases at 10 kV min−1 continuously. The trend and current value of the two lines are nearly coincidental with each other, except that the red line fluctuates more intense than the black line.
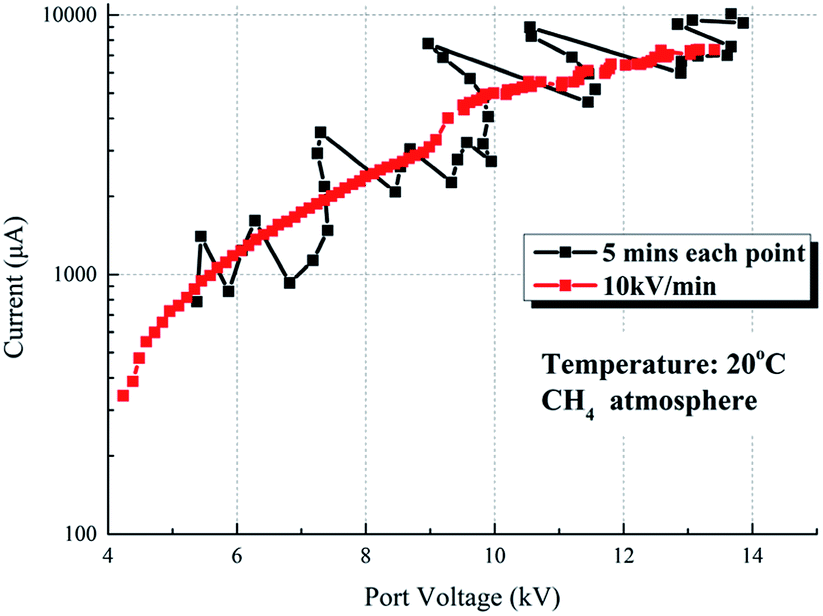 | ||
| Fig. 15 V–I characteristics of CH4 at the temperature of 20 °C. | ||
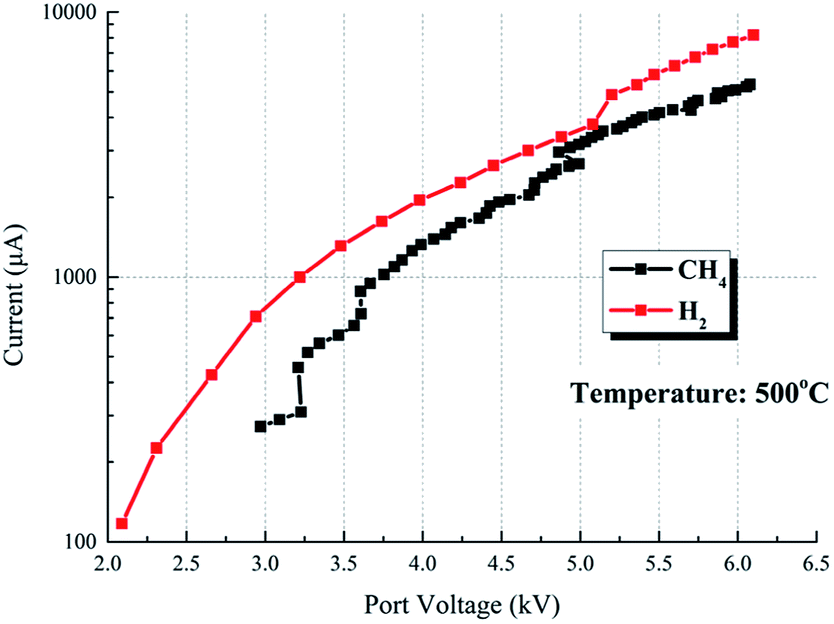
Fig. 16 compares the V–I characteristics of CH4 and H2 at the temperature of 500 °C. In CH4, the voltage increases at 10 kV min−1 continuously. The current value of these media is nearly identical, indicating that the discharge characteristics of CH4 are nearly similar to the H2 atmosphere.
 | ||
| Fig. 16 Comparison of CH4 and H2 at the temperature of 500 °C. | ||
These results indicate that chemical reactions affect discharge characteristics in two aspects: (1) the growth and collapse process of carbon filaments leads to the change in the discharge gap, thereby causing discharge current volatility, which means that the discharge current fluctuates violently during the discharge process; (2) in certain conditions, the growth of carbon filaments is stable and they reach the anode eventually, causing short circuit between the electrodes, leading to the termination of the discharge process. In addition to the two aspects, CH4 belongs to non-electronegative gas media, and its discharge characteristics are similar to those of N2 and H2.
In addition to CH4 atmosphere, chemical reactions and carbon generation occur during the CO discharge process. However, the two differences of carbon growth between CO and CH4 are as follows: (1) at 20 °C, carbon is produced during the CH4 discharge process, while carbon is not produced during the CO discharge process (carbon is produced during the CO discharge process when the temperature exceeds 350 °C); (2) in CH4, carbon is produced in the structure of an umbrella around the cathode, while in CO, carbon is produced in powder form around the anode; therefore, neither the process of “growth and collapse” of carbon filaments nor the discharge current volatility occurs.
4. Conclusion
This work investigated the discharge characteristics of the main coal pyrolysis gas components (CO2, H2, N2, CH4, CO) and air at 20–600 °C. The following conclusions are drawn:(1) With increasing temperature, corona onset voltage and spark breakdown voltage decrease, and spark breakdown voltage decreases more rapidly. The operational voltage range for corona discharge decreases from 8.5 kV to 5.68 kV as the temperature increases from 20 °C to 600 °C.
(2) Discharge current increases as the temperature increases. The electron current ratio increases with the increase of temperature and applied voltage.
(3) Discharge current of CO2 is higher than that of air due to the difference of electronegativity. The corona onset voltages and spark breakdown voltages of CO2 are higher than those of air at the temperature range of 20–600 °C.
(4) During CO2 discharge, with the increase of output voltage, three types of discharge are successively observed, namely corona, glow and arc. However, during H2 discharge, only glow discharge is observed.
(5) Temperatures significantly affect the capability of CO to attach electrons. At 20 °C, the discharge current is slightly lower in CO than in CO2. However, CO cannot attach electrons at 350–600 °C, and the discharge current is similar to that of H2.
(6) Chemical reactions and carbon generation occur during the CH4 and CO discharge process. Chemical reaction has almost no effect on the discharge characteristics of CO. However, chemical reactions affect the discharge characteristics of CH4 in two aspects: (1) process of growth and collapse of carbon filaments leads to the discharge current volatility; (2) carbon filaments connecting two electrodes cause the discharge process to be terminated.
Conflicts of interest
There are no conflicts to declare.Abbreviations
| r | Radial direction distance from the cathode, m |
| R | Radius of the anode tube, m |
| r0 | radius of the cathode, m |
| l | Effective length of the cathode, m |
| Er | Electric field at a radius of r, V m−1 |
| E0 | Electric field at a radius of r0, V m−1 |
| ρs | Saturation unipolar ion density, A s m−3 |
| ε0 | Dielectric constant, F m−1 |
| Up | Port voltage applied to the electrode, V |
| I | Discharge current, A |
| Is | Saturation unipolar ion current, A |
| Ie | Electron current, A |
| δ | Relative density |
| Mgas | Relative molecular mass of the gas medium |
| P | Gas pressure of the experiments, Pa |
| P0 | Standard atmospheric pressure, P0 is 10325 Pa |
| T | Temperature of the experiments, K |
| T0 | Room temperature, T0 is 298 K |
| i0 | Residual current when gas is not discharged, A |
| α | Townsend first ionization coefficient, m−1 |
| d | The distance between anode and cathode, m |
| γ | Townsend third ionization coefficient |
| λ | The mean free path, m |
| Vi | Ionization potential, V |
| μ | The mobility of negative ions, m2 (V−1 s−1) |
| t | Ion drift time, s |
Acknowledgements
This work was financially supported by the National Key R&D Program of China (No. 2017YFB0602800 and No. 2016YFE0102500).Notes and references
- Q. Wang, Coal Staged Conversion Polygeneration Technology Combining with Pyrolysis and Combustion Processes, Springer International Publishing, 2017 Search PubMed.
- T. Melchior and R. Madlener, Economic evaluation of IGCC plants with hot gas cleaning, Appl. Energy, 2012, 97, 170–184 CrossRef.
- X. Xu, X. Gao, P. Yan, W. Zhu, C. Zheng and Y. Wang, et al., Particle migration and collection in a high-temperature electrostatic precipitator, Sep. Purif. Technol., 2015, 143, 184–191 CrossRef.
- G. Ahmadi and D. H. Smith, Gas flow and particle deposition in the hot-gas filter vessel of the Pinon Pine project, Powder Technol., 2002, 128, 1–10 CrossRef.
- G. Xiao, X. Wang, J. Zhang, M. Ni, X. Gao and Z. Luo, et al., Granular bed filter: A promising technology for hot gas clean-up, Powder Technol., 2013, 244, 93–99 CrossRef.
- P. Yan, C. Zheng, G. Xiao, X. Xu, X. Gao and Z. Luo, et al., Characteristics of negative DC corona discharge in a wire–plate configuration at high temperatures, Sep. Purif. Technol., 2015, 139, 5–13 CrossRef.
- X. Xu and D. Zhu, Gas Discharge Physics, Fudan University Press, 1996 Search PubMed.
- A. Villot, Y. F. J. Gonthier, E. Gonze and A. Bernis, Numerical Model of Current–Voltage Curve for the Wire–Cylinder Electrostatic Precipitators in Negative Voltage in the Presence of Nonpolar Gases, IEEE Trans. Plasma Sci., 2010, 38, 2031–2040 Search PubMed.
- A. Bologa, H. R. Paur, H. Seifert and K. Woletz, Influence of gas composition, temperature and pressure on corona discharge characteristics, International Journal of Plasma Environmental Science and Technology, 2011, 5, 110–116 Search PubMed.
- P. Yan, C. Zheng, W. Zhu, X. Xu, X. Gao and Z. Luo, et al., An experimental study on the effects of temperature and pressure on negative corona discharge in high-temperature ESPs, Appl. Energy, 2016, 164, 28–35 CrossRef.
- X. Wang, M. Ni, G. Xiao, J. Zhang, X. Gao and K. Cen, An analytical method for DC negative corona discharge in a wire–cylinder device at high temperatures, J. Electrost., 2014, 72, 270–284 CrossRef.
- Z. Gu, X. Xi, J. Yang and J. Xu, Properties of RE–W cathode and its application in electrostatic precipitation for high temperature gas clean-up, Fuel, 2012, 95, 648–654 CrossRef.
- J. Xu, Z. Gu, X. Xi, J. Zhang and J. Liu, Loss mechanism and lifetime estimation of Ce–W cathode in high temperature thermionic emission electrostatic precipitation, J. Electrost., 2014, 72, 336–341 CrossRef.
- A. Villot, Y. Gonthier, E. Gonze, A. Bernis, S. Ravel and M. Grateau, et al., Separation of particles from syngas at high-temperatures with an electrostatic precipitator, Sep. Purif. Technol., 2012, 92, 181–190 CrossRef.
- G. Xiao, X. Wang, J. Zhang, M. Ni, X. Gao and K. Cen, Characteristics of DC discharge in a wire–cylinder configuration at high ambient temperatures, J. Electrost., 2014, 72, 13–21 CrossRef.
- G. Xiao, X. Wang, G. Yang, M. Ni, X. Gao and K. Cen, An experimental investigation of electrostatic precipitation in a wire–cylinder configuration at high temperatures, Powder Technol., 2015, 269, 166–177 CrossRef.
- G. Xiao, X. Wang, J. Zhang, M. Ni, X. Gao and K. Cen, Current analysis of DC negative corona discharge in a wire–cylinder configuration at high ambient temperatures, J. Electrost., 2014, 72, 107–119 CrossRef.
- G. V. Naidis, Simulation of streamer-induced pulsed discharges in atmospheric-pressure air, Eur. Phys. J.: Appl. Phys., 2009, 47, 22803 CrossRef.
- R. S. Sigmond, Simple approximate treatment of unipolar space-charge-dominated coronas: The Warburg law and the saturation current, J. Appl. Phys., 1982, 53, 891–898 CrossRef.
- Y. Itikawa, Cross Sections for Electron Collisions With Carbon Dioxide, J. Phys. Chem. Ref. Data, 2002, 31, 749 CrossRef.
- Y. Itikawa, Cross Sections for Electron Collisions with Oxygen Molecules, J. Phys. Chem. Ref. Data, 2009, 38, 1 CrossRef.
- Y. Itikawa, Cross Sections for Electron Collisions with Nitrogen Molecules, J. Phys. Chem. Ref. Data, 2006, 35, 31 CrossRef.
- J. Yoon, M. Song, J. Han, S. H. Hwang, W. Chang and B. Lee, et al., Cross Sections for Electron Collisions with Hydrogen Molecules, J. Phys. Chem. Ref. Data, 2008, 37, 913 CrossRef.
- L. G. Christophorou, R. A. Mathis, S. R. Hunter and J. G. Carter, Effect of temperature on the uniform field breakdown strength of electronegative gases, Gaseous Dielectrics V, 1988, 63, 52–59 Search PubMed.
- G. F. L. Ferreira, O. N. J. Oliveira and J. A. Giacometti, Point-to-plane corona: Current-voltage characteristics for positive and negative polarity with evidence of an electronic component, J. Appl. Phys., 1986, 59, 3045–3049 CrossRef.
- A. Suriyawong, C. J. Hogan Jr, J. Jiang and P. Biswas, Charged fraction and electrostatic collection of ultrafine and submicrometer particles formed during O–CO coal combustion, Fuel, 2008, 87, 673–682 CrossRef.
| This journal is © The Royal Society of Chemistry 2018 |