DOI:
10.1039/C8RA03140A
(Paper)
RSC Adv., 2018,
8, 27796-27804
Aquatic photodegradation of clofibric acid under simulated sunlight irradiation: kinetics and mechanism analysis†
Received
12th April 2018
, Accepted 7th July 2018
First published on 3rd August 2018
Abstract
Clofibric acid is one of the most frequently detected pharmaceuticals in various aquatic environments. Photodegradation of clofibric acid in water under simulated sunlight was investigated. The effects of different initial concentrations, pH conditions and dissolved oxygen were examined. Photodegradation of clofibric acid followed a pseudo-first-order kinetics model, and the rate decreased gradually with the increasing initial concentration of clofibric acid. Dissolved oxygen inhibited the photodegradation of clofibric acid. As a result of varying reaction species of clofibric acid, the initial pH conditions greatly influenced its photodegradation. Quenching experiments showed that the self-sensitization process via ·OH and 1O2 occured during photodegradation of clofibric acid, and the bimolecular reaction rate constants of clofibric acid with ·OH and 1O2 were determined via the competition kinetics method to be 3.93(±0.20) × 108 and 2.38(±0.12) × 106 L mol−1 s−1, respectively. In addition, the transformation products of clofibric acid were identified by the UPLC-Q-TOF-MS microsystem, and eight products were detected. It is proposed that the photodegradation of clofibric acid occurred mainly via decarboxylation, dechlorination, ·OH addition and 1O2 attack reaction.
1 Introduction
In recent years, pharmaceuticals and personal care products (PPCPs) have emerged as a novel class of pollutants due to their incomplete degradation in sewage treatment plants.1 A large number of studies have investigated the presence, fate, and behaviour of PPCPs in aquatic environments.2–6
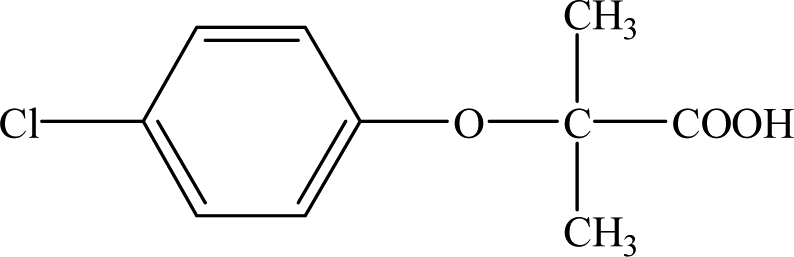
Clofibric acid (2-(4-chlorophenoxy)-2-methylpropionic acid, CA) is one common type of PPCP. It is an active metabolite of clofibrate, etofyllin clofibrate and etofibrate with therapeutic doses of about 1–2 g d−1 per person.7,8 Nowadays, many patients are suffering from angiocardiopathy problems, and an increasing number of blood lipid regulators are being consumed year by year.9 However, drugs ingested by humans cannot be fully utilized, and more than 60% is excreted via urine or faeces; thus, these species ultimately end up in sewage treatment plants.10 Furthermore, several previous investigations have demonstrated that CA cannot be effectively eliminated in conventional sewage treatment plants.11,12 Ever since CA was first identified in wastewater in the USA in the 1970s, it has been frequently detected in many STP effluents,10 surface water,13 and even drinking water.14 Its concentrations have been measured up to 13.5 ng L−1, 46.4 ng L−1 and 50.6 ng L−1 in the Yellow River, Haihe River and the lower reaches of the Dongjiang River, respectively, in China.13 It has been reported that CA can affect the reproductive axis of fish.15 Thus, once CA is released into the environment, it is very necessary to consider its fate, degradation pathways, persistence, and impact on the aquatic environment.
As a result of the absorption of light energy, many types of pollutants can be reduced in an aquatic environment.16–20 Pharmaceuticals are expected to be susceptible to direct photodegradation, where the direct absorption of photons leads to degradation of pollutants or indirect photolysis, which occurs in the presence of photosensitisers.21,22 In addition, researchers have shown that reactive oxygen species (ROS) including singlet oxygen (1O2) and even stronger oxidant hydroxyl radical (·OH) can be photogenerated by certain drugs to subsequently oxidize and degrade the pollutants, which is designated as the self-sensitized photodegradation of pollutants.23–27
To date, research on CA has primarily focused on its removal by AOPs,7,28–32 adsorption,33–37 catalytic technology,38–40 or joint processes,41 and studies on the behavior of CA in the environment are still very limited. However, these technologies may have some drawbacks; for example, AOPs may induce high energy consumption of the UV lamp and the generation of more toxic products.42,43 Adsorption cannot completely remove contaminants from the environment, and the catalytic process may introduce new chemicals into the water, which may cause new problems.
According to Jennifer L. Packer,44 photolysis is one of the important processes affecting the behavior of CA in the environment. Therefore, it is necessary to offer detailed information about the photodegradation of CA to better evaluate its potential risks.
This study aims to explore the degradation kinetics and mechanism of CA under simulated sunlight and to identify the main degradation products during CA photodegradation. The effect of oxygen concentration on the photodegradation of CA was investigated by gas purging experiments. The mechanisms of CA photolysis were explored by quenching experiments, and the bimolecular reaction rate constant was determined through the competitive dynamics method. The major photolysis products were identified with ultra-performance liquid chromatography/mass spectrometry, which enabled the analysis of possible photolysis pathways. Finally, the effects of water matrices and constituents on the degradation of CA were evaluated. The results will help elucidate the fate and behavior of CA, thus contributing to the evaluation of its environmental risks.
2 Materials and methods
2.1 Materials
CA (>97%) and sorbic acid were purchased from TCI Reagent Co. Ltd. (Shanghai, China). HPLC-grade reagents (acetonitrile, methanol, etc.) were obtained from Shanghai ANPEL Scientific Instrument Co. Ltd. (Shanghai, China). Benzoic acid (99.5%) and sodium azide (99%) were purchased from Aladdin Industrial Corporation (Shanghai, China), and furfuryl alcohol (FFA) (99%) was purchased from the Sigma-Aldrich Company. Acetic acid (99%), isopropanol (99.7%), humic acid, NaOH, H2SO4, MgSO4, ZnSO4, CuSO4, Fe2(SO4)3, NaCl, NaNO3, NaHCO3 and KH2PO4 were obtained from Chengdu Kelong Chemical Reagent Co. Ltd. (Sichuan, China). All reagents were of analytical grade and were used without further purification. Ultrapure water (resistance > 18.2 MΩ) was produced by a water purification system (TKA, Germany).
2.2 Experimental methods
2.2.1 Photodegradation of CA. Photodegradation experiments were carried out using a sunlight simulator (XPA-7, Aanjing XUJ, Co. Ltd) with a hollow cylindrical quartz tube photoreactor. An 800 W xenon lamp placed in a double-walled quartz cooling jacket was selected as the simulated sunlight source. The emission spectrum of the xenon lamp and sunlight is shown in Fig. S1.† The reaction liquid consisting of 5 mg L−1 CA was placed into a 50 ml quartz tube, and this solution was stirred by a magnetic stirrer during the experiments. The temperature was controlled at 25 ± 1 °C using a constant-temperature liquid-circulating apparatus, and the pH of the solution was controlled at 7(±0.1) by adjusting with 0.1% NaOH and 0.1% H2SO4 beforehand. During all experiments, maximum 6 irradiated samples (2 ml each) were withdrawn from the photoreactor using pipettes every 5 min. After filtration by a 0.45 μm PES membrane, the samples were analyzed by the reversed-phase high-performance liquid chromatography system.
2.2.2 Determination of bimolecular reaction rate constants and steady-state concentration. To study the sensitivity of the CA reaction with ·OH or 1O2, the bimolecular rate constant was determined by the competition kinetics method (eqn (1) and (2)). Benzoic acid (BA), with a known rate constant (k·OH,BA = 5.9 × 10⁹ mol−1 s−1),45 and furfuryl alcohol (FFA) (k1O2,FFA = 8.3 × 10⁷) were used as reference compounds in this study.46 A solution of BA or FFA was photolyzed along with solutions containing CA. Aliquots were removed at various time points and analyzed by HPLC.| |
 | (1) |
| |
 | (2) |
here, [CA], [BA] and [FFA] are the concentrations of CA, BA and FFA; k·OH,CA and k1O2,CA are the bimolecular reaction rate constants of ·OH and 1O2 with CA.The steady-state concentrations of ·OH and 1O2 were determined by the loss of BA and FFA according to eqn (3) to (6):47,48
| | |
BA + ·OH → intermediates
| (3) |
| | |
−d[BA]/dt = k·OH,BA[·OH]ss[BA] = kobs,BA[BA]
| (4) |
| | |
FFA + 1O2 → intermediates
| (5) |
| | |
−d[FFA]/dt = k1O2,FFA[1O2]ss[FFA] = kobs,FFA[FFA]
| (6) |
here, [·OH]
ss and [
1O
2]
ss are the steady-state concentrations of ·OH and
1O
2;
kobs,BA and
kobs,FFA are the degradation rates of [BA] and [FFA].
2.2.3 Analytical method. Concentrations were analyzed by HPLC equipped with a photodiode array detector and a Zorbax Eclipse XDB-C18 (2.1 × 150 mm, 5 μm) column. The temperature of the column was set at 35 °C, the injection volume was set at 4 μl, and the velocity of the mobile phase was controlled at 0.2 ml min−1. CA concentrations were detected at a wavelength of 219 nm using 55![[thin space (1/6-em)]](https://www.rsc.org/images/entities/char_2009.gif) :45 methanol–acetonitrile mixed solution (1:1, 0.1% acetic acid) and buffered aqueous solution of KH2PO4 (5 mmol L−1, 0.1% acetic acid) as the mobile phase. BA concentrations were detected at 228 nm using 20:80 acetonitrile and buffered aqueous solution of KH2PO4 (10 mmol L−1) as the mobile phase. FFA concentrations were detected at 219 nm using 50:50 methanol and 0.2% acetic acid aqueous solution as the mobile phase.
:45 methanol–acetonitrile mixed solution (1:1, 0.1% acetic acid) and buffered aqueous solution of KH2PO4 (5 mmol L−1, 0.1% acetic acid) as the mobile phase. BA concentrations were detected at 228 nm using 20:80 acetonitrile and buffered aqueous solution of KH2PO4 (10 mmol L−1) as the mobile phase. FFA concentrations were detected at 219 nm using 50:50 methanol and 0.2% acetic acid aqueous solution as the mobile phase.The intermediate products were investigated through the UPLC-Q-TOF-MS microsystem (Thermo Fisher). Beforehand, the sample was prepared by conducting the photodegradation of CA (5 mg L−1) for 30 min; then, the solution was concentrated ten times in a rotary evaporator (RE-5299, YU HUA INSTR UMENT, China), and the concentrated solution was transferred to a sample vial for detection. The instrument used for sample testing was equipped with a Hypersil GOLD-C18 column (50 × 2.1 mm, 1.9 μm). UPLC method: sample volume: 4 μL; mobile phase: A (0.1% FA water), B (methanol); 0–2 min: 98% A, 2–16 min: 98% A transferred to 5% A, 16–18 min: 5% A, 18.1–20 min: 98% A; flow rate: 0.3 ml min−1. MS method: HIGHFLOW.mstune; sheath gas flow rate: 30; aux gas flow rate: 10; sweep gas flow rate: 0; spray voltage (IKVI): 3.5; capillary temp (°C): 320; aux gas heater temp (°C): 350.
3 Results and discussion
3.1 Effect of different initial concentrations on CA photodegradation
Fig. 1 shows that 67–80% of CA degraded in the samples under simulated sunlight irradiation, whereas the dark control experiment revealed almost no decay of CA, which suggested that the photochemical reaction is an important process in removing CA. Photodegradation of CA at different initial concentrations was consistent with a pseudo-first-order kinetics model, and the photolysis rate could be influenced by the initial concentration. As the initial concentration of CA increased from 1 mg L−1 to 7 mg L−1 at pH of 7(±0.1), the photolysis rate gradually decreased from 0.0532(±0.0027) min−1 to 0.0377(±0.0019) min−1. Correlation analysis showed that the degradation rate constant was negatively correlated (R2 = 0.9987) with ln(C0). This is because the photolysis rate is directly related to the number of photons that can be accepted by CA per unit time. The fewer the photons accepted by CA per unit time, the slower the degradation of CA.
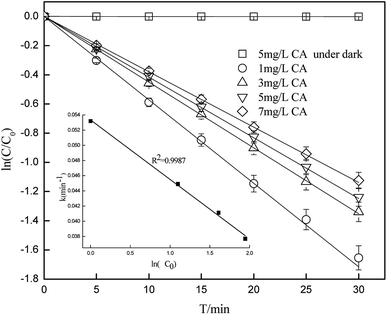 |
| | Fig. 1 Degradation of CA at different initial concentrations (pH = 7(±0.1)). | |
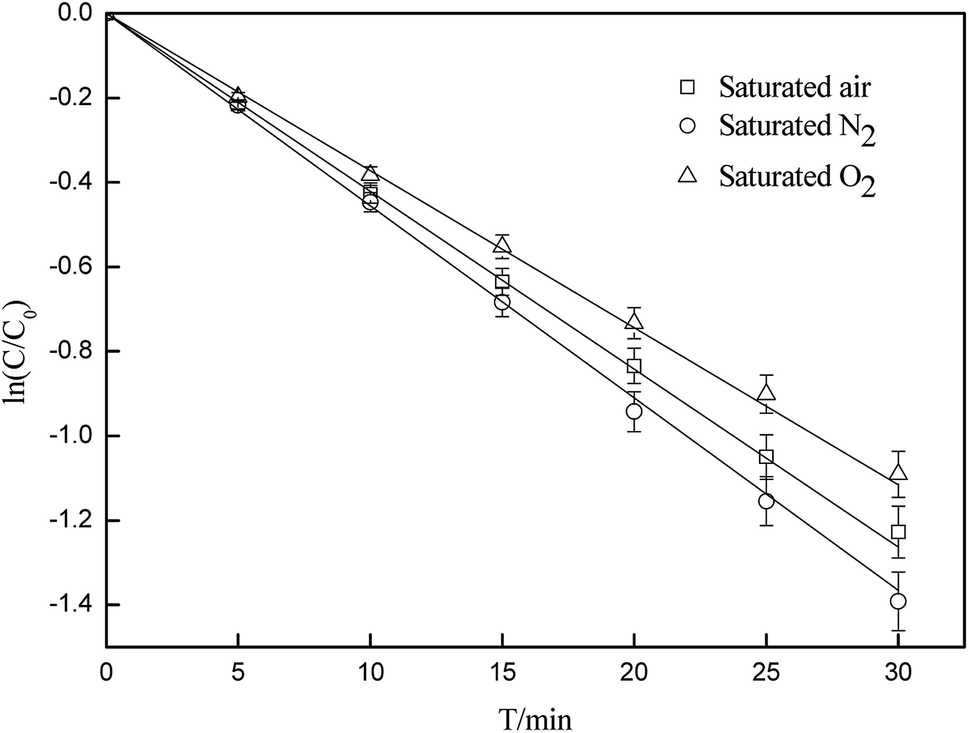
3.2 Effect of dissolved oxygen on CA photodegradation
By using N2 or O2 as a purging gas, experiments were carried out to study the effect of dissolved oxygen on the photodegradation of CA. As illustrated in Fig. 2, the dissolved oxygen inhibited the photodegradation of CA. The rate constants were 0.0431(±0.0022) min−1, 0.0386(±0.0019) min−1 and 0.0411(±0.0021)min−1 in the absence and presence of O2, and under saturated air, respectively. Some research studies have also showed that most photochemical reactions occur at the excited states, whereas dissolved oxygen may quench the excited states via energy/electron transfer, which can lead to the formation of singlet oxygen.49 Quenching of the excited states may restrain the direct photodegradation process, whereas the formation of singlet oxygen can promote the indirect process. Quenching experiments (below) demonstrated that 1O2 can induce the degradation of CA through a self-sensitization process. This indicates that the presence of dissolved oxygen contributed to the inhibition of direct photodegradation of CA more than promotion through a self-sensitization process, and it also showed an overall inhibitory effect on CA photodegradation.
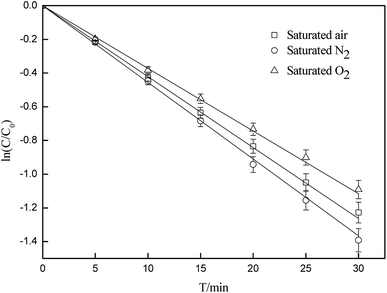 |
| | Fig. 2 Effects of oxygen concentration on the photodegradation of CA (C0 = 5 mg L−1, pH = 7(±0.1)). | |
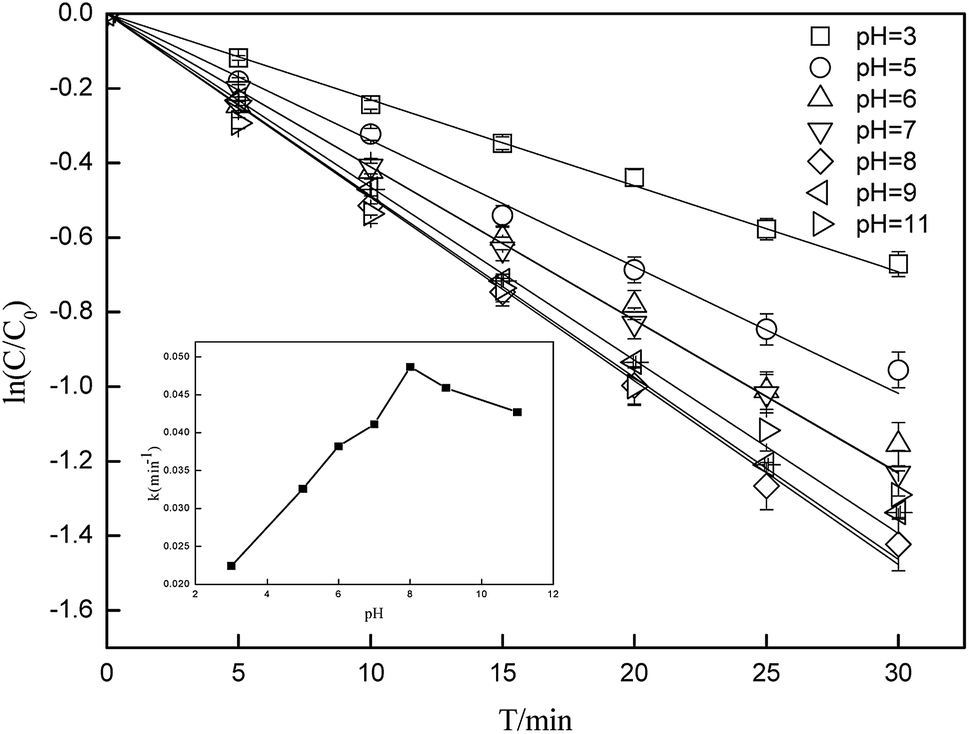
3.3 Effect of different pH conditions on CA photodegradation
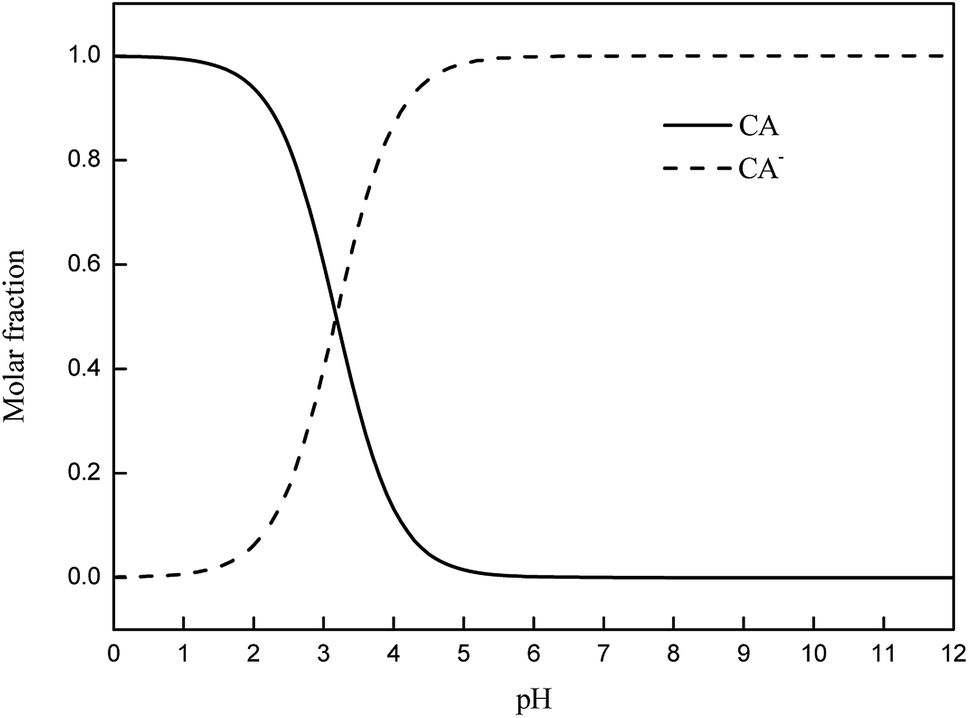
Photolysis can be greatly influenced by pH; thus, specific experiments were also performed to determine the rate constants of CA photolysis at different initial pH values. Fig. 3 shows that the photolysis of 5 mg L−1 CA upon irradiation under simulated sunlight was distinctly dependent on the initial pH. From pH 3.0 to 8.0, the rate constants initially increased from 0.0227(±0.0011) min−1 to 0.0494(±0.0025) min−1 and subsequently decreased slightly from pH 8.0 to 11.0. The considerable difference in the rate constants with varying initial pH might be due to the change in the reaction species of CA. The pKa value of CA was 3.18,50 and its species distribution is shown in Fig. 4. The amount of the molecular form decreased, whereas the amount of the anionic form increased as the pH value increased from 3.0 to 11.0. Comparing k·OH,CA and k1O2,CA at different pH conditions, it was observed that k·OH,CA and k1O2,CA increased gradually as pH increased from 3.0 to 8.0, whereas both decreased at pH = 11.0. Many researchers have also demonstrated that the substrate anion is more reactive than its neutral (or protonated) species because of the high electrical density on the ring system of the substrate anion,51,52 which leads to accelerated degradation of pollutants as pH increases. Thus, the photodegradation of CA accelerates as the amount of the anionic form increases. Additionally, under alkaline conditions (pH 8–11), ·OH might be scavenged by HO− (eqn (7)),32,53 which may impair the oxidization of CA by ·OH; thus, the photodegradation of CA decreased slightly from pH 8.0 to 11.0.| | |
·OH + HO– → O·– + H2O k = 1.2 × 10¹⁰ M−1 s−1
| (7) |
 |
| | Fig. 3 Degradation of CA at different initial pH conditions (C0 = 5 mg L−1). | |
 |
| | Fig. 4 Distribution of dissociation species of CA. | |
3.4 Analysis of the mechanism of CA photodegradation
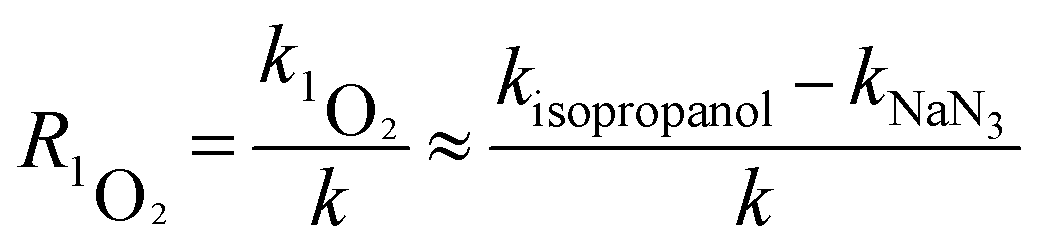
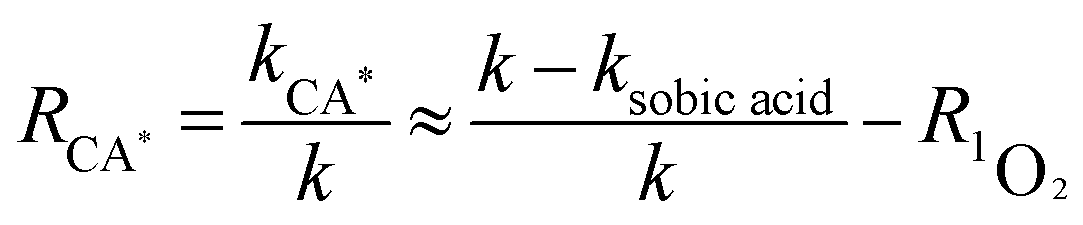
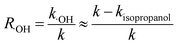
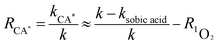
Quenching experiments were used to explore the mechanisms of CA photolysis. Fig. 5 demonstrates that the addition of isopropanol (the ·OH quencher),45,54 NaN3 (the 1O2 and ·OH quencher),45,54,55 and sobic acid (the triplet excited state quencher)54,56 to the reaction solution had clear inhibiting effect on CA photodegradation, which indicated that both ·OH and 1O2 were generated and played roles in CA photodegradation. The photolysis rates of CA with the quenchers were 0.0348(±0.0017) (isopropanol), 0.0273(±0.0014) (NaN3) and 0.0097(±0.0005) (sobic acid) min−1. Based on existing research, we can estimate the contributions of ·OH, 1O2, and the triplet excited state to the overall photodegradation of CA as follows:| |
 | (8) |
| |
 | (9) |
| |
 | (10) |
here, R·OH, R1O2, and RCA* are the contribution rates of photodegradation via ·OH, 1O2, and the triplet excited state of CA, respectively; k·OH, k1O2 and kCA* are the rate constants of photodegradation via ·OH, 1O2, and the triplet excited state of CA, respectively; kisopropanol, kNaN3, and ksobic acid are the rate constants for the addition of isopropanol (100 mM),57 sodium azide (5 mM),58 and sobic acid (0.2 mM) into reaction solutions;59 k is the rate constant of the photodegradation of CA alone.
 |
| | Fig. 5 Effects of isopropanol, NaN3 and sobic acid on the photodegradation of CA (C0 = 5 mg L−1, pH = 7(±0.1)). | |
The calculations showed that ·OH, 1O2, and CA* account for 15.37(±0.77)%, 18.25(±0.91)% and 58.15(±2.91)%, respectively, of the total photodegradation of CA, which means that a self-sensitization process via ·OH and 1O2 existed during photodegradation of CA, whereas direct photolysis was prevalent in pure water. Moreover, to study the sensitivity of the CA reaction with· OH and 1O2, the bimolecular reaction rate constants of CA with ·OH and 1O2 were determined by selecting BA and FFA as probes. As we can see from Table 1, k·OH,CA and k1O2,CA are 3.93(±0.20) × 108 and 2.38(±0.12) × 106 L mol−1 s−1 in pure water; using eqn (6)–(9), the steady-state concentrations of ·OH and 1O2 were calculated to be 4.24(±0.21) × 10−11 and 2.03(±0.1) × 10−11 mol L−1, respectively.
Table 1 The bimolecular rate constants (k·OH,BA and k1O2,CA) for the reaction between CA and ROS in various solutions
| |
Pure water |
pH = 3 |
pH = 5 |
pH = 8 |
pH = 11 |
| k·OH,BA × 10−8 (L mol−1 s−1) |
3.93(±0.20) |
2.49(±0.12) |
3.48(±0.17) |
4.37(±0.22) |
2.83(±0.14) |
| k 1O2,CA × 10−6(L mol−1 s−1) |
2.38(±0.12) |
0.11(±0.01) |
1.90(±0.10) |
3.22(±0.16) |
1.85(±0.09) |
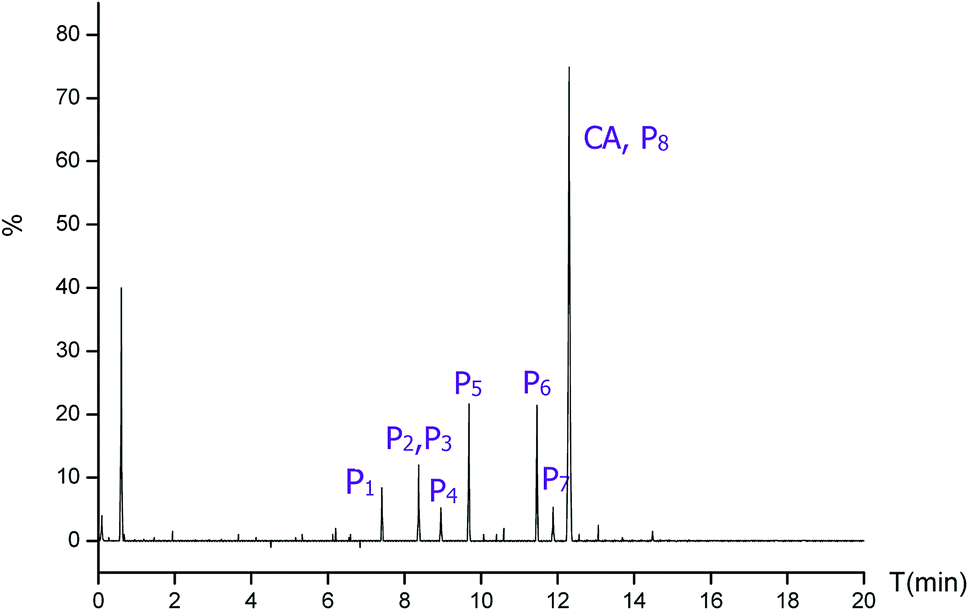
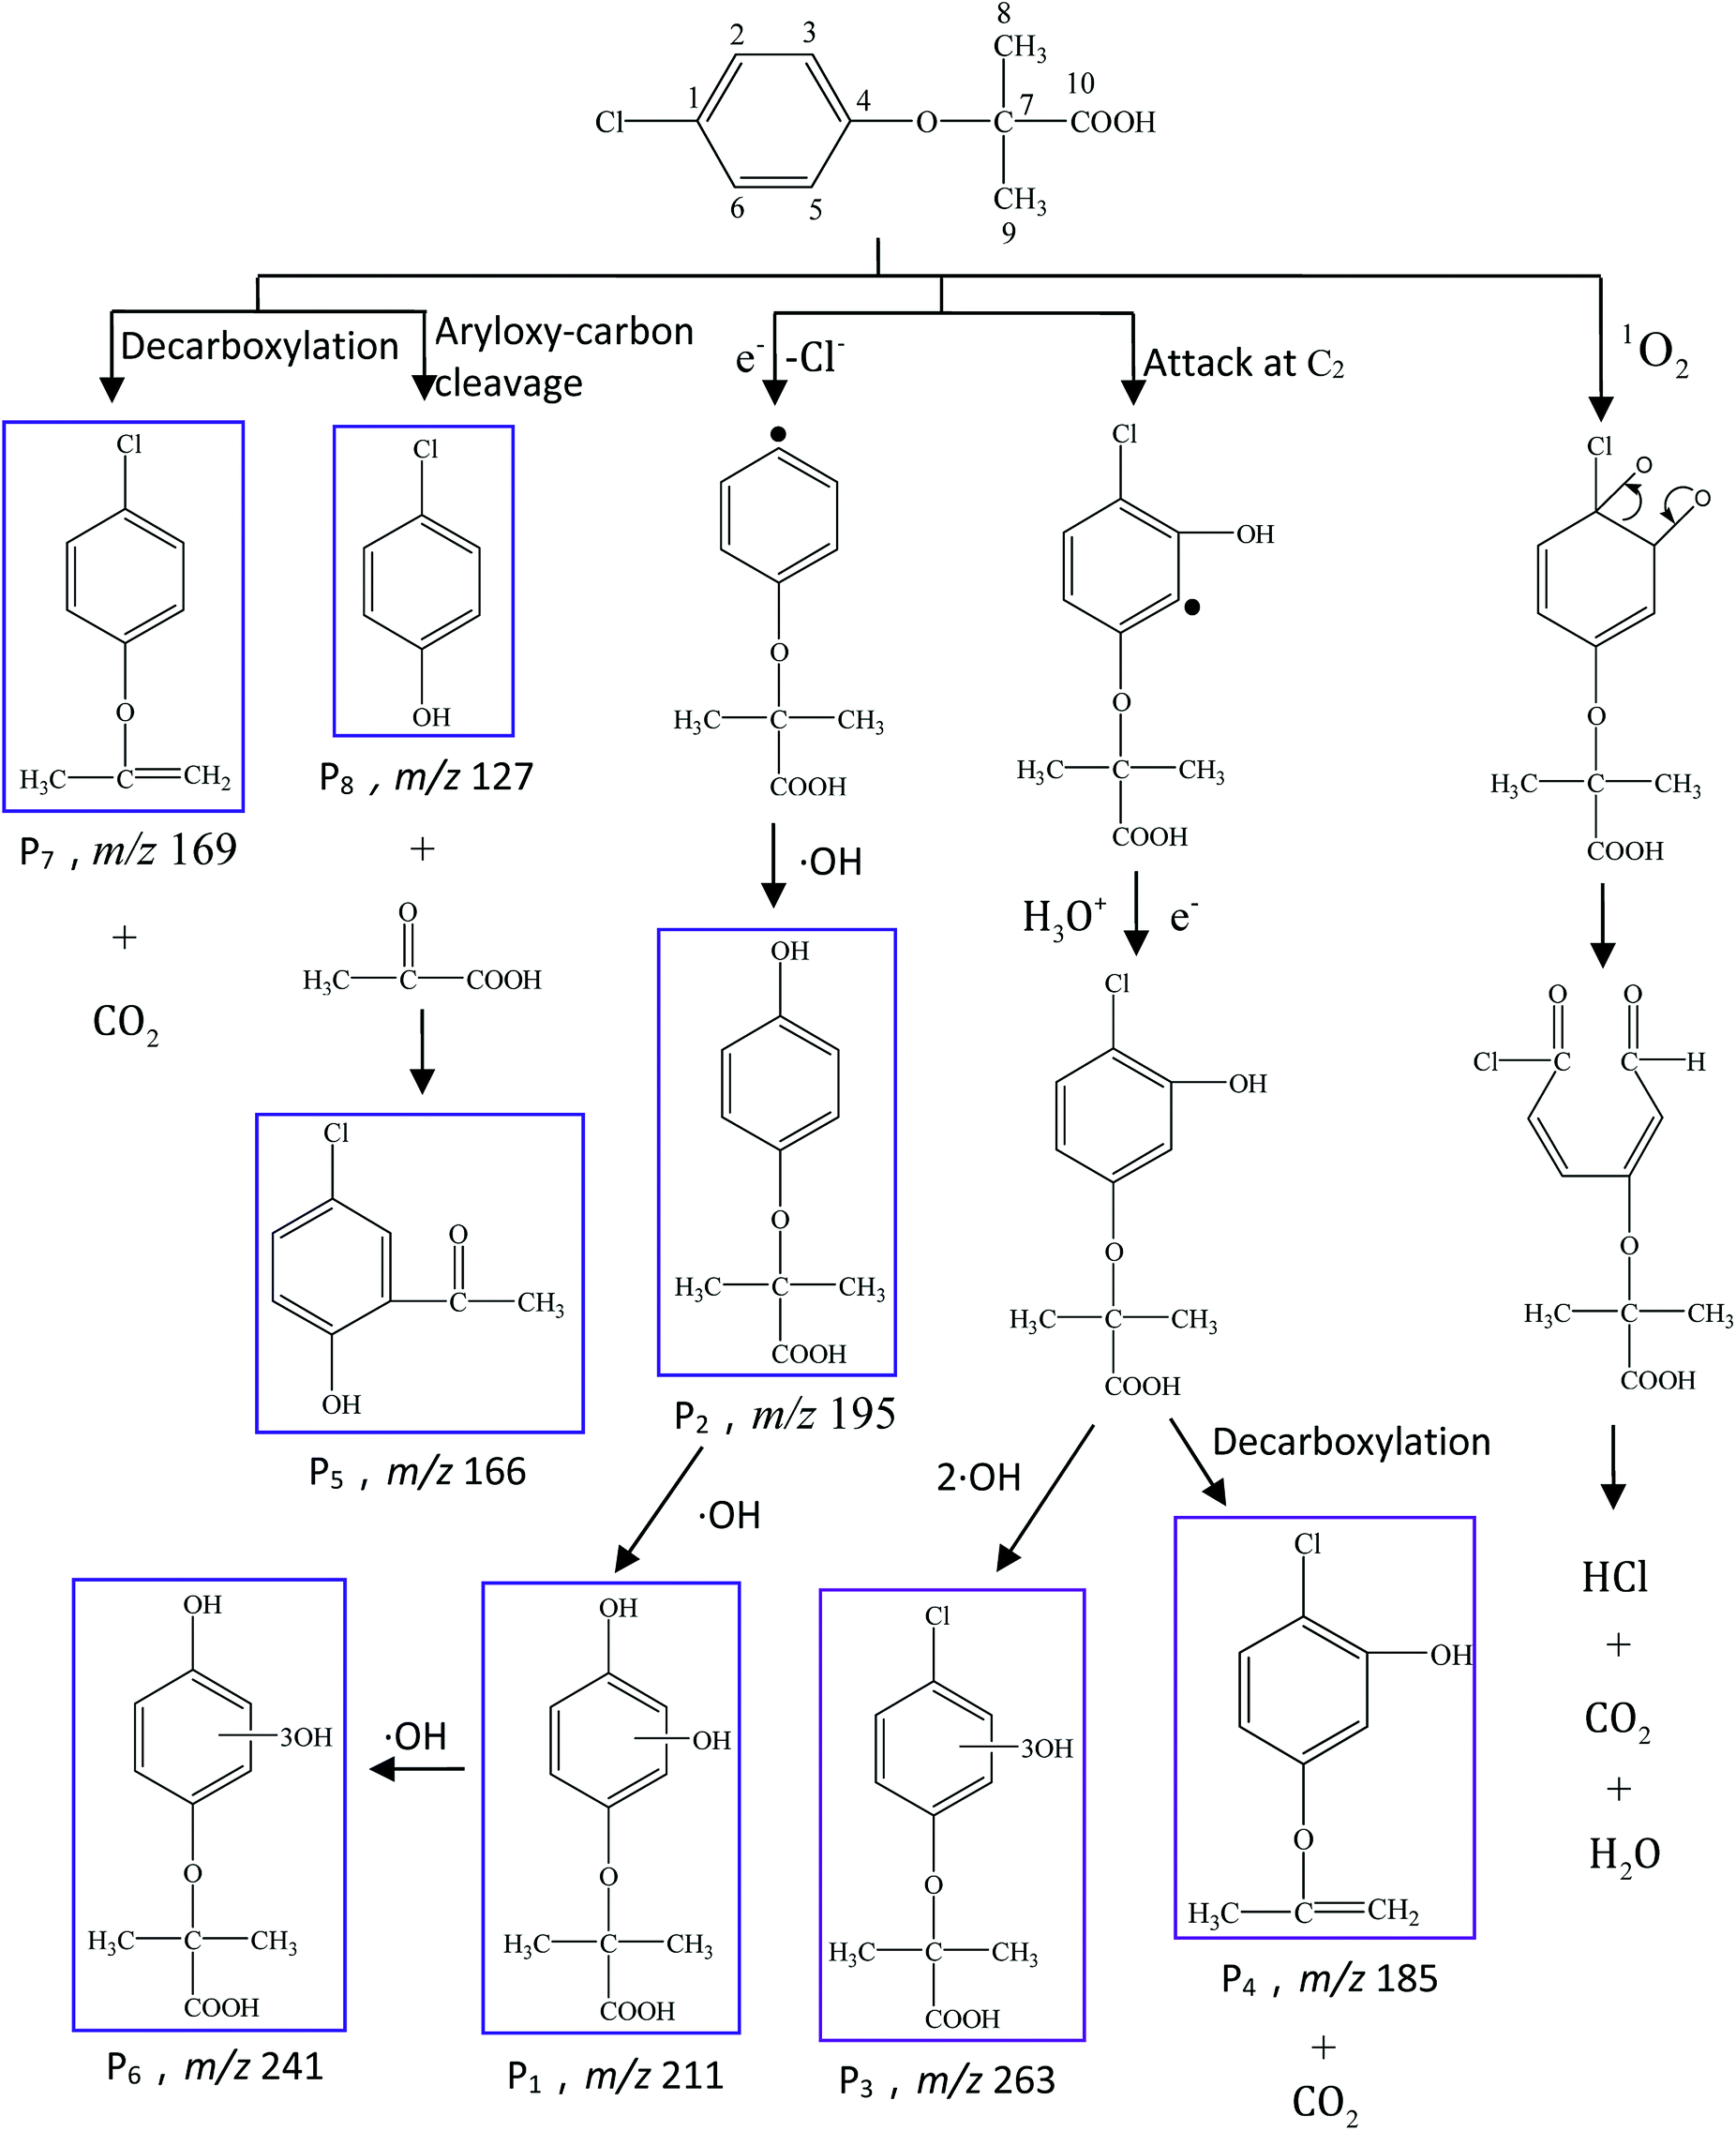
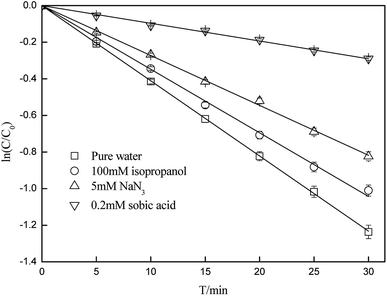
To further elucidate the mechanism of CA photodegradation, the solutions irradiated for 30 min were analyzed by the UPLC-Q-TOF-MS microsystem, and eight main products of CA degradation were detected. The total ion chromatograms are shown in Fig. 6; the fragment chart of the secondary ion mass spectra of P1–P8 is shown in Fig. S2,† and the relevant mass spectrometry information and proposed structure are shown in Table 2. Based on structure identification of the photoproducts, a plausible photodegradation pathway scheme of CA consisting of several steps is proposed in Fig. 7.
 |
| | Fig. 6 The total ion chromatogram of CA photodegradation. | |
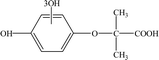
Table 2 Mass spectrometry information and the proposed structure of the photodegradation intermediates of CA
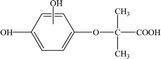
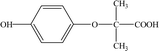
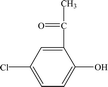
| Intermediates |
Retention time (min) |
m/z |
Predicted formula |
Proposed structure |
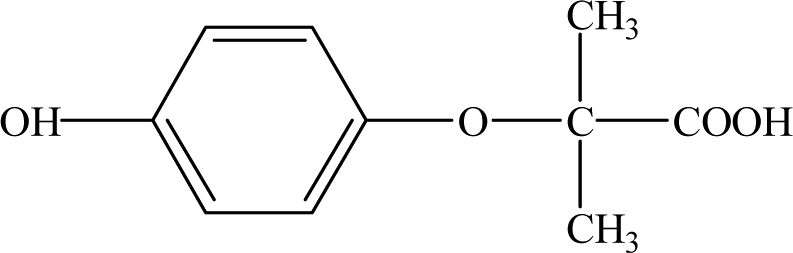
| CA |
12.30 |
213 |
C10H11O3Cl |
 |
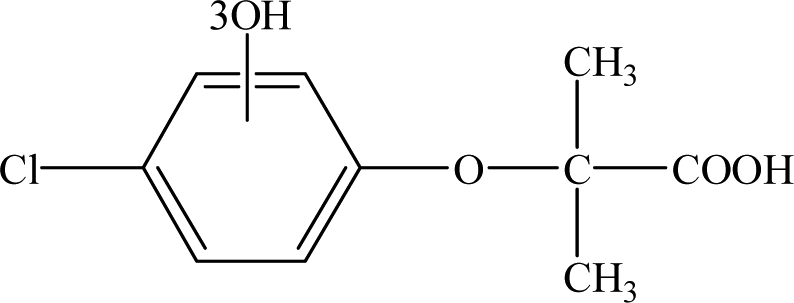
| P1 |
7.41 |
211 |
C10H12O5 |
 |
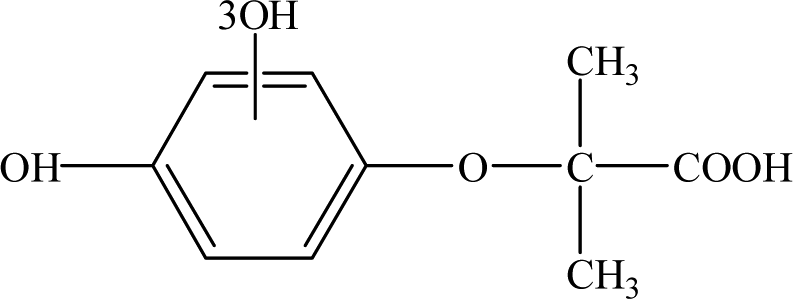
| P2 |
8.37 |
195 |
C10H12O4 |
 |
| P3 |
8.37 |
263 |
C10H11O6Cl |
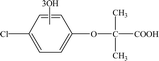 |
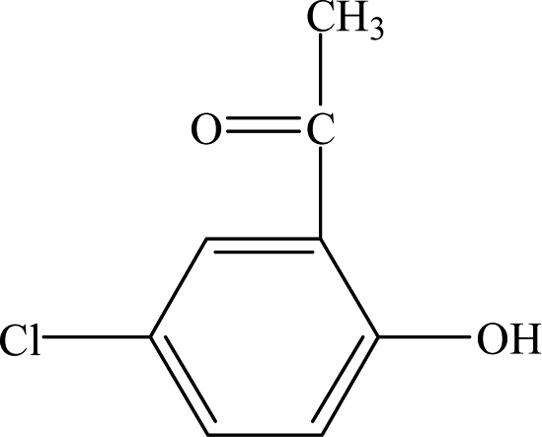
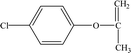
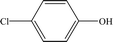
| P4 |
8.96 |
185 |
C9H9O2Cl |
 |
| P5 |
9.68 |
166 |
C8H7O2Cl |
 |
| P6 |
11.47 |
241 |
C10H12O7 |
 |
| P7 |
11.88 |
169 |
C9H9O1Cl |
 |
| P8 |
12.30 |
127 |
C6H5O1Cl |
 |
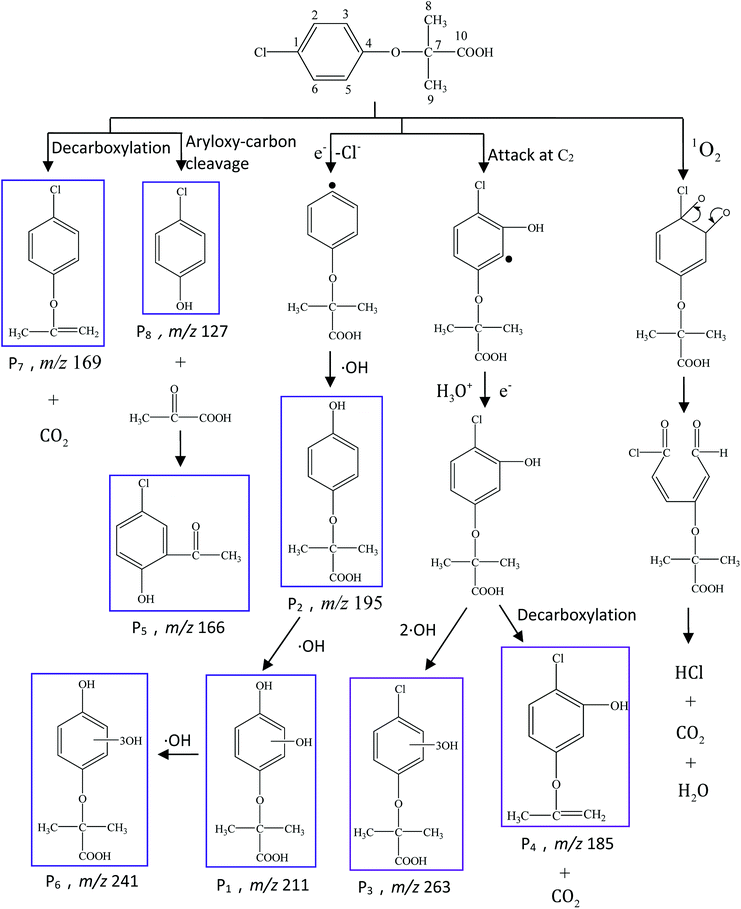 |
| | Fig. 7 Proposed photodegradation pathways of CA under simulated sunlight irradiation in aqueous solution (C0 = 5 mg L−1, pH = 7(±0.1)). | |
It is presumed that Path I is the direct decomposition of CA under simulated sunlight, which produces product P7 through decarboxylation. Path II is due to aryloxy-carbon cleavage, that is, C4–O is broken into methacrylate and 4-chlorophenolate (P8). This route has been reported in the degradation pathways of CA in the UV/chlorine process.60 4-Chlorophenolate has also been detected during the photocatalytic and ozonation degradation of CA.61,62 Simultaneously, coexisting methacrylate and 4-chlorophenolate may react with P5 through acylation reaction. Path III represents dechlorination and subsequent attack by ·OH yielding 2-(4-hydroxyphenoxy)-isobutyric acid (P2). Doll and Frimmel63 proposed the same pathway during their investigation of the catalytic photodegradation products of CA. Continuously, under the action of ·OH, P2 was converted to P1 and then P6. Path IV represents the electrophilic addition of ·OH. ·OH attacks at C2 to form the mono-hydroxylation product 2-(4-chloro-3-hydroxy-phenoxy)-2-methyl-propionic acid, which was not determined in this study and then, the trichloro-hydroxylation product (P3) was formed. Additionally, 2-(4-chloro-3-hydroxy-phenoxy)-2-methyl-propionic acid can change to P4 via decarboxylation. Path V is initiated by 1O2 attack at the aromatic C atom with the 1O2/dioxetane mechanism. Chen62 has proposed this pathway in the photocatalytic degradation of CA by g-C3N4/P25 composites. Due to the endoperoxide cleavage, the aldehyde and acid chloride byproducts can be formed. Similar aldehyde and carboxylic acid formation processes have also been previously observed.64
Both self-sensitization and direct photolysis play significant roles during CA photodegradation under simulated sunlight irradiation, which is consistent with the results of quenching experiments.
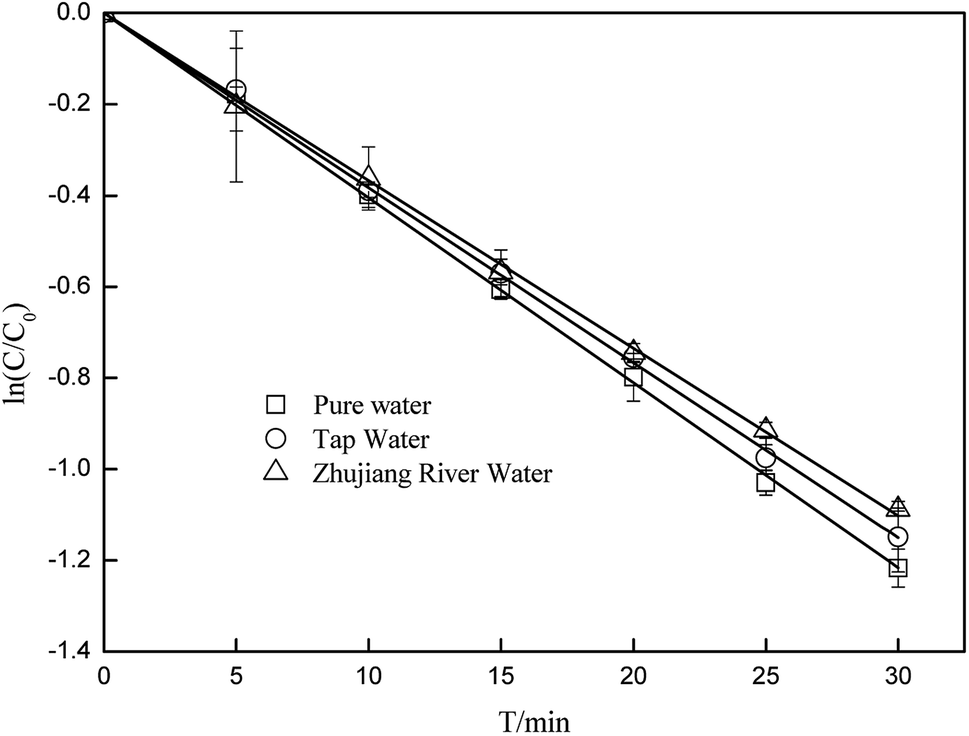
3.5 Effects of water matrices and constituents on the degradation of CA
To better elucidate the photodegradation of CA under simulated sunlight in an aquatic environment, photodegradation of CA in different water matrices was carried out, and the effects of some constituents on the degradation of CA were evaluated. As seen in Fig. 8, the degradation of CA in tap water and Zhujiang River water (primary properties of the two water samples are listed in Table S1†) was inhibited slightly, which may be due to the effects of coexisting constituents. HA and some representative ions were selected; as shown in Fig. 9, even though Fe3+ and Mg2+ can promote CA photodegradation to some extent, NO3−, Cu2+, Zn2+, and HCO3−, especially HA, could significantly inhibit photodegradation. In natural water matrices, high TOC and UV254 may be the main reasons for low CA degradation efficiencies.
 |
| | Fig. 8 The photodegradation of CA in different water matrices (C0 = 5 mg L−1). | |
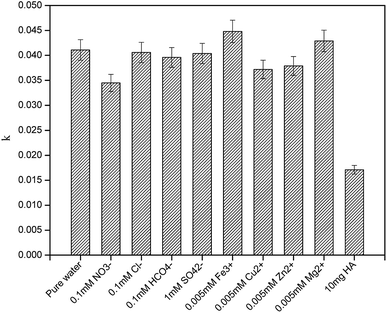 |
| | Fig. 9 Effects of humic acid (HA) and some representative ions on the photodegradation of CA in pure water (C0 = 5 mg L−1, pH = 7(±0.1)). | |
4 Conclusions
The exploration of the mechanism and products of CA photodegradation under simulated sunlight irradiation is of great significance to assess its environmental fate and risks. The results showed that photodegradation of CA follows a pseudo-first-order kinetics model, and the photolysis rate decreased gradually as the initial concentration of CA increased. The presence of dissolved oxygen contributed to the inhibition of direct photodegradation of CA more than the promotion through a self-sensitization process, and it showed an overall inhibitory effect on CA photodegradation. Because the reaction species of CA varied with the change in pH of aqueous solutions, the rate constants of CA photodegradation changed accordingly. Quenching experiments indicated that a self-sensitization process via ·OH and 1O2 existed during the photodegradation of CA, whereas direct photolysis was the main part. The bimolecular reaction rate constants of clofibric acid with ·OH and 1O2 were determined to be 3.93(±0.20) × 108 and 2.38(±0.12) × 106 L mol−1 s−1, respectively. Eight main photoproducts of CA were detected in this study, and they were proposed to be produced from decarboxylation, dechlorination, ·OH addition and 1O2 attack reactions.
Conflicts of interest
There are no conflicts to declare.
Acknowledgements
This work is supported by the National Natural Science Foundation of China (No. 21377031 and 21677040) and the Science and Technology Planning Project of Guangdong Province (No. 2017A050506052). The authors would like to thank all the editors and reviewers for their help in improving this paper.
Notes and references
- N. Zhang, J. M. Li, G. G. Liu, X. L. Chen and K. Jiang, Mar. Pollut. Bull., 2017, 117, 386 CrossRef PubMed.
- Q. Sun, Y. Li, M. Li, M. Ashfaq, M. Lv, H. Wang, A. Hu and C. P. Yu, Chemosphere, 2016, 150, 596 CrossRef PubMed.
- E. N. Evgenidou, I. K. Konstantinou and D. A. Lambropoulou, Sci. Total Environ., 2015, 505, 905 CrossRef PubMed.
- Y. L. Lin and B. K. Li, J. Taiwan Inst. Chem. Eng., 2015, 58, 318–323 CrossRef.
- S. Mohapatra, C. H. Huang, S. Mukherji and L. P. Padhye, Chemosphere, 2016, 159, 526 CrossRef PubMed.
- J. L. Wilkinson, P. S. Hooda, J. Swinden, J. Barker and S. Barton, Environ. Pollut., 2018, 234, 864 CrossRef PubMed.
- M. Queropastor, C. Garridoperez, A. A. Merino and J. M. Q. Alonso, Ozone: Sci. Eng., 2016, 38, 425–433 CrossRef.
- C. G. Daughton and T. A. Ternes, Environ. Health Perspect., 1999, 6(suppl. 107), 907 CrossRef.
- L. Wenzhen, L. Shuguang, C. Nuo, G. Xiaogang, Q. Zhaofu, F. Ji and L. Kuangfei, Water Sci. Technol., 2009, 60, 2983–2989 CrossRef PubMed.
- T. A. Ternes, Water Res., 1998, 32, 3245–3260 CrossRef.
- S. Zorita, L. Mårtensson and L. Mathiasson, Sci. Total Environ., 2009, 407, 2760–2770 CrossRef PubMed.
- C. Zwiener and F. H. Frimmel, Sci. Total Environ., 2003, 309, 201–211 CrossRef PubMed.
- W. Li, G. G. Ying, J. L. Zhao, X. B. Yang, C. Feng, T. Ran, L. Shan and L. J. Zhou, Sci. Total Environ., 2010, 408, 3139 CrossRef PubMed.
- K. Reddersen, T. Heberer and U. Dünnbier, Chemosphere, 2002, 49, 539–544 CrossRef PubMed.
- T. J. Runnalls, D. N. Hala and J. P. Sumpter, Aquat. Toxicol., 2007, 84, 111 CrossRef PubMed.
- E. Lee, H. K. Shon and J. Cho, J. Hazard. Mater., 2014, 276, 1–9 CrossRef PubMed.
- K. Sornalingam, A. Mcdonagh and J. L. Zhou, Sci. Total Environ., 2016, 550, 209 CrossRef PubMed.
- W. Huang, C. Jing, X. Zhang, M. Tang, L. Tang, M. Wu and N. Liu, Chem. Eng. J., 2018, 349, 603–612 CrossRef.
- N. Liu, W. Huang, X. Zhang, L. Tang, L. Wang, Y. Wang and M. Wu, Appl. Catal., B, 2017, 221, 119–128 CrossRef.
- W. Huang, N. Liu, X. Zhang, M. Wu and L. Tang, Appl. Surf. Sci., 2017, 425, 107–116 CrossRef.
- R. Nassar, A. Trivella, S. Mokh, M. Al-Iskandarani, H. Budzinski and P. Mazellier, J. Photochem. Photobiol., A, 2016, 336, 176–182 CrossRef.
- Y. Li, Y. Pan, L. Lian, S. Yan, W. Song and Y. Xin, Water Res., 2017, 109, 266–273 CrossRef PubMed.
- D. Ma, G. Liu, W. Lv, K. Yao, X. Zhang and H. Xiao, Environ. Sci. Pollut. Res., 2014, 21, 7797–7804 CrossRef PubMed.
- N. Agrawal, R. S. Ray, M. Farooq, A. B. Pant and R. K. Hans, Photochem. Photobiol., 2007, 83, 1226–1236 CrossRef PubMed.
- Y. Chen, C. Hu, J. Qu and M. Yang, J. Photochem. Photobiol., A, 2008, 197, 81–87 CrossRef.
- D. Ren, B. Huang, D. Xiong, H. He, X. Meng and X. Pan, J. Environ. Sci., 2016, 54, 196–205 CrossRef PubMed.
- D. Ren, B. Huang, D. Xiong, H. He, X. Meng and X. Pan, J. Environ. Sci., 2017, 54, 196–205 CrossRef PubMed.
- S. S. Sable, P. P. Ghute, P. Álvarez, F. J. Beltrán, F. Medina and S. Contreras, Catal. Today, 2015, 240, 46–54 CrossRef.
- H. Lin, J. Wu and H. Zhang, Chem. Eng. J., 2014, 244, 514–521 CrossRef.
- S. S. Sable, F. Medina and S. Contreras, Appl. Catal., B, 2014, 150–151(suppl.), 30–36 CrossRef.
- X. Kong, Z. Wu, Z. Ren, K. Guo, S. Hou, Z. Hua, X. Li and J. Fang, Water Res., 2018, 137, 242–250 CrossRef PubMed.
- X. Lu, Y. Shao, N. Gao, J. Chen, H. Deng, W. Chu, N. An and F. Peng, Chem. Eng. J., 2017, 331, 364–371 CrossRef.
- C. M. Dai, J. Zhang, Y. L. Zhang, X. F. Zhou, Y. P. Duan and S. G. Liu, Environ. Sci. Pollut. Res., 2013, 20, 5492 CrossRef PubMed.
- Y. L. Zhang, Y. J. Liu, C. M. Dai, X. F. Zhou and S. G. Liu, Water, Air, Soil Pollut., 2014, 225, 2064 CrossRef.
- Z. Hasan, E. J. Choi and S. H. Jhung, Chem. Eng. J., 2013, 219, 537–544 CrossRef.
- A. S. Mestre, A. Nabiço, P. L. Figueiredo, M. L. Pinto, M. S. C. S. Santos and I. M. Fonseca, Chem. Eng. J., 2016, 286, 538–548 CrossRef.
- A. Gil, N. Taoufik, A. M. García and S. A. Korili, Environ. Technol., 2018, 1–40 CrossRef PubMed.
- S. Li, Y. Tang, W. Chen, H. Zhe, X. Li and L. Li, J. Colloid Interface Sci., 2017, 504, 238 CrossRef PubMed.
- S. S. Sable, P. P. Ghute, D. Fakhrnasova, R. B. Mane, C. V. Rode, F. Medina and S. Contreras, Appl. Catal., B, 2017, 209, 523–529 CrossRef.
- H. Lin, X. Zhong, C. Ciotonea, X. Fan, X. Mao, Y. Li, B. Deng, H. Zhang and S. Royer, Appl. Catal., B, 2018, 230, 1–10 CrossRef.
- Y. Gao, G. Yu, K. Liu, S. Deng, B. Wang, J. Huang and Y. Wang, Chem. Eng. J., 2017, 330, 157–165 CrossRef.
- Y. Gao, N. Gao, W. Chu, Q. Yang and D. Yin, RSC Adv., 2017, 7, 33627–33634 RSC.
- Y. Zhu, M. Wu, N. Gao, W. Chu, K. Li and S. Chen, Chem. Eng. J., 2018, 335, 520–529 CrossRef.
- J. L. Packer, J. J. Werner, D. E. Latch, K. Mcneill and W. A. Arnold, Aquat. Sci., 2003, 65, 342–351 CrossRef.
- Y. Ji, L. Zhou, Y. Zhang, C. Ferronato, M. Brigante, G. Mailhot, X. Yang and J. M. Chovelon, Water Res., 2013, 47, 5865–5875 CrossRef PubMed.
- D. E. Latch, B. L. Stender, J. L. Packer, W. A. Arnold and K. Mcneill, Environ. Sci. Technol., 2003, 37, 3342–3350 CrossRef PubMed.
- Y. H. Guan, J. Ma, X. C. Li, J. Y. Fang and L. W. Chen, Environ. Sci. Technol., 2011, 45, 9308 CrossRef PubMed.
- A. L. Boreen, W. A. Arnold and K. Mcneill, Environ. Sci. Technol., 2005, 39, 3630–3638 CrossRef PubMed.
- W. Xue, J. Chen and Q. Xie, J. Hazard. Mater., 2016, 307, 344 CrossRef PubMed.
- W. Z. Li, S. G. Lu, N. Chen, X. G. Gu, Z. F. Qiu, F. Ji and K. F. Lin, Water Sci. Technol., 2009, 60, 2983 CrossRef PubMed.
- Z. Chen, G. Cao and Q. Song, Environ. Chem. Lett., 2010, 8, 33–37 CrossRef.
- L. Mao, C. Meng, C. Zeng, Y. Ji, X. Yang and S. Gao, Sci. Total Environ., 2011, 409, 5376–5381 CrossRef PubMed.
- G. V. Buxton, C. L. Greenstock, W. P. Helman and A. B. Ross, J. Phys. Chem. Ref. Data, 2009, 17, 513–886 CrossRef.
- C. Liang, H. Zhao, M. Deng, X. Quan, S. Chen and H. Wang, J. Environ. Sci., 2015, 27, 115 CrossRef PubMed.
- G. Miolo, G. Viola, D. Vedaldi, F. Dall'Acqua, A. Fravolini, O. Tabarrini and V. Cecchetti, Toxicol In Vitro, 2002, 16, 683–693 CrossRef PubMed.
- A. C. Velosa, W. J. Baader, C. V. Stevani, C. M. Mano and E. J. Bechara, Chem. Res. Toxicol., 2007, 20, 1162–1169 Search PubMed.
- P. Chen, W. Lv, Z. Chen, J. Ma, R. Li, K. Yao, G. Liu and F. Li, Environ. Sci. Pollut. Res. Int., 2015, 22, 12585–12596 CrossRef PubMed.
- P. Chen, F. L. Wang, K. Yao, J. S. Ma, F. H. Li, W. Y. Lv and G. G. Liu, Bull. Environ. Contam. Toxicol., 2016, 96, 203–209 CrossRef PubMed.
- J. Ma, W. Lv, C. Ping, Y. Lu, F. Wang, F. Li, K. Yao and G. Liu, Environ. Sci. Pollut. Res., 2016, 23, 14294–14306 CrossRef PubMed.
- Y. Tang, X. Shi, Y. Liu, L. Feng and L. Zhang, R. Soc. Open Sci., 2018, 5, 171372 CrossRef PubMed.
- R. Rosal, M. S. Gonzalo, K. Boltes, P. Letón, J. J. Vaquero and E. Garcíacalvo, J. Hazard. Mater., 2009, 172, 1061–1068 CrossRef PubMed.
- P. Chen, F. Wang, Q. Zhang, Y. Su, L. Shen, K. Yao, Z. F. Chen, Y. Liu, Z. Cai and W. Lv, Chemosphere, 2017, 172, 193 CrossRef PubMed.
- T. E. Doll and F. H. Frimmel, Water Res., 2004, 38, 955–964 CrossRef PubMed.
- R. Rosal, M. S. Gonzalo, K. Boltes, P. Letón, J. J. Vaquero and E. García-Calvo, J. Hazard. Mater., 2009, 172, 1061–1068 CrossRef PubMed.
Footnote |
| † Electronic supplementary information (ESI) available. See DOI: 10.1039/c8ra03140a |
|
| This journal is © The Royal Society of Chemistry 2018 |
Click here to see how this site uses Cookies. View our privacy policy here. 
 Open Access Article
 This Open Access Article is licensed under a Creative Commons Attribution-Non Commercial 3.0 Unported Licence
 *a,
Zongchao Liua,
Qingqing Kongb,
Guoguang Liu
*a,
Zongchao Liua,
Qingqing Kongb,
Guoguang Liu