DOI:
10.1039/C8RA02993H
(Paper)
RSC Adv., 2018,
8, 18531-18541
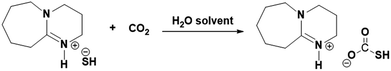
Hydrogen sulfide gas capture by organic superbase 1,8-diazabicyclo-[5.4.0]-undec-7-ene through salt formation: salt synthesis, characterization and application for CO2 capture†
Received
7th April 2018
, Accepted 14th May 2018
First published on 22nd May 2018
Abstract
Hydrogen sulfide (H2S) is a toxic and environment polluting gas like other acid gases and hence its capture and sequestration is equally important before release into the atmosphere. In this regard, solvent-based processes involving aqueous tertiary amine systems were extensively studied and used. Herein, in line with an analogous pathway, we report capture of H2S gas in the form of its salt with an organic superbase such as 1,8-diazabicyclo-[5.4.0]-undec-7-ene (DBU) and the obtained salt was thoroughly studied. Spectroscopic analyses such as NMR and FTIR analyses confirmed that the H2S molecule formed an ionic solid adduct with DBU through protonation of its sp2-hybridized N atom. The stability of formed [DBUH][SH] salt in aqueous solution as well as under thermal treatment was also studied and monitored by NMR and thermogravimetric analysis (TGA), respectively. In aqueous medium, compared to DBU, the [DBUH][SH] salt exhibited long term stability without decomposition whereas under thermal treatment both DBU and its salt with H2S turned out to be thermally unstable where salt showed a volatile nature like a sublimized solid. Dissolution feasibility of [DBUH][SH] salt was also compared with DBU in polar as well as non-polar solvents and even though the [DBUH][SH] salt had an ionic nature, like DBU, it was also found soluble in various polar and non-polar solvents. Considering the stability of [DBUH][SH] salt in aqueous medium, its aqueous solution was further explored as a solvent media for CO2 capture where the influence of process parameters such as the influence of concentration of water in the solvent and CO2 flow rate was studied. Most importantly, here we demonstrated the synthesis of [DBUH][SH] salt for easy capture of H2S gas following reaction with DBU under ambient reaction conditions.
1. Introduction
Hydrogen sulfide (H2S) gas is considered as a highly toxic or intense nerve gas, usually introduced into the ecosystem from both natural sources as well as various industrial processes. The natural sources such as crude petroleum, natural gas, volcanic gases and hot springs generate substantial amounts of H2S.1 On the other hand, industrial processes such as coal gasification, natural gas development, sewage treatment, waste composting, kraft pulp mills, tanneries and petroleum refineries etc. also emit considerable amounts of H2S.2 However, considering the environmental regulations, from industrial resources the emissions of H2S are only allowed to be released into the atmosphere if a gas stream contains a H2S gas concentration below 10 ppm.3 Hence, several efforts have been made to avoid the emission of H2S into the atmosphere upon which the conversion of H2S to non-corrosive, non-poisonous compounds is heavily implemented. The traditional Claus process and utilization of aqueous solutions of chlorine, alum, ammonia, alkanolamines, amine (trialkyltriazene) etc. have been extensively used and related processes are well studied.2,4a–f Amongst used solvent systems, the Claus process (conversion of H2S to elemental sulphur) and processes based on aqueous alkanolamines such as diethanolamine (DEA), monoethanolamine (MEA), methyldiethanolamine (MDEA) have been commercialized. Apart from solvent based processes, solid adsorbents such as metal oxides, metals, metal–organic frameworks, zeolites, carbon-based materials etc. have also been successfully applied for H2S absorption.2,5
The purification of natural gas or natural gas sweetening is a very well attended industrial process. One of the limitations of this process is that it is difficult to separate H2S from carbon dioxide (CO2) as natural gas comprised with high concentration of CO2 in the composition compared to H2S i.e. high CO2/H2S mole ratio.6 Hence, alkanolamine based solvents especially having primary and secondary nitrogen atom in their structure are not suitable for separation considering their chemical interaction with both CO2 and H2S. On the other hand, tertiary amines were successfully used for efficient separation of these gases in natural gas sweetening process. Thanks to different active sites present on H2S and CO2 molecules where CO2 molecule is inactive towards tertiary amine in the absence of water while H2S gas can instantaneously react with tertiary amines through proton transfer process (eqn (1)).7 As shown in eqn (2), aqueous solution of tertiary amines hydrates CO2 molecule and form bicarbonates via a base catalyzed mechanism. In a real case study, H2O molecule gets activated by the amine through strong hydrogen bonding which further reacts with CO2 and form bicarbonates.8a,b Considering this chemo-selective approach of tertiary amines towards H2S, the MDEA has widely used as a solvent medium for H2S chemisorption.
| |
 | (1) |
| |
 | (2) |
Considering the applicability of tertiary amines in the H2S sequestration process, another tertiary amine containing strong organic Brønsted bases such as superbases can be used in this regard. Phosphazenes, amidines and guanidines are usually considered as organic superbases that can activate H2S gas via hydrogen transfer or quaternization processes. 1,8-Diazabicyclo-[5.4.0]-undec-7-ene (DBU) is commonly used, non-nucleophilic amidine superbase for several elimination reactions in organic synthesis that occur at ambient reaction conditions.9,10 Apart from it, DBU was also used for the synthesis of various types of task specific ionic liquids (ILs) where ILs composed of DBU cation and different anions. The new type of protic ILs were synthesized by neutralization reaction between DBU and carboxylic acids, including acetic, lactic, propionic or trifluoroacetic acid and used as catalysts and promotors in base catalyzed Michel condensations.11,12 An important and intensively studied application of the DBU molecule was the sequestration of CO2 and SO2 gas by synthesizing new class of ILs i.e. switchable ionic liquids (SILs) composed of thermally reversible DBU alkyl carbonates. SILs were synthesized by reacting CO2 or SO2 gas at room temperature with the mixture of DBU and various alcohols, including 1-propanol, 1-butanol, 1-hexanol, 1-octanol, glycerol, monoethanol amine etc.13a–c Our research group also successfully synthesized SILs based on DBU and various alcohols such as monoethanolamine, 1-hexanol and glycerol with CO2 and SO2 gases and simultaneously applied those in selective fractionations of lignocellulosic biomass.14a–e Considering the activity of DBU molecule to abstract proton, it was also previously demonstrated that DBU-H2S ionic adduct forms either via direct interaction between molecular DBU with H2S gas or as a by-product after interactions of amidine superbases with carbon disulphide (CS2).15a,b However, a detailed study is still lacking with regard to the composition of the DBU-H2S adduct, its thermal stability as well as its stability in aqueous medium. In this report, we studied these topics in detail after synthesis of ionic adduct between DBU superbase and H2S gas and as a preliminary application, the aqueous solution of this ionic solid was further explored in CO2 gas capture.
2. Experimental methods
2.1. Chemicals
1,8-Diazabicyclo-[5.4.0]-undec-7-ene (DBU, ≥99.0%, GC analysis) was purchased from Sigma-Aldrich and used without further purification. H2S and CO2 gas bottles was obtained from AGA AB (Linde Group) and used after confirming precautionary measures in the laboratory. Deionized water was used during experiments when needed. For NMR analysis, the deuterated solutions such as D2O (99.9 atom% D), d6-DMSO (anhydrous, 99.9 atom% D) and d3-CDCl3 (99.8 atom% D) were used as internal standards as per requirements in 1H and 13C NMR as well as 2D NMR analysis.
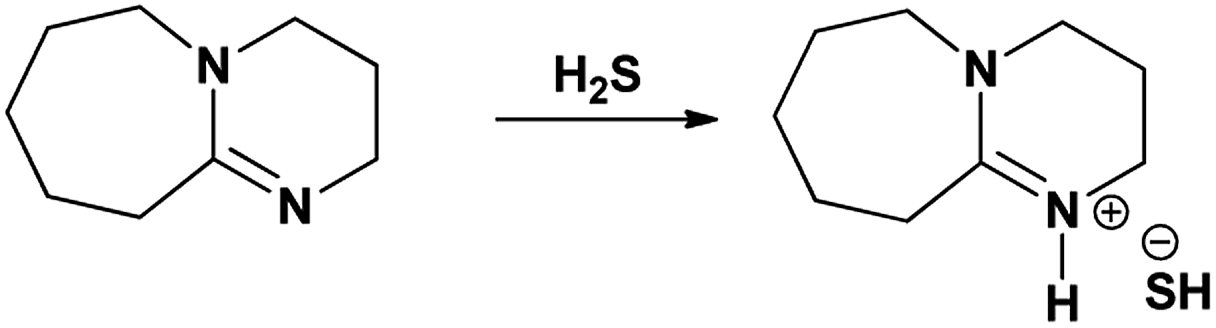
2.2. H2S absorption in organic superbases
The H2S absorption in organic superbases experiments were carried out in three necked round bottom flask (Fig. 1).
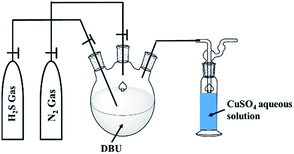 |
| | Fig. 1 Schematic diagram for experimental setup for H2S absorption in DBU superbase. | |
A H2S gas was bubbled through DBU under inert conditions (with N2 gas flow) with continuous stirring, at ambient reaction conditions. The flow of H2S gas was commenced until the liquid turned to a solid. The obtained solids further analyzed by means of 1H and 13C NMR analysis with d6-DMSO as an internal standard. Here onwards the solid product formed after interaction between DBU and H2S will be referred as a ‘solid [DBU-H2S] adduct’.
2.3. Thermal stability of solid [DBU-H2S] adduct
The thermal stability of the DBU and solid [DBU-H2S] adduct formed after bubbling of H2S in DBU was measured by thermal gravimetric analysis (TGA) method on TGA thermogravimetric analyzer (Mettler Toledo). Both isothermal and non-isothermal temperature programs were used to examine the thermal stability of product. In non-isothermal TGA analysis, the temperature was steadily increased from room temperature to 900 °C with 5 °C min−1 rate. The isothermal TGA analysis was performed with three temperature programs such as (a) from room temperature to 60 °C (5 °C min−1) and maintained for 2 h, (b) then from 60 °C to 70 °C (5 °C min−1) and maintained for 1 h and finally (c) from 70 °C to 900 °C (5 °C min−1). The obtained results were compared with each other to understand the thermal stability of the DBU and solid [DBU-H2S] adduct.
2.4. Polarity analysis with solvatochromic dye
The solvatochromic dye such as Reichardt's dye was used to examine the difference in the polarity of the DBU and solid [DBU-H2S] adduct in acetonitrile solution. 0.3 g of DBU and 0.3 g of product were dissolved separately in 5 ml of acetonitrile and 2 drops of methanolic solution of Reichardt's dye was added. The color of acetonitrile solution of DBU and solid [DBU-H2S] adduct after and before addition of dye were notified and further compared with each other to understand polarities.
2.5. Influence of aqueous medium on stability of solid [DBU-H2S] adduct
The stability of the solid [DBU-H2S] adduct in aqueous medium was confirmed by 1H and 13C NMR analysis of solution of solid [DBU-H2S] adduct in d6-DMSO and D2O. In actual experiments, initially the NMR analysis was carried out in d6-DMSO solvent and purity of the solid [DBU-H2S] adduct was confirmed. After that fresh D2O was added regularly four times in same NMR analysis tube and the addition was maintained as 100, 100, 200 and 200 mg one after another. After each and every addition, the NMR analysis was carried out. As a control experiment, the NMR analysis of both DBU and solid [DBU-H2S] adduct was also performed with pure D2O solvent. Initially, both DBU and solid [DBU-H2S] adduct were analyzed in D2O solvent. To understand the long-term stability of the DBU and solid [DBU-H2S] adduct, the NMR analysis was further repeated after keeping same NMR tubes overnight at room temperature and at static conditions. The obtained NMR spectrums were compared with each other to examine the influence of aqueous medium on stability of solid [DBU-H2S] adduct.
2.6. CO2 absorption in aqueous solid [DBU-H2S] adduct solutions
The response of the aqueous solutions of the solid DBU-H2S adduct towards CO2 gas was studied. A required amount of solid product was mixed in deionized water and mechanically shaken until a clear solution was forming where the amount of water was varied between 5–21 wt%. A CO2 gas stream (15 ml min−1) was bubbled into the solution using an immersed needle while it was stirred mechanically at room temperature and atmospheric CO2 pressure. Similarly, to understand the influence of CO2 gas flow rate on CO2 absorption profile, experiments also performed with different gas flow rates (from 5 to 25 ml min−1) and where gas was bubbled through the aqueous solution of solid DBU-H2S adduct comprised with 14 wt% water. The CO2 uptake was determined by weighing reaction mixture with immersed needle in the vial at regular intervals using an analytical balance with an accuracy of ±0.1 mg until it was supposed to achieve the full of CO2 absorption capacity. The obtained material analyzed by 1H and 13C NMR analysis with d3-CDCl3 as an internal standard.
3. Result and discussion
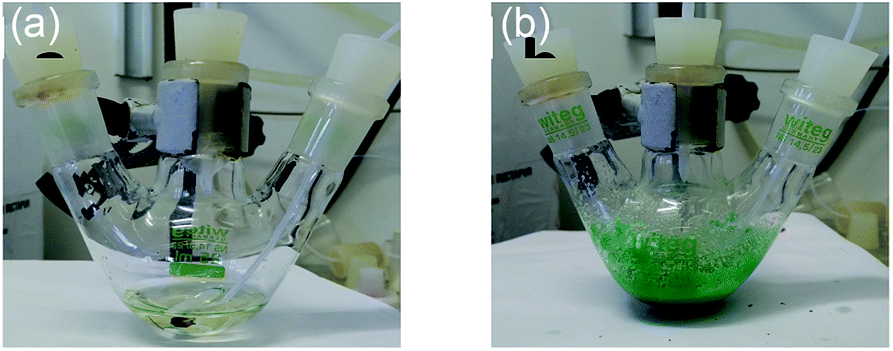
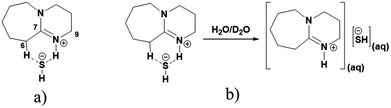
Solid [DBU-H2S] adduct was obtained after slow bubbling of H2S gas through the DBU liquid. Initially, the interaction of the H2S gas with DBU molecule was highly spontaneous that the colorless DBU was immediately transferred to green-blue colored solution. This process was found to be exothermic and, as bubbling progresses, the green colored solid material was slowly separated from the reaction mixture. Further exposure of the solid–liquid mixture with more H2S gas results in the formation of green dry solid material (Fig. 2). The change in the physical nature as well as color compared to the DBU, confirms the formation solid [DBU-H2S] adduct after interaction between DBU and H2S gas.
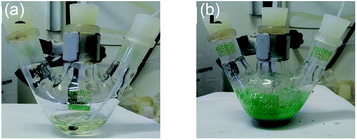 |
| | Fig. 2 (a) DBU and, (b) solid [DBU-H2S] adduct. | |
3.1. Characterization of solid [DBU-H2S] adduct
The formation of solid [DBU-H2S] adduct was confirmed by NMR and FTIR analysis. Also, the solubility of the solid addict in various solvents was also examined.
3.1.1. 1H and 13C NMR spectroscopy. The 1H and 13C NMR analysis of DBU and solid [DBU-H2S] adduct were performed and observed changes in the chemical shifts in the spectra were accounted for the structural conformation of ionic nature of solid [DBU-H2S] adduct based on reaction Scheme 1. 1H and 13C NMR spectra of DBU and solid [DBU-H2S] adduct are shown in Fig. 3 and 4, respectively, while related chemical shifts are summarized in Tables S1 and S2,† respectively. The assignment for numbering of atoms of DBU molecule is shown in Fig. 5.
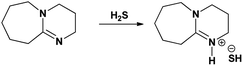 |
| | Scheme 1 Proposed mechanism for synthesis of solid [DBU-H2S] adduct or ionic solid from DBU and H2S gas interaction. | |
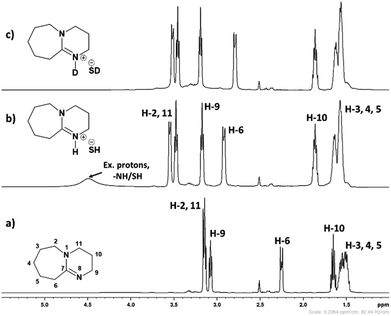 |
| | Fig. 3 The 1H spectra of (a) DBU, (b) solid [DBU-H2S] adduct and (c) solid [DBU-H2S] adduct after addition of D2O (2 drops) in DMSO-d6 as an internal standard solvent. | |
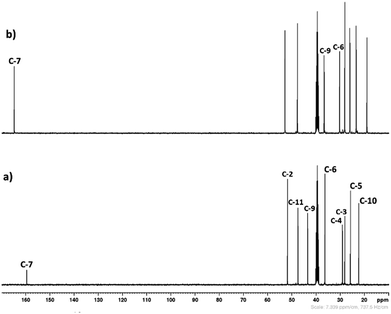 |
| | Fig. 4 The 13C spectra of (a) DBU and (b) solid [DBU-H2S] adduct in DMSO-d6 as an internal standard solvent. | |
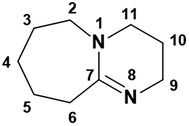 |
| | Fig. 5 Numbering of atoms in DBU. | |
As shown in Fig. 3a and b, 1H NMR spectra of solid [DBU-H2S] adduct gave rise to slightly broadened but well resolved peaks compared to the spectra of DBU molecule. The protons of the DBU molecule were significantly influenced after formation of solid [DBU-H2S] adduct and the signals related to these protons demonstrated a downfield shift and a shift in between the range of 0.06 and 0.68 ppm. Amongst the protons, the electron density around the protons 2, 6, 10 and 11 were significantly reduced after solid [DBU-H2S] adduct formation and protons become de-shielded with values of 0.40, 0.68, 0.21 and 0.33 ppm, respectively. As previously reported, the broad peak was observed at 4.51 ppm related to the exchangeable proton associated with protonated DBU (–NH) molecule and/SH− anion.13c The existence of the exchangeable proton in DBU cation was further confirmed by addition of two drops of D2O in same NMR tube in which solid [DBU-H2S] adduct was previously analyzed. The broad signal at 4.51 ppm was disappeared due to exchange of proton with D atom in protonated DBU molecule (Fig. 3c).
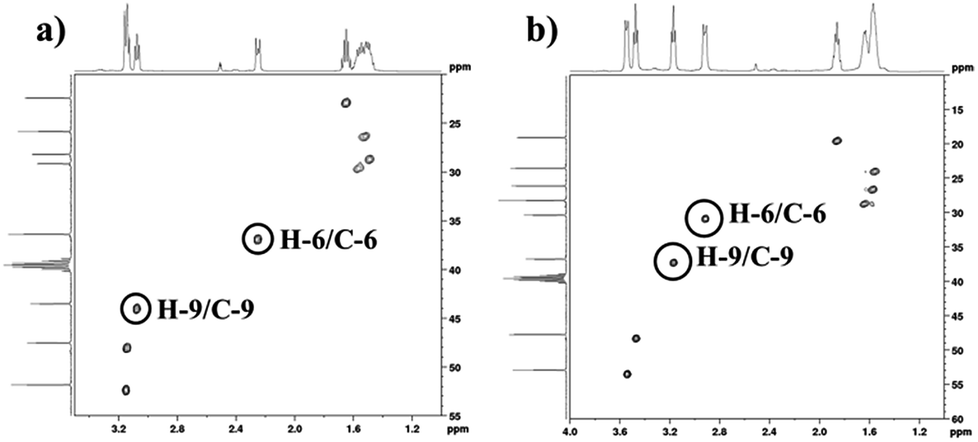
In order to find definitive evidence for the possibility of protonation of available nitrogen atoms at position 1 or 8, the 13C NMR analysis of solid [DBU-H2S] adduct was performed. As shown in Fig. 4, comparatively larger shifts were found in the signals of the DBU carbons close to the N at position 8 i.e. C-6 and C-9, rather than carbon atoms C-2 and C-11 which are closer to the N atom at position 1. This result indicates that only N atom at position 8 got protonated upon interaction of H2S with DBU molecule. It was also observed that the signal of the carbon atom C-7 also showed the shift (down field shift) from 159.5 to 164.7 ppm.13c Thus, both 1H and 13C NMR of solid [DBU-H2S] adduct showed that H2S gas equivalently interacted with DBU molecule and gave ionic solid [DBU-H2S] adduct which composed of protonated DBU molecule and probably hydrogen sulfide anion (–SH). Further 2D NMR spectroscopic analysis also carried out to confirm the observed signals for both neat DBU and adduct of it with H2S gas and obtained spectra are shown in Fig. 6 and ESI Fig. S1 and S2.† Similar to one-dimensional 1H and 13C NMR analysis (1D), the 2D NMR analysis also showed that spectra of [DBU-H2S] adduct represented isolated signals compared to DBU. Also, as observed in 1H and 13C NMR analysis, the 1H–13C HSQC NMR analysis of both DBU and [DBU-H2S] adduct showed that after reaction of DBU with H2S, the carbon atoms at positions 6 and 9 and their corresponding protons got influenced more compared to other atoms in the molecule. Hence, as shown in proposed mechanism shown in Scheme 1, NMR analysis confirms that DBU formed an ionic solid after interaction with H2S through protonation of its one of the nitrogen atom. Here after the solid [DBU-H2S] adduct will be referred as [DBUH][SH] salt.
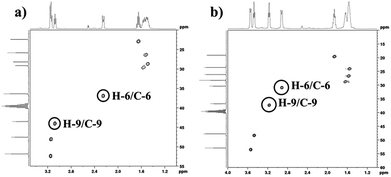 |
| | Fig. 6 (a) 1H–13C HSQC NMR of (a) DBU and, (b) solid [DBU-H2S] adduct (in solvent d6-DMSO). | |
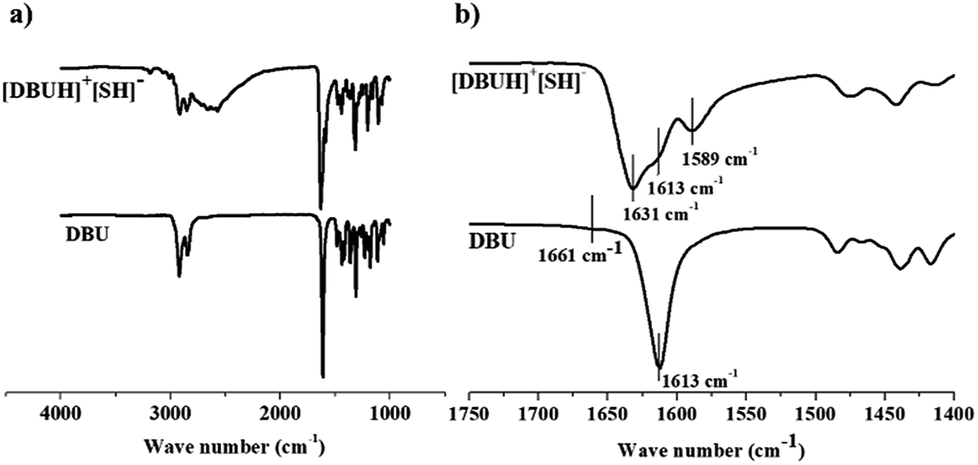
3.1.2 IR spectroscopy. The Fig. 7a and b illustrate the FT-IR spectra of a comparison of the starting material DBU with the product formed after bubbling H2S in DBU i.e. [DBUH][HS] salt. It was observed that the vibrational bands were broadened in the product after protonation of DBU. The DBU displayed the C![[double bond, length as m-dash]](https://www.rsc.org/images/entities/char_e001.gif) C and CN ring stretching vibrations in the range of 1500–1750 cm−1 whereas for [DBUH][SH] salt, the vibration range for same ring stretching become more widened and found in the range of 1450–1700 cm−1 (Fig. 8b). The intense band at 1613 cm−1 (from CN) and less intense band at 1661 cm−1 in DBU was observed.13c,16a–c After protonation of DBU, the intensity of vibrational band at 1613 cm−1 further decreased while new vibrational bands were observed at 1631 (more intense) and 1589 cm−1 (less intense and broadened) in the CC and CN ring stretching vibration range16a–c
C and CN ring stretching vibrations in the range of 1500–1750 cm−1 whereas for [DBUH][SH] salt, the vibration range for same ring stretching become more widened and found in the range of 1450–1700 cm−1 (Fig. 8b). The intense band at 1613 cm−1 (from CN) and less intense band at 1661 cm−1 in DBU was observed.13c,16a–c After protonation of DBU, the intensity of vibrational band at 1613 cm−1 further decreased while new vibrational bands were observed at 1631 (more intense) and 1589 cm−1 (less intense and broadened) in the CC and CN ring stretching vibration range16a–c
 |
| | Fig. 7 FT-IR spectra of (a) DBU and (b) [DBUH][SH] salt. | |
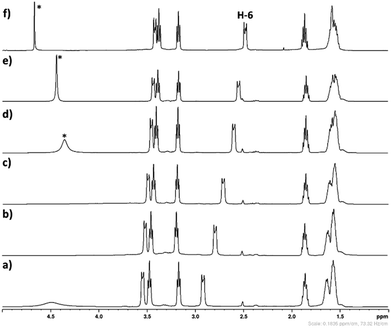 |
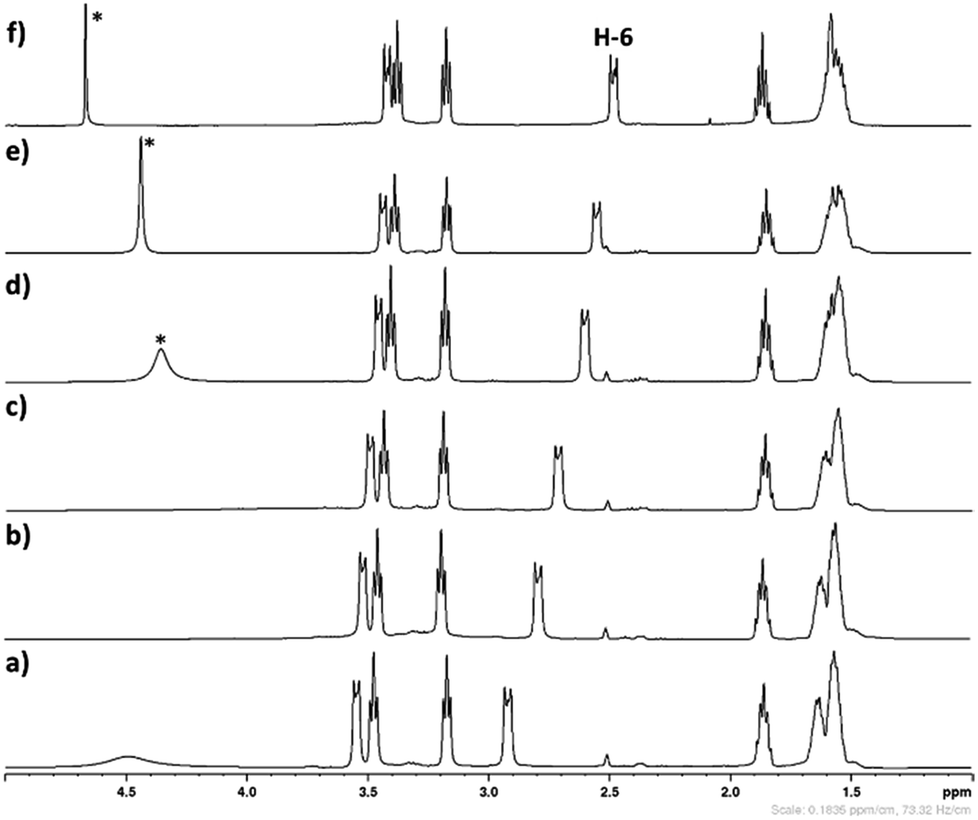
| | Fig. 8 The 1H spectra of (a) [DBUH][SH] salt (solvent – DMSO-d6), (b–e) The 1H spectra of mixture IL + DMSO-d6 + D2O after addition of D2O in IL and DMSO-d6 mixture, NMR spectra after addition of (b) 100 mg, (c) 100 mg, (d) 200 mg, (e) 200 mg D2O and (f) [DBUH][SH] salt (solvent – D2O), *residual water in D2O. | |
The bands at 2920 and 2845 cm−1 originate from the CH2-stretching vibrations in the ring of DBU and were also observed in the product even after protonation of DBU. Accompanied to it, in case of [DBUH][SH] salt, the new broad vibrational bands related to S–H and N–H stretching vibrations were observed in the range 2400–3600 cm−1. These vibrational bands were super imposed with CH2 stretching vibrations. The ν(S–H) bands were observed in the range 2450–2750 cm−1 while ν(N–H) band were observed in the range 3000–3400 cm−1 accompanied by weak distinct band at 3186 cm−1.17a,b Hence, supportive to NMR analysis, FTIR analysis confirmed the formation of [DBUH][SH] salt after reaction of H2S with DBU.
3.2. Miscibility with various solvents
The miscibility test of the DBU as well as the synthesized [DBUH][SH] salt was carried out with various solvent system and presented in Table 1. [DBUH][SH] salt was synthesized in the N2 atmosphere to avoid the contact with moisture before addition of solvent. 0.100 ml of DBU or 100 mg of [DBUH][SH] salt was dissolved in 4 ml of solvent to understand the miscibility in various solvent systems. The DBU was miscible or soluble (formed a single phase) in most of the protic and non-protic solvents used and independent on the polarity of the solvent medium. As shown in Table 1, the [DBUH][SH] salt was miscible with the solvents having dielectric constant (εr) above 8 at 25 °C and like DBU, the miscibility was independent on protic and non-protic characteristic of the solvents. The [DBUH][SH] salt was miscible in high (e.g. water, protic) as well as less polar (e.g. acetone, non-protic) solvents. On the other hand, in comparatively less polar or non-polar solvents such as ethyl acetate, n-hexane and toluene (εr value less than 8), [DBUH][SH] salt was insoluble and pale green solid was separated. Further, even though chloroform has εr value 4.81, [DBUH][SH] salt was soluble in it and this could be result of more protic characteristics of chloroform compared to ethyl acetate (εr = 6.02). In overall, the [DBUH][SH] salt is miscible with solvents with different characteristics which can be helpful further for its application in various wide range synthetic or catalytic approaches.
Table 1 The miscibility of DBU and [DBUH][SH] salt with various solventsa
| Solvent |
Dielectric constant, εr (20 °C)d |
DBU |
[DBUH][SH] salt |
| ya: miscible and non-colored solution, yb: miscible and pale green colored solution, nc: immiscible, turbid and pale green solid separate out, d values for dielectric constants are referred from ref. 18a and b. |
| Water |
78.30 |
y |
ya |
| Methanol |
32.66 |
y |
yb |
| Ethanol |
24.56 |
y |
yb |
| Acetone |
20.56 |
y |
yb |
| Acetonitrile |
35.94 |
y |
yb |
| Dichloromethane |
8.93 |
y |
yb |
| Chloroform |
4.81 |
y |
yb |
| Dimethyl sulfoxide |
48.23 |
y |
yb |
| Ethyl acetate |
6.02 |
y |
nc |
| n-Hexane |
1.88 |
y |
nc |
| Toluene |
2.38 |
y |
nc |
3.3. Stability of [DBUH][SH] salt in aqueous medium
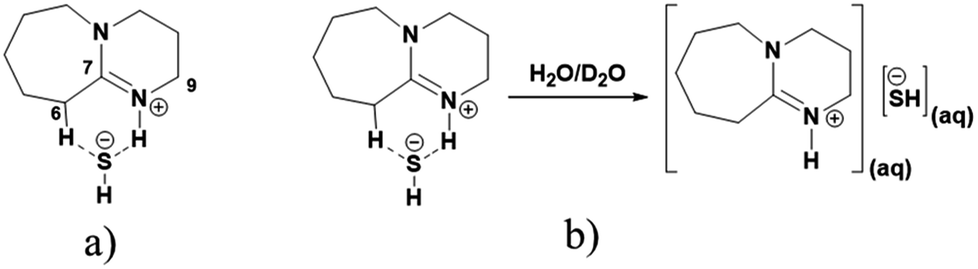
The influence of aqueous medium on the stability of [DBUH][SH] salt was monitored by 1H analysis. The obtained NMR spectra depicted in Fig. 8. As shown in Fig. 8, after regular addition of D2O in [DBUH][SH] salt-DMSO-d6 mixture, the signals related to the proton H-6 was shifted steadily to up field (Fig. 8b–e). The total shift for proton H-6 obtained after addition of 600 mg of D2O was 0.33 ppm. The signals belonging to other protons such as H-2, H-5, H-9 and H-11 were also shifted to up field after addition of D2O, however the values for the shifts were not significant compared to proton H-6. Considering these observations, as shown in Fig. 9a, it can be concluded that in the solid state as well as after dissolution in DMSO-d6, the –SH− anion of the IL could be in the vicinity of proton H-6 through hydrogen bonding which reduced the electron density in C6–H bond. Hence, proton H-6 might have showed down field shift in [DBUH][SH] salt compared to DBU molecule. However, after addition of polar D2O, considering the high polarity of D2O compared to DMSO, D2O may further solvate both the cation and anion resulting in hydrogen bonding interactions between the proton H-6 and –SH anion being disturbed (Fig. 9b). This disturbance further increased the electron density in C6–H bond through newly established hydrogen bonding interaction between oxygen atom of water and proton H-6. It seems that the proton H-6 exhibits strong hydrogen bonding interaction with the –SH anion compared to similar bonding interactions with water molecule. This assumption was further confirmed by recording 1H NMR spectra of [DBUH][SH] salt with D2O as a solvent and the Fig. 8f shows that the signal related to the proton H-6 was obtained at up field as compared to DMSO-d6 solvent, assuming that there was complete solvation of both the cation and anion. Wang et al. reported similar influence of dilution on proton H-6 in a [DBUH][HCO3] salt which was in situ formed after bubbling of CO2 in DBU and water mixture in a DMSO solvent. After dilution of the reaction mixture with additional DMSO, based on 1H NMR analysis, the signal related to proton H-6 was shielded at higher dilution levels.19 Simultaneously, the same author during the application of [DBUH][HCO3] salt for cellulose dissolution observed that with an increase in the concentration of cellulose in the reaction mixture, the signal related to proton H-6 got regularly shielded in 1H NMR analysis of reaction mixtures. This shielding of signal was a direct consequence of an increase in the interaction between the H-6 and hydroxyl group of the cellulose backbone with an increase in the cellulose concentration, which further enhanced the electron density in C6–H bond.19
 |
| | Fig. 9 (a) Probable structure of [DBUH][SH] salt in solid state and in DMSO solvent and, (b) probable solvation of [DBUH][SH] salt in aqueous medium. | |
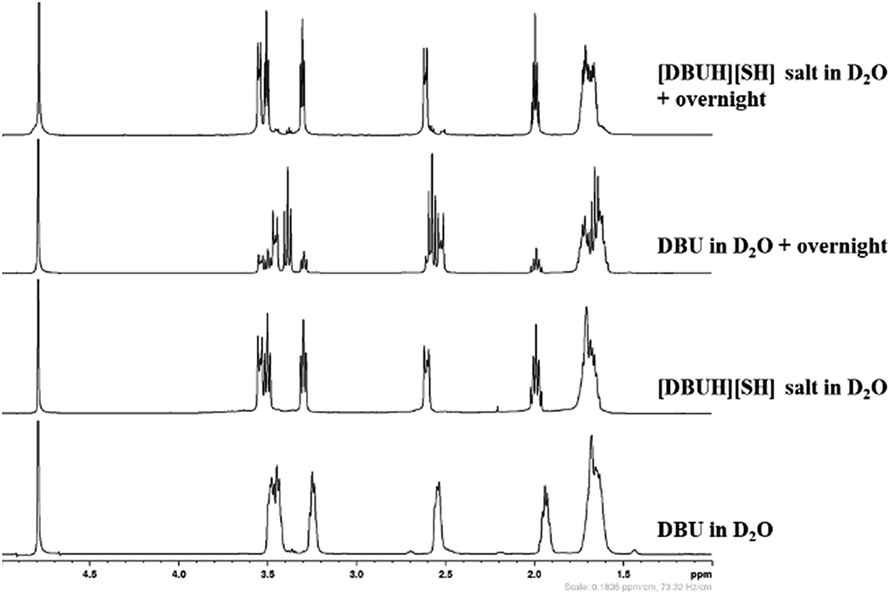
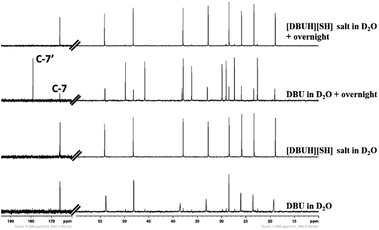
As mentioned in the experimental section, the long term stability of the DBU and [DBUH][SH] salt in aqueous medium was also examined by NMR analysis. The Fig. 10 and 11 depict the 1H and 13C NMR spectra of solutions of both DBU and [DBUH][SH] salt in D2O solvent. As shown in Fig. 10, the immediate 1H NMR analysis of both DBU and [DBUH][SH] salt represented their pure forms without any signal belonging to newly formed chemical species. However, after keeping in D2O solution for overnight, 1H NMR spectra of DBU showed that new intense peaks appeared along with a decrease in the intensity of DBU molecule whereas the NMR spectra of [DBUH][SH] salt remained unchanged (Fig. 10). The 13C NMR analysis also showed similar observations where NMR spectra of DBU after keeping in D2O overnight resulted in the appearance of new highly intense peaks in between 20–55 ppm as well as at 179.2 ppm whereas similar spectra of [DBUH][SH] salt gave rise to new identical peaks but having very less intensity (Fig. 11).
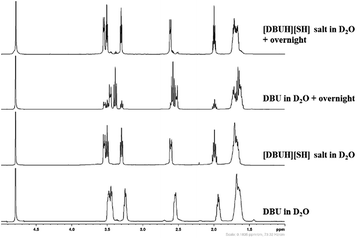 |
| | Fig. 10 1H NMR analysis of DBU, [DBUH][SH] salt and analysis after keeping both DBU and [DBU]+[HS]− salt overnight (in D2O solvent). | |
 |
| | Fig. 11 13C NMR analysis of DBU, [DBUH][SH] salt and analysis after keeping both DBU and [DBU]+[HS]− salt overnight (in D2O solvent). | |
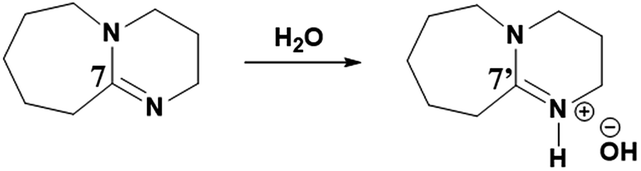
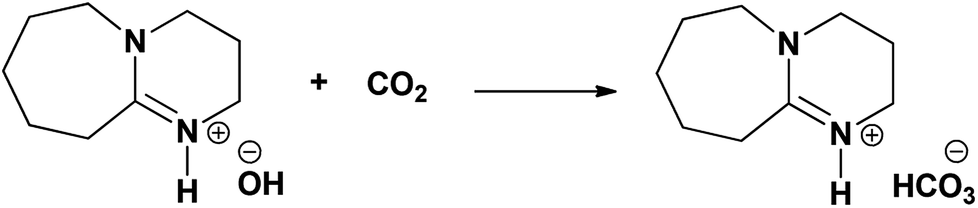
As reported previously, considering its superbasic character, DBU is unstable in aqueous medium and turns to hydroxide salt by abstracting proton from water molecule (reaction Scheme 2).20 In a similar report, it was also shown that the rate of conversion of DBU in to its hydroxide salt in aqueous medium is directly proportional to the concentration of water in the medium.
 |
| | Scheme 2 Synthesis of [DBUH][OH] salt from DBU and water. | |
Therefore, the intense peak appearing at 179.2 ppm in Fig. 10b is related to the carbon C-7 in the hydroxide salt of DBU. However, such a hydroxide salt formation was not observed in case of aqueous solution of [DBUH][SH] salt. Hence all these observations support the hypothesis that the [DBUH][SH] salt formed after protonation of DBU with H2S is adequately stable in an aqueous medium.
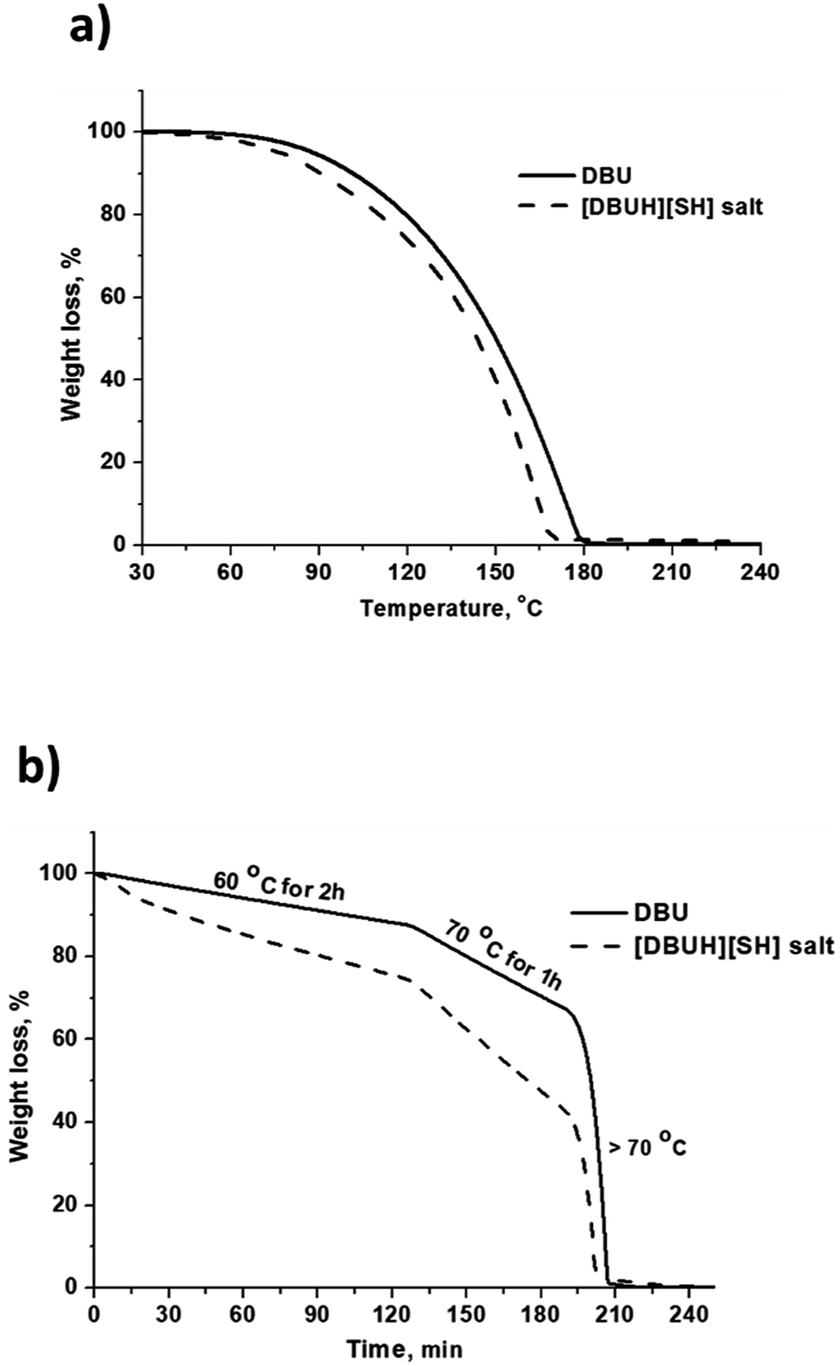
3.4. Thermal stability of the DBU and [DBUH][SH] salt
The thermal stability of the [DBUH][SH] salt was analyzed by means of TGA analysis and compared with thermal stability of DBU under N2 gas flow. The obtained graphics related to weight loss (%) against temperature (°C) and time (min) are depicted in Fig. 12a and b, respectively. As shown in Fig. 12a, for both DBU and [DBUH][SH] salt, weight was steadily decreasing with an increase in the temperature and complete weight loss for DBU and [DBUH][SH] salt was observed at 180 and 170 °C, respectively (Fig. 12a). Surprisingly, [DBUH][SH] salt was found to be less thermally stable compared to DBU. After complete TGA analysis, it was observed that no solid carbon containing material was left in the crucible represents that the DBU and [DBUH][SH] salt are vaporizing like volatile liquids under thermal treatment. Further isothermal TGA analysis was also carried out for both DBU and [DBUH][SH] salt considering their thermally unstable nature in non-isothermal TGA analysis experiments. As shown in Fig. 12b, at all temperatures i.e. at 60 °C (2 h), 70 °C (1 h) and above 70 °C the [DBUH][SH] salt showed again very less thermal stability compared DBU as it probably resulted in a more vaporizing nature under thermal treatment. Accompanied to that, after synthesis of [DBUH][HS] salt, it started giving rotten egg smell which is typical for H2S gas. Therefore, after the synthesis the salt was stored at freezing temperature (−20 °C). Hence, all these observations represents that [DBUH][SH] salt has low thermal stability. Considering rotten egg smell of the salt even at room temperature as well as steady weight loss (nearly similar to DBU) with increase in temperature hints that the DBU salt might be undergoing decomposition to DBU and H2S molecule at mild to high temperatures. However, more work needs to be performed under controlled experimental condition to get more insight in the thermal stability of [DBUH][SH] salt. Here, considering the unstable nature of [DBUH][SH] salt, it further limits its applications in its neat form and as mentioned previously, this salt can be used further in the form of its solution in different solvent systems.
 |
| | Fig. 12 (a) TGA of DBU and [DBUH][SH] salt (a) % wt loss vs. temperature (°C) and, (b) % wt loss vs. time (min). | |
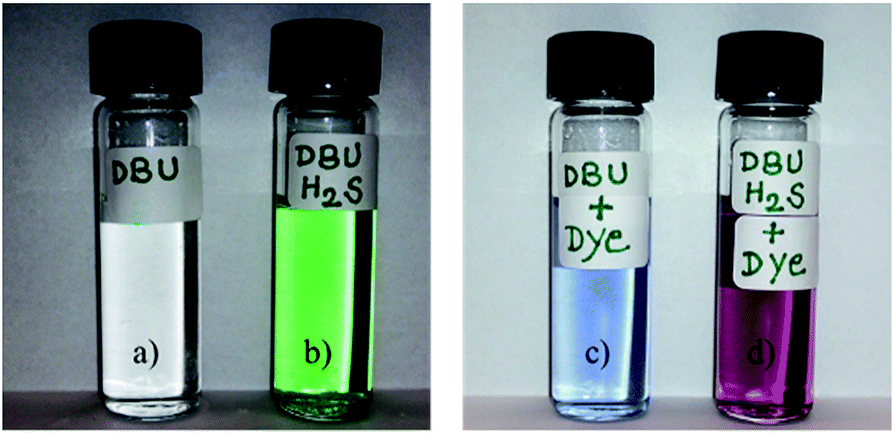
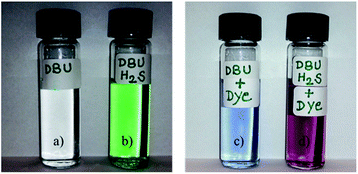
3.5. Polar and non-polar nature study with Reichardt's dye
The solvatochromic dye such as Reichardt's and Nile Red dye are usually applied to examine the polar/non-polar nature of the solution where the change in the color of the dye represents the polar/non-polar nature of the solution. Both Reichardt's and Nile Red dye were used to understand the polar/non-polar nature of reversible polarity solvents formed after interaction of aqueous or alcoholic solution (usually lower alcohols) of DBU with CO2 molecule.13a,21 Similarly, here we also used Reichardt's dye to find out the polar/non-polar nature of an acetonitrile solution of DBU and [DBUH][SH] salt. Fig. 13 depicts the color of the acetonitrile solution of DBU and [DBUH][SH] salt before and after addition of Reichardt's dye. The color of the acetonitrile solution of DBU changed from colorless to blue after addition of dye which as usual for this dye when dissolved in a polar liquid such as acetonitrile. On the other hand, after addition of dye in the acetonitrile solution of [DBUH][SH] salt, the color of the solution changed immediately from green to pinkish red or pink. This indicates that polarity of the acetonitrile solution of [DBUH][SH] salt is more compared to acetonitrile solution of DBU. In other words, the more polar or ionic or strong hydrogen bonding species are present in acetonitrile solution of [DBUH][SH] salt. Heldebrant et al. also reported similar observations during comparison of polarities of acetonitrile solutions of DBU and switchable ionic liquid obtained after reaction of aqueous solution of DBU with CO2 molecule.16c Hence alternatively, this observations confirmed that after bubbling H2S in DBU led to formation ionic species such as [DBUH]+ cation and [SH]− anion through protonation of DBU molecule by H2S gas.
 |
| | Fig. 13 Acetonitrile solutions of (a) DBU, (b) [DBUH][SH] salt, (c) DBU and Reichardt's dye and (d) [DBUH][SH] salt and Reichardt's dye. | |
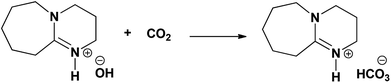
3.6. CO2 absorption capacity of the aqueous solution of [DBUH][SH] salt
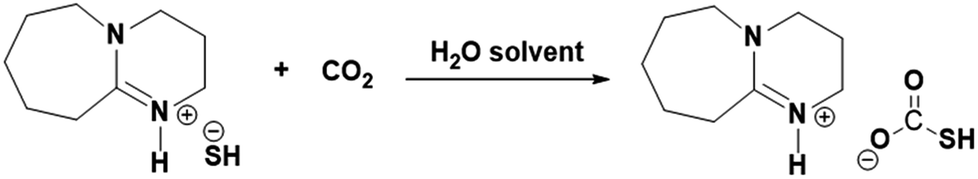
The aqueous solution DBU was extensively studied previously to chemisorb CO2 where, as explained in the reaction Scheme 3, the superbase DBU gets protonated in an aqueous medium (reaction Scheme 2) and its hydroxide form can be used for reversible CO2 absorption.20,21 Similarly, [DBUH][SH] salt can be explored further to chemisorb CO2 considering its nearly identical composition when compared with [DBU][OH] salt. However, like [DBUH][OH] salt in an aqueous medium, practically it is not possible to use H2S as a reaction media for [DBUH][SH] salt to capture CO2, considering it's gaseous nature. Alternatively, a solution of [DBUH][SH] salt in suitable solvent can be used as reaction medium for CO2 absorption. It was described previously that the [DBUH][SH] salt can maintain its ionic nature without decomposition in an aqueous medium (Fig. 10 and 11). Also, considering the applicability of aqueous medium in conventional CO2 scrubbing process we decided to use aqueous solution of [DBUH][SH] salt for CO2 capture. The possible interaction between [DBUH][SH] salt and CO2 is shown in reaction Scheme 4.
 |
| | Scheme 3 Interaction between [DBUH][OH] salt and CO2. | |
 |
| | Scheme 4 Plausible interaction between aqueous solution of [DBUH][SH] salt and CO2. | |
The CO2 absorption capacity (mol CO2/mol salt) in aqueous solution of [DBUH][SH] salt was measured as a function of the amount of water in the aqueous solution of salt as well as CO2 gas flow rate and the results are depicted in Fig. 14 and 15, respectively. As shown in Fig. 14, the CO2 absorption capacity of the aqueous solution of [DBUH][SH] salt with 5 and 10 wt% of water was terminated to 0.31 and 0.42 mol CO2/mol [DBUH][SH] salt in a short period of time. In this experiments, the low CO2 absorption capacity of the aqueous solution of [DBUH][SH] salt was a result of instantaneous increase in viscosity and solidification of the reaction mixture. The increase in viscosity was the result of establishment of new extended hydrogen bonded network in between the newly formed ionic species after CO2 chemisorption.22a,b This solidification of the reaction mixture further completely retards the diffusion of CO2 in the reaction mixture and hence CO2 absorption does not further proceed further in case of aqueous solutions of [DBUH][SH] salt with 5 and 10 wt% water after 9 and 15 min, respectively. Here we also assumed that, the formation of solid could be the result of non-availability of the sufficient amount of aqueous medium to dissolve the newly formed ionic species to decrease the viscosity of reaction medium. Hence, the reaction mixture with higher water concentrations was further tested upon CO2 absorption capacity measurements. With diluted solutions, the initial idea was to enhance the CO2 absorption rate as well as capacity by a decrease in viscosity of the reaction medium via fast CO2 diffusion; however, in actual case the opposite results were obtained. The reaction mixture with 14 wt% of water absorbed CO2 with a slow rate and reached its full CO2 absorption capacity in 30 min. As shown in Fig. 14, a further study with increased water concentrations i.e. with 18 and 21 wt% water, the CO2 absorption rate steadily decreased further and the solvent systems not reached to their full CO2 absorption capacity in 30 min. Hence, an increase in the water concentration in the composition of reaction mixture inhibits the rate as well as capacity of CO2 absorption in aqueous solutions of the [DBUH][SH] salt.
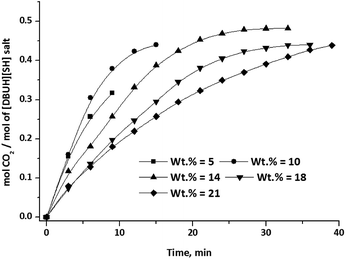 |
| | Fig. 14 CO2 absorption capacity of aqueous [DBUH][SH] salt with different water concentrations. (CO2 flow rate = 15 ml min−1). | |
 |
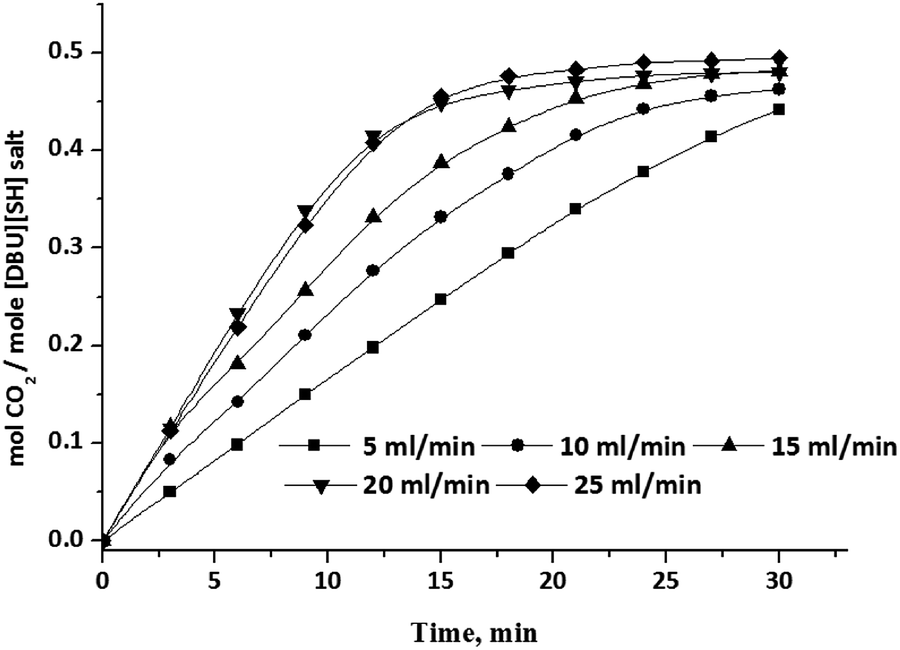
| | Fig. 15 CO2 absorption capacity of aqueous solution of [DBUH][SH] salt (14 wt% of H2O) with different CO2 gas flow rate. | |
The influence of CO2 gas flow rate on CO2 absorption capacity in aqueous solutions of [DBUH][SH] salt also studied and the obtained capacities with various flow rates of CO2 are shown in Fig. 15. Here aqueous solutions with 14 wt% of water in the composition was selected as the solvent system and with this composition full CO2 absorption capacity was reached in a short period of time compared to other compositions (Fig. 14). As shown in Fig. 15, as expected, the CO2 absorption capacity as well as the rate steadily increased with an increase in the CO2 gas flow rate from 5 ml min−1 to 20 ml min−1. Upon further increase in the flow rate to 25 ml min−1, we did not observe any influence in the CO2 absorption capacity of the solvent system and it was identical to the capacity obtained when 20 ml min−1 flow rate was employed.
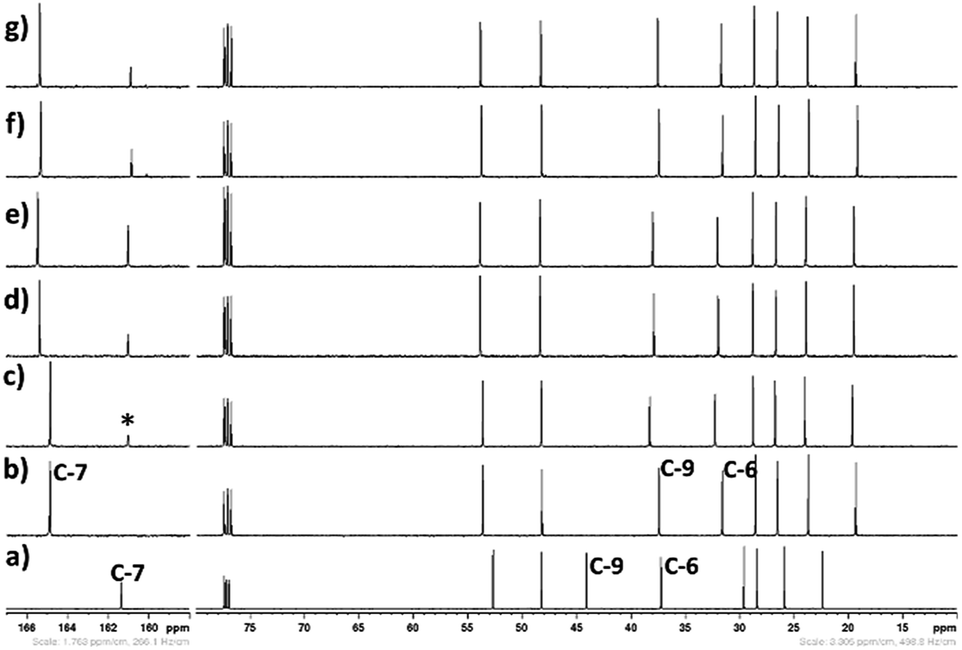
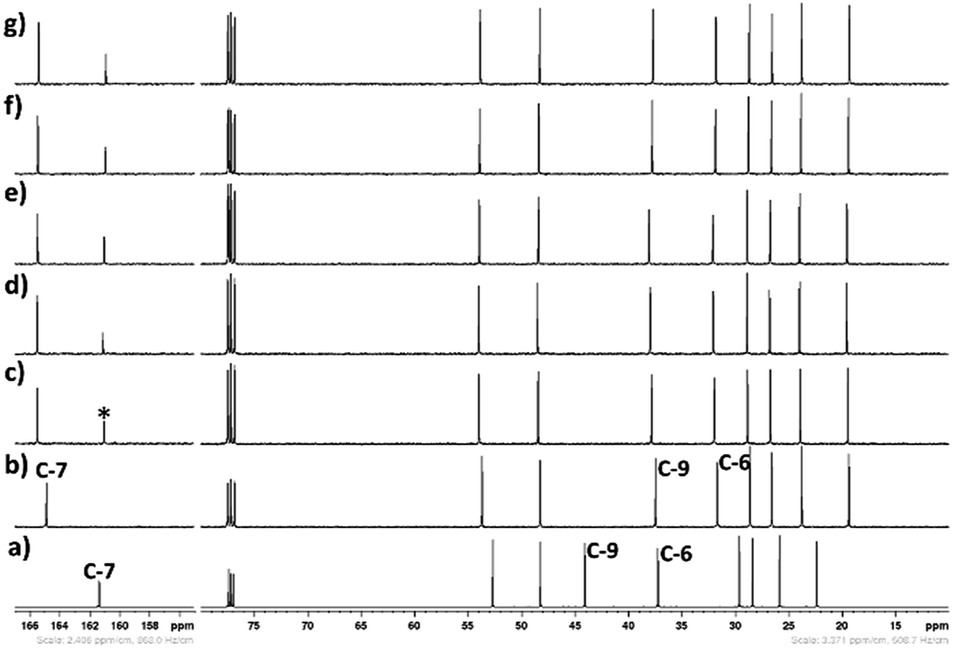
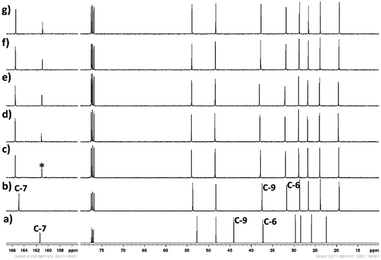
The reaction mixture after interaction of aqueous solution of salt with CO2 was further analysed by 1H and 13C NMR (in CDCl3-d3) analysis to understand the nature of the species formed upon the process and the obtained 13C NMR spectra are shown in Fig. 16 and 17, while 1H NMR spectra are depicted in ESI Fig. S3 and S4.† All the 13C NMR represented by Fig. 16 and 17 showed new peaks in between 160.80 to 161.10 ppm, probably belonging to CO2 chemisorbed chemical species. Similar observations have been reported in previous studies where bicarbonate species formed when an aqueous solution of DBU was exposed to the CO2 molecule.20 As shown in NMR spectra in Fig. 16, the intensity of the peaks of chemosorbed CO2 species steadily increased for reaction compositions comprising of water from 5 to 14 wt%. After this the intensity further decreased for compositions with increasing water concentrations (Fig. 16f and e). These observations are equivalent to CO2 absorption capacity measurements obtained with solvent system having different water concentrations in the composition (Fig. 14). Similarly, as shown in Fig. 17, equivalent to an increase in the CO2 absorption capacity with an increase in CO2 flow rate, the intensity of the peaks are the result of CO2 chemosorbed species concentration steadily increased. Hence, these observations demonstrate that like in the case of aqueous solution of DBU, the aqueous solution of [DBUH][SH] salt has a capability to interact with the CO2 molecule through formation of chemical species which seem to be sulphur containing analogues of bicarbonate i.e. HSCO2−. Further, there is a possibility of formation of a highly toxic carbon sulfide (COS) gas through probable decomposition of HSCO2− anion. Considering instrumental limitations, the out stream of CO2 gas was not tested for presence of COS gas in this work, however, precautions are needs to be taken in these experiments.
 |
| | Fig. 16 13C NMR spectra (in CDCl3-d3) of CO2 treated aqueous solution of [DBUH][SH] salt with different water concentrations, (a) DBU, (b) [DBUH][SH] salt, with different water concentrations such as (c) 5 wt%, (d) 10 wt%, (e) 14 wt%, (f) 18 wt%, and (g) 21 wt%, CO2 gas flow rate = 15 ml min−1, *carbonyl carbon. | |
 |
| | Fig. 17 13C NMR spectra (CDCl3-d3) of spectra (CDCl3-d3) of CO2 treated aqueous solution of [DBUH][SH] salt (14 wt% H2O with different gas flow rates (a) DBU, (b) [DBUH][SH] salt, with different gas flow rates such as (c) 5 ml min−1, (d) 10 ml min−1, (e) 15 ml min−1, (f) 20 ml min−1, and (g) 25 ml min−1, *carbonyl carbon. | |
4. Conclusions
The capture of H2S gas was successfully demonstrated where an organic superbase, DBU chemosorbed H2S molecule through ionic solid formation. In the actual case, ionic solid or [DBUH][SH] salt was formed through protonation of sp2-N atom of DBU by H2S. The formation of salt was preliminary confirmed by 13C NMR analysis where compared to DBU, the shielded signals for carbon atoms at position 6 and 9 while de-shielded signals for carbon atom at position 7 were observed. The disappearance of intense peak at 1613 cm−1 while appearance of new peaks at 1631 and 1589 cm−1 in FTIR analysis as well as polar characteristics of acetonitrile solution of [DBUH][SH] salt following measurements with Reichardt's dye further confirmed the formation of ionic or polar solid through interaction between DBU and H2S. Like DBU, [DBUH][SH] salt also showed miscibility in various conventional protic and non-protic solvents used. Based on thermal characteristics measurements, like DBU, the [DBUH][SH] salt represented thermally unstable nature and got vaporized under mild thermal treatment. When accounting for the stability in aqueous medium, based on NMR analysis, in aqueous medium [DBUH][SH] salt showed long term stability and its composition was not significantly influenced whereas DBU got protonated considering its superbasic characteristics. As a primary application of [DBUH][SH] salt, the aqueous solution showed the capability to capture CO2 where amount of water and CO2 flow rate were influenced the CO2 absorption capacity and the rate of capture. The capacity increased up to 0.46 mol CO2/mol salt when having 14 wt% water in the solvent composition which was further decreased with more diluted solvent systems. Further, the CO2 absorption rate as well as the capacity of the solvent system was steadily increased with an increase in the CO2 flow rate from 5 to 20 ml min−1; however, a further increase in the flow rate was not beneficial. Hence, here we tell a story about a study on synthesis and characterization of the [DBUH][SH] salt and its application in CO2 capture. However, [DBUH][SH] salt can be explored further in various applications such as a catalyst for chemical transformations in organic synthesis and its solution after dissolving it in various solvents for lignocellulosic biomass treatment, capture of other toxic gases such as NOx and SOx etc. via a systematic experimental approach.
Conflicts of interest
There are no conflicts to declare.
Acknowledgements
We wish to thanks Dr Mattias Hedenström and Dr Tobias Sparrman for their assistance in the NMR analysis. This work is part of activities of the Technical Chemistry, Department of Chemistry, Chemical-Biological Centre, Umeå University, Sweden as well as the Johan Gadolin Process Chemistry Centre at Åbo Akademi University in Finland. The Swedish Research Council (Drn: 2016-04090), Bio4Energy programme, Kempe Foundations and Wallenberg Wood Science Center under auspices of Alice and Knut Wallenberg Foundation are gratefully acknowledged for funding this project.
References
- H. C. Stauffer, Oil shale, tar sands, and related materials, ACS Symposium Series, American Chemical Society, Washington, D.C., 1981, vol. 163 Search PubMed.
- O. W. Agbroko, K. Piler and T. J. Benson, ChemBioEng Rev., 2017, 4, 339–359 CrossRef.
- United States Department of Labor, Occupational Safety and Health Administration. Hydrogen Sulfide, Hazards, https://www.osha.gov/SLTC/hydrogensulfide/hazards.html.
-
(a) K. V. Bineesh, D. K. Kim, H. J. Cho and D. W. Park, J. Ind. Eng. Chem., 2010, 16, 593–597 CrossRef;
(b) J. B. Vilmain, V. Couroussea, P. F. Biarda, M. Azizia and A. Couvert, Chem. Eng. Res. Des., 2014, 92, 191–204 CrossRef;
(c) B. Elyassi, Y. A. Wahedi, N. Rajabbeigi, P. Kumar, J. S. Jeong, X. Zhang, P. Kumar, V. V. Balasub ramanian, M. S. Katsiotis, K. A. Mkhoyan, N. Boukos, S. A. Hashimi and M. Tsapatsis, Microporous Mesoporous Mater., 2014, 190, 152–155 CrossRef;
(d) C. Wang and Y. Pei, Chemosphere, 2012, 88, 1178–1183 CrossRef PubMed;
(e) A. L. Kohl and R. B. Nielsen, Gas Purification, Gulf Publishing Company, Houston, TX, 5th edn, 1997, eBook ISBN: 9780080507200 Search PubMed;
(f) E. Wagner, R. Schwalm, J. Schneider, R. Erhardt, C. Jokisch and H.-P. Rink, Carbamate-Functional Triazine Derivatives, EP Patent 1740554 B1, 2008, 1, p. 554;
(g) T. R Carey, J. E. Hermes and G. T. Rochelle, Gas Sep. Purif., 1991, 5, 95–109 CrossRef.
- M. S. Shah, M. Tsapatsis and J. I. Siepmann, Chem. Rev., 2017, 117, 9755–9803 CrossRef PubMed.
- M. C. Iliuta, F. Larachi and B. P. A. Grandjean, Fluid Phase Equilib., 2004, 218, 305 CrossRef.
- H.-J. Xu, C.-F. Zhang and Z.-S. Zheng, Ind. Eng. Chem. Res., 2002, 41, 2953–2956 CrossRef.
-
(a) N. M. Robert, T. M. Gilbert and A. R. Mahmud, Ind. Eng. Chem. Res., 1987, 26, 27 CrossRef;
(b) T. L. Donaldson and Y. N. Nguyen, Ind. Eng. Chem. Fundam., 1980, 19, 260–266 CrossRef.
- T. Ishikawa, Superbases for Organic Synthesis: Guanidines, Amidines, Phosphazenes and Related Organocatalysts, John Wiley & Sons, Ltd., 2009, ISBN: 978-0-470-51800-7, http://rushim.ru/books/mechanizms/superbases-for-organic-synthesis.pdf Search PubMed.
- A. K. Morri, Y. Thummala and V. R. Doddi, Org. Lett., 2015, 17, 4640 CrossRef PubMed.
- A. G. Ying, L. Liu, G. F. Wu, G. Chen, X. Z. Chen and W. D. Ye, Tetrahedron Lett., 2009, 50, 1653 CrossRef.
- A. G. Ying, L. M. Wang, H. X. Deng, J. H. Chen, X. Z. Chen and W. D. Ye, ARKIVOC, 2009, 11, 288 Search PubMed.
-
(a) D. J. Heldebrant, C. R. Yonker, P. G. Jessop and L. Phan, Chem.–Eur. J., 2009, 15, 7619 CrossRef PubMed;
(b) D. J. Heldebrant, C. R. Yonker, P. G. Jessop and L. Phan, Energy Environ. Sci., 2008, 3, 487 Search PubMed;
(c) I. Anugwom, P. Maki-Arvela, P. Virtanen, P. Damlin, S. Sjoholm and J.-P. Mikkola, RSC Adv., 2011, 1, 452 RSC.
-
(a) I. Anugwom, P. Maki-Arvela, P. Virtanen, S. Willfor, R. Sjoholm and J.-P. Mikkola, Carbohydr. Polym., 2012, 87, 2005 CrossRef;
(b) I. Anugwom, P. Maki-Arvela, P. Virtanen, S. Willfor, P. Damlin, M. Hedenstrom and J.-P. Mikkola, Holzforschung, 2012, 66, 809 CrossRef;
(c) V. Eta, I. Anugwom, P. Virtanen, K. Eranen, P. Maki-Arvela and J.-P. Mikkola, Chem. Eng. J., 2014, 238, 242 CrossRef;
(d) V. Eta, I. Anugwom, P. Virtanen, P. Maki-Arvela and J.-P. Mikkola, Ind. Crops Prod., 2014, 55, 109–115 CrossRef;
(e) I. Anugwom, L. Rujana, J. Warna, M. Hedenstrom and J.-P. Mikkola, Chem. Eng. J., 2016, 297, 256 CrossRef.
-
(a) M. Vlasse, S. Giandinoto, S. T. Attarwala and Y. Okamoto, Acta Crystallogr., 1986, C42, 487 Search PubMed;
(b) M. Trisha, L. Phan, A. K. Alshamrani, J. R. Harjani, R. Wang, G. Schatte, N. J. Mosey and P. G. Jessop, Eur. J. Org. Chem., 2015, 33, 7334 Search PubMed.
-
(a) Y. Yang, L. Song, C. Peng, E. Liuc and H. Xie, Green Chem., 2015, 17, 2758 RSC;
(b) K. N. Onwukamike, T. Tassaing, S. Grelier, E. Grau, H. Cramail and M. A. R. Meier, ACS Sustainable Chem. Eng., 2018, 6, 1496–1503 CrossRef;
(c) D. J. Heldebrant, P. G. Jessop, C. A. Thomas, C. A. Eckert and C. L. Liotta, J. Org. Chem., 2005, 70, 5335–5338 CrossRef PubMed.
-
(a) C. L. Garcia and J. A. Lercher, J. Phys. Chem., 1992, 96, 5 CrossRef;
(b) K. Aokia, R. Imanishia and M. Yamada, Prog. Org. Coat., 2016, 100, 105–110 CrossRef.
-
(a) C. Gabriel, S. Gabriel, E. H. Grant, B. S. J. Halstead and D. M. P. Mingos, Chem. Soc. Rev., 1998, 27, 213–223 RSC;
(b) D. Q. M. Craig, Dielectric analysis of pharmaceutical systems, Taylor & Francis Ltd, London, UK, 2005 Search PubMed.
- J. Wang, Z. Xue, C. Yan, Z. Li and T. Mu, Phys. Chem. Chem. Phys., 2016, 18, 32772 RSC.
- I. Cota, R. Chimentao, J. Sueiras and F. Medina, Catal. Commun., 2008, 9, 2090–2094 CrossRef.
- L. Phan, D. Chiu, D. J. Heldebrant, H. Huttenhower, E. John, X. Li, P. Pollet, R. Wang, C. A. Eckert, C. L. Liotta and P. G. Jessop, Ind. Eng. Chem. Res., 2008, 47, 539–545 CrossRef.
-
(a) Y. Q. Zhang, S. J. Zhang, X. M. Lu, Q. Zhou, W. Fan and X. P. Zhang, Chem.–Eur. J., 2009, 15, 3003–3011 CrossRef PubMed;
(b) K. E. Gutowski and E. J. Magninn, J. Am. Chem. Soc., 2008, 130, 14690–14704 CrossRef PubMed.
Footnote |
| † Electronic supplementary information (ESI) available. See DOI: 10.1039/c8ra02993h |
|
| This journal is © The Royal Society of Chemistry 2018 |
Click here to see how this site uses Cookies. View our privacy policy here. 
 Open Access Article
 This Open Access Article is licensed under a Creative Commons Attribution-Non Commercial 3.0 Unported Licence
 *a and
Jyri-Pekka Mikkola*ab
*a and
Jyri-Pekka Mikkola*ab