DOI:
10.1039/C8RA02843E
(Paper)
RSC Adv., 2018,
8, 20319-20326
Off-stoichiometric Na3−3xV2+x(PO4)3/C nanocomposites as cathode materials for high-performance sodium-ion batteries prepared by high-energy ball milling†
Received
2nd April 2018
, Accepted 26th May 2018
First published on 4th June 2018
Abstract
Na3V2(PO4)3 (NVP) is regarded as a promising cathode material for sustainable energy storage applications. Here we present an efficient method to synthesize off-stoichiometric Na3−3xV2+x(PO4)3/C (x = 0–0.10) nanocomposites with excellent high-rate and long-life performance for sodium-ion batteries by high-energy ball milling. It is found that Na3−3xV2+x(PO4)3/C nanocomposites with x = 0.05 (NVP-0.05) exhibit the most excellent performance. When cycled at a rate of 1C in the range of 2.3–3.9 V, the initial discharge capacity of NVP-0.05 is 112.4 mA h g−1, which is about 96% of its theoretical value (117.6 mA h g−1). Even at 20C, it still delivers a discharge capacity of 92.3 mA h g−1 (79% of the theoretical capacity). The specific capacity of NVP-0.05 is as high as 100.7 mA h g−1 after 500 cycles at 5C, which maintains 95% of its initial value (106 mA h g−1). The significantly improved electrochemical performance of NVP-0.05 is attributed to the decrease of internal resistance and increase of the Na+ ion diffusion coefficient.
1. Introduction
Developing clean and renewable energy has become one of the most important scientific and engineering tasks because of increasing environmental concerns and energy shortages.1,2 Among all energy storage systems, lithium ion batteries (LIBs) have been regarded as the best choice because of their high voltage, high energy density, and environmental friendliness.3–5 However, the ability of LIBs has been doubted due to the ever increasing demand and limited lithium reserves in the Earth's crust. Sodium ion batteries (SIBs) have attracted more attention due to their attractive features, such as high safety, low cost, abundant sodium resources, etc.6,7 Na3V2(PO4)3 (NVP) has been considered as a promising SIB cathode material with an open NASICON framework wherein the sodium ions could diffuse quickly through the interstitial sites reversibly without resulting in a large volume change of the crystalline structure.8–10 These features make NVP a very promising potential cathode material for high-performance SIBs. However, NVP has very low electronic and Na+ ion conductivity.11–13 The theoretical capacity is not fully available even at comparatively low rates, which is a major drawback for practical applications. Therefore, many efforts have been made to improve the charge carrier transport kinetics in NVP by modifying NVP by carbon coating and ion doping.14–18 Carbon coating is a common method to improve the electronic conductivity of cathode materials. And it can keep the structural integrity of the electrode materials during the repeated charge and discharge processes, which greatly benefits cycle stability. Recently, many studies on carbon wrapped Na3V2(PO4)3 composites have been reported.19–21 In addition, doping with metallic ions has been proved to be an effective way in improving the intrinsic electronic conductivity in SIBs.22–26 Recently, the effects of off-stoichiometry have been widely studied in cathode materials. Byoungwoo Kang et al. proposed that a fast ion-conducting surface phase is formed by controlling the off-stoichiometry in LiFePO4.27 The fast kinetic response induced by off-stoichiometry is attributed to the decrease of the battery resistance. Maryía J. Aragón et al. studied the effect of sodium excess on Na3+3xV2−x(PO4)3 (0 ≤ x ≤ 0.15) as cathode materials for SIBs.28 The synergic combination of the presence of Na4P2O7 impurities and the structure deviation lead to an improvement of the electrochemical performance, especially cycling stability at high rate, compared with the stoichiometric NVP. In the following work, they prepared Na3−3xV2+x(PO4)3 by sol–gel method to detect the effect of vanadium excess on the structure, morphology, and electrochemical properties.29 The rate performance of Na3−3xV2+x(PO4)3 is significantly improved than that of Na3+3xV2−x(PO4)3. However, both the high rate performance and cycling stability need further improved, especially the capacity decreased fast even after 300 cycles. High-energy ball milling has been widely used in the field of LIBs and SIBs.30,31 The ball milling process results in an intimate mixture of reactants in a short time and creates fresh surfaces with defects on the surface of the powders, resulting in the modification of the electrochemical performance of electrode material.32,33 In addition, the ball milling process represents a low cost process with high flexibility for the manufacture of nano-structured composites. Yaoqin Hu et al. compared LiFePO4 cathode synthesized by sol–gel and ball milling method and found that ball milled LiFePO4 has higher discharge capacity during galvanostatic cycling at low to moderate discharge rates.34 Furthermore, Mobinul Islam et al. obtained improved performance of porous LiFePO4/C as cathode in LIBs processed by high-energy ball milling comparison with conventional ball milling method.35 Previously, we have demonstrated that the incorporation of high-energy ball milling can significantly improve the electrochemical performance of the cathode materials Li3−3xV2+x(PO4)3 for LIBs.36–38 Thus, in this work, we adopt the high-energy ball milling to prepare the off-stoichiometric Na3−3xV2+x(PO4)3. The higher rate performances and more stable cycle properties have been achieved, which is attributed to the decreased internal resistance and increase of Na+ ion diffusion coefficient.
2. Experimental
2.1. Synthesis of Na3−3xV2+x(PO4)3 (x = 0–0.10) composites (NVP-x)
NVP-x composites were synthesized by solid state reaction. 5 mmol NVP-x composites were synthesized by mixing Na2CO3 (AR, ≥99.8%), NH4VO3 (AR, ≥99.0%), NH4H2PO4 (AR, ≥99.0%) and citric acid (AR, ≥99.5%) with molar ratio of 1.5–1.5x![[thin space (1/6-em)]](https://www.rsc.org/images/entities/char_2009.gif) :
:![[thin space (1/6-em)]](https://www.rsc.org/images/entities/char_2009.gif) 2 + x
2 + x![[thin space (1/6-em)]](https://www.rsc.org/images/entities/char_2009.gif) :
:![[thin space (1/6-em)]](https://www.rsc.org/images/entities/char_2009.gif) 3
3![[thin space (1/6-em)]](https://www.rsc.org/images/entities/char_2009.gif) :
:![[thin space (1/6-em)]](https://www.rsc.org/images/entities/char_2009.gif) 2 (For NVP-0, 0.7949 g Na2CO3, 1.1698 g NH4VO3, 1.7253 g NH4H2PO4 and 2.1014 g citric acid; for NVP-0.05, 0.7552 g Na2CO3, 1.1990 g NH4VO3, 1.7253 g NH4H2PO4 and 2.1014 g citric acid; for NVP-0.10, 0.7154 g Na2CO3, 1.2283 g NH4VO3, 1.7253 g NH4H2PO4 and 2.1014 g citric acid). Then the mixtures were blended and high-energy ball milled for 30 minutes in ethanol media. The mixtures were dried at 80 °C for 12 h and then transferred to a quartz tubular furnace and heated at 400 °C for 6 hours in Ar flow. After that, the precursors were high-energy ball milled again, and finally calcined at 750 °C for 8 hours in Ar flow.
2 (For NVP-0, 0.7949 g Na2CO3, 1.1698 g NH4VO3, 1.7253 g NH4H2PO4 and 2.1014 g citric acid; for NVP-0.05, 0.7552 g Na2CO3, 1.1990 g NH4VO3, 1.7253 g NH4H2PO4 and 2.1014 g citric acid; for NVP-0.10, 0.7154 g Na2CO3, 1.2283 g NH4VO3, 1.7253 g NH4H2PO4 and 2.1014 g citric acid). Then the mixtures were blended and high-energy ball milled for 30 minutes in ethanol media. The mixtures were dried at 80 °C for 12 h and then transferred to a quartz tubular furnace and heated at 400 °C for 6 hours in Ar flow. After that, the precursors were high-energy ball milled again, and finally calcined at 750 °C for 8 hours in Ar flow.
2.2. Structural characterizations
X-ray diffraction (XRD, Rigaku Smartlab3) was employed to characterize the structural properties of the samples. Scanning electron microscope (SEM) and transmission electron microscope (TEM) images were recorded by FEI Inspect F50 equipped with an energy dispersive X-ray spectroscope (EDS) and FEI Tecnai F20, respectively. X-ray photoelectron spectroscopy (XPS) was carried out by an X-ray photoelectron spectrometer (ThermoFisher SCIENTIFIC) with Al Kα X-ray source (hv = 1486.6 eV).
2.3. Electrochemical characterizations
The electrochemical performances were measured using CR2025 coin cells assembled in a glove box filled with high pure argon gas. The electrodes were prepared by putting the mixture of 80 wt% NVP-x, 10 wt% acetylene black and 10 wt% polyvinylidene fluoride (PVDF) binder in an appropriate amount of N-methylpyrrolidone (NMP). The slurry of mixture was coated onto an aluminum foil by a manually adjustable film-coating equipment and then dried in a vacuum oven for 12 hours at 120 °C. Pure sodium metal was used as anode, glass fiber membrane as separator, 1 mol L−1 NaClO4 in ethylene carbonate (EC): propylene carbonate (PC) (1![[thin space (1/6-em)]](https://www.rsc.org/images/entities/char_2009.gif) :
:![[thin space (1/6-em)]](https://www.rsc.org/images/entities/char_2009.gif) 1 v/v ratio) as the electrolyte. Galvanostatic charging/discharging tests were measured at a voltage window of 2.3–3.9 V (vs. Na/Na+) on a NEWARE battery testing system at room temperature. Cyclic voltammetry (CV) and electrochemical impedance spectroscopy (EIS) spectra were tested with CHI 660A electrochemical analyzer workstation (Chenhua, Shanghai, China).
1 v/v ratio) as the electrolyte. Galvanostatic charging/discharging tests were measured at a voltage window of 2.3–3.9 V (vs. Na/Na+) on a NEWARE battery testing system at room temperature. Cyclic voltammetry (CV) and electrochemical impedance spectroscopy (EIS) spectra were tested with CHI 660A electrochemical analyzer workstation (Chenhua, Shanghai, China).
3. Results and discussion
The XRD patterns of NVP-x (x = 0–0.10) are shown in Fig. 1a. All the diffraction peaks can be indexed to the rhombohedral NVP phase (PDF#53-0018), agreeing well with the previously reported literatures.13 No other phases appear in NVP-x (x = 0–0.10), confirming the high phase purity. It is observed that a slight shift to smaller angle of diffraction peaks with increasing the deficient Na and excess V concentrations (Fig. 1b), indicating the slight expansion of unit cell. The cell parameters are calculated to be a = 8.717 Å, c = 21.808 Å, V = 1435.2 Å3 for NVP-0, and a = 8.726 Å, c = 21.814 Å, V = 1438.4 Å3 for NVP-0.05 and a = 8.748 Å, c = 21.858 Å, V = 1448.7 Å3 for NVP-0.10 (Table 1). This slight expansion of lattice may make the Na+ ions diffusion into and out of NVP-x particles smoother, inducing the increase of ionic mobility and enhancement of high-rate charge–discharge characteristics. However, the excess V ions may locate at the interstitial sites, instead of the lattice sites, which will impede the transportation of Na+ ions and the deterioration of high-rate charge–discharge characteristics. These two effects may compete with each other and contribute to the cell performance.
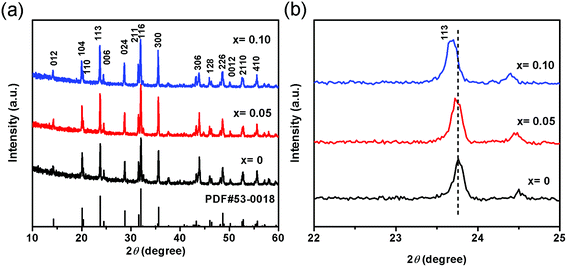 |
| | Fig. 1 (a) XRD patterns of NVP-x, (b) enlarged view of diffraction peaks, dashed line marks the position of peak from NVP-0 and shows the shift to smaller angles with increasing x. | |
Table 1 Lattice parameters of NVP-x (x = 0–0.10)
| Sample |
a (Å) |
b (Å) |
c (Å) |
V (Å3) |
| NVP-0 |
8.717 |
8.717 |
21.808 |
1435.2 |
| NVP-0.05 |
8.726 |
8.726 |
21.814 |
1438.4 |
| NVP-0.10 |
8.748 |
8.748 |
21.858 |
1448.7 |
Morphological study on NVP-x (x = 0–0.10) has been performed by SEM, and the images are shown in Fig. 2. No significant difference can be seen and all samples show good uniformity in particle shape and size. TEM was conducted to further study the particle morphologies of NVP-x nanocomposites, shown in Fig. 3a–c. It can be seen that the particle size is in a broad range, and the biggest particle sizes of all samples are about 500 nm. No significant dependence on the off-stoichiometric concentration is observed. All the NVP-x particles are separated by amorphous carbon shells with thickness of around 3 nm (Fig. 3d–f). The HRTEM images (Fig. 3g–i) show clear lattice fringes with d spacing of 0.3414, 0.2772 and 0.3831 nm, which correspond to the (024), (116) and (113) planes of rhombohedral NVP, respectively. EDS results of NVP-x particles are shown in Table 2. It is observed that the actual Na/V, Na/P and V/P ratio are close to that of designed Na/V, Na/P and V/P ratio.
 |
| | Fig. 2 SEM images of NVP-x, (a) x = 0, (b) x = 0.05, (c) x = 0.10. | |
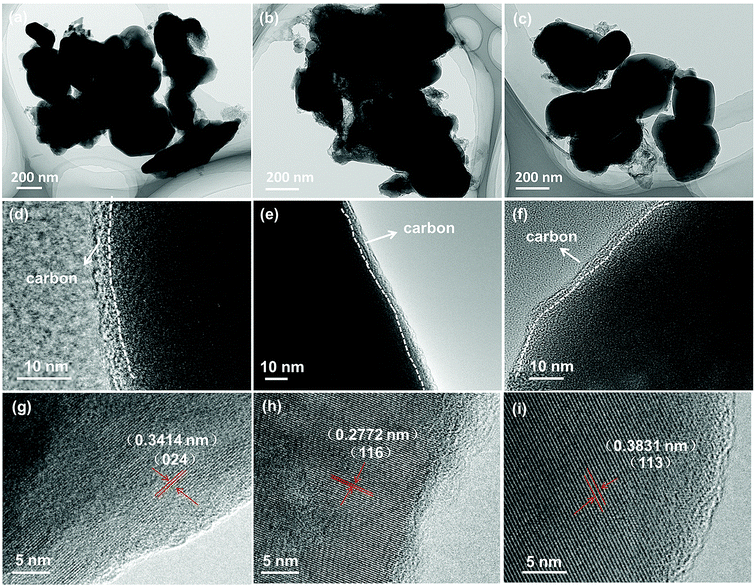 |
| | Fig. 3 TEM images of NVP-x under different magnifications, (a, d and g) x = 0, (b, e and h) x = 0.05, (c, f and i) x = 0.10. | |
Table 2 Na/V, Na/P, and V/P ratios of NVP-x (x = 0–0.10)
| Samples NVP-x |
Na/V |
Na/P |
V/P |
| Calculated ratio |
Measured ratio |
Calculated ratio |
Measured ratio |
Calculated ratio |
Measured ratio |
| x = 0 |
1.50 |
1.48 |
1.00 |
1.02 |
0.67 |
0.69 |
| x = 0.05 |
1.39 |
1.31 |
0.95 |
1.00 |
0.68 |
0.70 |
| x = 0.10 |
1.29 |
1.29 |
0.90 |
0.93 |
0.70 |
0.72 |
XPS was conducted to probe the valence state of V in NVP-x. V 2p XPS peaks of NVP-x of various x are shown in Fig. 4a. Two peaks at 515.93 eV and 523.16 eV can be observed for NVP-0, which are attributed to V 2p3/2 and V 2p1/2, respectively. The binding energies are ascribed to V3+, in well agreement with previous reported Na3V2(PO4)3.39 It is observed that V 2p peaks of NVP-0.05 and NVP-0.10 shift to higher binding energy, compared with that of NVP-0, indicating that the valence state of V transfers from V3+ to V4+, which is related to the vanadium locating in a different local environment.40 Since P keeps the valence state of +5, no shift of binding energy can be observed, as shown the XPS spectra in Fig. S1 (ESI†). XPS spectrum of C 1s is shown in Fig. 4b. The similar XPS spectra of C1s for NVP-x (x = 0–0.10) indicates the similar structure of residual carbon, which is not affected by off-stoichiometric composition. Therefore, the effect of residual carbon on electrochemical properties can be ignored.
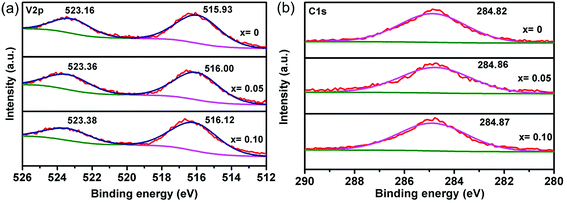 |
| | Fig. 4 XPS core level spectra of NVP-x (x = 0–0.10), (a) V 2p, (b) C 1s. | |
The electrochemical properties of NVP-x (x = 0–0.10) electrodes were performed by using 2025 coin half cells at room temperature. Fig. 5a shows the galvanostatic charge/discharge profiles of the NVP-x electrodes in the voltage range from 2.3 to 3.9 V vs. Na+/Na at 1C. It exhibits a pair of plateaus with operating voltages at ca. 3.43 and 3.34 V for charge and discharge for NVP-0. This pair of plateaus has been considered as the insertion or extraction of Na+ ions from the eight-fold coordination sites, accompanying with the reversible oxidation of the V3+/V4+ redox couple.41 Additional discharge plateau is shown in Fig. 5a, which is attributed to the complete insertion of Na ions and these two reduction reactions are consistent with the CV results.42 The capacity of NVP-0.05 is 112.4 mA h g−1 at 1C, which is about 96% of the theoretical value (117.6 mA h g−1).7 On the contrary, the discharge capacities of NVP-0 and NVP-0.10 are 97.2 and 104.2 mA h g−1, respectively. Fig. 5b shows the rate performance comparisons of the three nanocomposite electrodes. When cycled at a rate of 0.5C in the window of 2.3–3.9 V, the initial discharge capacity of NVP-0.05 is 114.9 mA h g−1, much higher than that of the other two. The NVP-0.05 cathode exhibits the smallest capacity decay at each rate. Even at 20C, a discharge capacity of 92.3 mA h g−1 (79% of the theoretical capacity) is still delivered, much higher than that of NVP-0 cathode (84.9 mA h g−1), indicating the good high-rate electrochemical performance. After rapid changes of the current rate, the NVP-0.05 cathode shows stable capacities at each state. When rate comes back to 0.5C, the capacity of 108.2 mA h g−1 for NVP-0.05 cathode is recovered. Long-term cycling stabilities of samples are subsequently shown in Fig. 5c and d. The NVP-0.05 cathode shows an initial discharge capacity of 112.4 mA h g−1, and delivers a remarkable capacity of 109.5 mA h g−1 after 100 cycles at 1C, corresponding to capacity retention of 97%. Even after 500 cycles at 5C, the specific capacity of NVP-0.05 is still as high as 100.7 mA h g−1, which maintains 95% of its initial capacity. A comparison between our work and the related works is listed in Table 3. It can be clearly seen that the incorporation of high-energy ball milling during the sample preparation significantly improve the high rate performance and cycle stability. SEM experiments were done to compare the morphological changes of the NVP-x electrodes before cycling and after 100 cycles at 1C. As shown in Fig. S2 (ESI†), there is no apparent difference among the SEM images of the electrode before cycling and after 100 cycles at 1C. Before cycling, a compact electrode consisting of the NVP-x particles and acetylene black are observed. After 100 cycles at 1C, the electrodes still maintain integral. Thus, the results suggested that the structures of NVP-x are stable and the amorphous carbons are helpful to assist in buffering volume change of Na ion insertion/extraction.
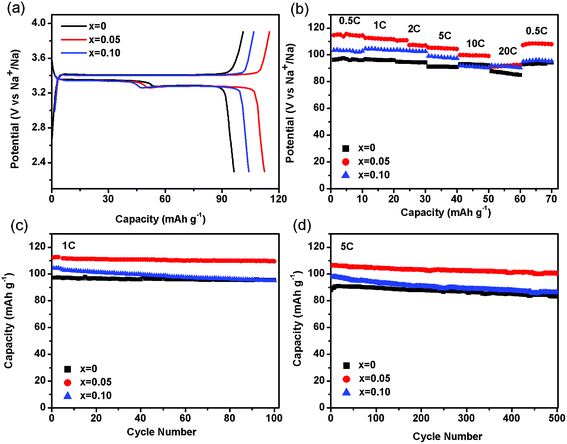 |
| | Fig. 5 (a) Charge/discharge profiles of the NVP-x (x = 0–0.10) electrodes at 1C. (b) Rate performance of NVP-x (x = 0–0.10). Life cycling performance of NVP-x (x = 0–0.10) at 1C (c), 5C (d). | |
Table 3 A comparison between our work and the related works
| Sample |
2C |
5C |
20C |
Cycle number |
References |
| Specific capacity(mA h g−1) 2.3–3.9 V before (after cycles) |
| Na3+3xV2-x(PO4)3 made by sol–gel |
95 |
88 |
74(67) |
400 |
28 |
| Na3-3xV2+x(PO4)3 made by sol–gel |
105(75) |
96 |
70 |
300 |
29 |
| Na3-3xV2+x(PO4)3 made by ball mill |
107 |
106(101) |
92 |
500 |
This work |
| Na3V2(PO4)3/C made by self-combustion |
— |
82 |
65 |
— |
45 |
| Porous Na3V2(PO4)3/C made by sol–gel |
— |
98(87) |
— |
100 |
43 |
| Na3V2(PO4)3 nanofiber made by electrospinning |
110(97) |
— |
— |
30 |
44 |
| Na3V2(PO4)3@C made by hydrothermal assisted sol–gel |
102 |
95(91) |
91 |
700 |
4 |
To further understand the relationship between electrode kinetics for NVP-x nanocomposites and electrochemical performance, CV and EIS were carried out. The CV profiles of different scan rate for the NVP-x (x = 0–0.10) sodium-ion battery without pre-cycling are displayed in Fig. 6 in the voltage range 2.3–3.9 V vs. Na/Na+. The reduction (Na+ insertion) peaks and oxidation (Na+ extraction) peaks are located at 3.1 and 3.7 V, respectively.45,46 The current of NVP-0.05 is the highest among the three samples, implying its highest reversibility and fastest kinetics during electrochemical reaction. The correlations between the peak current densities Ip and the square root of the scan rate v1/2 as presented in Fig. 6d, indicate a diffusion-controllable process for electrode reaction. The corresponding Na+ ion diffusion coefficients DNa+ of the three electrodes are calculated by the Randles–Sevcik equation:45
| Ip = 2.69 × 10⁵n3/2AC0D1/2v1/2 |
where
Ip is the peak current,
n is the number of electrons transferred of the reaction,
A is the surface area of the electrode,
C0 is the bulk concentration of sodium ions in the electrode (2.35 × 10
−3 mol cm
−3),
D is the diffusion coefficient of Na
+, and
v is the scanning rate. From the slope of the fitting line, the apparent diffusion coefficient
D of NVP-0.05 is 1.77 × 10
−9 cm
2 s
−1, higher than those of NVP-0 (1.00 × 10
−9 cm
2 s
−1) and NVP-0.10 (1.23 × 10
−9 cm
2 s
−1), respectively.
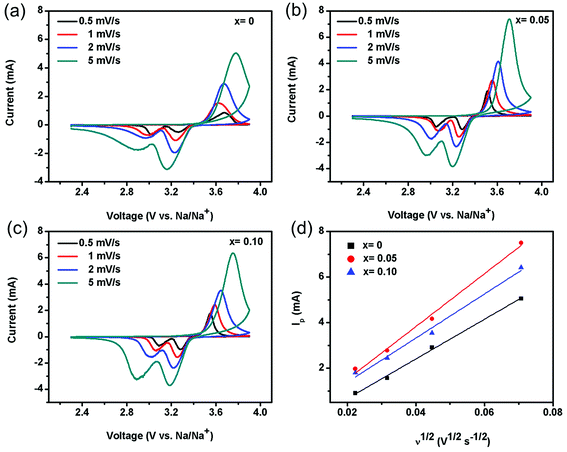 |
| | Fig. 6 Cyclic voltammogram of NVP-x (a) x = 0, (b) x = 0.05, (c) x = 0.10 at different scan rates, (d) linear fitting of Ip vs. v1/2 curves. | |
Fig. 7 shows Nyquist plots of impedance. The impedance spectra of all electrodes consist of a single depressed semicircle in the high frequency region and an inclined line at low frequency, representing the charge-transfer resistance (Rct) and the solid-state diffusion of ions in the active materials, respectively. The NVP-0.05 electrode shows the smallest diameter for semicircle in the Nyquist plots than those of NVP-0 and NVP-0.10, indicating the lowest Rct and better electronic conductivity. The fitting parameters are shown in Table 4.
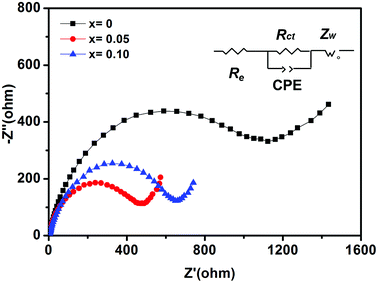 |
| | Fig. 7 Nyquist plots of NVP-x (x = 0–0.10) before cycles. | |
Table 4 Fitting parameters of NVP-x (x = 0–0.10)
| Samples |
Re |
Rct |
| NVP-0 |
4.704 |
1040 |
| NVP-0.05 |
3.807 |
441.5 |
| NVP-0.10 |
3.943 |
645.4 |
Thus, the excellent electrochemical performance of NVP-0.05 is ascribed to the increased Na+ ion conductivity and decreased resistance. Firstly, lattice volume expansion may make the Na+ ions diffusion into and out of NVP-0.05 particles easier, leading to the increase of ionic mobility and enhancement of high-rate charge–discharge characteristics. With increasing V excess to 0.10, though the lattice expansion is larger, too many V ions locate at the interstitial sites instead of lattice sites will impede the transportation of Na+ ions, leading to the deterioration of electrochemical performance. Secondly, the Na deficiency and V excess may increase the valence state of V ions from +3 towards +4. The proper tuning of the concentration of V3+ and V4+ may facilitate the electron transport between the V3+ and V4+ ions through the double exchange interaction, leading to the decrease of resistance.47 The above structural characterizations demonstrate that Na deficiency and V excess with x = 0.05 is the most appropriate which may induce the highest Na+ diffusion coefficient and electronic resistance, leading to the best cell performance.
4. Conclusions
In summary, we have developed a simple method using high-energy ball milling to prepare off-stoichiometric Na3−3xV2+x(PO4)3/C (x = 0–0.10) nanocomposites with excellent high rate and cycle performance. Among them, Na3−3xV2+x(PO4)3/C nanocomposites with x = 0.05 exhibit the best battery performance. The capacity of NVP-0.05 is 112.4 mA h g−1 at 1C, which is about 96% of its theoretical value. Long-term cycling performance is conducted at the rate of 5C. Even after 500 cycles, the specific capacity of NVP-0.05 is still as high as 100.7 mA h g−1, which maintains 95% of its initial capacity. The significant improved electrochemical performance of NVP-0.05 has been characterized to be due the decrease of internal resistance and increase of Na+ ion diffusion coefficient.
Conflicts of interest
There are no conflicts to declare.
Acknowledgements
This work is supported by the National Key R&D Program of China (2017YFB1103500), National Natural Science Foundation of China (51771053, 51471085, 51407029), the Natural Science Foundation of Jiangsu Province of China (BK20151400), Scientific Research Foundation of Graduate School of Southeast University, the Fundamental Research Funds for the Central Universities, and the open research fund of Key Laboratory of MEMS of Ministry of Education, Southeast University.
References
- V. Palomares, P. Serras, I. Villaluenga, K. B. Hueso, J. C. González and T. Rojo, Energy Environ. Sci., 2012, 5, 5884–5901 Search PubMed.
- Z. Jian, W. Han, X. Lu, H. Yang, Y. Hu, J. Zhou, Z. Zhou, J. Li, W. Chen, D. Chen and L. Chen, Adv. Energy Mater., 2013, 3, 156–160 CrossRef.
- Q. Zheng, W. Liu, X. Li, H. Zhang, K. Feng and H. Zhang, J. Mater. Chem. A, 2016, 4, 19170–19178 Search PubMed.
- W. Duan, Z. Zhu, H. Li, Z. Hu, K. Zhang, F. Cheng and J. Chen, J. Mater. Chem. A, 2014, 2, 8668–8675 Search PubMed.
- P. Nie, Y. Zhu, L. Shen, G. Pang, G. Xu, S. Dong, H. Dou and X. Zhang, J. Mater. Chem. A, 2014, 2, 18606–18612 Search PubMed.
- Z. Jian, C. Yuan, W. Han, X. Lu, L. Gu, X. Xi, Y. Hu, H. Li, W. Chen, D. Chen, Y. Ikuhara and L. Chen, Adv. Funct. Mater., 2014, 24, 4265–4272 CrossRef.
- Y. Jiang, Z. Yang, W. Li, L. Zeng, F. Pan, M. Wang, X. Wei, G. Hu, L. Gu and Y. Yu, Adv. Energy Mater., 2015, 1402104 CrossRef.
- Q. Ni, Y. Bai, F. Wu and C. Wu, Adv. Sci., 2017, 1600275 CrossRef PubMed.
- S. Li, Y. Dong, L. Xu, X. Xu, L. He and L. Mai, Adv. Mater., 2014, 26, 3545–3553 CrossRef PubMed.
- Q. An, F. Xiong, Q. Wei, J. Sheng, L. He, D. Ma, Y. Yao and L. Mai, Adv. Energy Mater., 2015, 1401963 CrossRef.
- Q. Zhang, W. Wang, Y. Wang, P. Feng, K. Wang, S. Cheng and K. Jiang, Nano Energy, 2016, 20, 11–19 CrossRef.
- K. Saravanan, C. W. Mason, A. Rudola, K. H. Wong and P. Balaya, Adv. Energy Mater., 2013, 3, 444–450 CrossRef.
- Y. Xu, Q. Wei, C. Xu, Q. Li, Q. An, P. Zhang, J. Sheng, L. Zhou and L. Mai, Adv. Energy Mater., 2016, 1600389 CrossRef.
- Y. H. Jung, C. H. Lim and D. K. Kim, J. Mater. Chem. A, 2013, 1, 11350–11354 Search PubMed.
- W. Zhang, Y. Liu, C. Chen, Z. Li, Y. Huang and X. Hu, Small, 2015, 11, 3822–3829 CrossRef PubMed.
- X. Rui, W. Sun, C. Wu, Y. Yu and Q. Yan, Adv. Mater., 2015, 27, 6670–6676 CrossRef PubMed.
- C. Zhu, K. Song, P. A. van Aken, J. Maier and Y. Yu, Nano Lett., 2014, 14, 2175–2180 CrossRef PubMed.
- J. Yang, D. Han, M. R. Jo, K. Song, Y. Kim, S. Chou, H. Liu and Y. Kang, J. Mater. Chem. A, 2015, 3, 1005–1009 Search PubMed.
- S. Li, P. Ge, C. Zhang, W. Sun, H. Hou and X. Ji, J. Power Sources, 2017, 366, 249–258 CrossRef.
- H. Chen, B. Zhang, X. Wang, P. Dong, H. Tong, J. Zheng, W. Yu and J. Zhang, ACS Appl. Mater. Interfaces, 2018, 10, 3590–3595 Search PubMed.
- Y. Zhao, X. Cao, G. Fang, Y. Wang, H. Yang, S. Liang, A. Pan and G. Cao, Chem. Eng. J., 2018, 339, 162–169 CrossRef.
- H. Li, X. Yu, Y. Bai, F. Wu, C. Wu, L. Liu and X. Yang, J. Mater. Chem. A, 2015, 3, 9578–9586 Search PubMed.
- M. J. Aragón, P. Lavela, R. Alcántara and J. L. Tirado, Electrochim. Acta, 2015, 180, 824–830 CrossRef.
- A. Inoishi, T. Omuta, E. Kobayashi, A. Kitajou and S. Okada, Adv. Mater. Interfaces, 2017, 1600942 CrossRef.
- M. J. Aragón, P. Lavela, G. F. Ortiz and J. L. Tirado, J. Electrochem. Soc., 2015, 162, 3077–3083 CrossRef.
- Q. Zheng, H. Yi, W. Liu, X. Li and H. Zhang, Electrochim. Acta, 2017, 238, 288–297 CrossRef.
- B. Kang and G. Ceder, Nature, 2009, 458, 190–193 CrossRef PubMed.
- M. J. Aragón, P. Lavela, G. F. Ortiz, R. Alcántara and J. L. Tirado, Chem. - Eur. J., 2017, 23, 1–9 CrossRef PubMed.
- M. J. Aragón, P. Lavela, G. F. Ortiz, R. Alcántara and J. L. Tirado, Inorg. Chem., 2017, 56, 11845–11853 CrossRef PubMed.
- B. Zhang, R. Dugas, G. Rousse, P. Rozier, A. M. Abakumov and J. Tarascon, Nat. Commun., 2016, 7, 1–9 Search PubMed.
- J. Kim, G. Cheruvally and J. Ahn, J. Solid State Electrochem., 2008, 12, 799–805 CrossRef.
- M. E. Rabanal, M. C. Gutierrez, F. Garcia-Alvarado, E. C. Gonzalo and M. E. Arroyo-de Dompablo, J. Power Sources, 2006, 160, 523–528 CrossRef.
- V. Ayyavu, N. Chandrasekar and K. Sinnaeruvadi, Part. Sci. Technol., 2016, 2, 134–142 CrossRef.
- Y. Hu, M. M. Doeff, R. Kostecki and R. Fiñones, J. Electrochem. Soc., 2004, 151, A1279–A1285 CrossRef.
- M. Islam, S. Ur and M. Yoon, Curr. Appl. Phys., 2015, 15, 541–546 CrossRef.
- P. Sun, S. Qin, X. Wang, R. An, Q. Xu, X. Cui, Y. Sun, S. Wang, P. Wang and Q. Fan, J. Power Sources, 2015, 293, 922–928 CrossRef.
- P. Sun, X. Wang, K. Zhu, X. Chen, X. Cui, Q. Xu, D. Su, Q. Fan and Y. Sun, RSC Adv., 2017, 7, 3101–3107 RSC.
- P. Sun, N. Su, Y. Wang, Q. Xu, Q. Fan and Y. Sun, RSC Adv., 2017, 7, 32721–32726 RSC.
- Y. Lu, L. Wang, J. Song, D. Zhang, M. Xu and J. B. Goodenough, J. Mater. Chem. A, 2013, 1, 68–72 Search PubMed.
- L. Xiong, Y. Wang, Y. Wu, W. Liu and Z. He, Ionics, 2015, 21, 2471–2476 CrossRef.
- H. Li, X. Bi, Y. Bai, Y. Yuan, R. S. Yassar, C. Wu, F. Wu, J. Lu and K. Amine, Adv. Mater. Interfaces, 2016, 1500740 CrossRef.
- T. Wei, G. Yang and C. Wang, Nano Energy, 2017, 39, 363–370 CrossRef.
- W. Shen, C. Wang, H. Liu and W. Yang, Chem. - Eur. J., 2013, 19, 14712–14718 CrossRef PubMed.
- H. Li, Y. Bai, F. Wu, Y. Li and C. Wu, J. Power Sources, 2015, 273, 784–792 CrossRef.
- H. Wang, D. Jiang, Y. Zhang, G. Li, X. Lan, H. Zhong, Z. Zhang and Y. Jiang, Electrochim. Acta, 2015, 155, 23–28 CrossRef.
- W. Song, X. Cao, Z. Wu, J. Chen, K. H. Fu, X. Wang, Y. Huang and X. Ji, Phys. Chem. Chem. Phys., 2014, 16, 17681–17687 RSC.
- C. Liu, S. Tsai, C. Ni and K. Fung, J. Electron. Mater., 2017, 46, 2301–2308 CrossRef.
Footnote |
| † Electronic supplementary information (ESI) available. See DOI: 10.1039/c8ra02843e |
|
| This journal is © The Royal Society of Chemistry 2018 |
Click here to see how this site uses Cookies. View our privacy policy here.  Open Access Article
 a,
Yuanting Wanga,
Xiuzhen Wanga,
Qingyu Xu
 *ab,
Qi Fan*c and
Yueming Sunc
![[thin space (1/6-em)]](https://www.rsc.org/images/entities/char_2009.gif) :
:![[thin space (1/6-em)]](https://www.rsc.org/images/entities/char_2009.gif) 2 + x
2 + x![[thin space (1/6-em)]](https://www.rsc.org/images/entities/char_2009.gif) :
:![[thin space (1/6-em)]](https://www.rsc.org/images/entities/char_2009.gif) 3
3![[thin space (1/6-em)]](https://www.rsc.org/images/entities/char_2009.gif) :
:![[thin space (1/6-em)]](https://www.rsc.org/images/entities/char_2009.gif) 2 (For NVP-0, 0.7949 g Na2CO3, 1.1698 g NH4VO3, 1.7253 g NH4H2PO4 and 2.1014 g citric acid; for NVP-0.05, 0.7552 g Na2CO3, 1.1990 g NH4VO3, 1.7253 g NH4H2PO4 and 2.1014 g citric acid; for NVP-0.10, 0.7154 g Na2CO3, 1.2283 g NH4VO3, 1.7253 g NH4H2PO4 and 2.1014 g citric acid). Then the mixtures were blended and high-energy ball milled for 30 minutes in ethanol media. The mixtures were dried at 80 °C for 12 h and then transferred to a quartz tubular furnace and heated at 400 °C for 6 hours in Ar flow. After that, the precursors were high-energy ball milled again, and finally calcined at 750 °C for 8 hours in Ar flow.
2 (For NVP-0, 0.7949 g Na2CO3, 1.1698 g NH4VO3, 1.7253 g NH4H2PO4 and 2.1014 g citric acid; for NVP-0.05, 0.7552 g Na2CO3, 1.1990 g NH4VO3, 1.7253 g NH4H2PO4 and 2.1014 g citric acid; for NVP-0.10, 0.7154 g Na2CO3, 1.2283 g NH4VO3, 1.7253 g NH4H2PO4 and 2.1014 g citric acid). Then the mixtures were blended and high-energy ball milled for 30 minutes in ethanol media. The mixtures were dried at 80 °C for 12 h and then transferred to a quartz tubular furnace and heated at 400 °C for 6 hours in Ar flow. After that, the precursors were high-energy ball milled again, and finally calcined at 750 °C for 8 hours in Ar flow.
![[thin space (1/6-em)]](https://www.rsc.org/images/entities/char_2009.gif) :
:![[thin space (1/6-em)]](https://www.rsc.org/images/entities/char_2009.gif) 1 v/v ratio) as the electrolyte. Galvanostatic charging/discharging tests were measured at a voltage window of 2.3–3.9 V (vs. Na/Na+) on a NEWARE battery testing system at room temperature. Cyclic voltammetry (CV) and electrochemical impedance spectroscopy (EIS) spectra were tested with CHI 660A electrochemical analyzer workstation (Chenhua, Shanghai, China).
1 v/v ratio) as the electrolyte. Galvanostatic charging/discharging tests were measured at a voltage window of 2.3–3.9 V (vs. Na/Na+) on a NEWARE battery testing system at room temperature. Cyclic voltammetry (CV) and electrochemical impedance spectroscopy (EIS) spectra were tested with CHI 660A electrochemical analyzer workstation (Chenhua, Shanghai, China).


