
 Open Access Article
 This Open Access Article is licensed under a Creative Commons Attribution-Non Commercial 3.0 Unported Licence
The contribution of Eu3+ doping concentration on the modulation of morphology and luminescence properties of InVO4:Eu3+
Yinyan Li and
Shiqing Xu*
and
Shiqing Xu*
College of Materials Science and Engineering, China Jiliang University, Hangzhou 310018, China. E-mail: sxucjlu@163.com; Fax: +86 571 28889527; Tel: +86 571 86835781
First published on 12th September 2018
Abstract
Nanostructures of InVO4 and InVO4:Eu3+ were synthesized through a hydrothermal method with a post annealing process. The morphology and luminescence properties of InVO4:xEu3+ can be modulated by Eu3+ ion doping concentration. SEM and (HR)TEM studies indicated that different sizes of nanoparticles were obtained when the Eu3+ ion concentration ranged from 2 mol% to 30 mol%, and middle-concave nanodisks or nanoparticles with different sizes were obtained with the Eu3+ ion concentration ranging from 35 mol% to 45 mol%. Luminescence property studies indicated that the photoluminescence emission originated both from VO43− and Eu3+, and the emission of VO43− was blue shifted, affected by the doped Eu3+ ions. The CIE chromaticity diagram of Eu3+-doped indium vanadate exhibited green, blue-green, red, giving especially white light emission.
1 Introduction
Nowadays, materials on the mesoscopic scale are being paid more and more attention.1 Nano-size materials with uniform morphology usually have different special characteristics, such as their magnetism, optics, conductivity and so on, due to small size effects and the specific effect of large surface area.2,3 As we all know, InVO4 is a semiconductor with a narrow band gap. The photoluminescence properties of InVO4 have previously been studied.4 Since the morphology of nanomaterials may have some important effects on their optical properties,5 it is important to investigate various morphologies of InVO4 in detail to obtain outstanding luminescent nanomaterials. However, nano-size InVO4 has been rarely investigated.6,7 Ai et al. synthesized nanocrystalline InVO4 hollow microspheres with an aerosol flow synthetic method,6 and other nano-sized indium vanadates have been synthesized by the sol–gel method and hydrothermal processes.7 In spite of these methods for synthesis of indium vanadate nano-/micro-materials, the size distribution and regularity of these materials can still be improved. The diversity of regular and dispersed nanostructures for indium vanadates still needs to be expanded to meet their desired potential applications.In addition, white-LEDs have attracted much attention in recent decades because of their properties of high brightness, long fluorescence lifetimes and environmental friendliness.8 Lanthanide ions are usually codoped with each other or with transition metals in a host lattice to obtain white light materials.9 It is very important to find a suitable host for lanthanide luminescent centers to give white emission. In this work, we found that different emission colors including white light could be achieved from different concentrations of Eu3+-doped InVO4 nanomaterials. First, Eu3+-doped indium vanadates were synthesized through a hydrothermal process with sodium citrate as a coordination agent. Nanostructures of the as-obtained InVO4:xEu3+ with different europium ion doping concentrations were investigated. The morphology and size of the nano-indium vanadates varied regularly with the variation of the Eu3+ doping concentration. Different sizes of nanoparticles, middle-concave nanoparticles and middle-concave nanodisks of InVO4:Eu3+ were obtained. Second, the photoluminescence properties of InVO4:Eu3+ were studied to reveal the different emission spectra with different Eu3+ doping concentration. The CIE chromaticity diagram of Eu3+-doped indium vanadate exhibited green, blue-green, red, giving especially white light emission, making this material a suitable candidate for optical LEDs.
2 Experimental section
2.1 Characterization
X-ray diffraction (XRD) patterns were collected on an X-ray diffractometer (Bruker Axs D2 PHASER diffractometer) with Cu Kα radiation (λ = 1.5405 Å). SEM images were recorded on a scanning electron microscope (SEM, JSM-5601). TEM images were recorded on a transmission electron microscope (TEM JSM 2100). The photoluminescence spectra were recorded on a PL3-211-P spectrometer (HORIBA Jobin Yvon, America) and a 450W xenon lamp was used as the excitation source. The luminescence quantum efficiency (Φ) was obtained by using BaSO4 as a reference.2.2 Synthesis
General method for synthesis of InVO4: 10 mL 0.1 mol L−1 NH4VO3 aqueous solution was introduced dropwise to a vigorously stirred 10 mL aqueous solution of 1 mmol In(NO3)3·5H2O. After addition, the mixture was stirred for 10 min, and a certain amount of sodium citrate was added to the suspension. The as-obtained yellow colloidal precipitate was transferred to a 50 mL autoclave, sealed, and heated at 150 °C for 15 h. After completion of the reaction time, the autoclave was then cooled to room temperature naturally. The products were washed three times with distilled water and centrifuged for 3 min at 10![[thin space (1/6-em)]](https://www.rsc.org/images/entities/char_2009.gif) 000 rpm. The washed powders were dried under vacuum at 60 °C. The final products were obtained by annealing at 900 °C in air for 6 h and used for further investigation. For different doping concentrations in InVO4:xEu3+, the same method was used with starting materials containing different proportions of In(NO3)3·5H2O and Eu(NO3)3·6H2O.
000 rpm. The washed powders were dried under vacuum at 60 °C. The final products were obtained by annealing at 900 °C in air for 6 h and used for further investigation. For different doping concentrations in InVO4:xEu3+, the same method was used with starting materials containing different proportions of In(NO3)3·5H2O and Eu(NO3)3·6H2O.
3 Results and discussion
3.1 Synthesis and structure
The nanostructures of indium vanadate or Eu3+-doped indium vanadate were synthesized by a hydrothermal method with a post annealing process. Indium(III) nitrate hydrate and ammonium vanadate were used as starting materials with sodium citrate as a complexing agent. The sodium citrate played an important role in the formation of the indium vanadate nanostructures. Control experiments without sodium citrate were carried out and irregularly shaped particles were obtained.Fig. 1 shows the XRD patterns of the annealed hydrothermal products of InVO4 and InVO4 doped with various concentrations of Eu3+. It indicates that the XRD of InVO4 shown in Fig. 1a can be easily indexed to orthorhombic InVO4 JCPDS: 71-1689. As the Eu3+ doping concentration increased, the XRD patterns showed a slight change to indicate Eu3+ was well-doped in the crystal lattices of InVO4, whose special obvious peaks are illustrated in Fig. 1. For lower doping concentrations, no obvious differences were found in the XRD patterns. When the doping-concentration of Eu3+ ions is higher than 10 mol% (Fig. 1b–d) the InVO4 phase still remains, but the full width at half maximum of these peaks broadens.
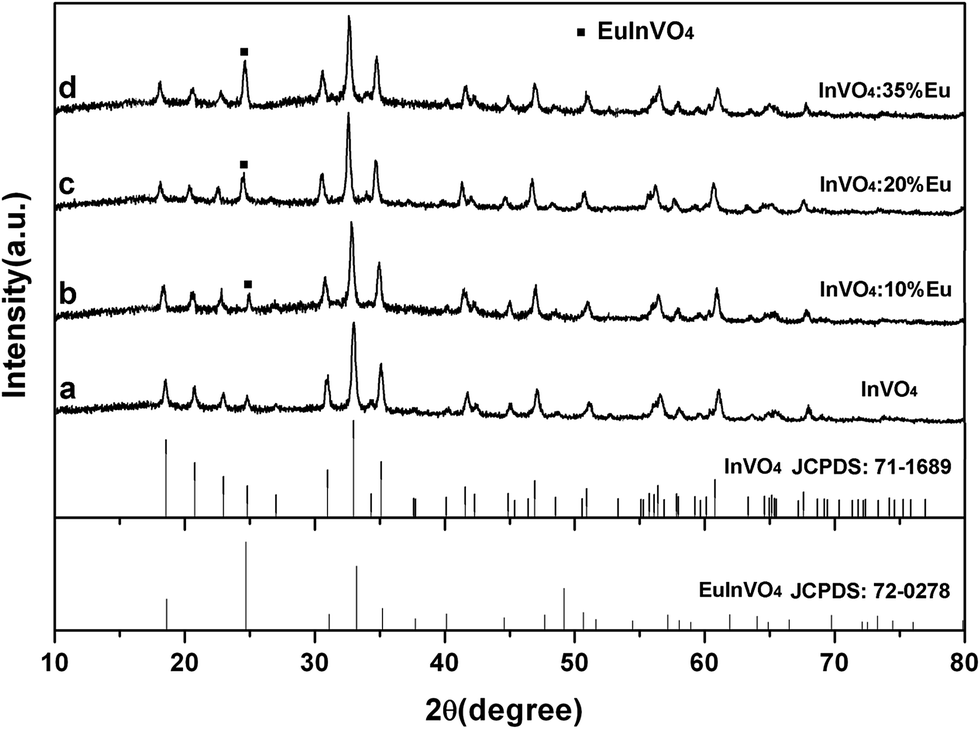 | ||
| Fig. 1 XRD patterns for InVO4 and InVO4:Eu3+. | ||
The morphologies of InVO4 and InVO4:Eu3+ were characterized by SEM and (HR)TEM. The results indicated that uniform and dispersed nanostructures were obtained through this method. The SEM micrograph of as-obtained InVO4 is shown in Fig. 2a. Regular nanoparticles with a diameter around 200 nm were formed. Fig. 3 shows the (HR)TEM and EDX results of as-obtained InVO4. The TEM image of InVO4 shown in Fig. 3a displays the same uniform nanoparticles as those in the SEM image (Fig. 2a). The HRTEM image (Fig. 3b) of the nanoparticles shows lattice fringes with interplanar spacing of 0.271 nm that corresponds to the (1 1 2) plane of the orthorhombic crystal structure of InVO4. The EDX in Fig. 3c clearly showed the composition of the InVO4 nanoparticles.
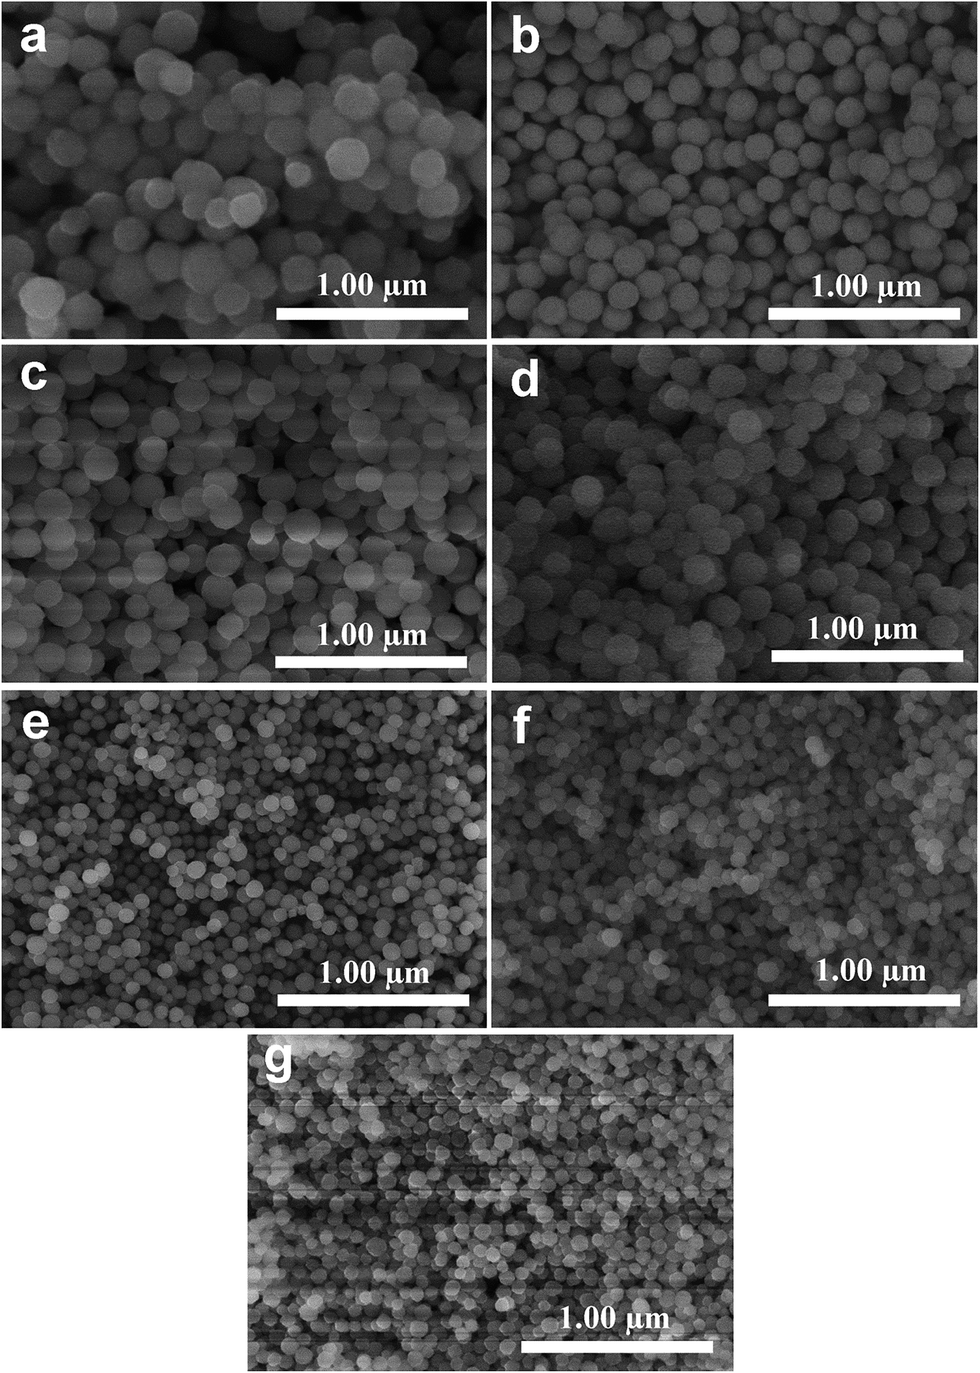 | ||
| Fig. 2 SEM images of InVO4 (a) and InVO4:xEu3+: 2 mol% (b); 5 mol% (c); 10 mol% (d); 15 mol% (e); 20 mol% (f); 30 mol% (g). | ||
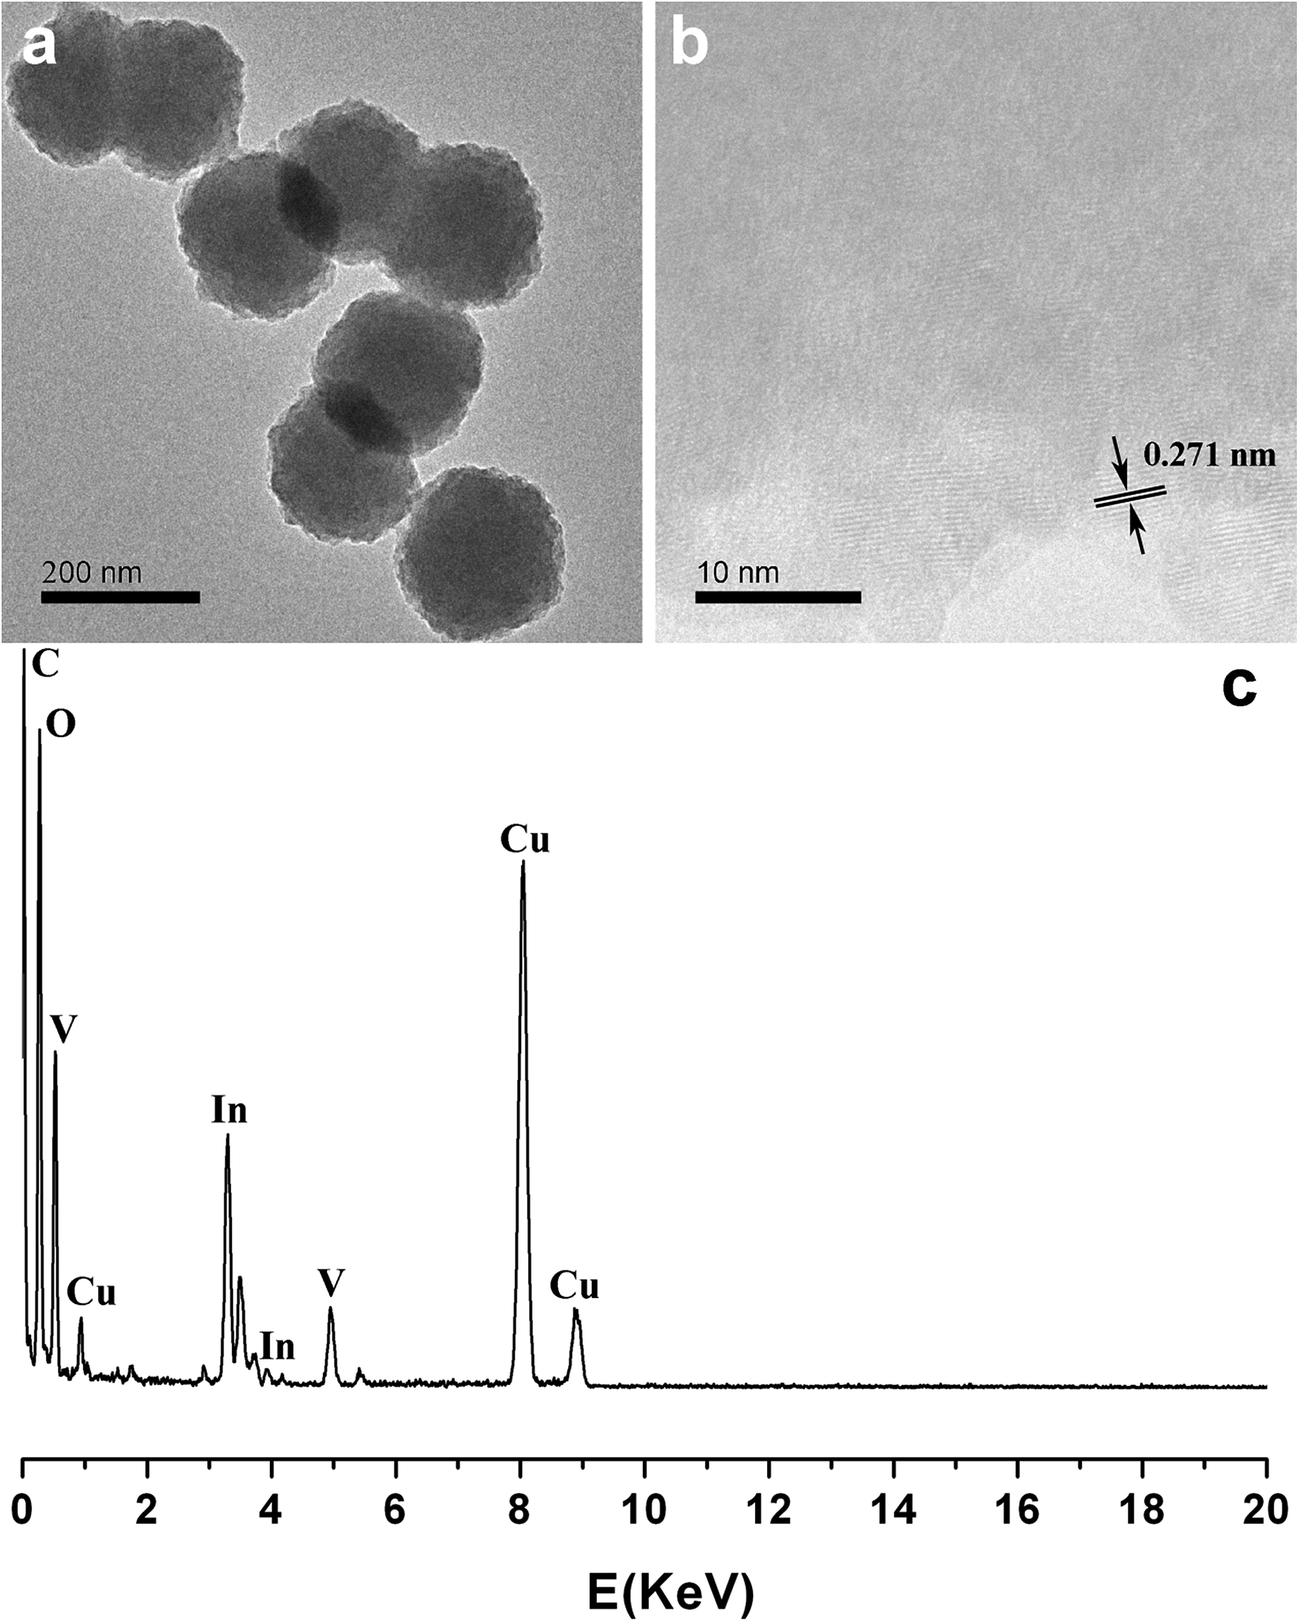 | ||
| Fig. 3 TEM (a), HRTEM (b) and EDX (c) images of InVO4. | ||
Fig. 2b–g show the SEM images of the InVO4 host doped with 2, 5, 10, 15, 20 and 30 mol% of Eu3+ ions. They are all uniform and dispersed nanoparticles. It is obvious that as the Eu3+ ion concentration increased from 2 mol% to 30 mol%, the InVO4:Eu3+ particle sizes decreased. The diameters of the nanoparticles with different Eu3+ ion concentrations are given in Table 1. Diameters of the particles decreased from 200 to 50 nm with increased Eu3+ ion concentration. This nanoparticle diameter trend can be attributed to the large difference in the ion radius between indium(III) ions and europium(III) ions, which is 0.8 Å for In3+ and 0.947 Å for Eu3+.10 The nanoparticle sizes were proven to be influenced by the nucleation and growth rates in the formation process of the nanostructures.5 The presence of large ion radius Eu3+ lowered the potential barrier for the formation of nuclei and slowed the growth rates which resulted in a decrease in nanoparticle size. This is in good accordance with the nanoparticle diameter trend seen in the SEM results. In addition, slight aggregation of the calcined nano-InVO4 can also be observed (Fig. 2a), while the increased doping of Eu3+ ions made it better and more dispersed nanoparticles were obtained in Fig. 2b–g.
| Compounds | Morphology | Size/diameter (nm) |
|---|---|---|
| InVO4 | Nanoparticle | 200 |
| InVO4:2% Eu3+ | Nanoparticle | 180 |
| InVO4:5% Eu3+ | Nanoparticle | 160 |
| InVO4:10% Eu3+ | Nanoparticle | 130 |
| InVO4:15% Eu3+ | Nanoparticle | 100 |
| InVO4:20% Eu3+ | Nanoparticle | 70 |
| InVO4:30% Eu3+ | Nanoparticle | 50 |
| InVO4:35% Eu3+ | Nanodisk | 180 |
| InVO4:40% Eu3+ | Middle-concave particle | 230 |
| InVO4:45% Eu3+ | Middle-concave particle | 260 |
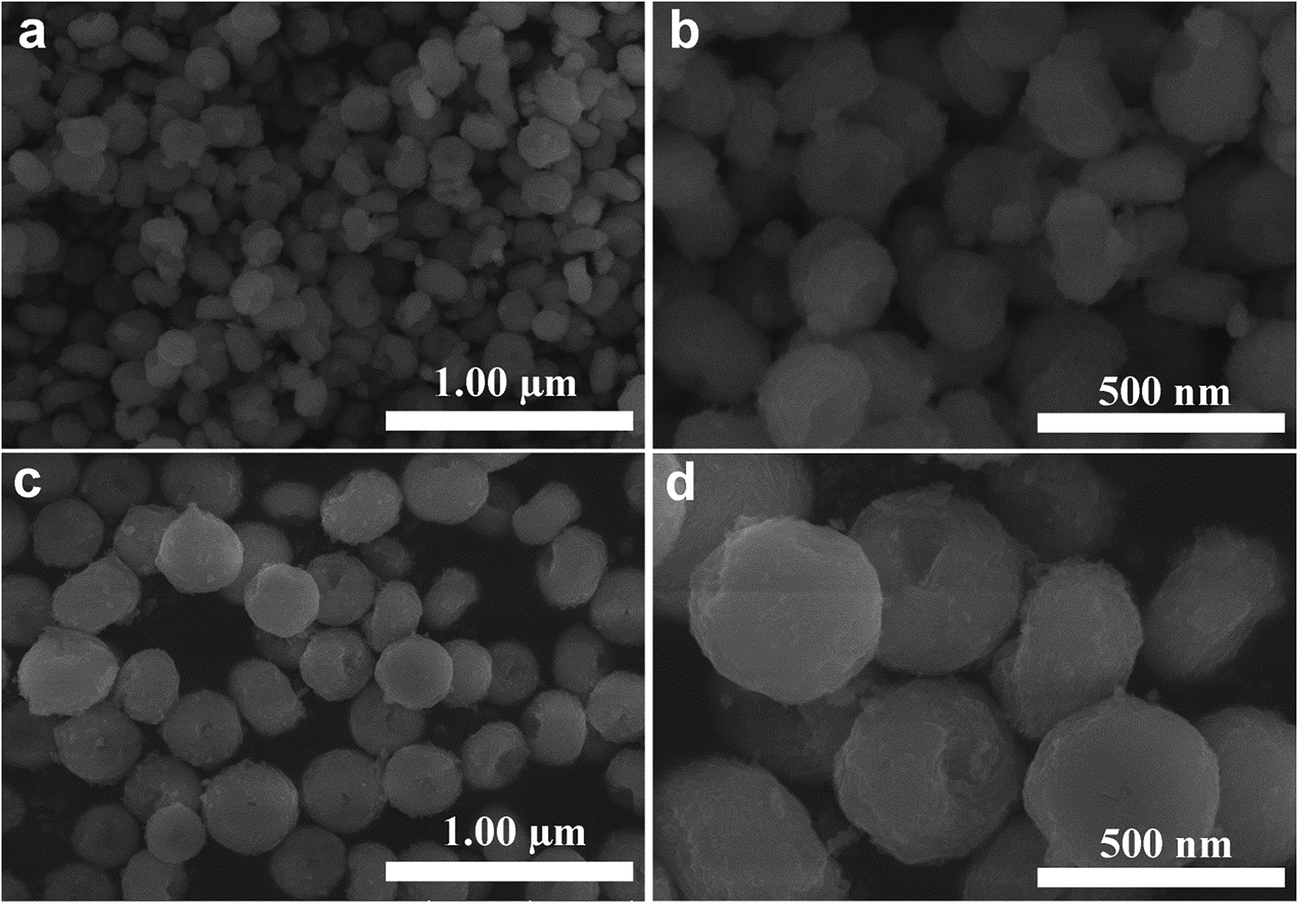
Fig. 4 and 5 show the SEM and TEM images of the InVO4 host doped with 35, 40 and 45 mol% of Eu3+ ions. It is observed that when the Eu3+ ion doping concentrations are higher than 35 mol%, the images of the InVO4:Eu3+ do not show nanoparticles any more. Both their size and morphology changed. The morphologies and diameters of the nanostructures with different Eu3+ ion concentrations are collected in Table 1. InVO4:35% Eu3+ displays special nanodisks with diameters around 180 nm. Fig. 4a and b show the SEM and TEM images of the InVO4:35% Eu3+ nanodisks, respectively. With careful observation we can find that these nanodisks are middle-concave, and the thickness of the edge of a nanodisk is about 50 nm. The morphologies of InVO4 doped with 40 mol% (Fig. 5a and b) and 45 mol% Eu3+ (Fig. 5c and d) are novel middle-concave nanoparticles with diameters of 230 nm for 40 mol% Eu3+ and 260 nm 45 mol% Eu3+. The EDX shown in Fig. 4c clearly indicated the composition of the InVO4: Eu3+ nanoparticles.
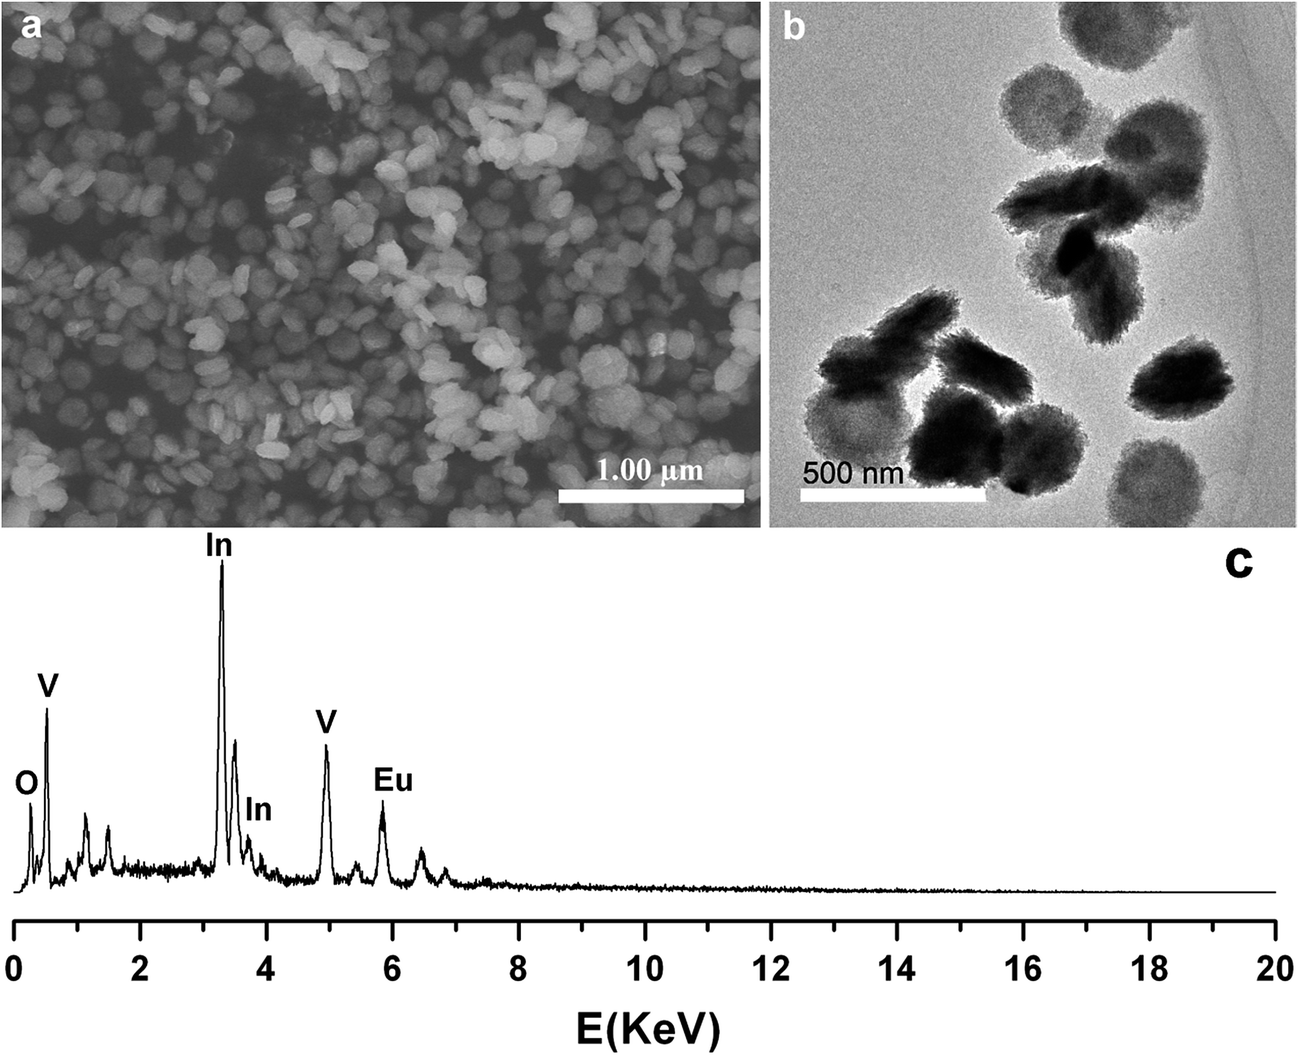 | ||
| Fig. 4 SEM (a), TEM (b) images and EDX (c) of InVO4:35% Eu3+. | ||
 | ||
| Fig. 5 SEM images of InVO4:40% Eu3+ (a and b) and InVO4:45% Eu3+ (c and d). | ||
Generally, the growth process of nanocrystals includes two main steps: an initial nucleating stage and a crystal growth stage. In the first stage, the formation of seeds is crucial for further growth of the crystals (second stage). The morphologies of the final crystals are usually determined by the very early seed formation. So when the doping concentration of Eu3+ is lower than 30 mol%, In3+ dominated the initial stage of the crystal growth and different sizes of nanoparticles were obtained (as shown in Fig. 2b–g). When the doping concentration of Eu3+ is higher than 35 mol%, the Eu3+ probably had such a huge impact on the initial stage that the morphology of the final crystals turned out to be middle-concave nanodisks or nanoparticles. As mentioned before, the ion radius of Eu3+ is much bigger than that of In3+, so the first nucleation stage would be changed by a higher doping concentration of bigger Eu3+ ions even under the same experimental conditions. So it is understandable that InVO4 with Eu3+ doping concentrations higher than 35 mol% shows different morphologies. At the same time, we should notice that when the Eu3+ doping concentration is higher than 35 mol%, the sizes of the nanostructures increase with the Eu3+ doping concentration increasing. This is opposite to the Eu3+ lower doping concentration, where nanoparticle size decreased with Eu3+ concentration increasing (Fig. 2b–g). From the comparison of Fig. 4 and 5, we can see that InVO4 with a doping concentration of Eu3+ from 35 mol% to 45 mol% displays middle-concave nanostructures, and the size of the nanostructures increases from 180 nm to 260 nm. From this point we can speculate that the higher Eu3+ doping concentrations (more than 35 mol%) in InVO4 have an effect on both morphology and size of the nanostructures. When Eu3+ doping concentration is higher than 50%, no regular nanostructures were obtained.
3.2 Optical properties
The room temperature photoluminescence excitation and emission spectra of InVO4:30% Eu3+ are shown in Fig. 6. The excitation spectrum of InVO4:30% Eu3+ monitored at 615 nm (Fig. 6a) exhibits an intense wide band centered at 316 nm, which is attributed to the charge transfer from the oxygen atoms to the central vanadium atom inside the VO43− anionic group.11 There are several groups of sharp peaks between 360 and 400 nm which belong to the Eu3+ intra-4f transitions. The emission spectrum monitored at 316 nm (Fig. 6b) includes different lines of 5D0 → 7FJ (J = 1, 2, 3, 4) multiplet transitions, in which the very strong lines (5D0 → 7F2) of hypersensitive transitions at 615 nm dominate the spectrum. Different transitions corresponding to the excitation and emission peaks are also illustrated in Fig. 6b. They are the typical well-known Eu3+ ion emission,12 which will not be discussed in detail. The comparison of the emission spectra of different Eu3+-doped InVO4 is the important issue that needs to be noticed here. Fig. 7a depicts the photoluminescence emission spectrum of InVO4 doped with different Eu3+ ion concentrations monitored at 316 nm. As we all know, InVO4 is a self-activating phosphor.11 When Eu3+ is lower than 2 mol%, the spectra are dominated by InVO4 emission at 524 nm, which originates from the VO43− charge transfer transition.13 The nanoparticles exhibited a blue-green emission under short UV irradiation. Meanwhile, in InVO4:5% Eu3+ and InVO4:8% Eu3+ emission spectra, the InVO4 emission peak in 524 nm is reduced and a new peak at 434 nm appears, and at the same time the Eu3+ emission enhances. So these two nanomaterials, especially InVO4:8% Eu3+, display obvious white light emission. The change of the InVO4:Eu3+ emission indicated that the Eu3+ was well doped in the InVO4 host. The increasing doping concentration of Eu3+ made the emission of InVO4 blue shift gradually (from 524 nm to 434 nm) because the much larger ions of Eu3+ occupied some of the crystal lattices instead of the smaller In3+ ions. And in the InVO4:10% Eu3+ emission, the InVO4 emission blue shifted to 434 nm completely, while the emission of Eu3+ gradually enhanced and dominated the emission spectrum instead of InVO4. Then the emission of InVO4 disappeared gradually with Eu3+ ion doping concentration increasing. The emission intensity of Eu3+ reached the maximum at 30% doping concentration. The concentration quenching effect occurs at Eu3+ concentrations higher than 30%, which is caused by the effect of energy exchange between Eu3+ ions as the distance between them decreases with increasing Eu3+ ion concentrations. The luminescence quantum efficiency (Φ) which fundamentally determined the luminescence properties of the materials was studied. The experimental value (Φ) of the InVO4: 10% Eu3+ is 3.04%, while the value (Φ) of InVO4: 30% Eu3+ is 15.38% with the same experimental conditions. It can be seen that the luminescence increased about 5 times when Eu3+ doping concentration increased from 10% to 30%.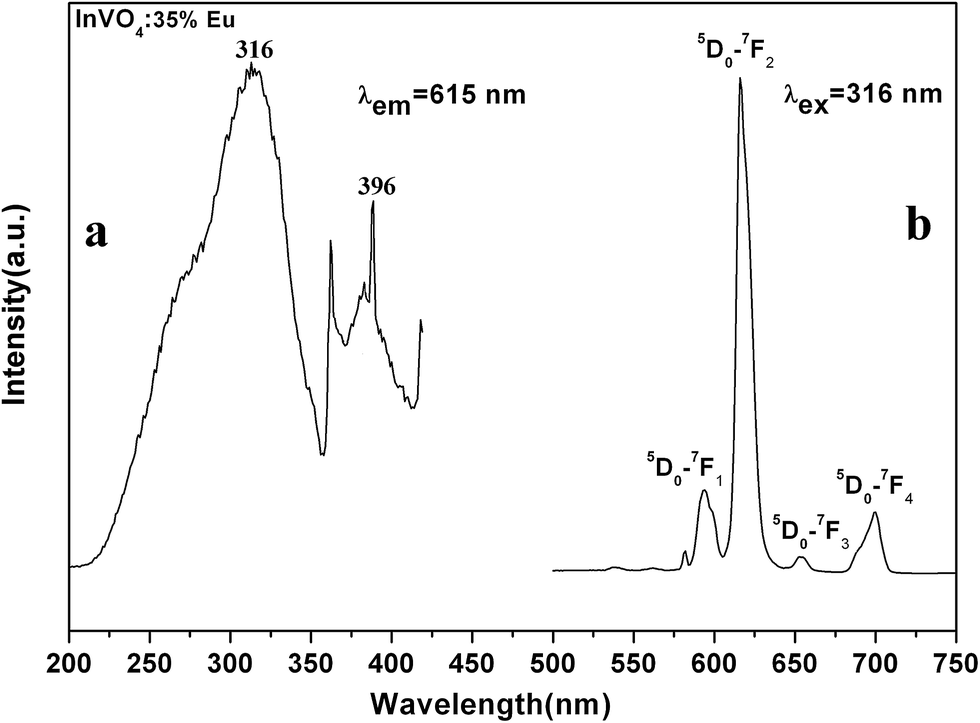 | ||
| Fig. 6 Photoluminescence spectra and illustration of InVO4:30% Eu3+. | ||
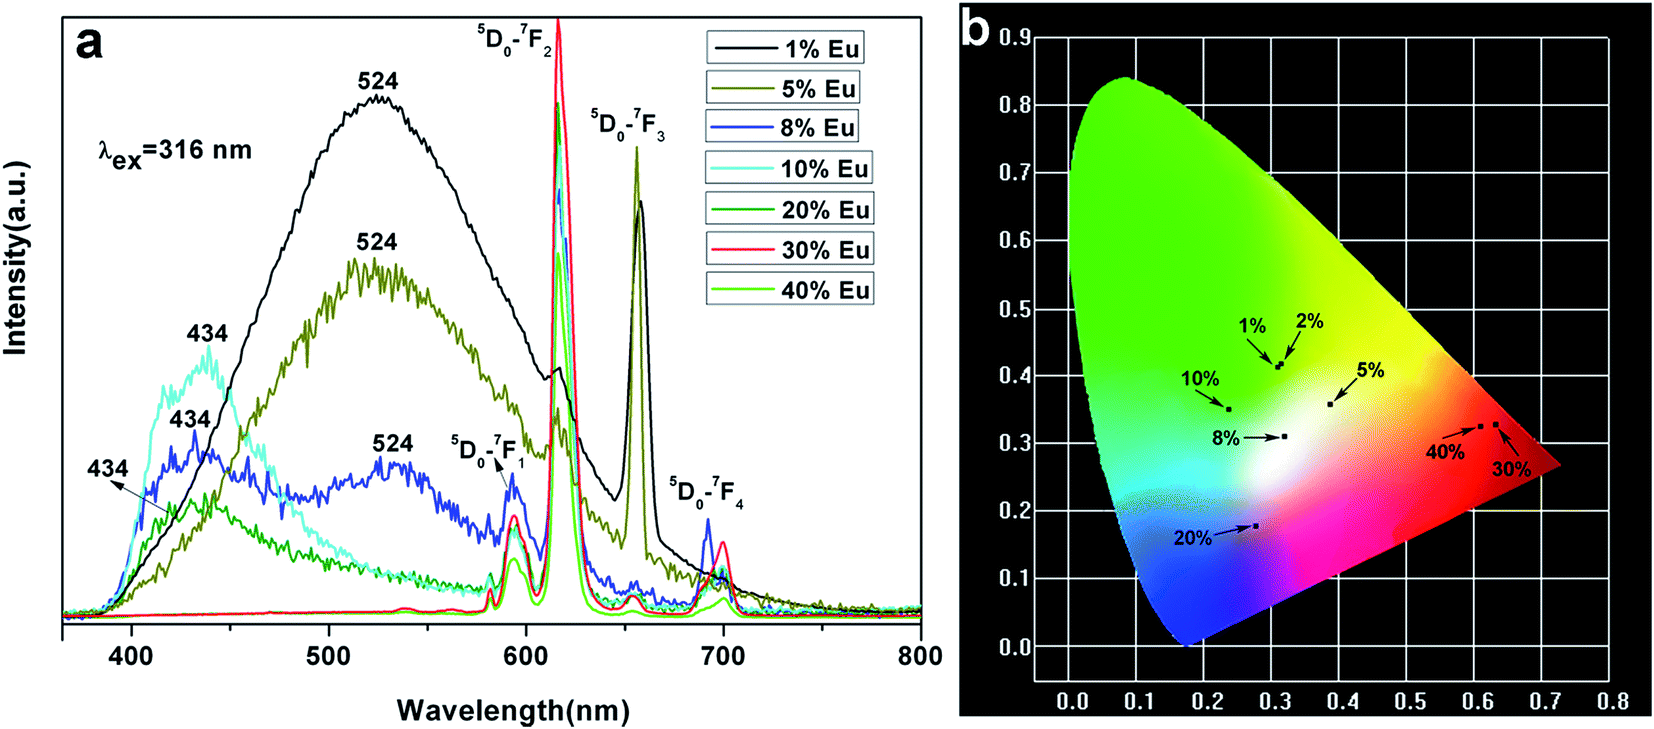 | ||
| Fig. 7 (a) Emission spectra of InVO4 doped with different doping concentrations of Eu3+; (b) CIE chromaticity diagram for InVO4 doped with different doping concentrations of Eu3+. | ||
It is interesting to find that the emission wavelength of InVO4:5% Eu3+ and InVO4:8% Eu3+ almost covers the whole visible region. The CIE chromaticity coordinates are x = 3937 y = 3593 for InVO4:5% Eu3+ and x = 0.3195 y = 0.3181 for InVO4:8% Eu3+ as shown in Fig. 7b, which could make these materials suitable candidates for white LEDs. Fig. 7b shows the CIE chromaticity diagram for InVO4:Eu3+ phosphors. The CIE chromaticity coordinates of InVO4:xEu3+ have been clearly marked with black spots in Fig. 7b corresponding to the emission of InVO4:xEu3+ (x = 1–40%) shown in Fig. 7a. The emission colors are green, blue green, white and red for different Eu3+ ion concentrations. In this case, we can modulate the emission color region through InVO4 doping with different concentrations of Eu3+, which made the nanomaterials of InVO4:Eu% excellent new materials for optoelectronic applications.
4 Conclusion
Uniform nanostructures of InVO4:xEu3+ were obtained in this work. The InVO4:xEu3+ products are different sizes of nanoparticles when the Eu3+ concentrations range from 0 mol% to 30 mol%, and middle-concave nanodisks or nanoparticles with different sizes when the Eu3+ concentrations range from 35 mol% to 45 mol%. The morphology difference is related to the large difference in ion radius between In3+ ions and Eu3+ ions. Emission colors of InVO4:xEu3+ including green, blue-green, white and red light were obtained by modulating the Eu3+ ion doping concentration. When the Eu3+ doping concentration is less than 20%, the emissions originate both from Eu3+ and VO43−, of which the emission of the InVO4:5% Eu3+ and InVO4:8% Eu3+ almost cover the whole visible region and exhibit white light. The emission intensity of Eu3+ ions reached a maximum at 30% doping concentration and InVO4:30% Eu3+ also has the smallest size in morphology, which can be attributed to the quantum confinement effect of the matrix where the Eu3+ ions were trapped. Research about micro/nanostructures of indium compounds is still in progress in our lab.Conflicts of interest
There are no conflicts to declare.Acknowledgements
The authors are thankful to the National Natural Science Foundation of China (No. 51702307).References
- (a) Z. L. Wang, Mrs Bull., 2012, 37, 814–827 CrossRef; (b) C. W. Cheng and H. J. Fan, Nano Today, 2012, 7, 327–343 CrossRef.
- (a) J. Ge, J. D. Lei and R. N. Zare, Nat. Nanotechnol., 2012, 7, 428–432 CrossRef PubMed; (b) D. Kowalski, D. Kim and P. Schmuki, Nano Today, 2013, 8, 235–264 CrossRef.
- J. H. Ye, Z. G. Zou, M. Oshikiri, A. Matsushita, M. Shimoda, M. Imai and T. Shishido, Chem. Phys. Lett., 2002, 356, 221–226 CrossRef.
- J. C. Shen, H. Yang, Q. H. Shen and Z. Y. You, Procedia Eng., 2014, 94, 64–70 CrossRef.
- Y.-S. Chang, Z.-R. Shi, Y.-Y. Tsai, S. Wu and H.-L. Chen, Opt. Mater., 2011, 33, 375–380 CrossRef.
- Z. H. Ai, L. Z. Zhang and S. C. Lee, J. Phys. Chem. C, 2010, 114, 18594–18600 CrossRef.
- (a) J.-M. Yao, C.-K. Lee, S.-J. Yang and C.-S. Hwang, J. Alloys Compd., 2009, 481, 740–745 CrossRef; (b) T. H. Noh, D. W. Kim, S. W. Seo, I. S. Cho, D. H. Kim, H. S. Han and K. S. Hong, Mater. Lett., 2012, 72, 98–100 CrossRef; (c) L. W. Zhang, H. B. Fu, C. Zhang and Y. F. Zhu, J. Solid State Chem., 2006, 179, 804–811 CrossRef.
- X. M. Liu, Y. Lu, C. Chen, S. L. Luo, Y. H. Zeng, X. Q. Zhang, M. M. Shang, C. X. Li and J. Lin, J. Phys. Chem. C, 2014, 118, 27516–27524 CrossRef.
- (a) K. Li, S. S. Liang, M. M. Shang, H. Z. Lian and J. Lin, Inorg. Chem., 2016, 55, 7593–7604 CrossRef PubMed; (b) K. Li, M. M. Shang, Y. Zhang, J. Fan, H. Z. Lian and J. Lin, J. Mater. Chem. C, 2015, 3, 7096–7104 RSC.
- R. D. Shannon, Acta Crystallogr. A, 1976, 32, 751–767 CrossRef.
- (a) H. W. Zhang, X. Y. Fu, S. Y. Niu, G. Q. Sun and Q. Xin, Solid State Commun., 2004, 132, 527–531 CrossRef; (b) Y. S. Chang, F. M. Huang, Y. Y. Tsai and L. G. Teoh, J. Lumin., 2009, 129, 1181–1185 CrossRef.
- X. Wang and Y. D. Li, Angew. Chem., Int. Ed., 2002, 41, 4790–4793 CrossRef PubMed.
- (a) H.-R. Shih, K.-T. Liu, L.-G. Teoh, L.-K. Wei and Y.-S. Chang, Microelectron. Eng., 2015, 148, 10–13 CrossRef; (b) Y. Luo, Z. G. Xia, B. F. Lei and Y. G. Liu, RSC Adv., 2013, 3, 22206–22212 RSC.
| This journal is © The Royal Society of Chemistry 2018 |