 Open Access Article
Numerical simulation analyses of β ↔ δ phase transition for a finite-sized HMX single crystal subjected to thermal loading
WeiJia Hu,
YanQing Wu *,
FengLei Huang* and
XinJie Wang
State Key Laboratory of Explosion Science and Technology, Beijing Institute of Technology, Beijing, China. E-mail: wuyqing@bit.edu.cn; huangfl@bit.edu.cn
First published on 12th July 2018
Abstract
Phase transition of HMX single crystals is the very first process prior to chemical reaction and ignition of polymer-bonded explosives (PBX). A mesoscale β ↔ δ phase transition model is developed to investigate the role of solid phase transformation on the thermo-mechanical behavior of HMX single crystals. The model captures nonlinear elasticity, dislocation-based crystalline plasticity and temperature-dependent phase transition. Phase transition evolutions of HMX subjected to different heating rates with a certain hydrostatic pressure were investigated based on the finite element software ABAQUS. The simulated results showed that with the thermal heating and cooling boundary conditions, the β ↔ δ phase transition state is reversible, but its path is irreversible. The path-dependence of the β ↔ δ phase transition is reflected by the residual strain and stress that comes into being in the absence of mechanical constraints for 1 mm size HMX single crystals during a temperature cycle. Moreover, the β → δ phase transition is inhibited by higher temperature gradients and hydrostatic pressure. As the β-phase of HMX crystal converts to the δ-phase, the crystal volume expands due to the larger expansion coefficients of δ-HMX so that the stress concentration can be found at the sample center.
1. Introduction
Under high temperature and high pressure, energetic materials will undergo phase transition, which can affect the physical and chemical properties. HMX is one of the most important solid-state energetic materials. There exist four solid phase polymorphs for HMX, which are denoted as α, β, γ, δ. The stability of the polymorphs is as follows: β > α > γ > δ,1 which is also the order of density decrease. The most stable form at room temperature is the monoclinic β phase,2 and the hexagonal δ phase is stable at high temperature. When heated between 432–438 K or above 463 K and at ambient pressure, the β phase will transform into the δ phase.3 It is speculated that the observed sensitivity increase of the δ-phase is due to a significant lattice expansion and the associated density decrease from 1.90 for β to 1.76 g cm−3 for δ.4 There are four reaction processes in the HMX chemical decomposition and the first is the β–δ phase transition.5 Phase transition will also result in the appearance of cracks, a large amount of hot spots in the material, and fast growth of reaction.6Abundant research has been done about the β–δ phase transition of HMX by experiments and molecular dynamics. Experiment methods for measuring or observing phase transition of HMX are shown as follow: Raman spectroscopy, thermogravimetric analysis, Fourier Infrared Method (FTIR),7,8 second harmonic generation (SHG),9–13 differential scanning calorimetry (DSC),14,15 X-ray diffraction (XRD),16–18 diamond anvil cell (DAC).19 Henson et al.12 quantitatively analyzed the two phases according to the intensity of the SHG signal. As the SHG signal is symmetry forbidden, δ phase therefore has a nonzero volumetric second order nonlinear polarizability. Then they established a model for studying the thermodynamics of the phase transition of HMX based on the experiments.11 The model is embedded in the crystal constitutive model to investigate the phase transition under thermal cook-off in this study. Aaron et al.20 checked the kinetic parameters of the second order reversible phase transition model and the Prout–Tompkins cook-off model by the ALE3D algorithm, and simulated thermal ignition, thermal explosion. The calculated results were consistent with the DSC and ODTX experimental data. The modified model can predict the phase transition and chemical reaction process of energetic materials. Alan et al.21 heated from ambient temperature to 573 K at different heating rates for DSC experiment. They also verified the second order reversible β → δ phase transition model of HMX. They thought that phase transformation was more likely to nucleate at the crystal defect. It indicated that the activation energy of the defect-free crystal was higher than that of the defective crystal. Smilowitz et al.16 found that the HMX sample could fully revert back to β phase by cooling the sample to temperature below the δ phase stability point. They believed the phase transition process included reversible nucleation and growth. They also found some cracks were generated after the reversible phase transition. As the cracks will increase the probability of the ignition of the HMX, the reversible phase transition of the HMX is necessary to study. During cook-off, temperature gradients will lead to pressure gradients which in turn will drive phase transition and chemical decomposition, thus affecting ignition time and location.22 Multi-point measured temperature cook-off tests were carried out at different heating rates by Chen Lang et al.23 They also used a multi-step reaction kinetics model to simulate the revolution of the chemical reaction products (β-HMX, δ-HMX, final gas products). They found that the phase transition of HMX had an influence on the temperature of the explosives and would affect the ignition of the explosive.
In this work, we develop a mesoscale constitutive model by considering temperature dependent phase transition to analyze the response of phase transition in HMX under thermal cook-off and hydrostatic pressure. This paper has three main objectives: (1) understanding the irreversibility of the phase transition path; (2) investigating the onset temperature of phase transition; (3) probing into the thermal–mechanical response under cook-off process.
2. Theory and constitutive models
In this section, a brief outline of the thermal–mechanical constitutive model for HMX crystals is presented. The constitutive model for HMX crystals used in this study follows that developed by Wu and Huang.24,25 The single crystal plastic model has been used to interpret the planar impact experiments on HMX single crystals by Dick et al.26 and the thermal–mechanical response of impacted polymer-bonded explosives. The model extends traditional crystal plasticity27–33 and phase transition11 to cases the response under thermal cook-off and hydrostatic pressure.2.1 Dislocation-based crystal plastic model
Based on multiplicative decomposition and polar decomposition, the deformation gradient F can be indicated as,| F = FeFp = ReUeFp | (1) |
According to (1), the velocity gradient L is written as,
L = ḞF−1 = Ω + Re![[L with combining macron]](https://www.rsc.org/images/entities/b_char_004c_0304.gif) Re−1;Ω = ṘeRe−1 Re−1;Ω = ṘeRe−1
| (2) |
 | (3) |
![[L with combining macron]](https://www.rsc.org/images/entities/b_char_004c_0304.gif) means velocity gradient without rotated configuration. All quantities with a “–” above refer to the reference configuration
means velocity gradient without rotated configuration. All quantities with a “–” above refer to the reference configuration ![[L with combining macron]](https://www.rsc.org/images/entities/b_char_004c_0304.gif) . The slip direction of a particular slip system α is
. The slip direction of a particular slip system α is ![[s with combining macron]](https://www.rsc.org/images/entities/b_char_0073_0304.gif) (α) and the slip plane normal is
(α) and the slip plane normal is ![[m with combining macron]](https://www.rsc.org/images/entities/b_char_006d_0304.gif) (α).
(α). ![[small gamma, Greek, dot above]](https://www.rsc.org/images/entities/char_e0a2.gif) (α) denotes the shear strain rate of slip system α.
(α) denotes the shear strain rate of slip system α.
In order to express the crystal plastic constitutive equations through slip systems, the resolved shear stress τ(α) is based on Schmid law.
 | (4) |
![[P with combining macron]](https://www.rsc.org/images/entities/b_char_0050_0304.gif) (α) denotes Schmid factor and σL denotes Cauchy stress.
(α) denotes Schmid factor and σL denotes Cauchy stress.
The Orowan equation34 is in the description of shear strain rate for rate-dependent crystal plasticity,
![[small gamma, Greek, dot above]](https://www.rsc.org/images/entities/char_e0a2.gif) (α) = ρm(α)b(α) (α) = ρm(α)b(α)![[v with combining macron]](https://www.rsc.org/images/entities/i_char_0076_0304.gif) (α) (α)
| (5) |
![[v with combining macron]](https://www.rsc.org/images/entities/i_char_0076_0304.gif) (α) is the average dislocation velocity of slip system α. The dislocation velocity is assumed to be related to the resolved shear stress τ(α),35
(α) is the average dislocation velocity of slip system α. The dislocation velocity is assumed to be related to the resolved shear stress τ(α),35
 | (6) |
Two distinct processes contribute to the strain rate: nucleation of dislocation loops and growth of existing loops.36 At low strain rates, increases in dislocation density are usually attributed to multiplication of existing dislocations via a process called multiple cross glide.37 However, for solids under extremely large shear stresses the nucleation of dislocations at stress concentrations must be considered.38 At higher stresses, multiplication of dislocations will operate simultaneously with the nucleation. Then the rate of mobile dislocation density can be expressed as,
 | (7) |
![[small gamma, Greek, macron]](https://www.rsc.org/images/entities/char_e0c4.gif) denotes the total cumulative shear strain on each slip system; τc is the threshold shear stress for dislocation nucleation; M, H and A are material constants.
denotes the total cumulative shear strain on each slip system; τc is the threshold shear stress for dislocation nucleation; M, H and A are material constants.
The threshold shear stress τ0 and τc are affected by temperature.39 When the temperature increases, the threshold shear stress will increase.
2.2 Non-linear thermal-elastic model
The nonlinear thermos-elasticity model includes anisotropic elastic and thermal effects. For a monoclinic single crystal such as HMX crystals, an isochoric deformation will produce pressure. For the purpose of considering the finite volume changes, a logarithmic strain measure is used for formulating the elasticity,40
 | (8) |
In thermo-elasticity, elastic strain and entropy specify the thermodynamic state. The internal energy per unit mass is expanded in terms of elastic strain tensor and entropy.41 At constant entropy, higher-order elastic constants may be used to approximate internal energy increments,
 | (9) |
![[C with combining macron]](https://www.rsc.org/images/entities/b_char_0043_0304.gif) (P,T) is the pressure and temperature dependent second-order isentropic elasticity tensor. Assuming small distortional elastic strains, Cauchy stress σL in an unrotated configuration times is work conjugate to eqn (10).40 When the entropy change is zero, the formula can be written as,
(P,T) is the pressure and temperature dependent second-order isentropic elasticity tensor. Assuming small distortional elastic strains, Cauchy stress σL in an unrotated configuration times is work conjugate to eqn (10).40 When the entropy change is zero, the formula can be written as,
 | (10) |
The relationship between unrotated Cauchy stress rate  and the elastic strain rate tensor
 ![[D with combining macron]](https://www.rsc.org/images/entities/b_char_0044_0304.gif) e can be obtained from eqn (9)
e can be obtained from eqn (9)
 | (11) |
As proved by Johnson and Bammann,41 the Cauchy stress rate ![[small sigma, Greek, dot above]](https://www.rsc.org/images/entities/b_char_e156.gif) L, is material frame indifferent and can be expressed as:
L, is material frame indifferent and can be expressed as:
![[small sigma, Greek, tilde]](https://www.rsc.org/images/entities/b_char_e10d.gif) = = ![[small sigma, Greek, dot above]](https://www.rsc.org/images/entities/b_char_e156.gif) − Wσ + σW − Wσ + σW
| (12) |
Then, the complete expression of the rate-dependent constitutive model equation is obtained by,
 | (13) |
A small amount of data is obtained on the higher-order elastic constants of single crystal β-HMX, which are important to describe ∂![[C with combining macron]](https://www.rsc.org/images/entities/b_char_0043_0304.gif) /∂
/∂![[small epsilon, Greek, macron]](https://www.rsc.org/images/entities/char_e0c6.gif) e in eqn (13). The nonlinear elastic response of β-HMX single crystals is assumed to be dependent on the pressure and temperature
e in eqn (13). The nonlinear elastic response of β-HMX single crystals is assumed to be dependent on the pressure and temperature
 | (14) |
Bulk modulus K is pressure and temperature dependent. The pressure and temperature dependent relation of elastic constants ∂![[C with combining macron]](https://www.rsc.org/images/entities/b_char_0043_0304.gif) /∂P and ∂
/∂P and ∂![[C with combining macron]](https://www.rsc.org/images/entities/b_char_0043_0304.gif) /∂T can be obtained by molecular dynamic simulations are performed using COMPASS field of force for β-HMX single crystals.43
/∂T can be obtained by molecular dynamic simulations are performed using COMPASS field of force for β-HMX single crystals.43
In the process of the phase transition, the stress depends on the mole fraction of the β-HMX and the δ-HMX,
| σ = λσδ-HMX + (1 − λ)σβ-HMX | (15) |
To complete the thermo-dynamic description, the temperature is given by,
 | (16) |
| CV = 667.7 + 0.88T (J kg−1 K−2) | (17) |
All the parameters employed in the model are listed in Table 1 and 2.
| C11 | C12 | C22 | C13 | C23 | C33 | C44 | C45 | C55 | C16 | C26 | C36 | C66 |
|---|---|---|---|---|---|---|---|---|---|---|---|---|
| 20.8 | 4.0 | 26.9 | 13.0 | 6.6 | 17.6 | 2.9 | 3.0 | 3.8 | 0.6 | −1.5 | 0.1 | 6.6 |
| b (m) | ρm0 (m−2) | M (m−2) | τ0 (Pa) | H (Pa) | v0 (m s−1) | τc (Pa) | A (m2 Pa2) | Sd (Pa) |
|---|---|---|---|---|---|---|---|---|
| 7.1332 × 10⁻¹⁰ | 1.4 × 10¹⁰ | 1.23 × 10¹² | 1.2 × 10⁶ | 1010 | 3280 | 1.56 × 10⁶ | 10−9 | 0.17 × 10⁹ |
2.3 β–δ phase transition model of HMX crystals
The β–δ phase transition in HMX single crystal occurs via nucleation and growth. Henson and Smilowitz et al.11 construct a two state kinetic model of the system consisting of equilibrium terms first order in the β or δ mole fraction simulating nucleation, and second order in β and δ simulating growth. The four component processes, along with each labeled rate constant, are represented schematically below,
 | (18) |
 | (19) |
The first step in eqn (18) represents the nucleation kinetics from either β or δ phases. The second and third step represent the growth of the new, stable phase in either direction, with kinetics modeled as second order in both mass fractions. The phase transition velocity vph can be obtained,
| vph = k1 + [β0(k2 − k−2) − (k1 + k−1)]x + β0(k−2 − k2)x2 | (20) |
| x = [δ]/β0;β0 = 0.0064 mol cm−3 | (21) |
All the parameters used in the phase transition model are listed in Table 3.
| Q (m3 mol−1) | S (J mol−1 K) | U (kJ mol−1) | V (m3 mol−1) | |
|---|---|---|---|---|
| k1 | 1.00 | 144.44 | 207.691 | 1.14 × 10⁻⁵ |
| k−1 | 1.00 | 121.68 | 197.891 | 0.00 |
| k2 | 3.00 × 10⁻¹⁰ | 149.85 | 79.700 | 2.33 × 10⁻⁵ |
| k−2 | 3.00 × 10⁻¹⁰ | 127.09 | 69.900 | 1.19 × 10⁻⁵ |
3. Results and discussion
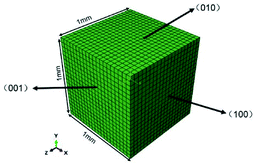
The proposed model has been implemented as a VUMAT in the ABAQUS/Explicit finite element software code.46 VUMAT is a user subroutine which is used to define the mechanical constitutive behavior of a material. The ABAQUS/explicit uses a forward Euler integration scheme and integrates through time. HMX single crystal is constructed as 1 mm × 1 mm × 1 mm 3D model as shown in Fig. 1. The mesh size of the HMX single crystal is 50 μm, and there are 8000 elements. The element type is C3D8RT (three dimensional hexahedron thermos-coupling linear interpolation reduction integral element).3.1 Irreversibility of phase transition path
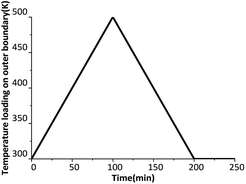
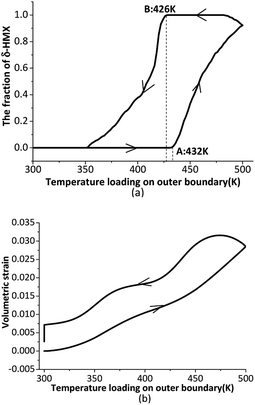
We begin our analyses with reversible phase transition. Time-varying temperature loading is shown in Fig. 2. The temperature of the six outer surfaces of the crystal rises at 2 K min−1 from 300 K to 500 K, then decreases at 2 K min−1 from 500 K to 300 K.The overall phase transition fraction of the crystal, which means the fraction of new generated δ-HMX, is plotted in Fig. 3(a). Obviously that in a temperature cycle, β ↔ δ phase transition state is reversible, but its path is irreversible. A and B in Fig. 3(a) respectively represent the beginning points of β → δ and δ → β phase transition. The temperature of the A and B states correspond to 432 K and 426 K. There is a volume expansion due to the decrease of the density from 1.90 (for β phase) to 1.76 g cm−3 (for δ phase), accompanying the β → δ phase transition. This may result in the generation of cracks, which will not disappearance during the δ → β phase transition. The cracks change the physical and chemical properties of the crystal so that the crystal can't convert back to the initial β phase. Another evidence is that negligible residual strain and stress appear in the crystal when subjected to a temperature cycle. Fig. 3(b) shows the evolution of the averaged volumetric strain of the crystal. Averaged volumetric strain is zero at first time and increases with rising temperature. After β → δ phase transition, the volumetric strain will increase more quickly. When the temperature loading on outer boundary begins to decrease, the volumetric strain has a slight increase around 500 K for that the temperature of the internal crystal is still rising on the influence of thermal conduction. Then the volumetric strain decreases to 0.025 after the temperature loading drops to 300 K and keeps for a while. This means that the crystal has residual volume expansion, which may be caused by damage such as cracks.
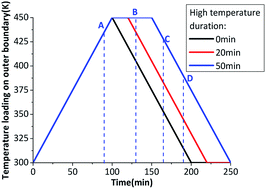
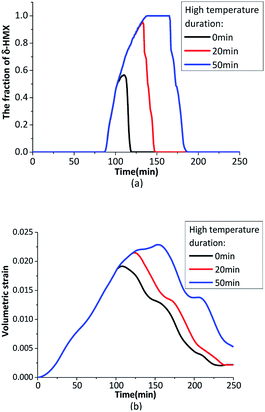
When the heating rate is not high enough, the β → δ phase transition can't finish completely during a temperature cycle. Prolonging the maximum temperature time in the thermal cycle can increase the β → δ phase transition degree. Fig. 4 shows the temperature loading on outer boundary at 1.5 K min−1 with different maximum temperature time.
Fig. 5 shows the evolution of the phase transition fraction (δ-HMX) and volumetric strain. When the heating rate is not high enough, the inner crystal temperature has no enough time to rise to phase transition onset temperature, which leads to the incomplete β → δ phase transition. If the temperature is maintained for a while at the plateau value, the crystal temperature will be homogenized because of thermal conduction and the temperature gradient will decrease, then the fraction of the δ-HMX will rise. The longer the maximum temperature lasts, the higher the phase transition fraction is. Volumetric stain increases with the rising temperature and resides after a temperature cycle. Obviously the temperature homogenization caused by thermal conduction contributes to the β → δ phase transition.
Based on thermal conduction, the temperature gradient will be generated in the HMX crystal with the variable temperature. Temperature gradient has a significant influence on the phase transition. The phase transition fraction contour, and the temperature gradient of HMX crystal are shown in Fig. 6. The four pictures in Fig. 6(a) and four curves in Fig. 6(b) correspond to the four points in the Fig. 4, respectively. From Fig. 6(b), the max temperature of the sample is 435 K at t = 90 min. At this time, the β → δ phase transition begins from the boundary as the temperature of the six faces of the sample is the highest. With the influence of the thermal conduction, the temperature of the center of the sample rises, which makes the fraction of the δ-HMX increase to 1. After t = 100 min, the temperature loading on outer boundary begins to decrease. At t = 165 min, the temperature on the outer surfaces of the sample is 426 K and the δ → β has been finished. Finally, the sample converts to β phase totally. While the temperature gradient is high, the temperature are not identical at different location of the sample. Because the phase transition is mainly related to temperature, the phase transition is not homogeneous when the temperature gradient is high. The temperature gradient has an inhibitory effect on phase transition.
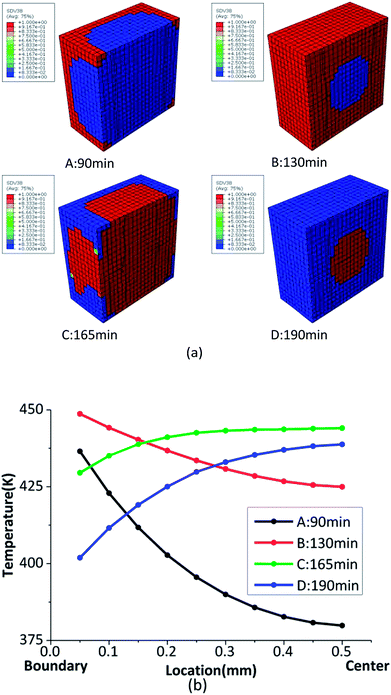 | ||
| Fig. 6 (a) The phase transition fraction contour of δ-HMX; (b) the temperature gradient from the outer boundary to crystal center. | ||
3.2 Onset temperature of phase transition
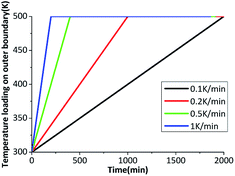
The β → δ phase transition is greatly influenced by temperature gradient. The six outer surfaces of the HMX crystal are heated from 300 K to 500 K with heating rates of 0.1 K min−1, 0.2 K min−1, 0.5 K min−1 and 1 K min−1, then keep constant at 500 K. The time-varying temperature loading on outer boundary is shown in Fig. 7.Fig. 8(a) shows the fraction of δ-HMX changes with the temperature, the linear fit for the natural logarithm of the heating rates and phase transition onset temperature is plotted in Fig. 8(b). High heating rate results in big temperature gradient, which inhibits phase transition in crystal. Moreover, the activation energy of the crystal will change with the temperature, so that the phase transition velocity will be different with different heating rates.
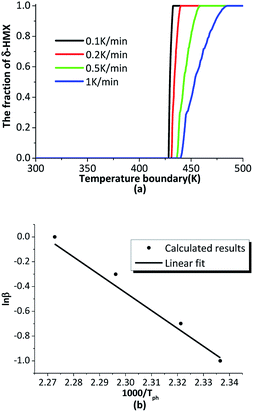 | ||
| Fig. 8 (a) The phase transition changes with temperature at different heating rates; (b) the linear fit for the natural logarithm of the heating rates and phase transition onset temperature. | ||
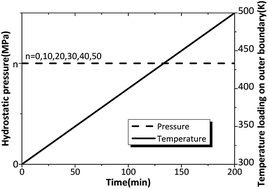
In order to analyze the influence of hydrostatic pressure on β → δ phase transition, the six outer surfaces of the HMX crystal are loaded by constant hydrostatic pressure ranging from 0 to 50 MPa, with the same heating rate of 1 K min−1. The time-varying hydrostatic pressure and temperature are shown in Fig. 9.
From the literature,19 the β → δ phase transition onset temperature is positively correlated with the pressure, which means the phase transition is inhibited by pressure. Fig. 10(a) shows the evolution of the phase transition under different hydrostatic pressure. It is clear that the phase transition will delay when the crystal suffers hydrostatic pressure. According to the phase equilibrium PT relation of the Clapeyron equation (eqn (22)), dP/dT is equal to the product of latent heat of the phase transition divided by the temperature and the molar volume difference through phase transition.47
| dP/dT = L/(TΔV);L = TΔS | (22) |
| ΔV = Vβ − Vδ = 1.14 × 10⁻⁵ m3 mol−1,ΔS = Sβ − Sδ = 30.78 J (mol−1 K−1) | (23) |
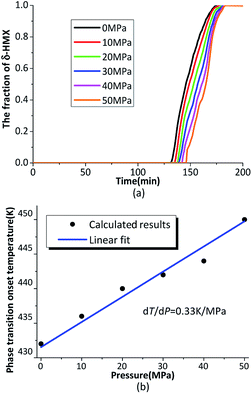 | ||
| Fig. 10 (a) The evolution of the phase transition under different hydrostatic pressure; (b) the phase transition onset temperature under different hydrostatic pressure. | ||
It will be obtained that,
| dT/dP = 0.37 (K MPa−1) | (24) |
The β → δ phase transition onset temperature under different hydrostatic pressure is plotted in Fig. 10(b). The pressure and temperature relations are fitted. The results show the relationship between pressure and temperature, which is close to the linear relationship in the phase transition. The simulation results are fitted with a straight slope,
| dT/dP = 0.33 (K MPa−1) | (25) |
From the eqn (24) and (25), it is obvious that the theoretical and simulated values are in good agreements.
3.3 Thermal–mechanical response under cook-off process
The crystal is under thermal loading shown in Fig. 7. Stress–strain curves under different heating rates are plotted in Fig. 11(a), the phase transition and plastic slip are in Fig. 11(b) and (c). With the higher heating rate, there will be greater temperature gradient in crystal, which results in the generation of bigger pressure gradient. Averaged stress rises with increasing heating rates. The crystal undergoes phase transition first under cook-off process. After phase transition, the volume of the crystal increases which results in a certain growth of internal stress. When the inner shear stress is big enough, the plastic slip of the crystal will initiate and the plastic strain will generate. The slip systems start more quickly when the heating rate is higher.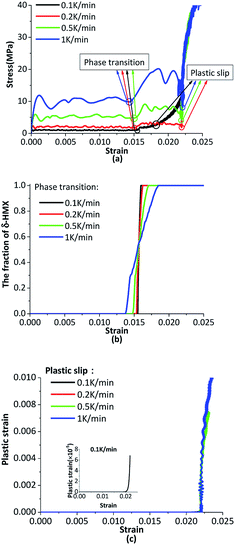 | ||
| Fig. 11 (a) The stress–strain curves under different heating rates; (b) the phase transition curves under different heating rates; (c) the plastic strain under different heating rates. | ||
Fig. 12 shows the stress contour of HMX before and after β → δ phase transition under different heating rates. The max tensile stress has a great increase after β → δ phase transition and increases more quickly with rising heating rates. The maximum stress of the crystal is at the center before phase transition and at the boundary after phase transition. The β → δ phase transition leads to a great volume expansion so that there will be stress concentration at the center of the crystal. The localized stress increase leads to the generation of hot spots. Phase transition makes the crystal more sensitive.
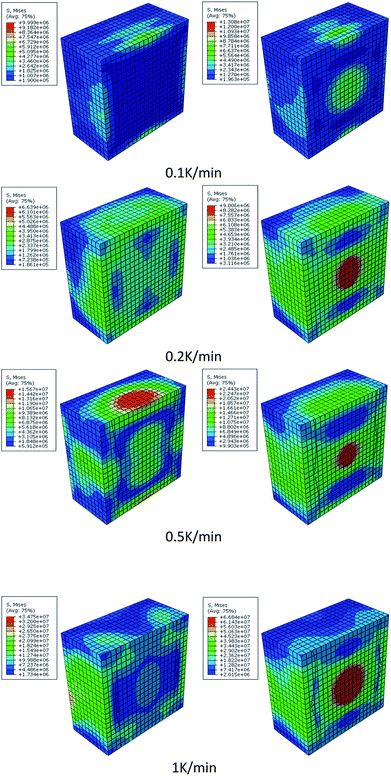 | ||
| Fig. 12 The stress contour of HMX before (left hand) and after (right hand) phase transition under different heating rates. | ||
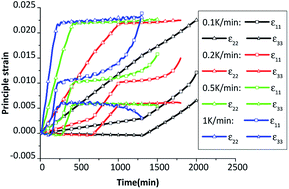
The evolution of three principle strains of HMX crystal are plotted in Fig. 13. As the HMX single crystal is anisotropic, the principle strains are different along three principle directions. The total strain is equal to the elastic strain plus the thermal strain and the plastic strain, where the thermal strain plays a major role under cook-off process. The higher the heating rate is, the greater the total strain is. The three principle strains increase quicker after phase transition due to the bigger thermal expansion coefficients of δ phase. The third principle strain ε33 is negative before the inflection point, which means the crystal is compressed before the β → δ phase transition. After the β → δ phase transition, the explosive is in a stretched state along the third direction, which may result in the generation of cracks along this direction.
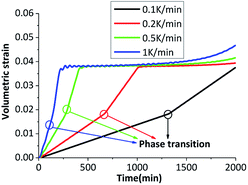
The volumetric strains of the sample at different heating rates are shown in Fig. 14. Obviously that the crystal has an apparent volumetric expansion with the rising temperature. The volumetric expansion is mainly caused by elastic expansion and thermal expansion. The volumetric strain is bigger with higher heating rate. After phase transition, the volumetric strain increases faster, which reveals that the phase transition results in an apparent volumetric expansion. As the final environmental temperature are the same, the volumetric strain are stable at 0.04 for a while, which are mainly caused by phase transition and thermal expansion. Volumetric strain has a slight increase at last due to the elastic strain, which will increase with the rise of plastic strain.
4. Conclusions
The thermo-mechanical responses of HMX single crystal under hydrostatic pressure and different heating rates have been investigated based on a mesoscale β ↔ δ phase transition model, which accounts for nonlinear elasticity, crystalline plasticity and temperature-dependent solid phase transition. The crystalline plasticity of δ-HMX will be neglected due to its instability.As the temperature rises and decreases, β ↔ δ phase transition state is reversible, but its path is irreversible. The β → δ and δ → β phase transition onset temperature are different. Negligible residual strain and stress still exist in the crystal after a temperature cycle. Moreover, when the heating rate is not high enough for the β → δ phase transition to finish completely, prolonging the maximum temperature time in the thermal cycle will increase the phase transition degree. The longer the maximum temperature lasts, the smaller the temperature gradient is. The inner crystal temperature has enough time to rise to the β → δ phase transition threshold. Small temperature gradient contributes to β → δ phase transition.
The β → δ phase transition is inhibited by great temperature gradient and hydrostatic pressure. The activation energy changes with temperature. With the rising heating rate, the great temperature gradient is generated in the crystal, which may lead to a delay of the β → δ phase transition nucleation. The natural logarithm of the heating rates and phase transition onset temperature are linear. The phase transition onset temperature increases with a rising hydrostatic pressure by a relation of dT/dP = 0.33 (K MPa−1).
As the β-HMX crystal converts to δ phase, the crystal volume expands due to the larger expansion coefficients of δ-HMX. The crystal changes from a compressed state to a stretched state along the third principle direction after phase transition, which may lead to the generation of cracks. The anisotropic thermal expansion and phase transition result in stress increases and concentration. When this stress reaches a critical level, plastic slip initiates, which shows phase transition facilitates plastic slip. Localized high stress and temperature will play an important role in the generation of the hot spots. The β → δ phase transition will result in increased sensitivity to HMX.
In the present work, chemical reaction and thermal damage have not been taken into account in the developed phase-transition model, which will be considered in our future work for better understanding explosion initiation for high explosives.
Conflicts of interest
There are no conflicts to declare.Acknowledgements
The authors would like to thank Science Challenging Program (TZ2016001), the Chinese National Natural Science Foundation (Grant No. 11572045 and 11472051) and innovative group of material and structure impact dynamics (No. 11521062) for supporting this project.References
- C. S. Yoo and H. Cynn, Equation of state, phase transition, decomposition of β-HMX (octahydro-1,3,5,7-tetranitro-1,3,5,7-tetrazocine) at high pressures, Medical Care, 1999, 46(3), 247–256 Search PubMed.
- C. Xue, J. Sun and B. Kang, et al., The β–δ-Phase Transition and Thermal Expansion of Octahydro-1,3,5,7-Tetranitro-1,3,5,7-Tetrazocine, Propellants, Explos., Pyrotech., 2010, 35(4), 333–338 CrossRef.
- M. Pravica, M. Galley and E. Kim, et al., A far- and mid-infrared study of HMX (octahydro-1,3,5,7-tetranitro-1,3,5,7-tetrazocine) under high pressure, Chem. Phys. Lett., 2010, 500(1–3), 28–34 CrossRef.
- O. Sharia, R. Tsyshevsky and M. M. Kuklja, Surface-Accelerated Decomposition of δ-HMX, J. Phys. Chem. Lett., 2013, 4(5), 730–734 CrossRef PubMed.
- C. Lang, M. Xin and H. Yi-min, et al., Multi-point temperature measuring cook-off test and numerical simulation of explosive, Acta Armamentarii, 2011, 32(10), 1230–1236 Search PubMed.
- B. F. Henson, B. W. Asay and R. K. Sander, et al., Dynamic Measurement of the HMX β–δ, Phase Transition by Second Harmonic Generation, Phys. Rev. Lett., 1999, 82(6), 1213–1216 CrossRef.
- R. J. Karpowiez and T. B. Brill, et al., Kinetic data for solid phase transitions by FTIR, Appl. Spectrosc., 1983, 37(1), 79–81 CrossRef.
- A. S. Tappan, A. M. Renlund, J. H. Gieske and J. C. Miller, Raman spectroscopic and ultrasonic measurements to monitor the HMX β → δ phase transition, SAND99–2667C, 1999 Search PubMed.
- B. F. Henson, B. W. Asay and R. K. Sander, Dynamic measurement of the HMX β → δ phase transition by second harmonic generation, Phys. Rev. Lett., 1999, 82(6), 1213–1216 CrossRef.
- B. W. Asay, B. F. Henson and L. B. Smilowitz, On the difference in impact sensitivity of beta and delta HMX, Energ. Mater., 2003, 21, 223–235 CrossRef.
- B. F. Henson, L. B. Smilowitz and B. W. Asay, The β → δ phase transition in the energetic nitramine octahydro-1,3,5,7-tetranitro-1,3,5,7-tetrazocine: Thermodynamics, J. Chem. Phys., 2002, 1 l 7(8), 3780–3788 CrossRef.
- L. Smilowitz, B. F. Henson and B. W. Asay, The β → δ phase transition in the energetic nitramine octahydro-1,3,5,7-tetranitro-1,3,5,7-tetrazocine: kinetics, J. Chem. Phys., 2002, 117(8), 3789–3798 CrossRef.
- L. B. Smilowitz, B. F. Henson and M. Greenfield, On the nucleation of the β → δ phase transition in the energeticnitramine octahydro-1,3,5,7-tetranitro-1,3,5,7-tetrazocine, J. Chem. Phys., 2004, 121(11), 5550–5552 CrossRef PubMed.
- R. K. Weese, Kinetics of β → δ solid-solid phase transition of HMX, UCRL-LR-143 960, 2000 Search PubMed.
- R. K. Weese, J. L. Maienschein and C. T. Perrino, Kinetics of the β → δ solid-solid phase transition of HMX, octahydro-1,3,5,7-tetranitro-1,3,5,7-tetrazocine, Thermochim. Acta, 2003, 40l, 17 Search PubMed.
- L. B. Smilowitz, B. F. Henson and B. W. Asay, Kinetics of the β → δ phase transition in PBX9501, Shock Compresion of Condensed Matter, 2001, CP620, 1077–1080 Search PubMed.
- J. M. Zaug,D. L. Farber, C. K. Saw and B. L. Weeks, Kinetics of solid phase reactions at high pressure and temperature, UCRL-ID-147389, 2002 Search PubMed.
- M. Hermann, W. Engel and N. Eisenreich, Thermal analysis of the phases of HMX using X-ray diffraction, Z. Kristallogr. Cryst. Mater., l993, 204, 121–128 Search PubMed.
- E. A. Glascoe, J. M. Zaug and A. K. Burnham, Pressure-dependent decomposition kinetics of the energetic material HMX up to 3.6 GPa, J. Phys. Chem. A, 2009, 113(48), 13548–13555 CrossRef PubMed.
- A. P. Wemhoff, A. K. Burnham and A. L. Nichols, Application of Global Kinetic Models to HMX β → δ Transition and Cook off Processes, J. Phys. Chem. A, 2007, 111, 1575–1584 CrossRef PubMed.
- A. K. Burnham, R. K. Weese and Brandon L. Weeks, A Distributed Activation Energy Model of Thermodynamically Inhibited Nucleation and Growth Reactions and Its Application to the β → δ Phase Transition of HMX, J. Phys. Chem. B, 2004, 108, 19432–19441 CrossRef.
- G. Terrones, J. Francisco and S. M. W. Burkett, et al., The Effect of Cook-Off on the Bulk Permeability of a Plastic Bonded Explosive, Propellants, Explos., Pyrotech., 2006, 31(5), 333–342 CrossRef.
- L. Chen, X. Ma and F. Lu, et al., Investigation of the Cook-off Processes of HMX-based Mixed Explosives, Cent. Eur. J. Energ. Mater., 2014, 11(2), 199–218 Search PubMed.
- W. Yanqing and H. Fenglei, Thermal mechanical anisotropic constitutive model and numerical simulations for shocked β-HMX single crystals, European Journal of Mechanics, A: Solids, 2012, 36, 66–82 CrossRef.
- X. Wang, Y. Wu and F. Huang, et al., Mesoscale thermal–mechanical analysis of impacted granular and polymer-bonded explosives, Mech. Mater., 2016, 99, 68–78 CrossRef.
- J. J. Dick, D. E. Hooks and R. Menikoff, et al., Elastic–plastic wave profiles in cyclotetramethylene tetranitramine crystals, J. Appl. Phys., 2004, 96(1), 374–379 CrossRef.
- R. Hill, Generalized constitutive relations for incremental deformation of metal crystals by multislip, J. Mech. Phys. Solids, 1966, 14(2), 95–102 CrossRef.
- R. J. Asaro and J. R. Rice, Strain localization in ductile single crystals, J. Mech. Phys. Solids, 1977, 25(5), 309–338 CrossRef.
- D. Peirce, R. J. Asaro and A. Needleman, Material rate dependence and localized deformation in crystalline solids, Acta Metall., 1983, 31(12), 1951–1976 CrossRef.
- R. J. Asaro, Micromechanics of Crystals and Polycrystals, Adv. Appl. Mech., 1983, 23(08), 1–115 Search PubMed.
- R. J. Asaro, Crystal plasticity, J. Appl. Mech., 1983, 50, 921–934 CrossRef.
- R. J. Asaro and A. Needleman, Overview no. 42 texture development and strain hardening in rate dependent polycrystals, Acta Metall., 1985, 33, 923–953 CrossRef.
- M. Ortiz, R. Radovitzky and E. Repetto, The computation of the exponential and logarithmic mappings and their first and second linearizations, Int J Numer Methods Eng, 2001, 52, 1431–1441 CrossRef.
- J. J. Gilman and J. J. Bikerman, Micromechanics of Flow in Solids, Phys. Today, 1971, 24(10), 57 CrossRef.
- Y. M. Gupta, G. E. Duvall and G. R. Fowles, Dislocation mechanisms for stress relaxation in shocked LiF, J. Appl. Phys., 1975, 46(2), 532–546 CrossRef.
- D. Hull and D. J. Bacon, Introduction to Dislocations, Pergamon Press, Oxford, 1984 Search PubMed.
- J. J. Gilman and W. G. Johnston, Dislocations in Lithium Fluoride Crystals, J. Appl. Phys., 1962, 13(4), 147–222 Search PubMed.
- J. P. Hirth and J. Lothe, Theory of dislocations, 1982 Search PubMed.
- R. Becker, Effects of crystal plasticity on materials loaded at high pressures and strain rates, Int. J. Plast., 2004, 20(11), 1983–2006 CrossRef.
- D. C. Wallace, Irreversible thermodynamics of flow in solids, Phys. Rev. B: Condens. Matter Mater. Phys., 1980, 22(22), 1477–1486 CrossRef.
- G. C. Johnson and D. J. Bammann, Discussion of stress rates in finite deformation problems, Int. J. Solids Struct., 1984, 20(8), 725–737 CrossRef.
- T. T. Zhou, Thermal expansion behaviors and phase transitions of HMX polymorphs via ReaxFF molecular dynamics simulations, Acta Phys. Sin., 2012, 61(24), 514–518 Search PubMed.
- H. L. Cui, G. F. Ji and X. R. Chen, et al., Phase Transitions and Mechanical Properties of Octahydro-1,3,5,7-Tetranitro-1,3,5,7-Tetrazocine in Different Crystal Phases by Molecular Dynamics Simulation, J. Chem. Eng. Data, 2010, 55(9), 3121–3129 CrossRef.
- R. Menikoff and T. D. Sewell, Constituent properties of HMX needed for mesoscale simulations, Combust. Theory Modell., 2002, 6(1), 103–125 CrossRef.
- J. M. Zaug, Elastic constants of β-HMX and tantalum, equations of state of supercritical fluids and fluid mixtures and thermal transport determinations, Eleventh International Detonation, 1998, Symposium, Snowmass, CO (US) Search PubMed.
- ABAQUS, in ABAQUS Manual, Version 6.9, Providence, RI, Simulia, 2009 Search PubMed.
- F. Reif, Fundamentals of Statistical and Thermal Physics, Mc-Graw-Hill Book Company, 1965 Search PubMed.
| This journal is © The Royal Society of Chemistry 2018 |

