 Open Access Article
Structural disorder in the high-temperature cubic phase of GeTe
Ming Xu a,
Zhenyu Leia,
Junhui Yuana,
Kanhao Xue*a,
Yanrong Guob,
Songyou Wang
 *b,
Xiangshui Miao
 a and
Riccardo Mazzarellocd
aWuhan National Research Center for Optoelectronics, School of Optical and Electronic Information, Huazhong University of Science and Technology, Wuhan 430074, China. E-mail: xkh@hust.edu.cn
bShanghai Ultra-Precision Optical Manufacturing Engineering Center and Department of Optical Science and Engineering, Fudan University, Shanghai, 200433, China. E-mail: songyouwang@fudan.edu.cn
cInstitute for Theoretical Solid State Physics, RWTH Aachen University, Aachen 52074, Germany
dJARA-FIT and JARA-HPC, RWTH Aachen University, Aachen 52056, Germany
First published on 11th May 2018
Abstract
In traditional materials science, structural disorder tends to break the symmetry of the lattice. In this work, however, we studied a case which may be opposite to this intuition. The prototypical phase change material, GeTe, undergoes the phase transition from the rhombohedral structure to a more symmetric cubic one at ∼625 K. Using ab initio molecular dynamics simulations, we demonstrated that even in the cubic phase, the lattice is constructed by random short and long bonds, instead of bonds with a uniform length. Such bifurcation of the bond lengths enabled by Peierls-like distortion persists in the entire temperature range (0–900 K), yet with different degrees of disorder, e.g., the atoms are distorted along a certain direction in the rhombohedral phase (i.e., structural order) but the distortion varies stochastically in terms of direction and amplitude at high T (i.e., structural disorder). A more symmetric lattice frame coexisting with severe local structural disorder is the signature of this cubic GeTe. Our simulations have provided a theoretical support on the disordered Peierls-like distortion in the high-T cubic phase discovered earlier by X-ray experiments. By modulating the physical properties that different degrees of disorder may induce, we are able to design better functional materials for various applications in electronic and photonic devices.
Introduction
The term “disorder” in the materials science usually refers to the deviation that a system differs from its perfect or ordered counterpart.1 In some multi-component materials particularly the metallic alloys, high temperature (T) may lead to the random atomic distribution of two or more constituents, resulting in the “compositional disorder”. The intrinsic vacancies sometimes participate in such compositional order–disorder transition and as a result, the electronic states become localized.2–5 Yet, in liquid and amorphous systems,6,7 the disorder stems from the random displacement of atoms and the absence of long-range periodicity, such as amorphous silicon which is devoid of long-range “structural order” in contrast to the perfect diamond-like crystal. The structural disorder can also take place solely in crystalline compounds, e.g., the solid electrolyte AgI has a “molten” cation sublattice at high T.8 The disordering of systems is usually enabled by the increase of compositional or dynamic entropy, accompanied by the altering of physical properties. Thus, the modulation of structural disorder plays crucial roles in designing new functional materials in modern society, tailoring them for various applications in electronic and photonic devices. For example, the phase-change data storage materials (e.g., Ge-Sb-Te9–12 and GeTe13–16) take advantage of the large properties change when the lattice symmetry is broken/established upon the reversible crystalline–amorphous transition.Intuitively, structural disorder usually leads to the break of the lattice symmetry because it induces large displacement of atoms away from their equilibrium positions. In this work, we have systematically studied an opposite case in which the structural disorder co-exists with the higher symmetry of lattice. The chalcogenide GeTe is a prototypical phase-change memory material and this compound was also discovered to undergo a phase transition at high temperature where GeTe turns into a more symmetric cubic structure from the rhombohedral one at room temperature (RT).17 This phase transition is sometimes classified into the ferro-paraelectric-like transition,18 mostly observed in ultra-thin films and nano-sized materials because the bulk GeTe is a defect-ridden conductive material.19,20 One may assume that the cubic structure is more ordered than the rhombohedral one, but our ab initio molecular dynamics (AIMD) simulations indicate the other way around. We find that high temperature activates the atomic motion, displacing the atoms in a random fashion but unexpectedly making the long-range order more symmetric.
Methods
The GeTe models at various temperatures were built with AIMD simulations enabled by the Vienna ab initio simulation package (VASP) code.21 The density functional theory (DFT) simulations were performed using the projector augmented-wave (PAW) method22,23 with the generalized gradient approximation (GGA-PBE24). Supercells with 216 atoms were constructed into a hexagonal lattice and the lattice parameters were selected according to the relaxed rhombohedral and cubic structures. AIMD simulations were performed on supercells at temperatures from 200 K to 900 K for 10![[thin space (1/6-em)]](https://www.rsc.org/images/entities/char_2009.gif) 000 steps each (2 fs per step), and the last 2000 steps were used for the structure analysis. We applied Nosé–Hoover thermostat on the canonical ensembles for the AIMD simulations.25 Since 625 K is the experimentally determined transition point,19 below which we used the rhombohedral a/c ratio and above that we took the cubic a/c ratio. We fixed volumes and lattice parameters of all supercells at different temperatures so that the structural disorder is solely determined by the temperature.
000 steps each (2 fs per step), and the last 2000 steps were used for the structure analysis. We applied Nosé–Hoover thermostat on the canonical ensembles for the AIMD simulations.25 Since 625 K is the experimentally determined transition point,19 below which we used the rhombohedral a/c ratio and above that we took the cubic a/c ratio. We fixed volumes and lattice parameters of all supercells at different temperatures so that the structural disorder is solely determined by the temperature.
It is well known that DFT-GGA systematically underestimates the fundamental band gaps for semiconductors, due to the lacking of derivative discontinuity in exchange–correlation functionals.26 Here, we implemented a self-energy corrected GGA-1/2 method27–29 to effective resolve the band gap problem for semiconductors such as GeTe. The method corrects the spurious electron self-interaction term in GGA using the Slater half-occupation technique, while keeping the computational cost at the same level of plain GGA. Aiming at correcting the self-energy of the hole in the valence band, GGA-1/2 attached the trimmed self-energy potentials to the anions in real space. Once the hole is shared by two atoms as in covalent bonds, it is GGA-1/4 that should be used. Specifically, the trimmed self-energy potentials for Ge, i.e., V[Ge: 4s24p2] − V[Ge: 4s24p1.75], and Te, i.e., V[Te: 5s25p4] − V[Te: 5s25p3.75], with specific cutoff radii were imposed as external potentials. A series of self-consistent cycles were carried out to fix the optimal cutoff radii for the self-energy potentials, which ought to maximize the band gap of GeTe according to the principles of GGA-1/2. Electronic structures were obtained with this optimal cutoff radius only, and no empirical parameters were involved.
Results and discussion
The crystalline GeTe has a rhombohedral structure (R3m, no. 160) or a distorted rocksalt structure at RT.30 The signature of this structure is the Peierls-like distortion (PLD) which drives it away from a perfect cubic phase.31–35 As a result of this PLD, the Ge-layers and Te-layers do not equally stack along the c direction in the rhombohedral GeTe (r-GeTe). Instead, all the Ge-layers move towards the Te-layers (or equivalently, the Te-layers move towards Ge-layers) along c direction, entailing the alternating distribution of small and large spacing between layers. In the framework of the distorted rocksalt structure, the PLD can be viewed as one face-centered-cubic (fcc) sub-lattice moving towards the other along [111] direction, accompanied with the lattice distortion by 1–2°. The chemical bonds in r-GeTe are consequently distorted by PLD: each atom connects to six neighbors with three short and three long bonds (see the ball–stick model in Fig. 1). The bond lengths are calculated to be 3.25 Å and 2.82 Å, in good agreement with other DFT results which are approximately 3.25 Å and 2.86 Å,11,14,36 and slightly larger than experimental values37 (3.15 Å and 2.83 Å). The deviation between the computational and experimental bond lengths originates from the different ground-state densities (the calculated density of crystalline GeTe is ∼3% lower than the experimental one).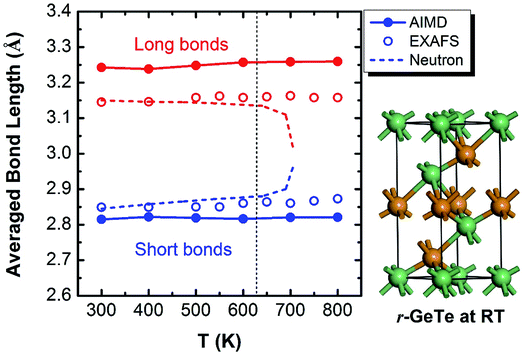 | ||
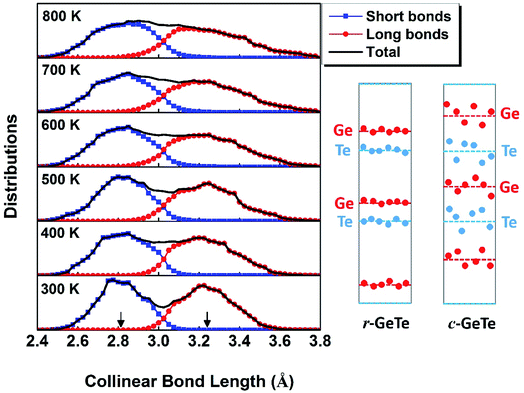
| Fig. 1 Bond lengths of GeTe calculated from AIMD models (solid lines) show that the PLD leads to the short and long bonds at the RT (see the ball–stick model on the right). Interestingly, the short and long bonds (colored by blue and red) persist even beyond the rhombohedral to cubic transition at ∼625 K, consistent with the EXAFS observation (open circles),37,39 but different from an earlier neutron diffraction experiment which found the short and long bonds converge upon phase transformation (dashed lines).38 | ||
The phase transition of the GeTe takes place at ∼625 K (the specific transition temperature varies with the content of defects),19 assumedly accompanied by the concomitant elimination of PLD which is supposed to disappear completely when GeTe transforms from rhombohedral to rocksalt cubic (c-GeTe) phases. Hypothetically, the change of the bond length upon temperature should obey the dashed lines in Fig. 1 which was measured by the neutron diffraction.38 Later, it was argued by Fons et al.37 that the neutron diffraction failed to reveal the local structure and instead it only measured the “average” effect of bond length. A more sophisticated technique enabled by extended X-ray absorption fine structure (EXAFS) was applied to investigate the detailed local structure, showing that the short and long bonds persist even after the phase transition (open circles in Fig. 1).37,39,40 This observation is backed up by our AIMD calculations, demonstrating that the calculated bond lengths remain bifurcated even above the transition point (solid lines in Fig. 1). The bifurcation of bond lengths at high temperature (>625 K) indicates that, even though the lattice becomes more symmetric in terms of long-range order at high T, the PLD fails to disappear and the short-range motifs of this rocksalt structure possess strong local structural disorder.
To understand this structural disorder, we further analyzed the AIMD models. The advantage of the atomic simulations over the experiments is the more detailed analysis of atomic positions and bonds. Thus, we studied the atomic coordinates of all the instantaneous configurations at different temperatures and plotted the distributions of near-collinear short and long bonds in Fig. 2. The total distribution (black lines) is calculated by adding up the distribution of short and long bonds (red and blue lines). As expected, the bond lengths distribution is separated into two parts, in accordance with the short and long bonds whose average values are also plotted in Fig. 1. At the RT, the distributions of short and long bonds are rather sharp without much overlap, and even in the total distribution of bond length plot (black lines), both peaks are easily discernable. The arrows in Fig. 2 mark the average short and long bond lengths. Interestingly, upon the elevation of temperature, the arrows remain in the original positions (indicating that the average short and long bond lengths are almost constant, as seen in Fig. 1), but the distributions of bond lengths become broadened and they start to diffuse into each other due to thermal vibration. At 800 K, we can hardly distinguish the two peaks from the overall bond length distribution. This is the probable reason why the neutron diffraction failed to observe the short and long bonds38 because it can only reveal the average bond length in a large scale of samples. The distribution of the bond length provides a first-hand evidence that the local structure of GeTe is a combination of PLD and thermal vibration.
To this end, we propose a schematic picture of the atomic distributions of r-GeTe and c-GeTe in Fig. 2. The randomness of the atomic positions is slightly exaggerated so that the differences between r-GeTe and c-GeTe can be readily distinguished. Due to the relatively ordered PLD in r-GeTe, Ge and Te atoms (blue and red dots) are neatly located near the average layer positions (dashed lines) with moderate vibrations. However, high T has gradually destroyed the order of PLD, driving the atoms to move randomly around the average positions. Such stochastic atomic variations along random directions lead to severe local structural disorder but equally align the atomic layers, transforming the lattice into a more symmetric one. There are two questions arised from the proposed models: (1) why the atoms become more disordered at high T? In the schematic of Fig. 2, the question can be translated into “why high T drives the atoms (red and blue dots) far away from the average positions (the dashed lines)?” (2) What drives the phase transformation from rhombohedral to a more symmetric cubic phase? This question can be interpreted as “why the average layer positions (the dashed lines) move?” in Fig. 2.
The answer to the first question appears to be quite straightforward: high T increases the diffusivity of atoms, enabling them to explore larger space. This question, however, is fundamentally important because the disorder leads to the entropy change which may drive the phase transition. The chemical disorder always increases the configurational entropy, while the structural disorder activated by high temperature is usually linked with the dynamic entropy. Both configurational and dynamic entropies have a general equation S = kB![[thin space (1/6-em)]](https://www.rsc.org/images/entities/char_2009.gif) ln
ln![[thin space (1/6-em)]](https://www.rsc.org/images/entities/char_2009.gif) Ω, yet with different ways to evaluate Ω. In dynamic entropy, Ω denotes for the normalized volume the system has explored in the phase space in regard of positions and momenta, usually determined by phonon calculations.41 In GeTe, the high-T phase is unstable at 0 K, making it difficult to determine the stable phonon modes. Hence, we quantify the dynamic entropy by recording the regions that all the atoms has explored.
Ω, yet with different ways to evaluate Ω. In dynamic entropy, Ω denotes for the normalized volume the system has explored in the phase space in regard of positions and momenta, usually determined by phonon calculations.41 In GeTe, the high-T phase is unstable at 0 K, making it difficult to determine the stable phonon modes. Hence, we quantify the dynamic entropy by recording the regions that all the atoms has explored.
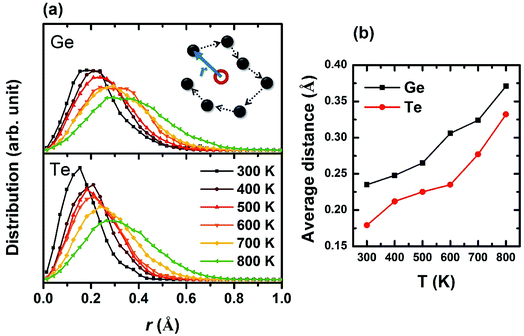
To determine the entire space the atoms have reached, we first calculated the average position for each atom by summing up all the trajectories that each atom has left (as marked in the red open circle in the inset of Fig. 3), then analyzed the relative distances from the trajectories to this “central position”. The distribution of all relative distances is plotted in Fig. 3a for Ge and Te under different temperatures. Obviously, the atoms diffuse to larger regions at higher temperature and Ge appears to be more mobile than Te probably due to its smaller ionic radius. This trend is also reflected on the average positions of atomic trajectories versus temperature in Fig. 3b. The study of atomic trajectories offers a more quantitative definition of local structural disorder, contributing to a better understanding of the dynamic entropy which obviously increases with temperature, and meanwhile supporting the atomic distributions we plotted in the schematic of Fig. 2.
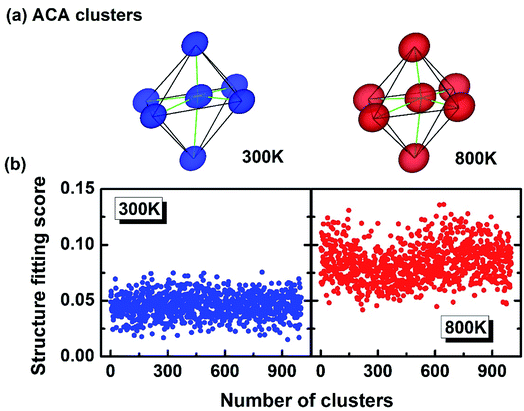
The above study (relation between the atomic motion and temperature) demonstrates that high T has driven the system into a more thermally disordered state, which explains why the bimodal peaks in the Fig. 2 are broadened at high T. But whether the disorder is solely due to the thermal diffusion? How about the constant PLD in Fig. 2? To answer these questions, the 3-D visualization of the local motifs has been presented by a more sophisticated approach called atomic cluster alignment (ACA) method.42 Fundamentally, the ACA method sorts out all the short-range clusters in a given atomic model, and each one is compared with a cluster template (which is selected from the average local structure) by rotating and translating until they match with each other best (by minimizing the overall mean-square distances). All these clusters are overlapped and a final superposed motif “ACA cluster” can then be generated (Fig. 4a). Basically, each vertice in the ACA cluster is the collection of many atoms. If this final motif is well-defined without much diffusion, it means all the superposed clusters look alike. In contrast, if the local structure has large disordered distortions, the ACA method will result in a distorted and diffused cluster. In Fig. 4a, the ACA clusters at 300 K and 800 K can both be defined as “distorted octahedra” with three short bonds and three long bonds, demonstrating that high temperature fails to break such a distorted local structure (on the contrary, the ACA cluster is supposed to be a perfect octahedron if there is no PLD at high T). Meanwhile, the “atomic clouds” in the vertex of the 800 K cluster appear to be bigger than those at 300 K, indicating that atoms indeed vibrate in a larger area under high T. This could also be reflected on the “structure fitting score”, which quantitates the difference between each cluster and the template during the ACA calculation. The structure fitting score close to 0 means all selected clusters in this model strictly resemble each other, and greater value of this parameter indicates less similarity. We randomly collected around 1000 local clusters at both 300 K and 800 K, and calculated their structure fitting scores (shown in Fig. 4b). The scores for 800 K are apparently larger than those in 300 K by a margin of ∼0.05, indicating that the local structure of GeTe at 800 K shows less resemblance than that at 300 K and demonstrating that higher T indeed leads to larger disorder. Therefore, the structural disorder in cubic GeTe originates from both intrinsic distortion (related to configurational entropy) and thermal vibration (related to dynamic entropy).
Raty et al. in an earlier work31 stated that the PLD disappears in the high-T cubic phase (by postulation) and “reenters” in the liquid state. While the liquid state surely contains PLD, the EXAFS experiments37 and our AIMD results disprove the disappearance of PLD in cubic phase, demonstrating that such a distortion, in fact, persists in all phases and is probably masked by large thermal noise at high T. The disordered PLD in a highly symmetric cubic phase is not rarely seen in other phase-change materials, such as Ge-Sb-Te (GST)43 or doped GeTe,44 in which the long-range order exhibits a perfect rocksalt structure while the local structure is severely distorted. Thermodynamically, the nature of the above phase transitions from a rhombohedral to a cubic phase is the same: they are resulted from the increase of entropy, e.g., high-T phase transition is due to the increase of structural disorder while doping/alloying is due to compositional disorder.
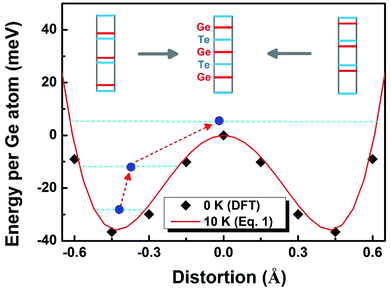
To solve the second question as “why the lattice becomes more symmetric at high T”, we need to find out the driving force of the phase transition. To this end, we performed nudged elastic band (NEB) calculations to map out the energy profile (without entropy) between two stable PLD configurations (we virtually moved all the Ge-layers from one stable PLD position to the other, see the inset of Fig. 5). As expected, the energy exhibits a two-well profile with a barrier in-between. To link the atomic displacement to free energy, we have adopted the following equation to simulate the Hamiltonian or free energy based on the distortion model:45
| Hdist(ΔL) = a(ΔL)2 + b(ΔL)4 + c | (1) |
 which are the positions of the two energy basins. We quench the GeTe model to very low temperature (∼10 K) and fit the equation (the red line in Fig. 5) until it well captures the feature of the DFT results (square symbols in Fig. 5). Eqn (1) is valid only for ordered models at low T, establishing the relation between the atomic distortion and the free energy.
There are two possible mechanisms that may drive the phase transition at high T: (1) the “displacive transition”,46 as two wells in the energy profile merge into one at high T, which is frequently seen in some ferro-paraelectric transitions above the Curie temperature. However, this proposal appears to conflict with the divergence of the bond length at high T, i.e., a one-well energy profile otherwise would not result in the PLD. Hence, our theoretical results do not favor this mechanism. (2) The “order–disorder transition” first suggested by Fons et al.,37 as the two-well energy profile retains, and the system is activated to energy levels above the barrier due to the Boltzmann distribution. According to the disordered cubic model studied in Fig. 1–4, this mechanism is the most probable reason for the phase transition, which is guided by the red dashed arrows in Fig. 5.
The blue solid circles in Fig. 5 indicate the relative positions between Ge- and Te-layers. At low temperature before the phase transition takes place, all Ge (or Te) atoms locate exclusively inside one of the energy basins. The elevating temperature increases the mobility of atoms, activating them to higher energy levels in the same basin. Eventually above the phase transition point, atoms are able to climb over the energy barrier and move freely between two basins, where the “ordered PLD” of the lattice is finally eliminated, i.e., the PLD becomes stochastically oriented.37 Hence, the phase transition of GeTe at high T can be explained as the atoms jumping out of one energy basin and exploring the whole region that covers both basins.47 This process makes the atomic distribution more random but averagely aligns the Ge- and Te-layers equally.
Now that we have clarified that the disordered short-range atomic arrangements and more symmetric long-range lattice can co-exist for GeTe at high T, it will be important to understand how such structural features impact on the properties of materials. The industry usually defines the r-GeTe as a narrow-gap semiconductor with high carrier concentration because the real-world crystalline GeTe materials contain a large amount of intrinsic Ge vacancies, which induces many defect states into the band gap.36,48 To reveal the band gap of the perfect stoichiometric GeTe, the DFT-determined models with routine LDA/GGA functionals were intensively studied, showing various band gap between 0.4–0.7 eV.49 Most of these calculations, however, still underestimate the band gap, particularly when DFT deals with the disordered or defective systems. To this end, we have applied GGA-1/4 method which promises to be more precise in determining the band gap of disordered GeTe (see Method section for details).
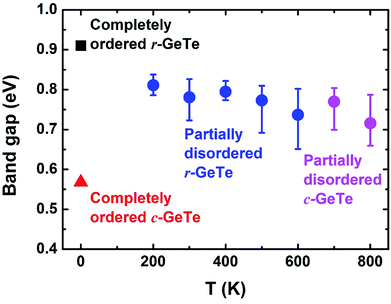
Several instantaneous structures from the AIMD models at different temperatures (from 200 K to 800 K) have been selected for the electronic structure calculations (the cells and atoms were not relaxed during the calculations). These structures represent different degrees of structural disorder, with higher temperature leading to larger distortion (Fig. 1–3). However, no clear trend is observed upon how band gap changes with the degrees of structural disorder (the calculated band gaps vary between 0.65–0.85 eV, see blue/pink dots and error bars in Fig. 6). This could be explained by similar average bond lengths (Fig. 1), which may yield similar band structures in average at different temperatures. Nevertheless, all the band gaps calculated from the disordered GeTe appear to be smaller than that obtained from the completely ordered (distorted) r-GeTe by 0.1–0.2 eV, and larger than completely ordered (undistorted) c-GeTe by 0.15–0.25 eV.
Fig. 6 is a clear example how local distortions and the disorder of such distortions affect the band gap. On the one hand, the ordered c-GeTe (without PLD) has narrower band gap than the ordered r-GeTe by ∼0.34 eV, majorly because the PLD in r-GeTe opens the band gap,16,34 and meanwhile, the so-called resonant bonding in the completely ordered c-GeTe is strengthened, leading to the small band gap.50 On the other hand, the disordered GeTe has smaller band gap than the ordered one (all with distortion), but the difference is not significant (0.1–0.2 eV). The similar band gaps between the ordered r-GeTe (distorted) and disordered crystalline GeTe (distorted as well) indicate that the band gap is majorly determined by the short-range orders, and the long-range order only has secondary contributions as long as the bonding nature remains unaltered (as demonstrated by the disordered crystalline GeTe in Fig. 6, below 625 K the lattice is rhombohedral and above that it is cubic). The band gaps of disordered GeTe are slightly smaller than the ordered r-GeTe, probably because the structural disorder of the lattice has induced some localized electronic states in the gap, forming “band tails”. We compute the band gap by the energy difference between the nearest conduction and valence bands in the density of states, and the band tails have shortened the distance between them.
Conclusion
In summary, earlier experiments discovered that crystalline GeTe undergoes the phase transition from the rhombohedral structure to a more symmetric cubic one upon heating. We have investigated the structure of crystalline GeTe at different temperatures with AIMD simulations, and revealed that the high-T c-GeTe is actually more structurally disordered than low-T r-GeTe. Demonstrated by the statistics of bond lengths, the PLD fails to disappear upon the phase transition: it neatly distorts the atomic layers along [111] direction in r-GeTe but high T gives atoms more degrees of freedom, enabling them to displace stochastically in a larger volume of space and thus, the atomic positions become rather disordered in c-GeTe. The PLD, as expected, opens the band gap, and meanwhile the disordered lattice has slightly smaller Eg than the ordered r-GeTe. The results of this work have demonstrated that the structural disorder can exist even in a highly symmetric crystal lattice, and this feature brings a new dimension of functionalities to the design of electronic and photonic devices, e.g., the multi-level phase-change memory in which the resistivity is tuned continuously by disorder.Conflicts of interest
There are no conflicts to declare.Acknowledgements
This work was supported through National Key Research and Development Plan of China (Grant No. 2017YFB0701700 “Materials Genome Engineering”). Computational resources were partially granted by JARA-HPC under the project of JARA0143. X. M. acknowledges the NSF of China (Grant No. 61306005, 61474052). K. X. acknowledges the NSF of China (Grant No. 11704134). S. W. acknowledges the NSF of China (Grant No. 11374055, 61427815). R. M. acknowledges the Deutsche Forschungsgemeinschaft (SFB 917 “Nanoswitches”).References
- A. B. Cairns and A. L. Goodwin, Chem. Soc. Rev., 2013, 42, 4881–4893 RSC.
- T. Siegrist, P. Jost, H. Volker, M. Woda, P. Merkelbach, C. Schlockermann and M. Wuttig, Nat. Mater., 2011, 10, 202–208 CrossRef CAS PubMed.
- W. Zhang, A. Thiess, P. Zalden, R. Zeller, P. H. Dederichs, J. Y. Raty, M. Wuttig, S. Blugel and R. Mazzarello, Nat. Mater., 2012, 11, 952–956 CrossRef CAS PubMed.
- M. Xu, W. Zhang, R. Mazzarello and M. Wuttig, Adv. Sci., 2015, 2, 1500117 CrossRef PubMed.
- P. Jost, H. Volker, A. Poitz, C. Poltorak, P. Zalden, T. Schäfer, F. R. L. Lange, R. M. Schmidt, B. Holländer, M. R. Wirtssohn and M. Wuttig, Adv. Funct. Mater., 2015, 25, 6399–6406 CrossRef CAS.
- P. G. Debenedetti and F. H. Stillinger, Nature, 2001, 410, 259–267 CrossRef CAS PubMed.
- E. Ma, Nat. Mater., 2015, 14, 547–552 CrossRef CAS PubMed.
- V. Sima, J. Alloys Compd., 2004, 378, 44–51 CrossRef CAS.
- M. Wuttig and N. Yamada, Nat. Mater., 2007, 6, 824–832 CrossRef CAS PubMed.
- D. Lencer, M. Salinga and M. Wuttig, Adv. Mater., 2011, 23, 2030–2058 CrossRef CAS PubMed.
- D. Lencer, M. Salinga, B. Grabowski, T. Hickel, J. Neugebauer and M. Wuttig, Nat. Mater., 2008, 7, 972–977 CrossRef CAS PubMed.
- Z. M. Sun, J. Zhou and R. Ahuja, Phys. Rev. Lett., 2006, 96, 055507 CrossRef PubMed.
- J. Akola and R. O. Jones, Phys. Rev. Lett., 2008, 100, 205502 CrossRef CAS PubMed.
- V. L. Deringer, W. Zhang, M. Lumeij, S. Maintz, M. Wuttig, R. Mazzarello and R. Dronskowski, Angew. Chem., Int. Ed., 2014, 53, 10817–10820 CrossRef CAS PubMed.
- A. V. Kolobov, P. Fons, J. Tominaga, A. L. Ankudinov, S. N. Yannopoulos and K. S. Andrikopoulos, J. Phys.: Condens. Matter, 2004, 16, S5103–S5108 CrossRef CAS.
- J. Y. Raty, W. Zhang, J. Luckas, C. Chen, R. Mazzarello, C. Bichara and M. Wuttig, Nat. Commun., 2015, 6, 7567 CrossRef PubMed.
- K. M. Rabe and J. D. Joannopoulos, Phys. Rev. B: Condens. Matter Mater. Phys., 1987, 36, 6631–6639 CrossRef CAS.
- Y.-W. Fang, H.-C. Ding, W.-Y. Tong, W.-J. Zhu, X. Shen, S.-J. Gong, X.-G. Wan and C.-G. Duan, Sci. Bull., 2015, 60, 156–181 CrossRef CAS.
- M. J. Polking, M.-G. Han, A. Yourdkhani, V. Petkov, C. F. Kisielowski, V. V. Volkov, Y. Zhu, G. Caruntu, A. Paul Alivisatos and R. Ramesh, Nat. Mater., 2012, 11, 700–709 CrossRef CAS PubMed.
- A. V. Kolobov, D. J. Kim, A. Giussani, P. Fons, J. Tominaga, R. Calarco and A. Gruverman, APL Mater., 2014, 2, 066101 CrossRef.
- G. Kresse and J. Furthmuller, Comput. Mater. Sci., 1996, 6, 15–50 CrossRef CAS.
- P. E. Blöchl, Phys. Rev. B: Condens. Matter Mater. Phys., 1994, 50, 17953–17979 CrossRef.
- G. Kresse and D. Joubert, Phys. Rev. B: Condens. Matter Mater. Phys., 1999, 59, 1758–1775 CrossRef CAS.
- J. P. Perdew, K. Burke and M. Ernzerhof, Phys. Rev. Lett., 1996, 77, 3865–3868 CrossRef CAS PubMed.
- W. G. Hoover, Phys. Rev. A, 1985, 31, 1695–1697 CrossRef.
- C. Toher, A. Filippetti, S. Sanvito and K. Burke, Phys. Rev. Lett., 2005, 95, 146402 CrossRef CAS PubMed.
- L. G. Ferreira, M. Marques and L. K. Teles, Phys. Rev. B: Condens. Matter Mater. Phys., 2008, 78, 125116 CrossRef.
- K.-H. Xue, L. R. C. Fonseca and X.-S. Miao, RSC Adv., 2017, 7, 21856–21868 RSC.
- L. G. Ferreira, M. Marques and L. K. Teles, AIP Adv., 2011, 1, 032119 CrossRef.
- H. M. Polatoglou, G. Theodorou and N. A. Economou, J. Phys. C: Solid State Phys., 1983, 16, 817 CrossRef CAS.
- J. Y. Raty, V. Godlevsky, P. Ghosez, C. Bichara, J. P. Gaspard and J. R. Chelikowsky, Phys. Rev. Lett., 2000, 85, 1950–1953 CrossRef CAS PubMed.
- Z. M. Sun, J. Zhou, H. K. Mao and R. Ahuja, Proc. Natl. Acad. Sci. U. S. A., 2012, 109, 5948–5952 CrossRef CAS PubMed.
- J. P. Gaspard, F. Marinelli and A. Pellegatti, Europhys. Lett., 1987, 3, 1095 CrossRef CAS.
- M. Xu, Z. Yu, L. Wang, R. Mazzarello and M. Wuttig, Adv. Electron. Mater., 2015, 1, 1500240 CrossRef.
- G. C. Sosso, S. Caravati, R. Mazzarello and M. Bernasconi, Phys. Rev. B: Condens. Matter Mater. Phys., 2011, 83, 134201 CrossRef.
- V. L. Deringer, M. Lumeij, R. P. Stoffel and R. Dronskowski, Chem. Mater., 2013, 25, 2220–2226 CrossRef CAS.
- P. Fons, A. V. Kolobov, M. Krbal, J. Tominaga, K. S. Andrikopoulos, S. N. Yannopoulos, G. A. Voyiatzis and T. Uruga, Phys. Rev. B: Condens. Matter Mater. Phys., 2010, 82, 155209 CrossRef.
- T. Chattopadhyay, J. X. Boucherle and H. G. vonSchnering, J. Phys. C: Solid State Phys., 1987, 20, 1431 CrossRef CAS.
- T. Matsunaga, P. Fons, A. V. Kolobov, J. Tominaga and N. Yamada, Appl. Phys. Lett., 2011, 99, 231907 CrossRef.
- J. M. Hudspeth, T. Chatterji, S. J. L. Billinge and S. A. J. Kimber, 2015, arXiv: 1506.08944.
- B. Fultz, Prog. Mater. Sci., 2010, 55, 247–352 CrossRef CAS.
- X. W. Fang, C. Z. Wang, Y. X. Yao, Z. J. Ding and K. M. Ho, Phys. Rev. B: Condens. Matter Mater. Phys., 2010, 82, 184204 CrossRef.
- A. V. Kolobov, P. Fons, A. I. Frenkel, A. L. Ankudinov, J. Tominaga and T. Uruga, Nat. Mater., 2004, 3, 703–708 CrossRef CAS PubMed.
- X. Biquard, M. Krbal, A. V. Kolobov, P. Fons, R. E. Simpson, B. Hyot, B. Andre, J. Tominaga and T. Uruga, Appl. Phys. Lett., 2011, 98, 231907 CrossRef.
- R. Fei, W. Kang and L. Yang, Phys. Rev. Lett., 2016, 117, 097601 CrossRef PubMed.
- U. D. Wdowik, K. Parlinski, S. Rols and T. Chatterji, Phys. Rev. B: Condens. Matter Mater. Phys., 2014, 89, 224306 CrossRef.
- M. E. Lines and A. M. Glass, Principles and Applications of Ferroelectrics and Related Materials, Oxford University Press, New York, 1977 Search PubMed.
- J. Feng, M. Xu, X. Wang, Q. Lin, X. Cheng, M. Xu, H. Tong and X. Miao, Appl. Phys. Lett., 2018, 112, 071902 CrossRef.
- A. H. Edwards, A. C. Pineda, P. A. Schultz, M. G. Martin, A. P. Thompson, H. P. Hjalmarson and C. J. Umrigar, Phys. Rev. B: Condens. Matter Mater. Phys., 2006, 73, 045210 CrossRef.
- K. Shportko, S. Kremers, M. Woda, D. Lencer, J. Robertson and M. Wuttig, Nat. Mater., 2008, 7, 653–658 CrossRef CAS PubMed.
| This journal is © The Royal Society of Chemistry 2018 |

