 Open Access Article
Luminescence property tuning of Yb3+-Er3+ doped oxysulfide using multiple-band co-excitation
Hong Wangaa,
Xiumei Yina,
Mingming Xinga,
Yao Fua,
Ying Tiana,
Tao Pangb,
Xin Fenga,
Tao Jianga and
Xixian Luo *a
*a
aPhysics Department, Dalian Maritime University, Dalian, Liaoning 116026, PR China. E-mail: luoxixiandl@126.com
bCollege of Science, Huzhou University, Huzhou, Zhejiang 313000, PR China
First published on 4th May 2018
Abstract
Lanthanide ions have abundant excited-state channels which result in a radiation relaxation process generally accompanied by a non-radiation relaxation process. However, non-radiation relaxation processes will consume the activation energy and reduce the luminescence efficiency of the phosphor. Two lasers with an excitation energy which matched the ground state absorption and excited state absorption of ions were used to excite the phosphors to avoid the non-radiation relaxation process. This approach can achieve the purpose of populating specific states of the lanthanide ions, and furthermore effectively tunes the luminescence intensity and color output of the sample. Results show that the red emission intensity of the sample is significantly improved and this is caused by populating the 4F9/2 level under simultaneous 1510 nm and 980 nm excitation. Then when the 1510 nm and 808 nm co-operate to excite the sample, the green emission obtained increased sharply because the 2H11/2/4S3/2 states were efficiently populated. As a proof-of-concept experiment, this new approach has potential in the applications of solar cells.
1. Introduction
The lanthanide ion doped upconversion luminescence (UCL) materials with unique optical and chemical properties have become cutting edge topics in the field of materials science.1–3 The intrinsic absorption efficiency of lanthanide ions is low because of the f–f part forbidden transition of the rare-earth ions. Further, the 4fn electron state of the lanthanide ions is enriched and usually leads to multiple overlapping emissions.4 The upconversion (UC) mechanism of lanthanide ions mainly includes ground state absorption (GSA) and excited state absorption (ESA). The non-radiative relaxation would inevitably occur during the energy transfer (ET) process which was caused by closer energy level spacing, which resulted in a lower UCL. At the present time, the controllable multicolor output is one of the hot topics in the UCL materials' field.5 Much basic research has been reported on the tuning of the UCL color output, such as choosing different combinations of matrix and activator,6–9 increasing ion doping concentration,10–12 controlling the particle size and morphology of upconverting nanoparticles and so on.13,14 The disadvantages of these methods usually come at the expense of weaker emissions. Recently, Shao et al.15 and Wang et al.16 and Su et al.17 used photonic crystals to tune the UCL which greatly enhanced the emission intensity.Notably, the erbium (Er3+) ion can work on 800 nm, ∼980 nm or ∼1500 nm excitation wavelengths (commercial infrared laser sources) because of its unique ladder-like energy levels (4I9/2, 4I11/2 and 4I13/2). Thus, the Er3+ ion is also a suitable alternative that can be used both as an activator and as a sensitizer. The co-operative excitation of multi-wavelength lasers was conducted to match the energies of GSA and ESA processes in Er3+ ions, which sharply boosted the UCL efficiency because the excitation power and UC emission intensity are a non-linear relationship. More importantly, this method can control the pumping of the specific level and regulate the luminescence color output. Zuo et al.18 reported that Er3+-doped sodium yttrium fluoride (NaYF4) samples were co-excited by three excitation sources such as 800 nm, 980 nm and 1530 nm. The UC emission intensities obtained from co-operative excitation are three times higher than the sum of UC intensities obtained using single laser excitation, which indicated that the UC properties of luminescence materials can be adjusted by multi-band co-excitation.
At the present time, fluoride matrix materials have been attracting a lot of attention because of their high UCL efficiency. The traditional high efficiency UCL fluoride-based materials cannot meet the requirements of stability of the UC materials in special applications. However, sulfur oxide, because of its high UC efficiency and superior physical properties such as high chemical stability and thermal stability, has been widely used as several commercial luminescent material matrices (illumination and display technology). Rare-earth doped oxysulfide is a very traditional luminescent material, and the research on it can be divided into two main categories. (1) Different preparation methods, such as vacuum sintering, precipitation, solvothermal methods, thermal decomposition and other methods were adopted to prepare oxysulfide luminescent materials, and to regulate size, morphology, and shape of the product obtained.19–22 In recent years, most of the work was mainly contributed to the synthesis of nano oxysulfide-based materials. (2) The downconversion luminescence (DCL) and UCL of rare-earth oxysulfides excited by a single wavelength were studied to explore its luminescence properties, especially for the DCL.23–27 Previous results show that micron sized rare-earth oxysulfides have very good UCL properties.28 More importantly, microsized UCL materials with highly luminescence efficiency, colorful emission input, and which are environmentally friendly are required for many practical applications, such as up-conversion X-ray detection, full-color displays, laser anti-counterfeiting and so on.
In this research, yttrium oxide sulfide doped with ytterbium and erbium (Y2O2S: Yb, Er) micro-crystals were prepared using a modified sulfide-fusion method and a variety of combinations of wavelength provided the excitation to excite the product obtained, effectively tuning the luminescent properties of the phosphor. The benefit of this research is that the novel method has great potential in the applications of solar cells and display technology.
2. Experimental
2.1 Sample preparation
The Y2O2S: Yb, Er samples were prepared using a modified sulfide-fusion route. The starting raw materials [yttrium(III) oxide (Y2O3), ytterbium(III) oxide (Yb2O3), erbium(III) oxide (Er2O3), sulfur (S)] and fluxes [sodium carbonate (Na2CO3, potassium carbonate (K2CO3), tripotassium phosphate (K3PO4)] to effectively reduce the calcination temperature were weighed according to stoichiometric ratio. The materials were thoroughly mixed and ground for 20 min using an agate ball mill. The samples were sintered in a nitrogen and hydrogen atmosphere at 1100 °C for 90 min and afterwards the mixture was pressed to form disks (30 MPa for 10 min). The sintered samples were washed several times with dilute hydrochloric acid and distilled water, and then dried. The Y2O2S: xYb, yEr samples with different Yb3+ and Er3+ concentrations were then obtained (x = 5, 8 mol%, y = 1, 2, 4, 6 mol%) (Table 1). The doping concentrations of Er3+ and Yb3+ were selected based on the results of previous work.29,30| Samples | Composition | |
|---|---|---|
| Yb (mol%) | Er (mol%) | |
| #1 | 5 | 2 |
| #2 | 5 | 4 |
| #3 | 8 | 1 |
| #4 | 8 | 2 |
| #5 | 8 | 4 |
| #6 | 8 | 6 |
2.2 Characterization technique
X-ray powder diffraction (XRD) was performed at 40 kV and 40 mA using a SmartLab 9 X-ray generator (Rigaku) with Cu Kα (λ = 0.15406 nm) radiation. The samples were pressed to form disks at 30 MPa using a FW-4A powder press machine. The UCL spectra (400 nm to 850 nm) were recorded on a FS5 fluorescence spectrometer (Edinburgh Instruments) with a 0.5 nm slit, equipped with a power tunable 808 nm, 980 nm and 1510 nm fibre laser diode (LD). The highest available power for the LD for all emissions was approximately 800 mW. The reflection spectra of the solutions were obtained using a UV-3600 ultraviolet-visible-near infrared (UV-Vis-NIR) spectrophotometer (Shimadzu). The morphology and energy dispersive X-ray spectroscopy (EDS) of the samples were performed using an Inspect F50 scanning electric microscope (SEM; FEI). The patterns were obtained using a self-assembled optical display imaging system.3. Results and discussion
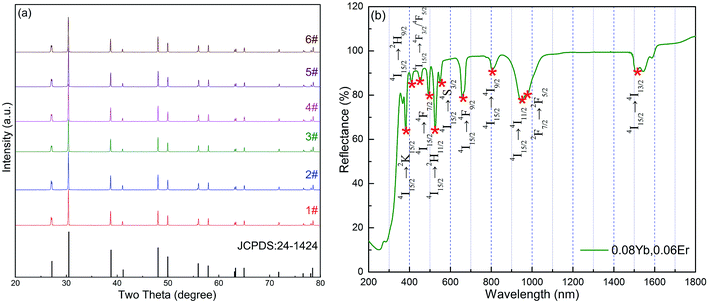
The XRD for all samples was measured to identify the phase of these samples and all the XRD patterns had a similar profile. The peak positions of the XRD patterns agree with those of Y2O2S crystals (JCPDS no. 24-1424), and this indicated that the pure hexagonal phase Y2O2S: Yb, Er crystal was synthesized successfully (Fig. 1a). The doping of Er and Yb into Y2O2S had no obvious effect on the crystallinity. The diffraction peak had a small shift to a large angle because the ion radii of the doped Yb3+ (0.858 nm) and Er3+ (0.881 nm) ions were smaller than that of the substituted Y3+ ion (0.893 nm) resulting in expansion of the lattice parameters according to the Prague formula. As an example, the morphology of the Y2O2S particles obtained (samples #1, #4, and #6) are shown in Fig. 2a–c. The prepared particles were highly crystalline and had a uniform size distribution. The EDS results revealed that the samples were composed of O, Y, S, Er, and Yb elements, which further confirms the presence of Er and Yb in the Y2O2S microparticles (Fig. 2d–f). Fig. 1b shows the diffuse reflectance spectra of sample #6. The absorption peaks at ∼800 nm, 980 nm, and ∼1500 nm could be assigned to the transition from an Er3+ ground state 5I15/2 to excited states 4I9/2, 4I11/2, and 4I13/2, respectively. This means that the Er3+ ions can be excited by all the ∼800 nm, 980 nm, and ∼1500 nm excitation wavelengths. Additionally, the absorption peak at ∼980 nm also corresponds to the transition from the 2F7/2 level to the 2F5/2 level in Yb3+ ions.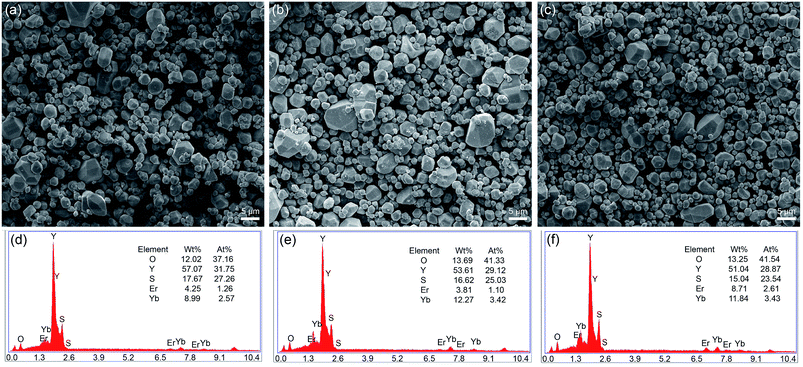 | ||
| Fig. 2 SEM image of #1 (a), #4 (b), and #6 (c) samples, EDS data of #1 (d), #4 (e), and #6 (f) samples. | ||
3.1 UCL performance at single wavelength excitation
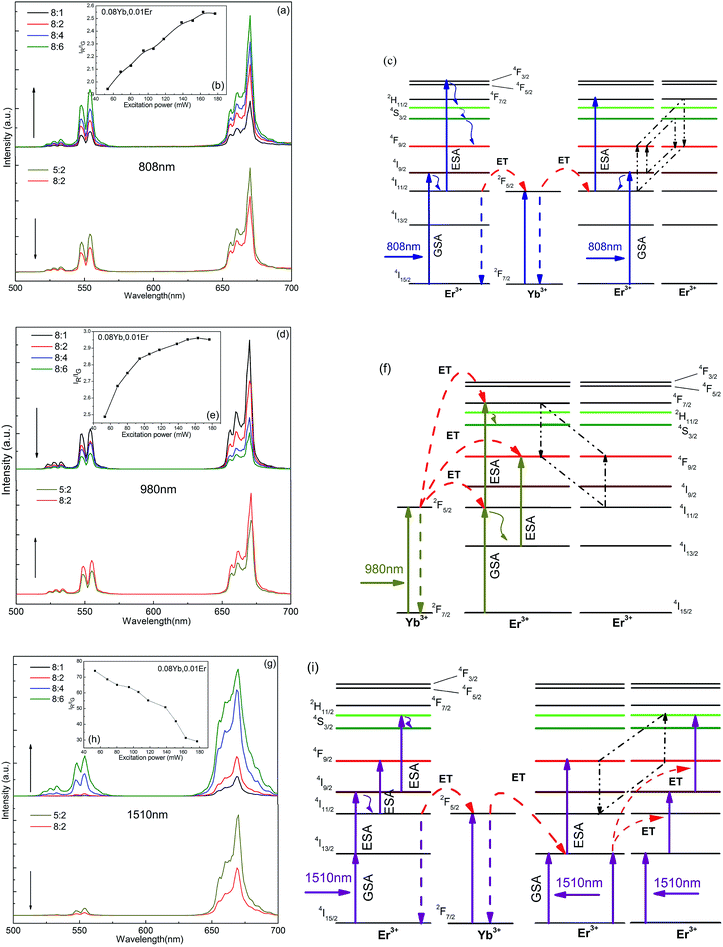
Y2O2S: Yb, Er samples both exhibited green UCL under single 808 nm and 980 nm pumping (Y2O2S: Yb, Er at 808 nm and Y2O2S: Yb, Er at 980 nm), respectively, (Fig. 3a and d). Although the red and green fluorescence intensity ratio (IR/IG) of Y2O2S: Yb, Er at 808 nm and Y2O2S: Yb, Er at 980 nm is 2–3, they still showed green emission to the human eye because it is 20 times more sensitive to green radiation than to red light under good lighting conditions. The red emission in Y2O2S: Yb, Er at 808 nm and Y2O2S: Yb, Er at 980 nm was mainly caused by the combination of non-radiative relaxation and cross relaxation (CR) processes. The mechanism of red emission in Y2O2S: Yb, Er at 808 nm may be as follows: (1) 4I9/2 + multiphonon relaxation → 4I11/2; 4I11/2 + hν808 nm → 4F3/2/4F5/2, 4F3/2/4F5/2 + multiphonon relaxation → 4F9/2, (2) 4I9/2 + 4I9/2 → 4I13/2 + 4S3/2; 4I9/2 + 4S3/2 → 4F9/2 + 4F9/2 (Fig. 3c). The red emission in Y2O2S: Yb, Er at 980 nm may be as follows: (1) 4I11/2 + multiphonon relaxation → 4I13/2; 4I13/2 + hν980 nm → 4F9/2, (2) 4I11/2 + 4F7/2 → 4F9/2 + 4F9/2 (Fig. 3f). However, the green emission of Y2O2S: Yb, Er at 1510 nm excitation (Y2O2S: Yb, Er at 1510 nm) was significantly inhibited and the red component was increased, which contributed to 4I9/2 + multiphonon relaxation → 4I11/2, and Er3+ (4I9/2) → Yb3+ (2F5/2) → Er3+ (4I13/2) processes (Fig. 3g and i). These results indicated that non-radiative relaxation inevitably occurs during the UCL process. Note that Y2O2S: Yb, Er at 1510 nm presented pure red UCL with low Er3+ ion concentration and the green component was enhanced as the Er3+ ion concentration increased. The possibility of the 4F9/2 + 4F9/2 → 4F7/2 +4I11/2 CR and ET processes may affect the GSA process of ions and inhibit the pumping of the 4F9/2 level at high Er3+ concentrations. In addition, the IR/IG of sample #3 increased with the excitation power at a single excitation of 808 nm and 980 nm, whereas that at 1510 nm significantly decreased from 74 to 29.18 with the increase of excitation power (Fig. 3b, e, and h). With the increase in excitation power, the overall luminescence intensity of the sample increased, that is, the red and green emission intensity of the samples were both obviously improved, but the degree of enhancement of the two emissions was different. This was because of the speed of population of the 2H11/2/4S3/2, and 4F9/2 levels and decay rates were both different. Compared to Y2O2S: Yb, Er at 808 nm and Y2O2S: Yb, Er at 1510 nm, the UCL intensity of Y2O2S: Yb, Er at 980 nm decreased with the increasing of Er3+ ions because the Yb3+ ions act as an effective sensitizer at 980 nm pumping.3.2 UCL performance at multi-wavelength excitation
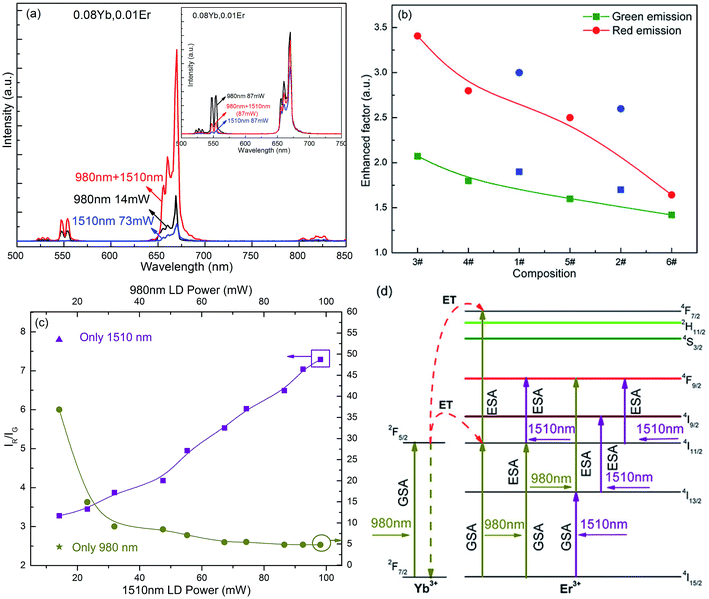
![[thin space (1/6-em)]](https://www.rsc.org/images/entities/char_2009.gif) 200 cm−1 which matched the excitation energy of 980 nm. Thus, the co-operative excitation of two lasers (1510 nm and 980 nm) were used simultaneously to excite Er3+, to contribute to the GSA and ESA processes. Sample #3 showed highly efficient UCL at simultaneous excitation of 1510 nm (73 mW) and 980 nm (14 mW) (Fig. 4a). Under dual wavelength excitation, the emission intensity (integral intensity) in the visible region of the sample was 3.2 times higher than the sum of UCL emission under the two single wavelength excitations, where the red light intensity was increased 3.4 times and the green light was only enhanced 2.1 times. Because UCL is a typical non-linear optical process (I = kPn, where I is emission intensity, k is a coefficient, P is the incident power density, and n is the number of pump photons), the emission intensity was sharply enhanced when the incident excitation energy was increased by superimposing the multi-band excitation. However, the emission intensity of the sample #3, excited by single 1510 nm (87 mW), was only 0.64 times higher than that obtained with two wavelength excitation (inset of Fig. 4a). The UCL intensity of the sample at 980 nm excitation (87 mW) was higher than that of the simultaneous two wavelength excitation because of the efficient absorption of Yb3+ ions at 980 nm and the high ET efficiency. Using proof-of-concept experiments, it was demonstrated that this novel method had potential for use in solar cell applications of because the UC materials could convert NIR to UV/Vis light to enhance the utilization of the solar spectrum. Additionally, the increase of emission intensity of the sample under double wavelength excitation decreased, and the enhanced factor for red light decreased more rapidly than that for green light with the increase of the Er3+ ion concentration (Fig. 4b). This indicated that it is possible that the CR and other ET processes increased with high Er3+ ion concentration and that this affected the GSA process of ions and inhibited the pumping of the 4F9/2 level.
200 cm−1 which matched the excitation energy of 980 nm. Thus, the co-operative excitation of two lasers (1510 nm and 980 nm) were used simultaneously to excite Er3+, to contribute to the GSA and ESA processes. Sample #3 showed highly efficient UCL at simultaneous excitation of 1510 nm (73 mW) and 980 nm (14 mW) (Fig. 4a). Under dual wavelength excitation, the emission intensity (integral intensity) in the visible region of the sample was 3.2 times higher than the sum of UCL emission under the two single wavelength excitations, where the red light intensity was increased 3.4 times and the green light was only enhanced 2.1 times. Because UCL is a typical non-linear optical process (I = kPn, where I is emission intensity, k is a coefficient, P is the incident power density, and n is the number of pump photons), the emission intensity was sharply enhanced when the incident excitation energy was increased by superimposing the multi-band excitation. However, the emission intensity of the sample #3, excited by single 1510 nm (87 mW), was only 0.64 times higher than that obtained with two wavelength excitation (inset of Fig. 4a). The UCL intensity of the sample at 980 nm excitation (87 mW) was higher than that of the simultaneous two wavelength excitation because of the efficient absorption of Yb3+ ions at 980 nm and the high ET efficiency. Using proof-of-concept experiments, it was demonstrated that this novel method had potential for use in solar cell applications of because the UC materials could convert NIR to UV/Vis light to enhance the utilization of the solar spectrum. Additionally, the increase of emission intensity of the sample under double wavelength excitation decreased, and the enhanced factor for red light decreased more rapidly than that for green light with the increase of the Er3+ ion concentration (Fig. 4b). This indicated that it is possible that the CR and other ET processes increased with high Er3+ ion concentration and that this affected the GSA process of ions and inhibited the pumping of the 4F9/2 level.
When the 1510 nm and 980 nm were used to simultaneously excite the sample, the color output of the sample could be effectively adjusted by changing the excitation power of the single wavelength laser (Fig. 4c). Interestingly, the dependence of the IR/IG on the excitation power was different from that under single wavelength excitation. When the excitation power of 980 nm was fixed, the IR/IG of the sample increased with the increasing of the 1510 nm excitation power. However, when the excitation power of 1510 nm was fixed, the IR/IG of the sample decreased which was caused by the population of the 2H11/2/4S3/2 energy level via the Yb3+ → Er3+ ET with the increase of the 980 nm excitation power. Compared with the single 980 nm excitation, the red UCL intensity of the sample was effectively enhanced by suppressing the green emission under the 1510 nm and 980 nm co-excitation. The possible UC mechanism for the sample at 1510 nm and 980 nm co-excitation is shown in Fig. 4d. Possible mechanisms are as follows: 4I15/2 + hν980 nm → 2I11/2; 4I11/2 + hν1510 nm → 4F9/2, or 4I15/2 + hν1510 nm → 2I13/2; 4I13/2 + hν980 nm → 4F9/2. These two processes have contributed to the population of the 4F9/2 energy level and improved the red light intensity. The previous results confirmed that the luminescence properties of a sample can be significantly adjusted using 1510 nm and 980 nm co-excitation.
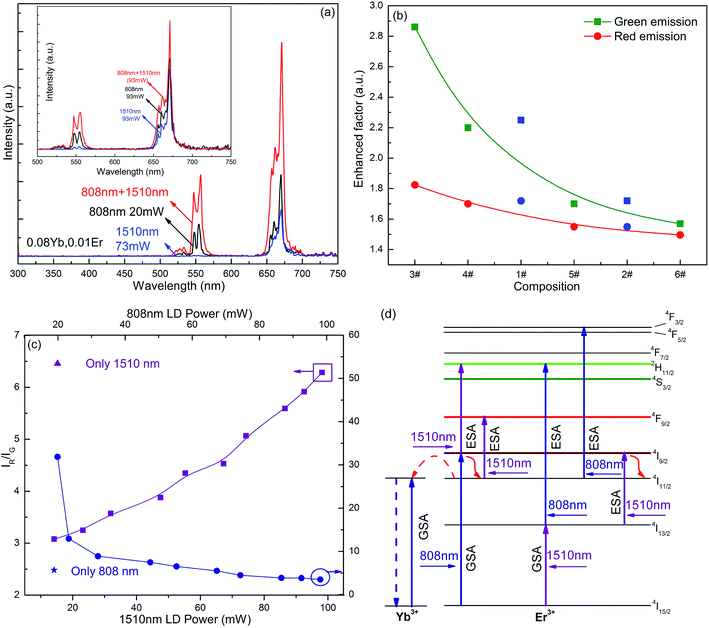
![[thin space (1/6-em)]](https://www.rsc.org/images/entities/char_2009.gif) 200 cm−1 and this matched exactly with the excitation energy of 980 nm. Therefore, samples were excited using the co-operative excitation of two lasers (1510 nm and 808 nm) to explore the luminescence properties of samples. The UCL intensity of sample #3 also increased significantly at simultaneous excitation at 1510 nm (73 mW) and 808 nm (20 mW) (Fig. 5a). Compared to the sum of UCL intensity excited by 1510 nm (73 mW) and 808 nm (20 mW) single wavelengths, the overall luminescence intensity of the sample was increased by 2.0 times, whereas the green light intensity was enhanced 2.9 times and the red light intensity was increased 1.8 times under co-excitation. Under 808 nm and 1510 nm simultaneous excitation, the luminescence intensity of sample #3 was 2.3 times higher than that under single 1510 nm excitation (93 mW), and 1.5 times higher than that under 808 nm pumping (93 mW) (inset of Fig. 5a). With the increase of doping concentration of the Er3+ ion, the intensity enhancement factor of the sample reduced when simultaneous excitation at two wavelengths was used and the enhancement factor for green emission decreased faster than that for red emission (Fig. 5b). When the excitation power at 808 nm was fixed, the IR/IG of the sample increased with the increase of the 1510 nm excitation power (Fig. 5c). Because of the short lifetime of the 2I9/2 level of the Er3+ ion, the 4I9/2 + multiphonon relaxation → 4I11/2 process will inevitably occur. The 4F9/2 level was populated and this was caused by the population of the 2I11/2 energy level, therefore the IR/IG of the sample increased as the excitation power of 1510 nm increased. However, when the excitation power of 1510 nm was fixed, the IR/IG of the sample decreased with the increase of the 808 nm excitation power. The possible UC mechanism for the sample at 1510 nm and 980 nm co-excitation is shown in Fig. 5d. Possible mechanisms are as follows: 4I15/2 + hν808 nm → 2I9/2; 4I9/2 + hν1510 nm → 2H11/2/4S3/2, or 4I15/2 + hν1510 nm → 2I13/2; 4I13/2 + hν808 nm → 2H11/2/4S3/2.
200 cm−1 and this matched exactly with the excitation energy of 980 nm. Therefore, samples were excited using the co-operative excitation of two lasers (1510 nm and 808 nm) to explore the luminescence properties of samples. The UCL intensity of sample #3 also increased significantly at simultaneous excitation at 1510 nm (73 mW) and 808 nm (20 mW) (Fig. 5a). Compared to the sum of UCL intensity excited by 1510 nm (73 mW) and 808 nm (20 mW) single wavelengths, the overall luminescence intensity of the sample was increased by 2.0 times, whereas the green light intensity was enhanced 2.9 times and the red light intensity was increased 1.8 times under co-excitation. Under 808 nm and 1510 nm simultaneous excitation, the luminescence intensity of sample #3 was 2.3 times higher than that under single 1510 nm excitation (93 mW), and 1.5 times higher than that under 808 nm pumping (93 mW) (inset of Fig. 5a). With the increase of doping concentration of the Er3+ ion, the intensity enhancement factor of the sample reduced when simultaneous excitation at two wavelengths was used and the enhancement factor for green emission decreased faster than that for red emission (Fig. 5b). When the excitation power at 808 nm was fixed, the IR/IG of the sample increased with the increase of the 1510 nm excitation power (Fig. 5c). Because of the short lifetime of the 2I9/2 level of the Er3+ ion, the 4I9/2 + multiphonon relaxation → 4I11/2 process will inevitably occur. The 4F9/2 level was populated and this was caused by the population of the 2I11/2 energy level, therefore the IR/IG of the sample increased as the excitation power of 1510 nm increased. However, when the excitation power of 1510 nm was fixed, the IR/IG of the sample decreased with the increase of the 808 nm excitation power. The possible UC mechanism for the sample at 1510 nm and 980 nm co-excitation is shown in Fig. 5d. Possible mechanisms are as follows: 4I15/2 + hν808 nm → 2I9/2; 4I9/2 + hν1510 nm → 2H11/2/4S3/2, or 4I15/2 + hν1510 nm → 2I13/2; 4I13/2 + hν808 nm → 2H11/2/4S3/2.
3.3 Application in display technologies
Obviously, the unique properties of the UCL materials will make them useful for many potential applications such as display technologies and so on. In the following experiment, a typical application display was performed. The as-prepared sample #3 was dispersed into transparent organic compounds according to certain ratios and then coated on an ordinary substrate. This luminescent film gave a bright green visible light under excitation of 808 nm and 980 nm, and displayed red UCL at excitation of 1510 nm. Because infrared light is not visible to human eyes and different wavelengths of the infrared excitation source were not easy to distinguish, the luminescent film dispersed with sample #3 could be used for detecting and distinguishing infrared light. Subsequently, a galvanometer scanning system was adopted to achieve the display (Fig. 6a). An optical microscope was used to capture images that can be shown on a computer. The galvanometer has two lenses (X-axis and Y-axis). The patterns were obtained when incident laser light was reflected from the X-axis to the Y-axis lens and then reflected on the luminescent film. The patterns changed as the angle of these two lenses was changed. Different colored patterns were achieved with different excitation sources (Fig. 6b–d).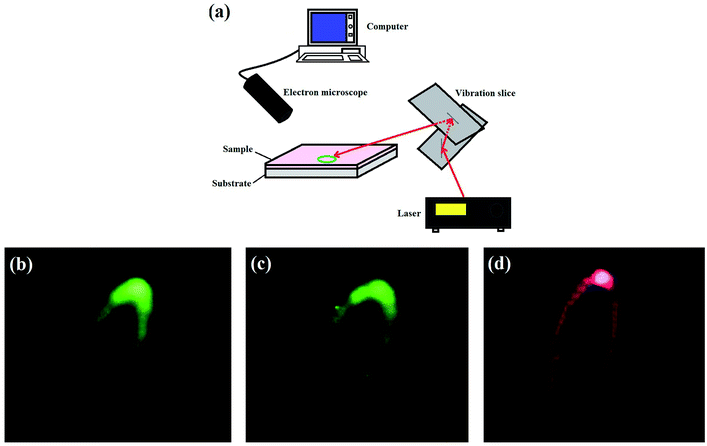 | ||
| Fig. 6 Schematic of the display setup for a galvanometer imaging device (a), colourful patterns obtained using excitation at 808 nm (b), 980 nm (c), and 1510 nm (d). | ||
4. Conclusions
In this research, the co-operative excitation of two lasers (808 nm and 980 nm or 1510 nm and 980 nm) was used to excite phosphors (to avoid the non-radiation relaxation process), which boosted the luminescence intensity. The specific states of the lanthanide ions can be populated to further tune the color output of the sample. The results show that the emission intensity of the sample excited by a dual wavelength was 3.2 times higher than the sum of UCL emission under two single wavelength excitation, whereas the red and green light intensities are increased 3.4 and 2.1 times, respectively. However, compared to the sum of UCL intensity excited by 1510 nm and 808 nm single wavelength, the overall luminescence intensity of the sample is only increased by 2.0 times, whereas the green and red light intensities are increased by 2.9 and 1.8 times, respectively, under co-excitation. With the increase of doping concentration of the Er3+ ion, the enhanced factor of luminescence intensity for a sample significantly degrades under the simultaneous excitation of two wavelengths because of the interaction between nearby ions. Furthermore, as a proof-of-concept experiment, this new approach has potential in the field of solar cells.Conflicts of interest
There are no conflicts to declare.Acknowledgements
The authors wish to thank the Research Program of Application Foundation (Main subject) of Ministry of Transport of PR China (No. 2015329225090), the National Natural Science Foundation of China (No. 11504039 and 51502031), and the Fundamental Research Funds for the Central Universities (Grant No. 3132016120, 3132016221, 3132016222, and 3132016349) for their financial support.References
- D. M. Yang, P. A. Ma and Z. Y. Hou, et al., Current advances in lanthanide ion (Ln3+) - based upconversion nanomaterials for drug delivery, Chem. Soc. Rev., 2015, 44, 1416–1448 RSC.
- Y. H. Zhang, L. X. Zhang and R. R. Deng, et al., Multicolor Barcoding in A Single Upconversion Crystal, J. Am. Chem. Soc., 2014, 136, 4893–4896 CrossRef CAS PubMed.
- H. Wang, X. M. Yin and M. M. Xing, et al., Investigation on the thermal effects of NaYF4:Er under 1550 nm irradiation, Phys. Chem. Chem. Phys., 2017, 19, 8465–8470 RSC.
- E. M. Chan, G. Han and J. D. Goldberg, et al., Combinatorial Discovery of Lanthanide-Doped Nanocrystals with Spectrally Pure Upconverted Emission, Nano Lett., 2012, 12, 3839–3845 CrossRef CAS PubMed.
- M. L. You, J. J. Zhong and Y. Hong, et al., Inkjet printing of upconversion nanoparticles for anti-counterfeit applications, Nanoscale, 2015, 7, 4423–4431 RSC.
- F. Wang and X. G. Liu, Upconversion multicolor fine-turning: visible to near- infrared emission from lanthanide-doped NaYF4 nanoparticles, J. Am. Chem. Soc., 2008, 130, 5642–5643 CrossRef CAS PubMed.
- W. Niu, S. Wu and S. Zhang, A facile and general approach for the multicolor tuning of lanthanide-ion doped NaYF4 upconversion nanoparticles within a fixed composition, J. Mater. Chem., 2010, 20, 9113–9117 RSC.
- Y. H. Zhang, L. X. Zhang and R. R. Deng, et al., Multicolor Barcoding in a Single Upconversion Crystal, J. Am. Chem. Soc., 2014, 136, 4893 CrossRef CAS PubMed.
- F. Wang and X. G. Liu, Multicolor Tuning of Lanthanide-Doped Nanoparticles by Single Wavelength Excitation, Acc. Chem. Res., 2014, 47, 1378–1385 CrossRef CAS PubMed.
- J. W. Zhao, Y. J. Sun and X. G. Kong, et al., Controlled synthesis, formation mechanism, and great enhancement of red up-conversion luminescence of NaYF4: Yb3+, Er3+ nanocrystals/submicroplates at low doping level, J. Phys. Chem. B, 2008, 112, 15666–15672 CrossRef CAS PubMed.
- W. Wei, Y. Zhang and R. Chen, et al., Cross relaxation induced pure red upconversion in activator-and sensitizer-rich lanthanide nanoparticles, Chem. Mater., 2014, 26, 5183–5186 CrossRef CAS.
- J. Wang, R. R. Deng and M. A. MacDonald, et al., Enhancing multiphoton up-conversion through energy clustering at sublattice level, Nat. Mater., 2013, 13, 157–162 CrossRef PubMed.
- G. Chen, H. Qiu and R. Fan, et al., Lanthanide-doped ultrasmall yttrium fluoride nanoparticles with enhanced multicolor upconversion photoluminescence, J. Mater. Chem., 2012, 22, 20190–20196 RSC.
- C. Chen, L. D. Sun and Z. X. Li, et al., Ionic Liquid-Based Route to Spherical NaYF4 Nanoclusters with the Assistance of Microwave Radiation and Their Multicolor Upconversion Luminescence, Langmuir, 2010, 26, 8797–8803 CrossRef CAS PubMed.
- B. Shao, Z. W. Yang and Y. D. Wang, et al., Coupling of Ag Nanoparticle with Inverse Opal Photonic Crystals as a Novel Strategy for Upconversion Emission Enhancement of NaYF4:Yb3+,Er3+ Nanoparticles, J. Mater. Chem. C, 2017, 5, 8535–8544 RSC.
- Y. D. Wang, Z. W. Yang and Y. J. Ma, et al., Upconversion emission enhancement mechanisms of Nd3+-sensitized NaYF4:Yb3+, Er3+ nanoparticles using tunable plasmonic Au films: plasmonic induced excitation, radiative decay rate and energy-transfer enhancement, ACS Appl. Mater. Interfaces, 2015, 7, 25211–25218 Search PubMed.
- X. Su, X. Q. Sun and S. L. Wu, et al., Manipulating the emission intensity and lifetime of NaYF4:Yb3+, Er3+ simultaneously by embedding it into CdS photonic crystals, Nanoscale, 2017, 9, 7666–7673 RSC.
- J. Zuo, Q. Q. Li and B. Xue, et al., Employing shells to eliminate concentration quenching in photonic upconversion nanostructure, Nanoscale, 2017, 9, 7941 RSC.
- L. Han, M. M. Pan and Y. H. Hu, et al., A Novel Scheme to Obtain Y2O2S: Er3+ Upconversion Luminescent Hollow Nanofibers via Precursor Templating, J. Am. Ceram. Soc., 2015, 9, 2817–2822 CrossRef.
- Q. Zhao, Y. H. Zheng and N. Guo, et al., 3D - hierarchical Lu2O2S: Eu3+ micro/nano - structures: controlled synthesis and luminescence properties, CrystEngComm, 2012, 14, 6659–6664 RSC.
- J. Huang, Y. H. Song and Y. Sheng, et al., Gd2O2S: Eu3+ and Gd2O2S: Eu3+/Gd2O2S hollow microspheres: Solvothermal preparation and luminescence properties, J. Alloys Compd., 2012, 532, 34–40 CrossRef CAS.
- J. Thirumalai, R. Chandramohan and T. A. Vijayan, et al., Preparation of highly ordered growth of single - crystalline Gd2O2S: Eu3+ nanostructures, Mater. Res. Bull., 2011, 46, 285–291 CrossRef CAS.
- M. Behrendt, S. Mahlik and K. Szczodrowski, et al., Spectroscopic properties and location of the Tb3+ and Eu3+ energy levels in Y2O2S under high hydrostatic pressure, Phys. Chem. Chem. Phys., 2016, 32, 22266–22275 RSC.
- P. D. Han, X. P. Jiang and M. Y. Xu, et al., Three primary colors upconversion phosphors and combined white upconversion luminescence in Y2O2S matrix, Mater. Res. Bull., 2015, 70, 658–662 CrossRef CAS.
- P. Huang, X. Q. He and C. E. Cui, et al., The effect of concentration of Dy3+ ions on luminescence properties of Y2O2S: Dy3+, Mg2+, Ti4+ phosphors, Ceram. Int., 2014, 5, 6435–6440 CrossRef.
- M. Pokhrel, G. A. Kumar and C. G. Ma, et al., Electronic and optical properties of Er-doped Y2O2S phosphors, J. Mater. Chem. C, 2015, 43, 11486–11496 RSC.
- Y. Tian, F. Lu and M. M. Xing, et al., Upconversion luminescence properties of Y2O2S: Er3+ @ Y2O2S: Yb3+, Tm3+ core-shell nanoparticles prepared via homogeneous co-precipitation, Opt. Mater., 2017, 64, 58–63 CrossRef CAS.
- H. Wang, M. M. Xing and X. X. Luo, et al., Upconversion emission colour modulation of Y2O2S: Yb, Er under 1.55 μm and 980 nm excitation, J. Alloys Compd., 2014, 587, 344–348 CrossRef CAS.
- I. Hyppänenab, J. Hölsäac and J. Kankareac, et al., Up-conversion luminescence properties of Y2O2S: Yb3+, Er3+ nanophosphors, Opt. Mater., 2009, 31, 1787–1790 CrossRef.
- G. A. Kumara, M. Pokhrela and A. Martinezb, et al., Synthesis and spectroscopy of color tunable Y2O2S: Yb3+, Er3+ phosphors with intense emission, J. Alloy. Compd., 2012, 513, 559–565 CrossRef.
| This journal is © The Royal Society of Chemistry 2018 |

