
 Open Access Article
 This Open Access Article is licensed under a Creative Commons Attribution-Non Commercial 3.0 Unported Licence
Silicalite-1 zeolite acidification by zinc modification and its catalytic properties for isobutane conversion†
Guodong Liu a,
Jiaxu Liua,
Ning Hea,
Cuilan Miaoa,
Jilei Wanga,
Qin Xinb and
Hongchen Guo*a
a,
Jiaxu Liua,
Ning Hea,
Cuilan Miaoa,
Jilei Wanga,
Qin Xinb and
Hongchen Guo*a
aDepartment of Catalytic Chemistry and Engineering, State Key Laboratory of Fine Chemicals, Dalian University of Technology, Dalian 116012, P. R. China. E-mail: hongchenguo@dlut.edu.cn
bState Key Laboratory of Catalysis, Dalian Institute of Chemical Physics, Chinese Academy of Sciences, Dalian 116023, P. R. China
First published on 22nd May 2018
Abstract
A series of Zn-modified Silicalite-1 (S-1) zeolites (Znx/S-1) were prepared by the wetness-impregnation method and applied in the catalytic conversion of isobutane. The structure and location of Zn species in Znx/S-1 were investigated using UV-Vis and N2 physical adsorption. The acidity and origin of the acid sites in Znx/S-1 were studied by NH3-temperature programmed desorption and Fourier-transform infrared analysis. The catalytic performance of Znx/S-1 for isobutane conversion was investigated in a fixed-bed microreactor. In the experiments, the acidity of S-1 zeolite was dramatically increased by modification with Zn, with both Lewis and Brønsted sites identified in Znx/S-1. The relationship between Brønsted acid sites and Zn–OH groups on ZnO clusters of Znx/S-1 was also revealed for the first time. Furthermore, Znx/S-1 catalysts exhibited excellent catalytic performances in both isobutane dehydrogenation and butene isomerization reactions. A high selectivity of total butene products ranging from 84.6 to 97.2 was achieved on the catalysts with different Zn loadings. Moreover, the linear correlation between isobutane conversion and the acid amount (determined by NH3-TPD) confirmed that the weak-to-medium acid sites in Znx/S-1 should play a key role in isobutane conversion.
1 Introduction
Silicalite-1 (S-1) zeolite is an aluminum-free crystalline silicate with the same MFI topological framework as the Al-containing ZSM-5 zeolite. Generally, crystalline S-1 zeolites are chemically inert because their interior structure contains only unreactive siloxane (Si–O–Si) bridges.1 The presence of defective sites in their lattice can facilitate the formation of weak acidic centers (derived from silanol groups), which have been reported as active Beckmann rearrangement catalysts.2–4 Although the amount of weak acid sites and, to some extent, the acidic strength of S-1 zeolite can be modulated by changing the crystallization conditions or through post-synthesis treatment,2,5,6 its catalytic properties remain limited. In contrast, ZSM-5 is a strongly acidic zeolite that can catalyze several reactions, including olefin oligomerization, aromatic alkylation, toluene disproportionation, methanol-to-hydrocarbon conversions (including MTG, MTO, MTP), and light hydrocarbon cracking and aromatization.7–11 This clearly indicates that the acidity of S-1 zeolite needs to be increased to broaden its catalytic applications.The conversion of light alkanes, such as propane and isobutane, into their corresponding value-added alkenes has received much attention. Currently, Pt/Al2O3 and CrxO3/Al2O3 catalysts are employed industrially to produce propylene and isobutene from the non-oxidative dehydrogenation of propane and isobutane, respectively.12 However, these catalysts have drawbacks because Pt is expensive and has limited availability, while CrxO3/Al2O3 is not environmentally friendly owing to its toxicity.13 Therefore, the development of novel catalysts with superior catalytic efficiency for light alkane non-oxidative dehydrogenation is highly desirable. It has been accepted that Zn-containing catalysts were active in the dehydrogenation of alkanes.14–16,19–21 Zn-modified HZSM-5 zeolites (Zn/ZSM-5) have been reported to be effective catalysts for low-temperature activation of light alkanes, with the modified Zn species playing a key role in light alkane dehydrogenation.14–16 However, their commercial use in such processes is impeded by their poor alkene selectivity with respect to the formation of large amounts of cracked dry gas byproducts (C1 and C2 hydrocarbons), resulting from the strong acidic character of HZSM-5 zeolite.17,18 Moreover, zinc titanate catalysts in the form of hydrogels or mixed oxides have also been mentioned in the dehydrogenation of light alkanes.19,20 Zinc titanate is an environmentally friendly material and of low cost. However, the overall activity of the catalyst was found to be limited or the selectivity declined rapidly as a function of reaction time. Recently, isolated Zn2+ species deposited on a silica support were found to be active in propane dehydrogenation.21 The high propylene selectivity was attributed to the absence of Brønsted acid sites on the Zn/SiO2 catalyst. However, the catalyst is not so stable enough that its activity only remained half of the initial activity in 12 h.
The activation of propane over Zn-modified S-1 zeolite (denoted as Zn/S-1) has been studied by employing in situ 13C MAS NMR and IR spectroscopic techniques in 2006.15 It was proposed that propane was activated through dissociative adsorption over zinc oxide species, followed by propene evolution and recombinative desorption of dihydrogen. On the other hand, the acidity of Zn-modified HZSM-5 zeolite (Zn/HZSM-5) was reported to play a key role in the transformation of light alkanes. However, few study related to the effect of acid sites of Zn/S-1 on alkane dehydrogenation was reported, probably because the acidity of S-1 zeolite is negligible compared with that of HZSM-5 zeolite. Moreover, the influence of Zn modification on the acidity of S-1 zeolite and the role of these acid sites in light alkane conversion is yet unclear. Therefore, a series of Zn-modified S-1 catalysts was prepared in this work. The acidity and origin of acidity of these Zn/S-1 catalysts were characterized by NH3-temperature programmed desorption (TPD) and Fourier-transform infrared (FT-IR) spectroscopy analysis. Furthermore, the catalytic properties of these Zn/S-1 catalysts in isobutane conversion were investigated using a fixed-bed microreactor.
2 Experimental
2.1 Catalyst preparation
S-1 zeolite was synthesized according to a reported procedure for the synthesis of TS-1,22 except that no titanium source was used. Typically, tetraethyl orthosilicate (TEOS; Sinopharm Chemical Reagent Co., Ltd), tetrapropylammonium hydroxide (TPAOH; 25 wt% aqueous solution, Sinopharm), and distilled deionized water were mixed to form a clear solution with a SiO2/TPAOH/H2O ratio of 1![[thin space (1/6-em)]](https://www.rsc.org/images/entities/char_2009.gif) :0.3:30. The solution was hydrolyzed at 60 °C in a water bath for 3 h with magnetic stirring to give a homogeneous sol that was then transferred to a Teflon-lined autoclave and crystallized at 170 °C for 24 h. The as-synthesized precipitate was collected by filtration, washed several times with deionized water, and dried at 110 °C overnight. The zeolite products were then calcined at 550 °C for 6 h for further characterization or use.
:0.3:30. The solution was hydrolyzed at 60 °C in a water bath for 3 h with magnetic stirring to give a homogeneous sol that was then transferred to a Teflon-lined autoclave and crystallized at 170 °C for 24 h. The as-synthesized precipitate was collected by filtration, washed several times with deionized water, and dried at 110 °C overnight. The zeolite products were then calcined at 550 °C for 6 h for further characterization or use.
Zn-modified zeolite catalysts were prepared using a wetness-impregnation method. The calcined S-1 zeolite was impregnated with an aqueous solution of Zn(NO3)2·6H2O (Sinopharm Chemical Reagent Co., Ltd) in a water bath at 80 °C for 3 h. The impregnated zeolite was then dried at 110 °C for 12 h and calcined at 550 °C for 6 h to obtain the Zn/S-1 samples. The desired Zn loadings were achieved by adjusting aqueous solution of Zn(NO3)2·6H2O with the appropriate concentration. The modified S-1 zeolites with different Zn loadings were denoted as Znx/S-1, where x is the Zn loading amount in wt%. For comparative catalytic tests in isobutane conversion, a 6.0 wt% Zn-modified HZSM-5 zeolite (crystal size, 100–200 nm; SiO2/Al2O3 molar ratio, 26:1) was also prepared using the same impregnation method (denoted as Zn6.0/ZSM-5).
2.2 Catalyst characterization
Powder X-ray diffraction (XRD) patterns were collected on a Rigaku D/max-2004 diffractometer with a Cu Kα radiation source (40 kV, 100 mA). Measurements were conducted in the 2θ range of 5–80° with a scanning speed of 2° min−1. X-Ray Fluorescence spectrometry (XRF) was conducted on a Bruker SRS 3400 instrument. Field emission scanning electron microscopy (FE-SEM) images of crystal morphologies were obtained using a Hitachi S-4800 microscope. The distribution of Zn species on the modified catalysts was examined by UV-Vis spectrophotometry, conducted on a JASCO V-550 spectrometer with BaSO4 as the reference. High resolution transmission electron microscopy (HRTEM) measurements were taken on a JEM-2100F electron microscope with an acceleration voltage of 200 kV.N2 physical adsorption–desorption isotherms were measured on a Micromeritics ASAP 2020 instrument at −196 °C to determine the textural properties. Prior to measurement, the samples (sieve fraction, 380–830 μm) were degassed under vacuum at 350 °C for 6 h. The specific surface area was calculated by the Brunauer–Emmett–Teller (BET) method using the adsorption branch in the P/P0 range 0.10–0.15. The pore volumes were estimated at the P/P0 point of 0.99. The microporosity and mesoporosity of the samples was discriminated using the t-plot method.
NH3-TPD was performed on a Quantachrome ChemBet 3000 chemisorb instrument to investigate the total acidity of the catalysts. Sample pellets (150 mg; sieve fraction, 380–830 μm) were pretreated under helium (He) at 600 °C for 1 h. After cooling to 100 °C, a mixed gas of 5% NH3 in He was passed through the catalyst bed to allow ammonia adsorption for 30 min. The cell was then purged with He flow (50 mL min−1) for 30 min to remove all NH3 not chemically adsorbed. The NH3-TPD profiles were recorded by heating the cell to 600 °C at a ramping rate of 16 °C min−1.
FT-IR of adsorbed NH3 (FT-IR-NH3) was used to determine the Lewis and Brønsted acidities of the catalysts. FT-IR-NH3 spectra were collected on a Nicolet 6700 FT-IR spectrometer (4 cm−1 optical resolution with one level of zero-filling for the Fourier transform). First, about 15 mg of sample was pressed into a self-supporting wafer (diameter, 13 mm) and then treated in a cuvette in situ under vacuum (10−3 Pa) at 400 °C for 4 h. NH3 adsorption was conducted with admittance of an ammonia flow of 30 mL min−1 into the cuvette for 30 min at ambient temperature. The wafer was then subjected to vacuum treatment at 150, 300, and 450 °C for 30 min each. Finally, the measured spectra were collected.
To determine the catalyst acidity of the surface hydroxyl groups, FT-IR spectra of surface hydroxyl groups with ammonia absorption (OH-FT-IR-NH3) were recorded using a Nicolet iS10 FT-IR spectrometer. The samples were pressed into self-supporting thin wafers (approximately 15 mg) and decontaminated at 400 °C under vacuum (10−3 Pa) for 4 h in a quartz IR cell equipped with CaF2 windows. An ammonia gas stream (30 mL min−1) was passed through the sample cell at 150 °C for 30 min to allow ammonia adsorption. Evacuation treatment (10−3 Pa) was conducted for 30 min at the same temperature. After cooling to room temperature, OH-FT-IR-NH3 spectra were recorded by subtracting the blank background spectrum (recorded using an empty IR cell without sample). Spectra were recorded in the range 4000–400 cm−1 with a resolution of 4 cm−1.
2.3 Catalytic tests
Isobutane conversion tests were performed in a fixed-bed microreactor (i.d., 6 mm) under atmospheric pressure. The catalyst loading for each run was about 200 mg. Prior to activity tests, catalysts (dp = 20–40 mesh) were activated in situ at 550 °C for 1 h under nitrogen flow, and then prereduced under 5% H2 in N2 gas flow (50 mL min−1, standard temperature and pressure) at 500 °C for 30 min. The isobutane feedstock was diluted with nitrogen (employed as a calibrating gas) to give a 50:50 (v/v) mixture. The flow rates of isobutane and nitrogen were controlled separately using mass flow meters. For catalytic activity tests, the mixing gas was fed at a gas hourly space velocity (GHSV) of about 1200 h−1, with the reaction conducted at 550 °C and atmospheric pressure. Effluent hydrocarbon products were analyzed using on-line gas chromatography (GC; Shimadzu GC-14B, OV-1 capillary column 50 m × 0.20 mm, flame ionization detector).
The isobutane conversion (Cisobutane) and product selectivity (Si) were calculated using the following equations:
| Cisobutane = (∑Ai − Aisobutane)/∑Ai × 100% | (1) |
| Si = Ai/(∑Ai − Aisobutane) × 100% | (2) |
3 Results and discussion
3.1 Catalyst characterization
SEM, XRD, and N2 physical adsorption–desorption isotherms were measured to assess the effect of the Zn dopant on the structures of the Znx/S-1 catalysts. The SEM images (see Fig. S1†) showed that the mean size of parent S-1 zeolite was around 100 nm. The introduction of Zn species by impregnation has little influence on the crystal size and the morphology of parent S-1 zeolite. Structural changes in Znx/S-1 catalysts were also analyzed using XRD patterns. As shown in Fig. 1, five characteristic diffraction peaks of MFI structure were found at 2θ = 7.9, 8.8, 23.1, 23.8 and 24.3 in all catalysts. No diffraction signal for Zn species was observed at Zn content below 8.0 wt%, indicating that Zn species were highly dispersed. Nevertheless, characteristic peaks of the ZnO phase with a wurtzite structure23 (denoted with asterisks in Fig. 1A and B) were presented in Zn12.0/S-1. When the amount of Zn added was too high, Zn species seemed not to be uniformly dispersed in the zeolite channels, but formed large wurtzite-structured ZnO particles on the zeolite surface. The average particle size of ZnO particles was estimated to be 4.8 nm by using the Scherrer's equation. Fig. S2† shows the HRTEM images of Zn6.0/S-1 and Zn12.0/S-1 catalysts. There are a number of ZnO particles reside on the external surface of Zn12.0/S-1 catalyst, while no clear pattern of ZnO particles has been observed on the outside surface of Zn6.0/S-1. Moreover, in comparison with parent S-1 zeolite, the relative crystallinity of Znx/S-1 catalysts gradually decreased (see Table S2†), which was probably attributed to the high X-ray absorption coefficient of impregnated metal species.24,25 The textural properties of Znx/S-1 catalysts were determined from N2 physical adsorption–desorption, as summarized in Table 1. At low Zn loadings (1.0 wt% and 3.0 wt%), the specific surface area of Znx/S-1 decreased slightly with increasing Zn loading. This indicated that subnanometric ZnO clusters inside the zeolitic pores or channels only had a small effect on the textural properties of the S-1 zeolite. However, at high Zn loadings (above 6.0 wt%), the specific surface area of Znx/S-1 declined rapidly with increasing Zn loading, mainly due to decreases in external surface area (from 150 m2 g−1 to 72 m2 g−1) and mesoporosity (from 0.16 m3 g−1 to 0.10 m3 g−1). Furthermore, the microstructure characteristics were slightly disrupted. These data showed that large ZnO particles were mainly deposited on the external surface and blocked mesopore openings in S-1 zeolite.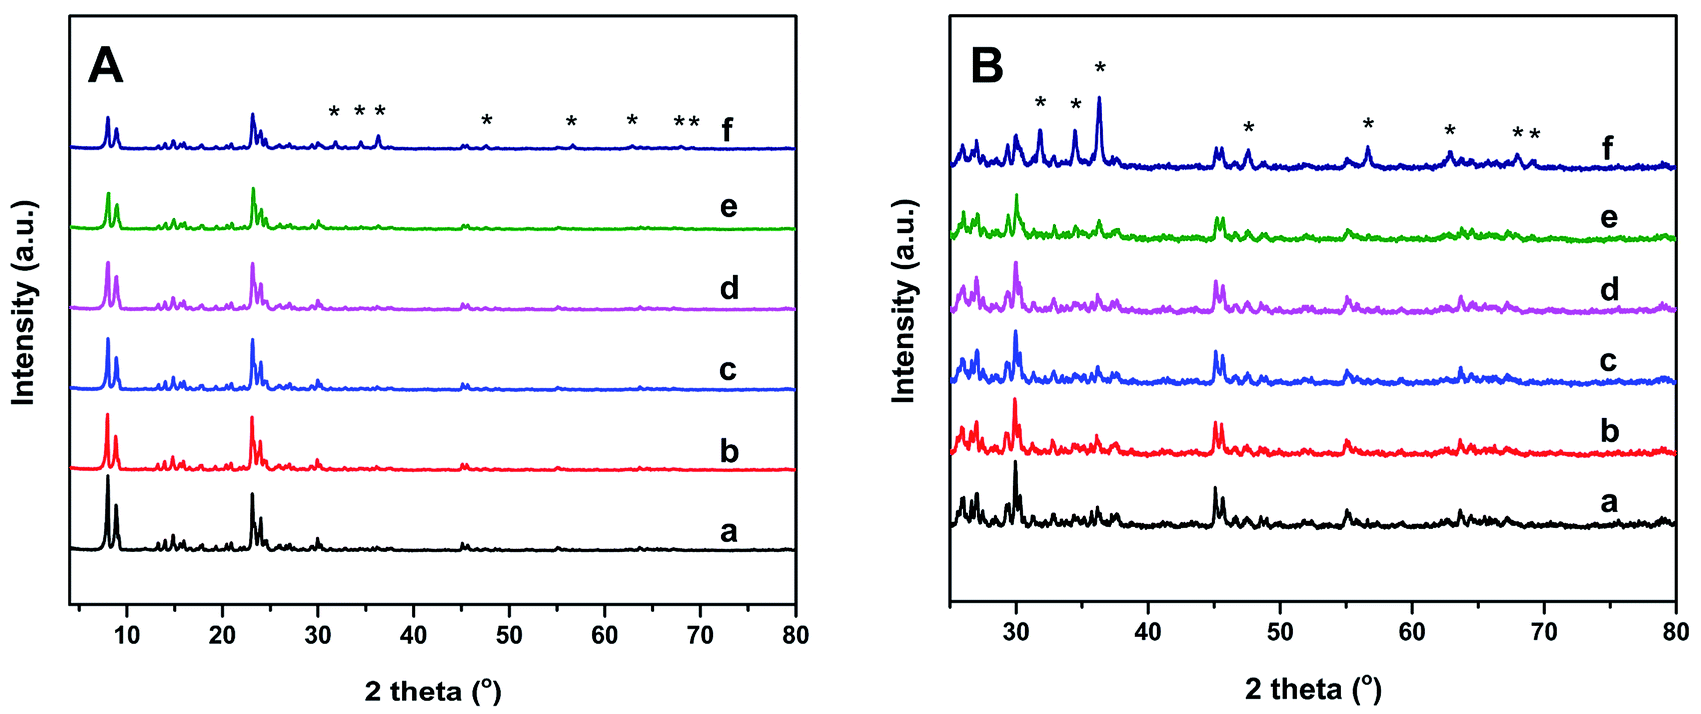 | ||
| Fig. 1 XRD patterns (A) and the magnified patterns (B) of S-1 (a), Zn1.0/S-1 (b), Zn3.0/S-1 (c), Zn6.0/S-1 (d), Zn8.0/S-1 (e) and Zn12.0/S-1 (f). (The asterisk labels show the diffraction peaks of ZnO crystal with wurtzite structure). | ||
| Zn loading (wt%) | SBET (m2 g−1) | SMicro (m2 g−1) | Sextern (m2 g−1) | Vpores (cm3 g−1) | Vmicro (cm3 g−1) | Vmeso (cm3 g−1) |
|---|---|---|---|---|---|---|
| 0.0 | 390 | 239 | 150 | 0.27 | 0.11 | 0.16 |
| 1.0 | 383 | 239 | 143 | 0.27 | 0.11 | 0.16 |
| 3.0 | 370 | 228 | 141 | 0.26 | 0.10 | 0.15 |
| 6.0 | 325 | 245 | 80 | 0.20 | 0.10 | 0.10 |
| 8.0 | 290 | 217 | 72 | 0.20 | 0.10 | 0.10 |
| 12.0 | 269 | 195 | 73 | 0.21 | 0.09 | 0.12 |
UV-Vis spectra of Znx/S-1 catalyst are shown in Fig. 2. Generally, the modification of S-1 with Zn leads to the appearance of two new bands at about 265 and 365 nm, corresponding to subnanometric ZnO clusters inside zeolitic pores and large ZnO crystals on the external zeolite surface, respectively.15,23 For Zn1.0/S-1 and Zn3.0/S-1 samples, the band at 265 nm was significant, while the band at 365 nm was almost nonexistent, suggesting that the two catalysts mainly comprised subnanometric ZnO clusters. In contrast, both bands were present in samples with Zn loadings above 6.0 wt%. Increasing Zn loading in these catalysts enhanced both bands, with the intensity of the band at 365 nm increasing much faster. These observations showed that the Znx/S-1 samples with higher Zn loadings (x = 6.0–12.0) contained not only ZnO clusters inside S-1 zeolitic pores, but also large ZnO crystals located on the external surface. The increased Zn loading mainly facilitated the formation of large ZnO crystals.
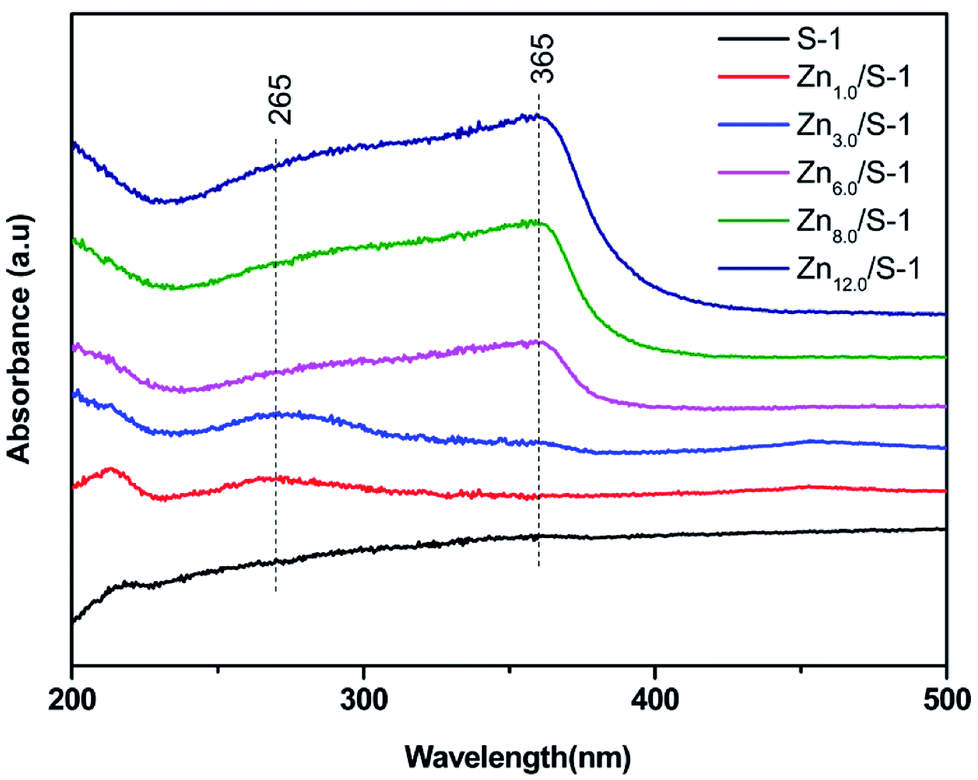 | ||
| Fig. 2 UV-Vis spectra of Znx/S-1 (x from 0.0 to 12.0). | ||
3.2 Acidity enhancement by Zn modification
The acid amount and strength of S-1 and Zn-modified sample Zn6.0/S-1 were investigated using NH3-TPD. For comparison, the acidities of HZSM-5 (SiO2/Al2O3 molar ratio, 26:1) and Zn6.0/HZSM-5 were also tested. As shown in Fig. 3A, the whole NH3 desorption profile for the parent S-1 zeolite was approximately a straight line. Almost no NH3 molecules were adsorbed on S-1, demonstrating its weak acidic character compared with that of HZSM-5. Notably, the NH3 desorption peak of the Zn6.0/S-1 sample was quite strong, although the acid amount remained much lower than that of HZSM-5 and Zn6.0/HZSM-5. This clearly showed that impregnation with Zn significantly enhanced the acidity of the S-1 zeolite. We also compared the NH3-TPD profiles of the Znx/S-1 catalysts, which exhibited two distinct desorption peaks at 267 and 375 °C (see Fig. 3B), corresponding to weak and medium acidic sites, respectively. Furthermore, it was also feasible to gradually increase the amount of acid sites in the S-1 zeolite by increasing the loading of Zn until the maximum value was reached, as shown in Fig. 4. Detailed information on the calculated statistical results of acid amount is shown in Table S3.† For the parent S-1 used herein, the maximum Zn loading was around 6.0–8.0 wt%. When the Zn loading was low (below 3.0%), the increase in Zn loading dramatically increased the acidity of the S-1 zeolite. However, when the Zn loading was high (in the range 3.0–8.0 wt%), the overall acid amount in the modified S-1 zeolite reached its maximum value, with the increasing trend with Zn loading becoming marginal.
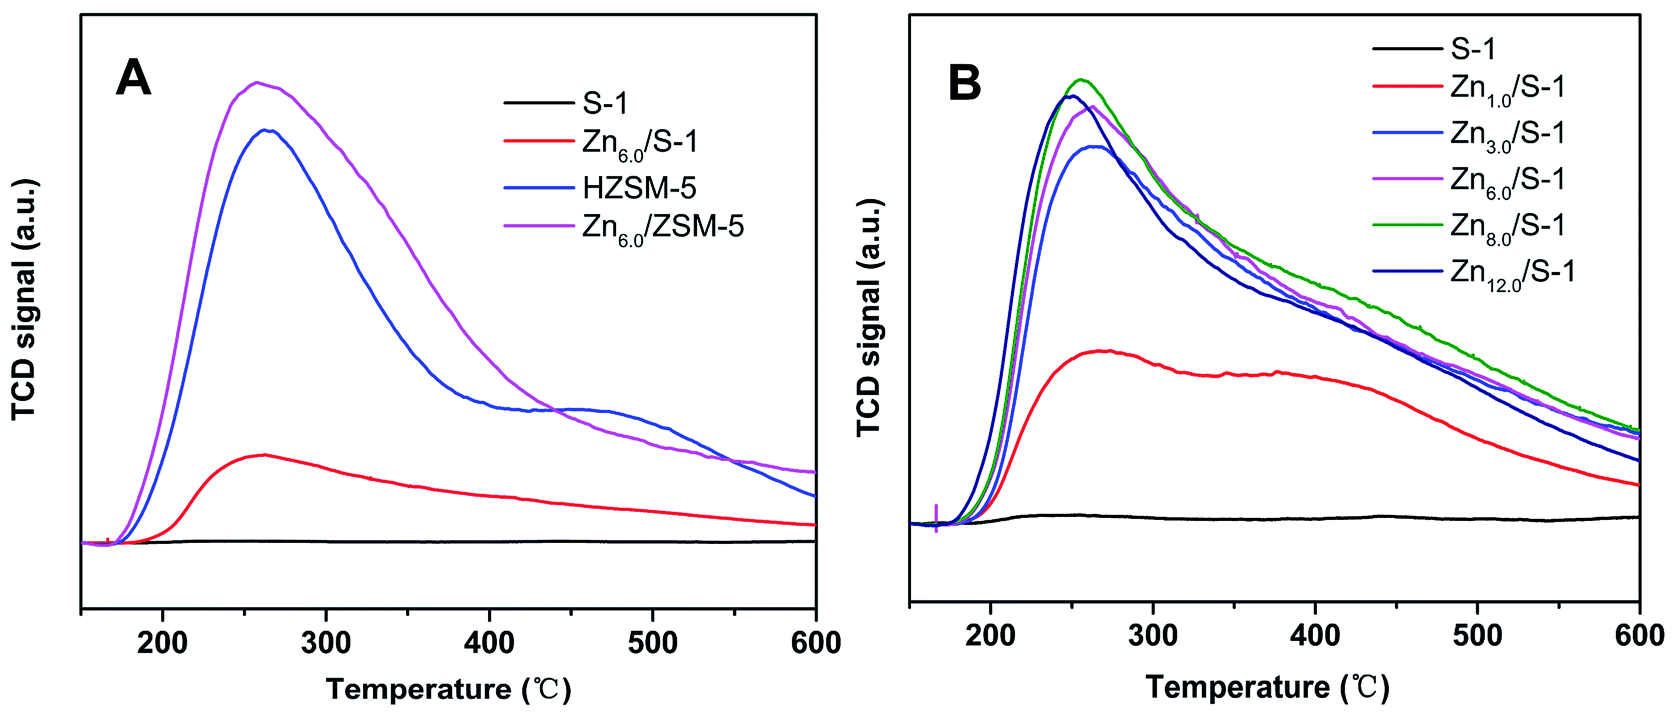 | ||
| Fig. 3 NH3-TPD profiles of (A) S-1, Zn6.0/S-1, HZSM-5 and Zn6.0/HZSM-5, and (B) the series Znx/S-1 (x from 0.0 to 12.0) samples. | ||
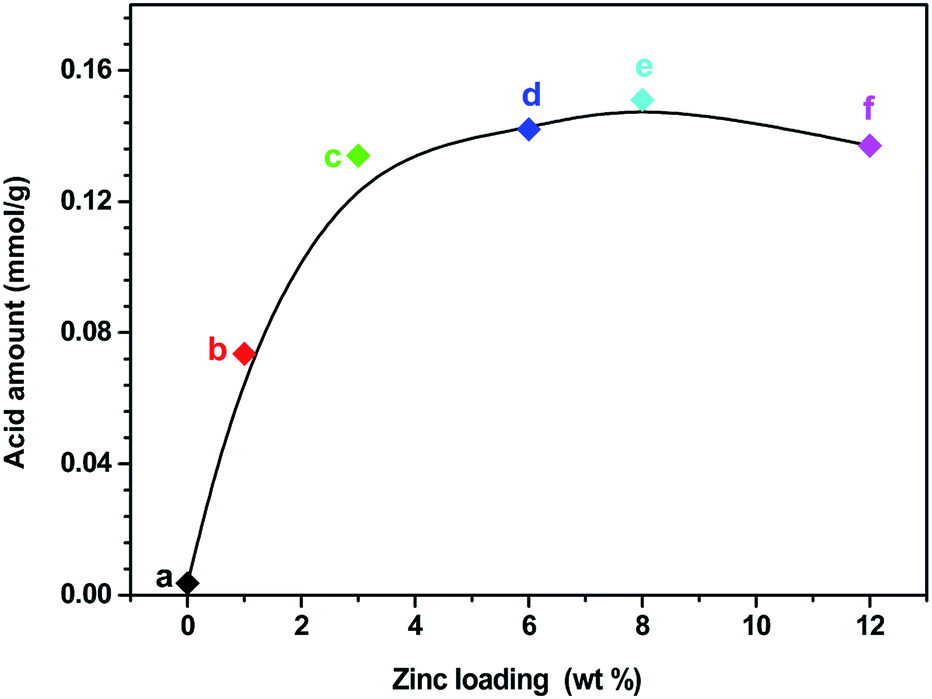 | ||
| Fig. 4 The relevance of Zn loading and acid amount of S-1 (a), Zn1.0/S-1 (b), Zn3.0/S-1 (c), Zn6.0/S-1 (d), Zn8.0/S-1 (e) and Zn12.0/S-1 (f), respectively. | ||
The acidity of Znx/S-1 zeolites was further studied using ammonia-adsorbed FT-IR spectra. As shown in Fig. 5A, the strong absorption peak at 1620 cm−1 was attributed to asymmetric deformation of ammonia coordinated to Lewis acid sites, which usually appears in the bending vibration region of 1700–1300 cm−1 and indicates that Zn modification resulted in the formation of an appreciable amount of Lewis acid sites in Znx/S-1.26–29 The variation trend in the intensity of this peak was in agreement with the change in the NH3-TPD results. However, the existence of Brønsted acid sites in Znx/S-1 required further confirmation because the IR bands corresponding to ammonium ion deformation vibrations were obscure. In contrast, as shown in Fig. 5A and the magnified range of 3500–3000 cm−1 in Fig. 5B, in addition to the apparent bands in the range 3350–3200 cm−1, which were attributed to ammonia coordination on Lewis acid sites, two weak yet clear absorption peaks at 3220 and 3190 cm−1 emerged in the N–H stretching region.26,28 It was clear that Zn modification not only produced a number of Lewis acid sites, but also raised some Brønsted acid sites in Znx/S-1 catalysts, as disclosed by the two N–H stretching signals. Furthermore, we further detected variations in the spectra with heating and evacuation procedures, as shown in Fig. 6. The bands at 3290, 3220, and 3190 cm−1 almost disappeared after evacuation at 450 °C for 30 min, suggesting the acid sites of Znx/S-1 were mostly weak to medium. This was in good agreement with the NH3-TPD results.
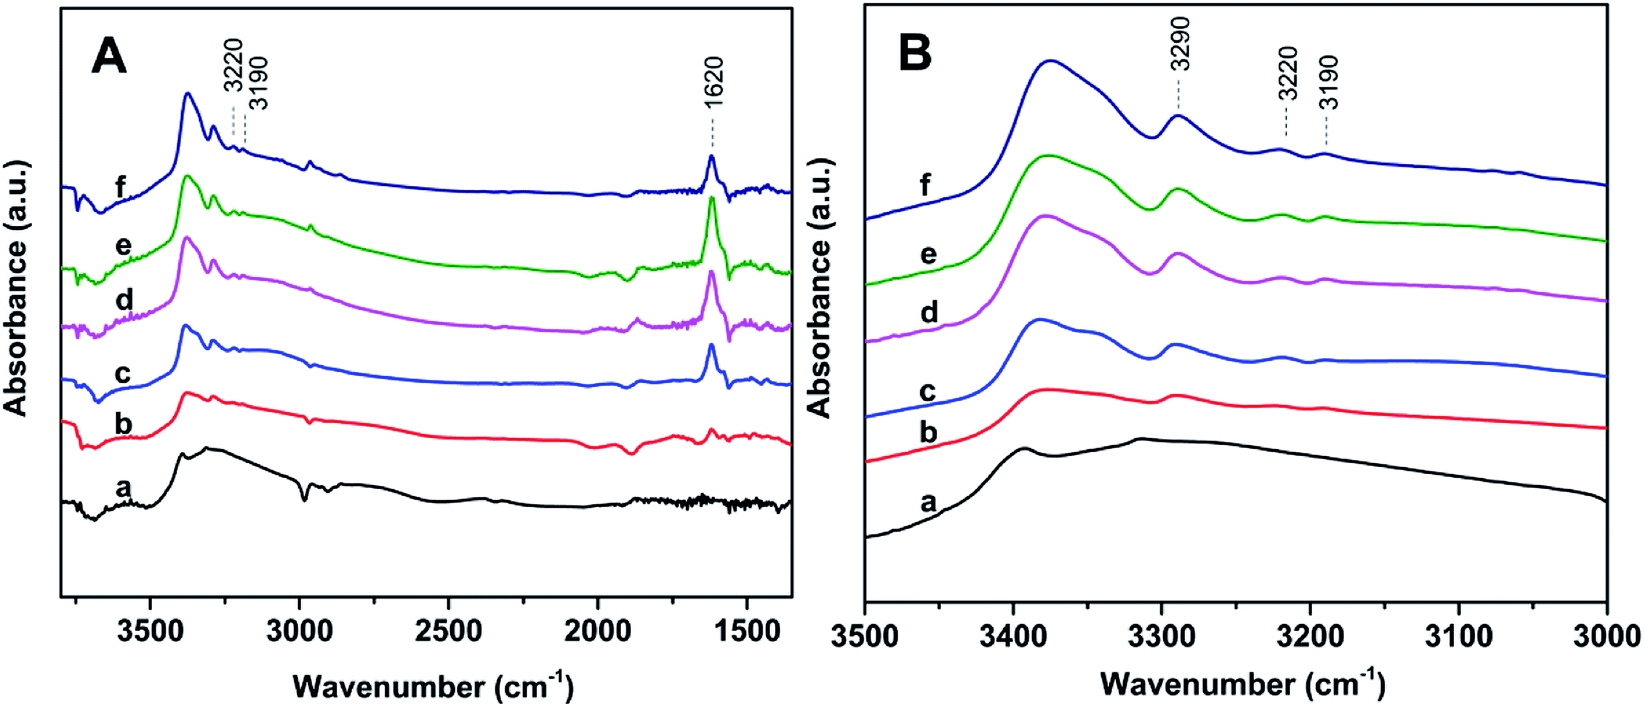 | ||
| Fig. 5 Ammonia-adsorbed FT-IR spectra (A) and the magnified spectra in the NH-stretching region (B) of the series Zn6.0/S-1 Znx/S-1 samples: (a) S-1, (b) Zn1.0/S-1, (c) Zn3.0/S-1, (d) Zn6.0/S-1, (e) Zn8.0/S-1 and (f) Zn12.0/S-1. | ||
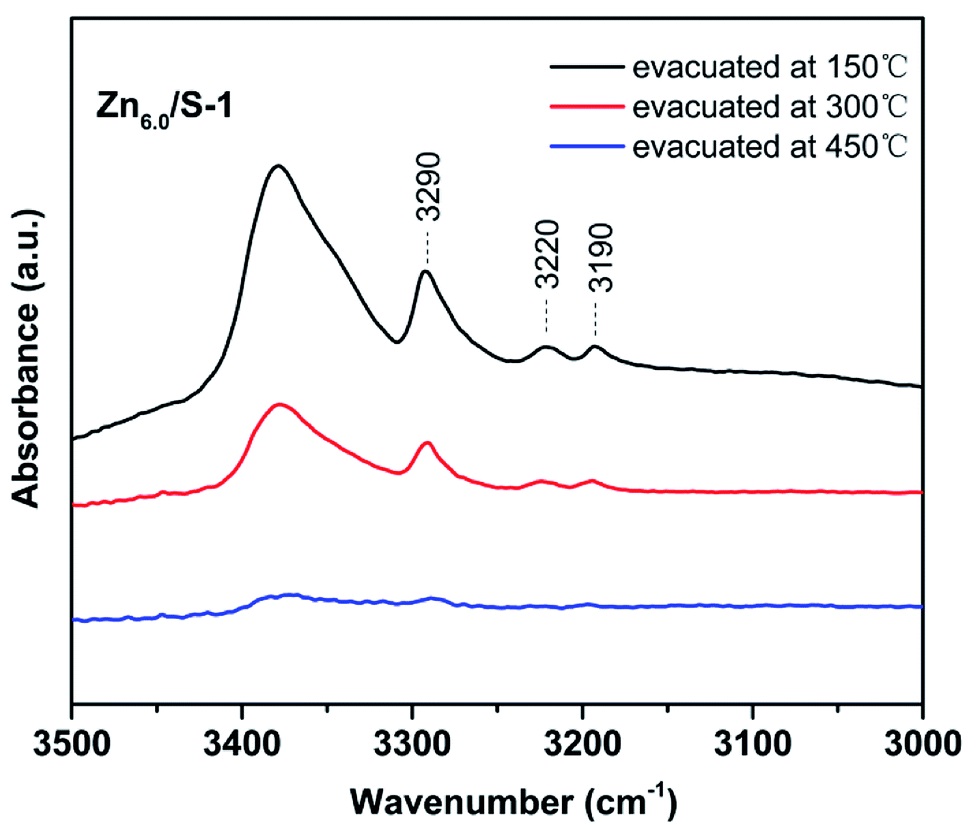 | ||
| Fig. 6 Ammonia-adsorbed FT-IR spectra of Zn6.0/S-1 in the NH-stretching region after evacuation at 150, 300 and 450 °C for 30 min. | ||
3.3 Origin of Znx/S-1 acidity
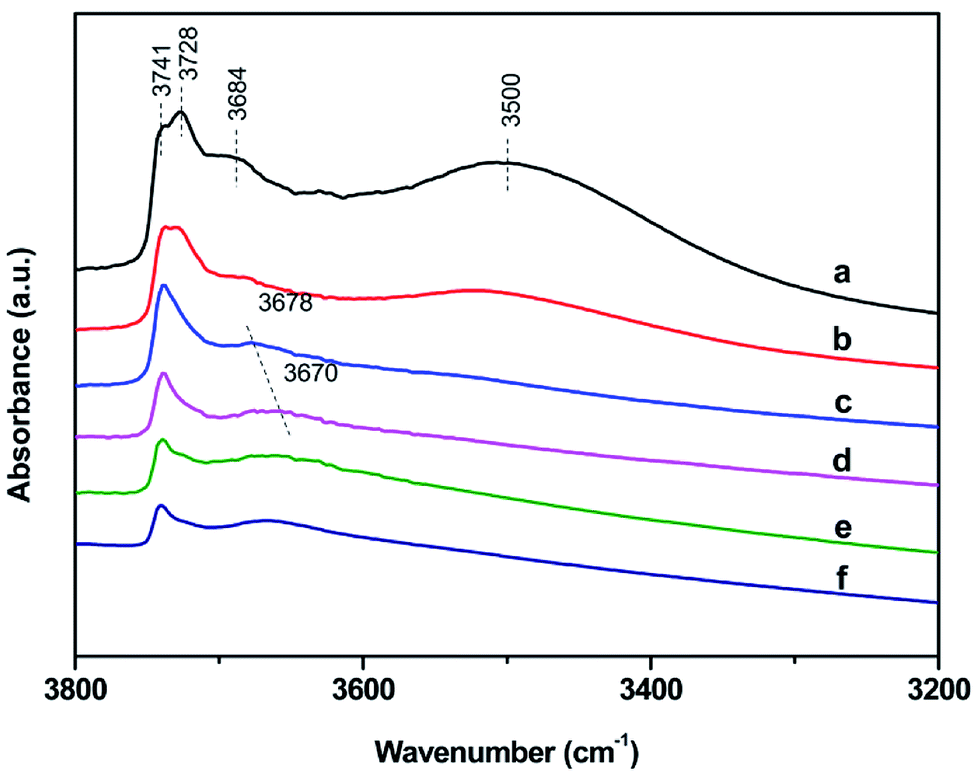 | ||
| Fig. 7 Infrared hydroxyl stretching region of S-1 (a), Zn1.0/S-1 (b), Zn3.0/S-1 (c), Zn6.0/S-1 (d), Zn8.0/S-1 (e) and Zn12.0/S-1 (f). Catalysts have been dehydrated at 400 °C for 4 h. | ||
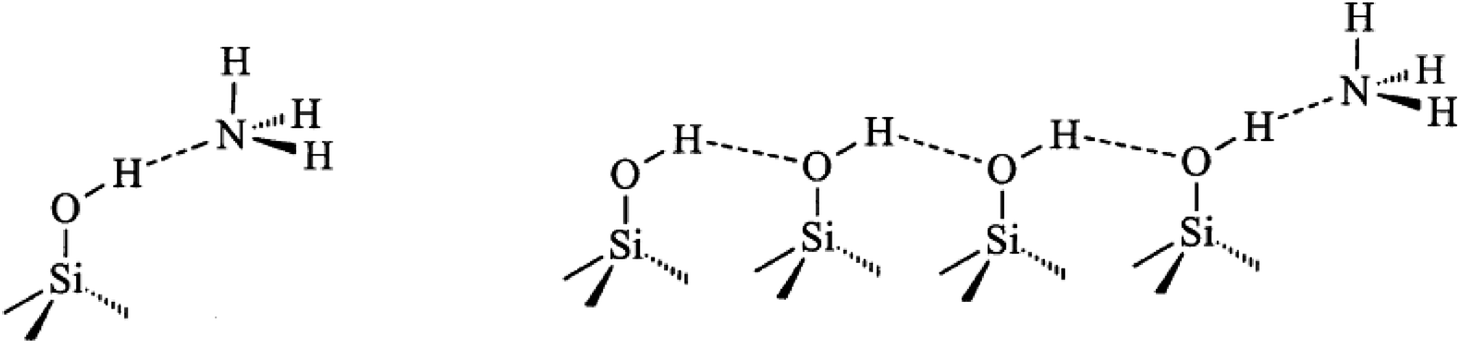
FT-IR spectra of surface hydroxyl groups with ammonia absorption were also measured to probe the Brønsted acid sites of Znx/S-1. To avoid disturbance from hydrogen-bonded species formed by the interaction of NH3 and intrinsic hydroxyl groups in S-1 zeolite, as shown in Scheme 1,1 the ammonia-adsorbed catalysts were evacuated at 150 °C for 30 min. After Zn modification, both Lewis and Brønsted acid sites were found in Znx/S-1 (x = 1.0–6.0), as shown in the (NH) stretching region in Fig. 8B. This result was consistent with the ammonia-adsorbed FT-IR spectra (Fig. 5). In contrast, it was interpreted from Fig. 8A that the residual signals (ν= 3741, 3728, and 3500 cm−1) of silicon hydroxyl groups in Znx/S-1 would hardly be disturbed after NH3 adsorption, indicating that they had no effect on the acidity of Znx/S-1. Notably, the bands at 3678 and 3670 cm−1, corresponding to Zn–OH groups on ZnO clusters, were significantly consumed after NH3 adsorption. The consumption of these silanol group bands at 3678 and 3670 cm−1 clearly demonstrated that the Zn–OH groups were associated with Brønsted acid sites of Znx/S-1. To our knowledge, this relationship between Brønsted acid sites and Zn–OH groups on ZnO clusters of Zn/S-1 is reported here for the first time.
 | ||
| Scheme 1 | ||
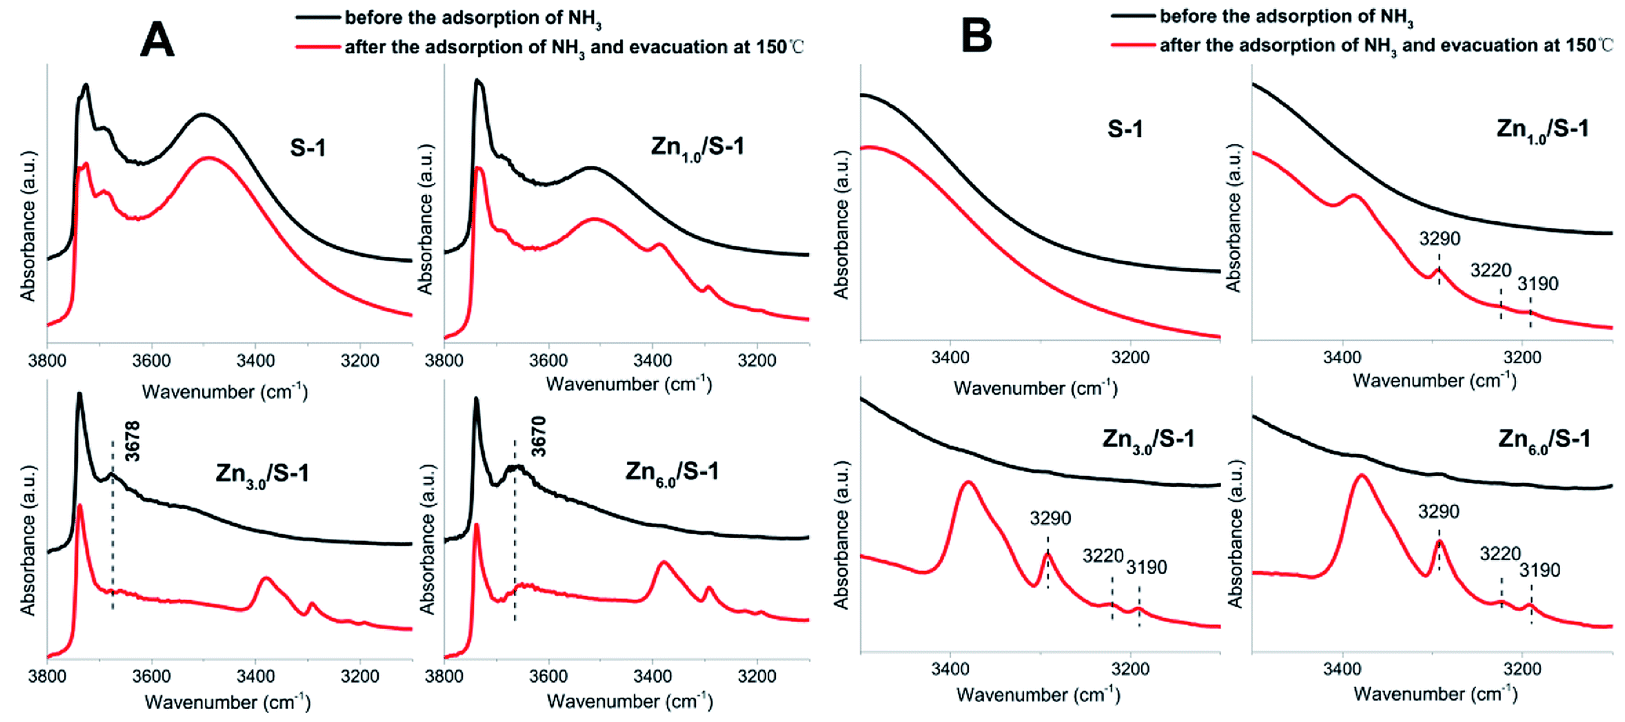 | ||
| Fig. 8 (A) IR spectra in the ν(OH) and ν(NH) stretching region of Znx/S-1 (x from 0.0 to 6.0) before and after the adsorption of NH3, respectively; (B) corresponding magnified IR spectra in the ν(NH) stretching region. | ||
3.4 Catalytic performance
The catalytic conversion of isobutane was tested in a microscale fixed-bed reactor and the results are shown in Table 2. As an effective strategy, Zn modification significantly enhanced the catalytic activity of S-1 zeolite. At 550 °C and atmospheric pressure, the parent S-1 zeolite was completely inactive for isobutane transformation. However, under the same reaction conditions, Znx/S-1 catalysts exhibited promoted isobutane conversion rates. In particular, the Zn1.0/S-1 and Zn3.0/S-1 catalysts led to 27.5% and 60.2% isobutane conversion, respectively. As the Zn content was increased (from 3.0 to 8.0 wt%), the isobutane conversion continued increasing, reaching a maximum isobutane conversion of 66.7%. However, a slight downward tendency in isobutane conversion was observed when the Zn loading reached 12.0 wt%. Despite this, the Zn12.0/S-1 catalyst still afforded a good isobutane conversion of 65.5%. Moreover, according to the literature,32 the iso-butane activity of Znx/S-1 (27.5–66.7%) obtained under our experimental conditions is close to that of the commercial Cr2O3/Al2O3 catalyst (48–65%).| Catalyst | Conv. (%) | Selectivity (%) | |||||
|---|---|---|---|---|---|---|---|
| Cracking | Dehydrogenation | Aromatization | |||||
| C1 + C2 | C3 | iC![[double bond, length as m-dash]](https://www.rsc.org/images/entities/char_e001.gif) 4 4 |
nC4 + cisC4 + transC4 |
Total C4 |
Aromatic products | ||
| a Catalyst loading 200 mg, reactions temperature 550 °C, GHSV 1200 h−1, iso-butane feedstock compositions: iso-butane:N2 = 50:50 (v/v), the results were obtained after 1 h of testing. |
|||||||
| S-1 | — | — | — | — | — | — | — |
| Zn1.0/S-1 | 27.5 | 0.6 | 1.6 | 83.8 | 13.4 | 97.2 | 1.0 |
| Zn3.0/S-1 | 60.2 | 1.4 | 2.7 | 68.2 | 22.8 | 91.0 | 5.0 |
| Zn6.0/S-1 | 61.3 | 2.1 | 4.0 | 64.8 | 22.9 | 87.7 | 6.2 |
| Zn8.0/S-1 | 66.7 | 2.7 | 5.1 | 59.8 | 24.8 | 84.6 | 7.6 |
| Zn12.0/S-1 | 65.5 | 2.7 | 5.1 | 61.7 | 23.6 | 85.4 | 6.8 |
| Zn6.0/HZSM-5 | 99.8 | 27.3 | 13.7 | 0.4 | 1.3 | 1.6 | 57.3 |
Among the products of isobutane transformation over Znx/S-1 catalysts, isobutene was the primary component (about 60%), indicating that Zn modification imparted the catalysts impressive dehydrogenation functions. Furthermore, the presence of substantial amounts of 1-butene and cis/trans-2-butene among the products indicated that the Brønsted acid sites provided by the Zn–OH groups in S-1 zeolite also played an important role in isobutene isomerization. A high selectivity of isobutene and its isomers ranging from 84.6 to 97.2 was achieved on the catalyst with different Zn loading. Moreover, a small amounts of aromatic products (less than 8%), due to aromatization over the Zn species, and cracked lower hydrocarbon products (C1–C3, much less than 8%) were formed because the Brønsted acid strength of Znx/S-1 was still relatively weak. In comparison, when isobutane transformation was conducted over the Zn6.0/HZSM-5 catalyst, the isobutane conversion rated was nearly 100%, with aromatics obtained as the major product (more than 50%). This reaction also produced a large amount of undesired cracking components (over 40%), which comprised dry gas (C1 + C2) and propane in a 2:1 ratio. In contrast, the sum of dry gas and propane byproducts was efficiently suppressed over appropriately modified Znx/S-1 catalysts.
The stability of Zn/S-1 catalyst in the conversion of iso-butane was further investigated. As shown in Fig. 9A, slight deactivation was observed over Zn6.0/S-1 catalyst during the lifespan of 12 h. However, for Zn6.0/HZSM-5 catalyst, the conversion decreased from 99.1% to 72.8% after 12 h. On the other hand, the selectivity of total butene was well-preserved over Zn6.0/S-1 catalyst during the 12 h examination (Fig. 9B). These results indicated that Znx/S-1 catalysts obtain extraordinary stability in the iso-butane dehydrogenation system. Furthermore, as previously reported,19–21 zinc titanate and Zn/SiO2 catalysts also had been considered as the candidates for light alkanes dehydrogenation. However, the zinc titanate catalyst deactivated rapidly when both the selectivity and conversion were kept at a higher level.19,20 Zn/SiO2 catalyst exhibited high propylene selectivity in the dehydrogenation of propane.21 However, the stability is also a big challenge for the industrial applications of Zn/SiO2 catalyst since the activity can only maintain nearly 50% of the initial value during 12 h test. Therefore, Znx/S-1 catalysts exhibited both higher activity and excellent stability in comparison with zinc titanate and Zn/SiO2 catalysts in the dehydrogenation of alkanes.
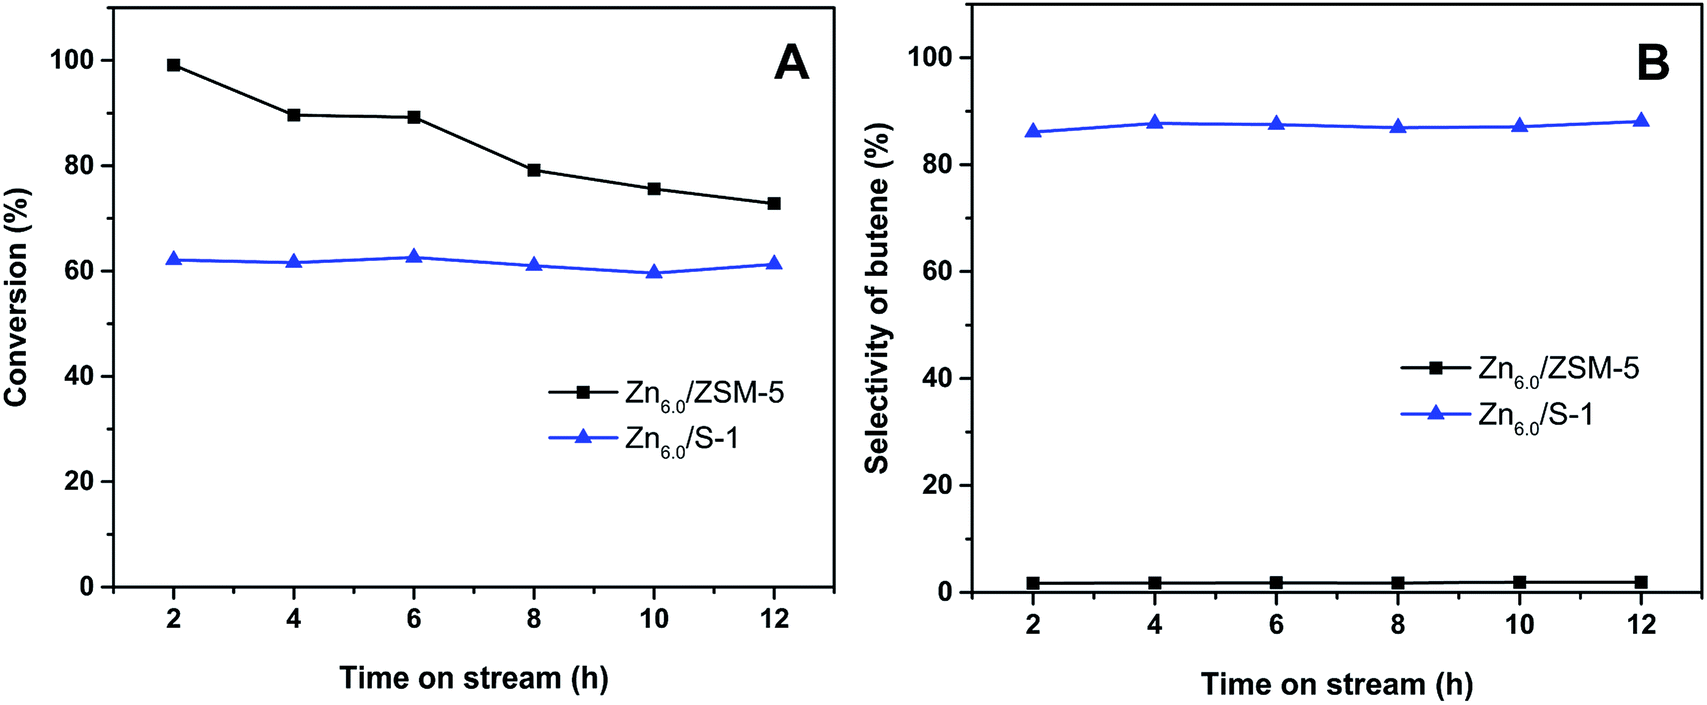 | ||
| Fig. 9 (A) Conversion of iso-butane and (B) selectivity of butene as a function of reaction time over Zn6.0/ZSM-5 and Zn6.0/S-1 catalysts. | ||
By correlating the isobutane conversion rates with the acid amount of Znx/S-1 (determined by the NH3-TPD method), we obtained a linear dependence of isobutane conversion on the total acid amount of Znx/S-1 (Fig. 10). This meant that the acid sites of Znx/S-1 played a critical role in isobutane conversion. The yield of undesired dry gases was significantly suppressed, perhaps due to the absence of strong acid sites. Furthermore, the true role of different categories of acid sites of Znx/S-1 in isobutane conversion still needs to be identified, with investigations currently underway in our laboratory.
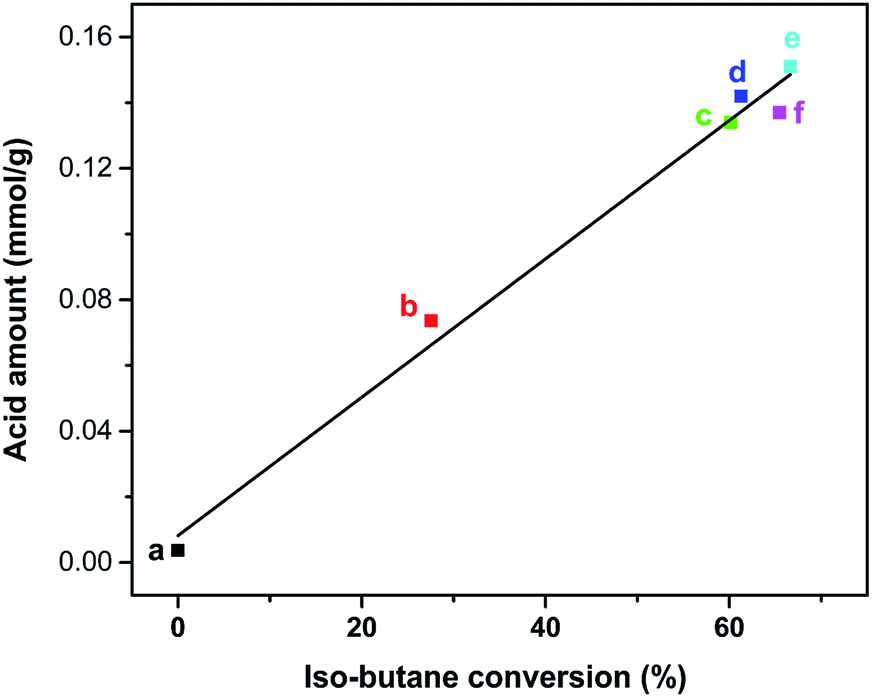 | ||
| Fig. 10 The relevance between iso-butane conversion and the acid amount of S-1 (a), Zn1.0/S-1 (b), Zn3.0/S-1 (c), Zn6.0/S-1 (d), Zn8.0/S-1 (e) and Zn12.0/S-1 (f), respectively. (The acid amounts of catalysts were determined by NH3-TPD). | ||
4 Conclusions
In summary, the inert S-1 zeolite was significantly acidified by modification with Zn. Both Lewis acid sites and a small amount of Brønsted acid sites were identified in Znx/S-1 catalysts. Using UV-Vis and FT-IR analysis, we found that the Lewis and Brønsted acid sites of Znx/S-1 were associated with small ZnO clusters and external Zn–OH groups on ZnO clusters, respectively. Furthermore, the linear relationship between isobutane conversion and total acid amount suggested that the acid sites of Znx/S-1 played a crucial role in isobutene conversion. Znx/S-1 catalysts exhibited excellent isobutane dehydrogenation and butene isomerization activities, and the yield of undesired dry gas (methane and ethane) was significantly suppressed because strong acid sites were absent. A high selectivity of total butene products ranging from 84.6 to 97.2 was achieved on the catalysts with different Zn loading. Therefore, Zn-modified S-1 zeolites can be applied to the highly efficient transformation of light alkanes.Conflicts of interest
The authors have no conflicts of interest to declare.Acknowledgements
This work was supported by National Natural Science Foundation of China (No. 21603023).Notes and references
- V. Bolis, C. Busco, S. Bordiga, P. Ugliengo, C. Lamberti and A. Zecchina, Appl. Surf. Sci., 2002, 196, 56–70 CrossRef.
- G. P. Heitmann, G. Dahlhoff and W. F. Hölderich, J. Catal., 1999, 186, 12–19 CrossRef.
- H. Ichihashi and H. Sato, Appl. Catal., A, 2001, 221, 359–366 CrossRef.
- H. Ichihashi, M. Ishida, A. Shiga, M. Kitamura, T. Suzuki, K. Suenobu and K. Sugita, Catal. Surv. Asia, 2003, 7(4), 261–270 CrossRef.
- B. Bonelli, L. Forni, A. Aloise, J. B. Nagy, G. Fornasari, E. Garrone, A. Gedeon, G. Giordano and F. Trifirò, Microporous Mesoporous Mater., 2007, 101, 153–160 CrossRef.
- E. Janiszewska, A. Macario, J. Wilk, A. Aloise, S. Kowalak, J. B. Nagy and G. Giordano, Microporous Mesoporous Mater., 2013, 182, 220–228 CrossRef.
- M. Bernaue, E. Tabor, V. Pashkova, D. Kaucký, Z. Sobalík, B. Wichterlová and J. Dedecek, J. Catal., 2016, 344, 157–172 CrossRef.
- L. B. Young, S. A. Butter and W. W. Kaeding, J. Catal., 1982, 76(2), 418–432 CrossRef.
- S. Ilias and A. Bhan, J. Catal., 2014, 311, 6–16 CrossRef.
- Y. Ni, A. Sun, X. Wu, G. Hai, J. Hu, T. Li and G. Li, Microporous Mesoporous Mater., 2011, 143(2), 435–442 CrossRef.
- M. Guisnet, N. S. Gnep, D. Aittaleb and Y. J. Doyemetet, Appl. Catal., A, 1992, 87(2), 255–270 CrossRef.
- J. J. H. B. Sattler, J. Ruiz-Martinez, E. Santillan-Jimenez and B. M. Weckhuysen, Chem. Rev., 2014, 114(20), 10613–10653 CrossRef PubMed.
- T. Otroshchenko, J. Radnik, M. Schneider, U. Rodermerck, D. Linke and E. V. Kondratenko, Chem. Commun., 2016, 52, 8164–8167 RSC.
- J. A. Biscardi, G. D. Meitzner and E. Iglesia, J. Catal., 1998, 179, 192–202 CrossRef.
- Y. G. Kolyagin, V. V. Ordomsky, Y. Z. Khimyak, A. I. Rebrovc, F. Fajulad and I. I. Ivanova, J. Catal., 2006, 238, 122–133 CrossRef.
- Y. G. Kolyagin, I. I. Ivanova and Y. A. Pirogov, Solid State Nucl. Magn. Reson., 2009, 35, 104–112 CrossRef PubMed.
- G. Caeiro, R. H. Carvalho, X. Wang, M. A. N. D. A. Lemosa, F. Lemosa, M. Guisnet and F. R. Ribeiro, J. Mol. Catal. A: Chem., 2006, 255, 131–158 CrossRef.
- Y. J. Ren, F. Zhang, W. M Hua, Y. H Yue and Z. Gao, Catal. Today, 2009, 148, 316–322 CrossRef.
- A. W. Aldag and B. Okla, US pat. 4,524,144, 1985.
- Z. X. Chen, A. Derking, W. Koot and M. P. van Dijk, J. Catal., 1996, 161, 730–741 CrossRef.
- N. M. Schweitzer, B. Hu, U. Das, H. Kim, L. A. Curtiss, P. C. Stair, T. Miller and A. S. Hock, ACS Catal., 2014, 4, 1091–1098 CrossRef.
- L. Q. Wang, X. S. Wang and X. W. Guo, Chin. J. Catal., 2001, 22, 513–514 Search PubMed.
- J. Chen, Z. Feng, P. Ying and C. Li, J. Phys. Chem. B, 2004, 108, 12669–12676 CrossRef.
- Y. M. Ni, W. Y. Peng, A. M. Sun, W. L. Mo, J. L. Hu, T. Li and G. X. Li, J. Ind. Eng. Chem., 2010, 16, 503–505 CrossRef.
- H. A. Zaidi and K. K. Pant, Catal. Today, 2004, 96, 155–160 CrossRef.
- F. Yin, A. L. Blumenfeld, V. Gruver and J. J. Fripiat, J. Phys. Chem. B, 1997, 101, 1824–1830 CrossRef.
- W. Zhang, P. G. Smirniotis, M. Gangoda and R. N. Bose, J. Phys. Chem. B, 2000, 104, 4122–4129 CrossRef.
- V. S. Escribanoa, T. Montanarib and G. Busca, Appl. Catal., B, 2005, 58, 19–23 CrossRef.
- G. V. A. Martins, G. Berlie, C. Bisio, S. Coluccia, H. O. Pastore and L. Marchese, J. Phys. Chem. C, 2008, 112, 7193–7200 Search PubMed.
- E.-M. El-Malki, R. A. van Santen and W. M. H. Sachtler, J. Phys. Chem. B, 1999, 103, 4611–4622 CrossRef.
- S. S. Arzumanov, A. A. Gabrienko, D. Freude and A. G. Stepanov, Solid State Nucl. Magn. Reson., 2009, 35, 113–119 CrossRef PubMed.
- K. J. Caspary, H. Gehrke, M. Heinritz-Adrian and M. Schwefer, Handbook of Heterogeneous Catalysis, Wiley, 2nd edn, 2008, pp. 3206–3229 Search PubMed.
Footnote |
| † Electronic supplementary information (ESI) available: XRF, SEM and TEM images, N2 adsorption and desorption isotherms, the relative crystallinity of catalysts, XRD patterns, the acid amount of catalysts. See DOI: 10.1039/c8ra02467g |
| This journal is © The Royal Society of Chemistry 2018 |