
 Open Access Article
 This Open Access Article is licensed under a Creative Commons Attribution-Non Commercial 3.0 Unported Licence
The effect of compressive stresses on a silicon electrode’s cycle life in a Li-ion battery
Maciej Ratyńskia,
Bartosz Hamankiewicz *ab,
Michał Krajewskia,
Maciej Boczara and
Andrzej Czerwiński*ac
*ab,
Michał Krajewskia,
Maciej Boczara and
Andrzej Czerwiński*ac
aFaculty of Chemistry, University of Warsaw, Pasteura 1, 02-093 Warsaw, Poland. E-mail: bhamankiewicz@chem.uw.edu.pl; aczerw@chem.uw.edu.pl
bBiological and Chemical Research Centre, University of Warsaw, Zwirki i Wigury 101, 02-089 Warsaw, Poland
cIndustrial Chemistry Research Institute, Rydygiera 8, 01-793 Warsaw, Poland
First published on 20th June 2018
Abstract
Lithium-ion cells are currently very promising electrochemical power sources. New high-capacity electrodes made from silicon are currently under intensive study. As well as its high capacity, silicon undergoes a significant volume increase (up to 300%) during lithiation. This leads to the generation of internal stresses and fast cell degradation due to active material pulverization and separation from the current collector. Stress formation and its effect on silicon lithiation has been theoretically investigated by many researchers. It has been shown that internal compressive stress can slow down or stop silicon lithiation. In our study we applied external stress to an electrode active layer and measured the cell electrochemical parameters: capacity, cycle life, and charge transfer resistance. In contrast with theoretical estimations we observed an increase in capacity and cycle life when high compressive stress was applied. We believe this behavior is related to stress-induced lithiation front slowdown, which entails a longer stress relaxation period and as a consequence improves the cell parameters.
Introduction
Lithium ion (Li-ion) cell technology has been intensively studied since the late sixties.1 The first commercially available Li-ion battery was introduced by Sony in 1991.2 Since then, intensive research has been done to improve the specific capacity, power density and cycle life of Li-ion cells. Today, Li-ion cells are often used for applications where a high energy density is crucial, e.g. plane/space industries, electric vehicles, tools, and mobile electronic devices. In most commercially available cells, negative electrodes are made from carbonaceous materials, e.g. graphite. Graphite has a theoretical specific capacity of 372 mA h g−1 for lithium intercalation.3 This is almost ten times lower than metallic lithium (3860 mA h g−1). However, the use of a graphite intercalation material is much safer as it eliminates extremely reactive lithium metal from a cell and as a consequence eliminates lithium dendrite formation and hazardous internal shortcuts which are the main reasons for lithium metal electrodes having a poor cycle life and safety issues.4 Experiments for a new material, which combines a high specific capacity with a good cycle life and operational safety are carried out continuously. One of the most promising materials for a Li-ion cell negative electrode is silicon.5 Silicon can form a Li–Si alloy by the electroreduction of lithium ions. A silicon anode’s working potential is high enough to ensure that there is no lithium metal plating but also reasonably low enough to maintain a high battery voltage (with currently available cathode materials).6 The theoretical specific capacity of a Li–Si alloy can reach 3590 mA h g−1 for a Li15Si4 structure. The above capacity was calculated without the inclusion of lithium mass. When Li mass is included Li15Si4 has a theoretical capacity close to 1860 mA h g−1. The Li–Si alloy molar volume (dependent on the lithium content) is larger than that of pure silicon, which leads to a repetitive expansion and shrinking of the active material during cycling. Lithium insertion/extraction results in a huge volume change of up to 370%6 compared to a volume change of less than 9% in graphite.7 This, as a consequence, generates large stress in the electrode active layer causing the cracking and pulverization of Si-based cells. Material cracking can lead to particle electrical separation and/or even large areas of active layer delamination from the current collector.8 Separated particles/layer parts lose their electrical contact (due to a fast forming new SEI layer) and cannot participate in further reactions which causes fast electrode capacity fading. One of the possible solutions for this problem is to use a high modulus binder that strengthens the connection between particles. A typically used binder for current Li-ion batteries – polyvinylidene fluoride (PVDF) – was shown to not be a suitable choice for silicon-based electrodes. Recent research has also demonstrated that material-current collector adhesion strength decreases with increasing PVDF binder content while only the particle–particle cohesion strength increases.9 For volume changing electrodes high elastic modulus polymers with large numbers of hydroxyl and carboxyl groups are used e.g. CMC (carboxymethyl cellulose) or PAA (polyacrylic acid).10 However a large amount of binder increases the electrode mass and decreases the absolute capacity.11 For this reason great attention has been focused on better understanding the chemical and mechanical behavior of the silicon particles during lithiation. Studies have shown that the lithiation of a silicon particle is a two phase process.12,13 High concentration gradients between the lithiated and unlithiated part of a silicon particle become present and can generate large mechanical stress inside the particle. Numerous mathematical calculations based on a core–shell model of silicon lithiation have been performed to estimate the stress evolution in a Si particle.14–18 In the core–shell model lithium is introduced to the silicon particle by chemical affinity and/or an applied voltage. As a consequence, a layer of lithiated LixSi phase near the particle surface and unlithiated Si phase inside the particle is formed. The thickness of the lithiated layer increases during the lithiation of silicon to the point where most of the grains are lithiated. Different approaches have been presented to provide an explanation for the two-phase mechanism. Some of them are based on different diffusion coefficients in the Si and LixSi phase.14,18 Recently, a more plausible explanation was presented based on the assumption of a chemical reaction between pure silicon and the silicon-lithium phase. Different relative speeds of chemical reaction and lithium ion diffusion in the already formed LixSi phase affect the lithium concentration gradient in the particle. Based on TEM observations of in situ lithiated silicon it is clear that the chemical reaction is slower than the ion diffusion and thus a sharp (few nanometers wide) border (reaction front) is formed between the lithium’s reach and the lithium free phase. Studies have shown that the internal stress can accelerate, slow down or even block the movement of the reaction front and thus limit the capacity of the electrode.15,16 The stress value is dependent on the particle size, geometry, crystallinity, and lithiation speed. For spherical particles with a diameter over 150–200 nm stress generated during lithiation at reasonable speeds could block the reaction front or cause particle cracking, while smaller particles could be completely lithiated.15 Similar observations are possible for silicon nanowires, where only those of over 220 nm19 or over 145 nm20 underwent cracking. Generally, in all models, after a sufficient lithiation time the particle surface is subjected to tensile stress and the particle core is compressed. The tension stress in the outer layer could generate cracks and particle deformation. Compression in the core limits the reaction front movement speed and lowers the lithiation capacity. Calculations of the reaction front speed, when external stress is applied to the particle, show that in all cases the compressive stress decreases the lithiation speed, while tensile stress increases the reaction front movement.17 Nevertheless, high stress and especially stress discontinuity18 at the reaction front could easily result in particle degradation due to cracking. Unfortunately most of the calculations are done for single, spherical, isolated silicon grains. An isolated grain is not affected by neighboring grains, and the initial stress on the particle surface is assumed to be zero. This is far from the situation in real silicon electrodes where the particles are all densely packed close to each other. Swelling or shrinking of the neighboring particles affects the stress being applied to the grain surface, and thus may change the overall behavior of the whole electrode. In this study we present the effect of pressure used during electrode preparation on further electrochemical parameters in a Li-ion cell. To the best of our knowledge there are no scientific papers describing this phenomenon.Experimental
The electrode material was prepared by mixing <100 nm diameter silicon NPs (Sigma) with XC-72 Vulcan conductive carbon (Cabot) and binding polymer polyvinylidene fluoride (PVDF) or carboxymethyl cellulose (CMC). Binding polymers were added as a 5% w/w solution in N-methylpirolidon (PVDF) or 3% w/w solution in water (CMC). The mixed material slurry was stirred by an ultrasonic stirrer for 60 minutes. The slurry was applied to clean copper foil by doctor blading. It formed smooth, even layers of 200 μm thickness. After drying in a vacuum at 120 °C for 8 h, 9 mm diameter electrodes were cut from the layer. Electrodes were pressed in a manual press at a given pressure (20–260 bar) for 30 s. The pressed electrodes were used in Li-ion cells containing metallic lithium as a counter and reference electrode, and 1 M LiPF6 in 1![[thin space (1/6-em)]](https://www.rsc.org/images/entities/char_2009.gif) :1 ethylenecarbonate, dimethylcarbonate as the electrolyte. Galvanostatic polarization tests were performed with an Atlas 0961 device. Cells were held at an OCV for stabilization for 24 h and then cycled at a 0.1 C current between 0.02 V and 1.8 V vs. reference electrode. EIS measurements were done using a Solartron SI 1260 impedance analyzer. The test was executed at 0.5 V vs. reference electrode at a 5 mV amplitude between 100 kHz and 0.1 Hz. The cell was stabilized under open circuit conditions for two hours before the experiment. Impedance data were modeled using the widely used Randles model consisting of Relectrolyte − (RSEI∥CPESEI) − (RCT∥CPEsCT) − Wo as an equivalent circuit.
:1 ethylenecarbonate, dimethylcarbonate as the electrolyte. Galvanostatic polarization tests were performed with an Atlas 0961 device. Cells were held at an OCV for stabilization for 24 h and then cycled at a 0.1 C current between 0.02 V and 1.8 V vs. reference electrode. EIS measurements were done using a Solartron SI 1260 impedance analyzer. The test was executed at 0.5 V vs. reference electrode at a 5 mV amplitude between 100 kHz and 0.1 Hz. The cell was stabilized under open circuit conditions for two hours before the experiment. Impedance data were modeled using the widely used Randles model consisting of Relectrolyte − (RSEI∥CPESEI) − (RCT∥CPEsCT) − Wo as an equivalent circuit.
Two different electrode compositions were tested during this research. Their composition and labels are presented in Table 1. Later in the text, the presented labels are used to define the samples.
| Label | Silicon content | Carbon content | Binder content (type) |
|---|---|---|---|
| A | 80% | 10% | 10% (PVDF) |
| B | 60% | 25% | 15% (CMC) |
Results and discussion
It is known that silicon based electrodes used in Li-ion cells suffer from poor cyclability due to high silicon volume changes which occur during lithium insertion. The high theoretical specific capacity obtained for Li15Si4 (up to 3590 mA h g−1) rapidly decreases after each charge/discharge cycle. The main reasons for this behavior are attributed to separation between the active material and the current collector, and separation between active material particles inside the electrode layer. This separation results in a loss in electrical contact, and as a consequence, a reduced electrode capacity. The separated fragments are unable to regain contact due to a quickly generated, insulating SEI layer (around the non-separated fragments).Post mortem analysis and visual observations of the electrodes revealed a high tendency for separation to occur between the current collector and the electrode material after 15 charge/discharge cycles. Separation was at its highest in electrodes compressed at a low pressure, and lowest in ones compressed at a high pressure. Optical images of sample A electrodes pressed at 20 bar (A) and 200 bar (B) after 15 cycles are shown in Fig. 1. Electrodes pressed at 20 bar lost significantly more material through separation than those compressed at 200 bar. In general there is no justifiable difference in the recorded images of the sample A and sample B electrodes, so no quantitative information can be calculated from them. Small material separation near the edge of the 200 bar pressed electrode is probably caused by stress generated during electrode cutting.
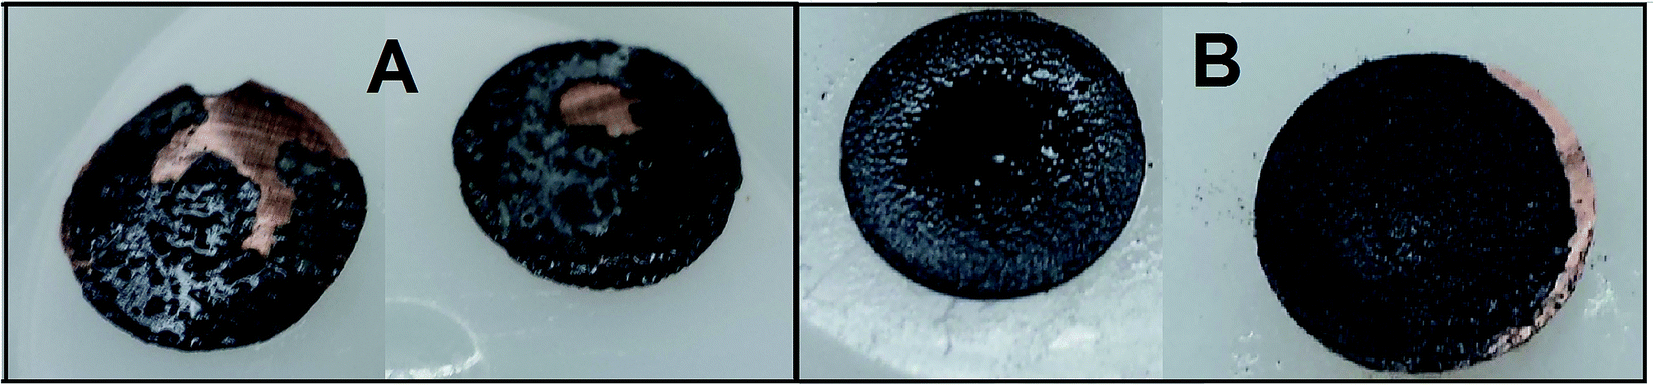 | ||
| Fig. 1 Comparison between sample A electrodes pressed at 20 bar (A) and 200 bar (B) after 15 charge/discharge cycles. | ||
In our opinion a greater compression increases the adhesion force between the current collector and active material by increasing the contact area between them. The pressed particles and copper foil surface deform so their shapes fit each other to form stronger connections. The electrode material layer is also strengthened in bulk by pressing. Particles are packed densely which improves the electric contact and reduces the chance of separation.
To examine the effect of compression on the electrochemical behavior of a cell we performed galvanostatic charge/discharge tests. Fig. 2 presents cyclability tests of samples A and B compressed at different pressures. As can be seen in Fig. 2, after 2 cycles the sample A electrodes can reach capacities from 810 mA h g−1 (35 bar) to 1540 mA h g−1 (240 bar). Sample B electrodes obtain capacities in the range of 1100 (35 bar) to 1970 mA h g−1 (200 bar). After 15 cycles, cells with sample A electrodes remain at only 180 mA h g−1 (35 bar) and 1140 mA h g−1 (240 bar) and those with sample B electrodes are at 360 mA h g−1 (20 bar) and 1490 mA h g−1 (200 bar). The results show that due to the higher carbon content (25% carbon) and appropriate binder material sample B cells show a greater specific capacity than sample A cells (10% carbon). It is obvious and well reported that the higher carbon content improves the electrolyte penetration inside the electrode bulk, and more importantly the carbon provides a soft, elastic matrix which allows Si particles to undergo volume change.
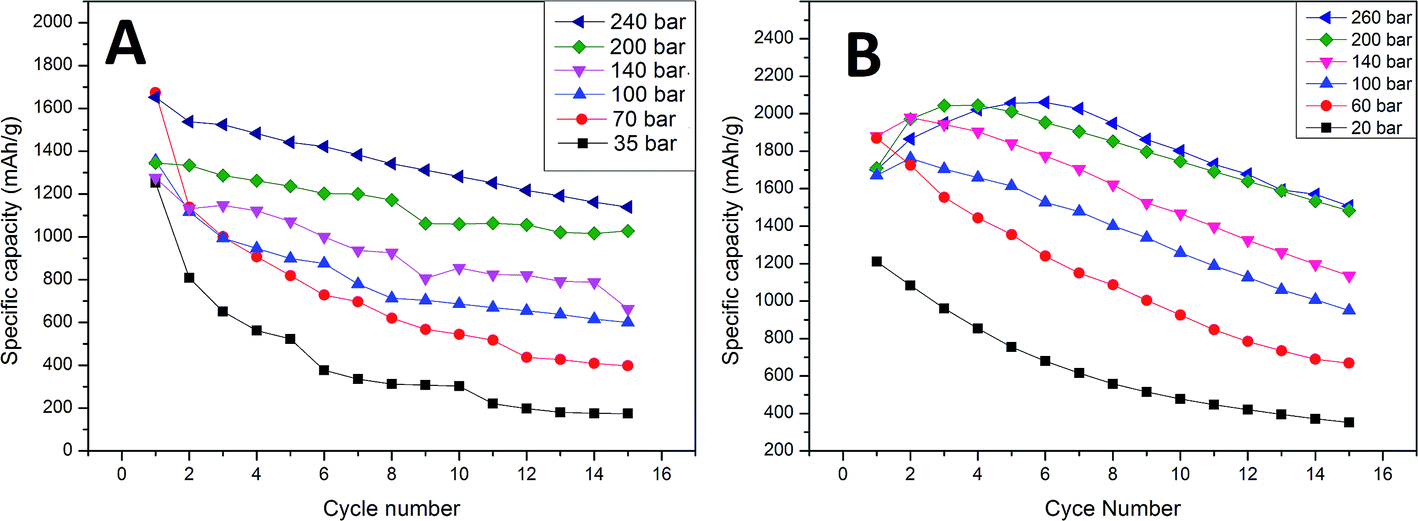 | ||
| Fig. 2 Specific capacity vs. cycle number for sample A and B electrodes pressed at different pressures. | ||
Both (sample A and B) cells gradually lost their capacity during the test. For all sample A cells and sample B cells compressed at low pressure values (20–140 bar) the capacity fade was roughly linear in cycles 2–15. The specific capacity of the sample B cells pressed at high pressures (200–260 bar) increases in the first 3–5 cycles. This “activation” phenomenon might be attributed to several reasons. One of them is the gradual breakdown of the crystalline silicon structure, which depends greatly on the transport rate of Li+ into bulk silicon and the rate of amorphous Si–Li phase formation. The fact that all of our samples were prepared from amorphous silicon makes this much less plausible. The second plausible reason is the presence of an insulating SiO2 layer on the surface of the active material. During charge–discharge cycling, all parts of the composite gradually become active due to the insulating layer cracking due to volume changes and dissolution by hydrofluoric acid which is present as an electrolyte impurity. An additional cause of activation may derive from enhanced diffusion which is known to occur in nanocrystalline solids as a consequence of the high density of grain boundaries. If micro-cracking occurs during the initial cycles to form new internal surfaces which are not exposed to the electrolyte and therefore do not increase irreversible reactions, enhanced lithium diffusion along the crack surfaces may occur resulting in reduced polarization.21 Based on reported theoretical calculations we believe that the initial activation of highly compressed cells is the result of high compressive stress applied to the active material during electrode preparation. This stress, as reported, can block the reaction front movement and limit the cell capacity. After a few cycles the electrode structure becomes loose due to stress relaxation, and the cell capacity increases. In the sample A electrodes, a low carbon content (elastic matrix) accelerates stress release by cell degradation. The first cycle cell capacity is significantly lower than in sample B cells and no activation phenomenon is observed. In sample B the elastic matrix extends the stress release time and decreases the effect of degradation in the initial cycles (stress is released in a non-destructive way). The results show that all cells (independent of the carbon and binder content) pressed at a higher pressure obtain higher initial capacities (second cycle) and a lower capacity fade rate compared to those prepared at low pressures. A second cycle was used to compare the initial capacity due to a large contribution of additional irreversible processes to the overall first cycle capacity. The first cycle irreversible capacity was up to 40% and 38% of the total capacity for samples A and B, respectively. This results in a big deviation in the first cycle capacity within the same pressure pressed electrode groups. The specific capacity as a function of cycle number, and comparisons between the 2nd and 15th specific capacity as a function of the pressure used are presented in Fig. 2 and 3. Sample B cells compressed at 260 bar provide a relatively low change in the capacity fade rate at cycles 5–15 compared to 200 bar pressed cells (27% and 26% capacity loss respectively). This indicates that higher pressures will probably only result in minor changes to this parameter. The initial capacity of the sample A cell is highest for 240 bar pressed electrodes (1540 mA h g−1), while sample B reveals the highest capacity is for the electrode compressed at a lower pressure (1970 mA h g−1 for 200 bar pressed electrode). The differences in this field between samples A and B are probably related to a difference in the carbon matrix quantity and thus a different mechanical behavior. Higher initial capacities of high pressure electrodes conflict with the theoretical estimations of reaction front movement under compressive stress. Calculations show that the reaction front movement speed decreases or is even blocked when under compressive stress. However, our cell was made from very small particles <100 nm where the internal stress is insufficient to block the electrochemical reaction and thus the whole particle volume can be lithiated. Additional external compressive stress applied during cell preparation increases the amount of internal stress and limits the available space for particle swelling during lithiation. All of these effects combined were probably insufficient to block the reaction front in such small particles. A lower capacity fade in the high pressure pressed cells may originate due to various reasons. The first of these is a stronger connection between the active layer and the current collector due to mechanical deformation of the copper at high pressures and its ability to fit the geometry of the active layer material grains. Another reason may be related to a lower reaction front movement speed inside the particles. High compressive stress will increase the reaction energy barrier and slow down the reaction rate.16 A slower reaction front movement will generate smaller internal stress and provide more time for stress relaxation during cycling.15 Additionally, external compressive stress may reduce tension in the outer layer of the particles, which is one of the main reasons for particle cracking.17 As a result, external compressive stress is beneficial for the cell cycle life at low current density cycling.
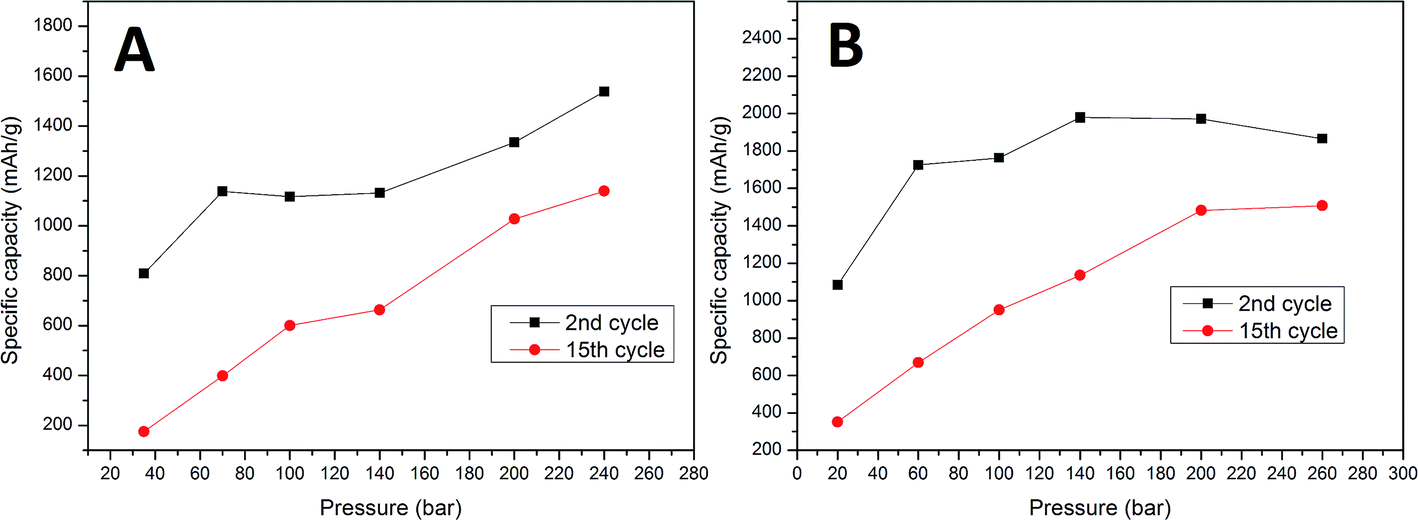 | ||
| Fig. 3 Comparison between the 2nd and 15th cycle capacity vs. preparation pressure for sample A and B electrodes. | ||
To better understand the ongoing degradation process and capacity decay we performed EIS measurements of the cells at cycle numbers from 1 to 10. Nyquist plots for cycles 1, 2, 4, 7 and 10 for sample A pressed at 35 and 200 bar and sample B pressed at 20 and 200 bar are presented in Fig. 4 and 5 respectively. Plots consist of a single flattened semicircle composed of two superimposed semicircles related to the SEI layer and the charge transfer (CT) resistance and capacitance, and a straight line related to the Warburg element. For sample B pressed at 20 bar the SEI layer and CT semicircles are well divided probably due to a high electrode–electrolyte contact surface area. It is clearly seen that the CT resistance increases in all of the samples during cycling, however in samples prepared at a low pressure the initial value and the increase rate are much higher than in the high pressure pressed electrodes. A comparison of the CT resistance values for all of the samples is presented in Fig. 6.
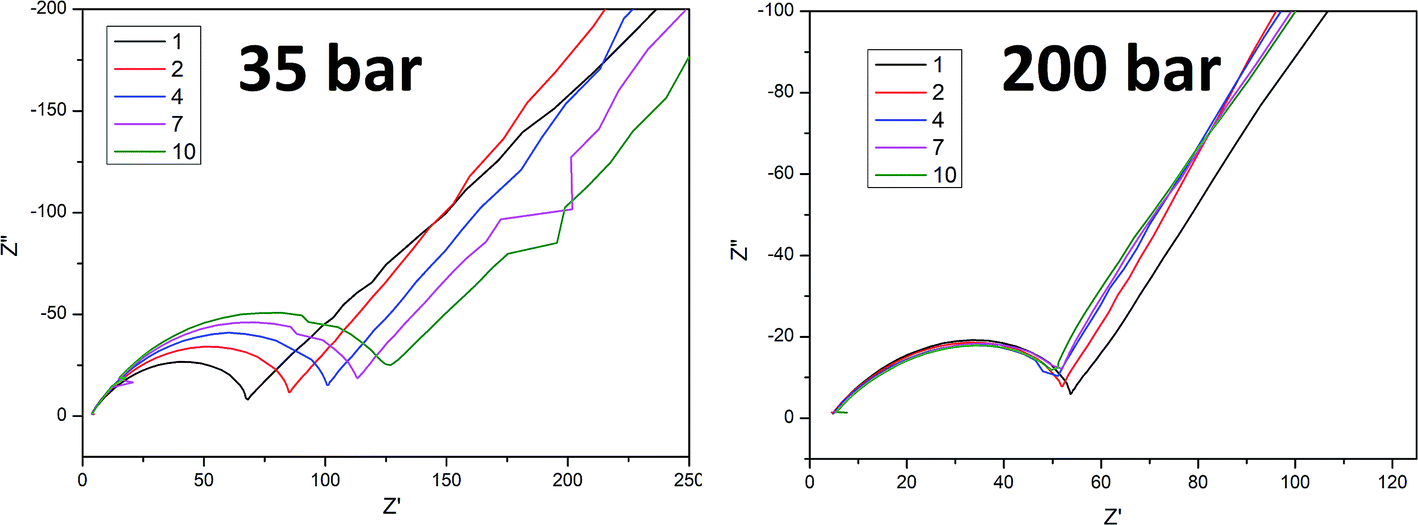 | ||
| Fig. 4 Nyquist plot for cycle 1, 2, 4, 7 and 10 for sample A pressed at 35 and 200 bar. | ||
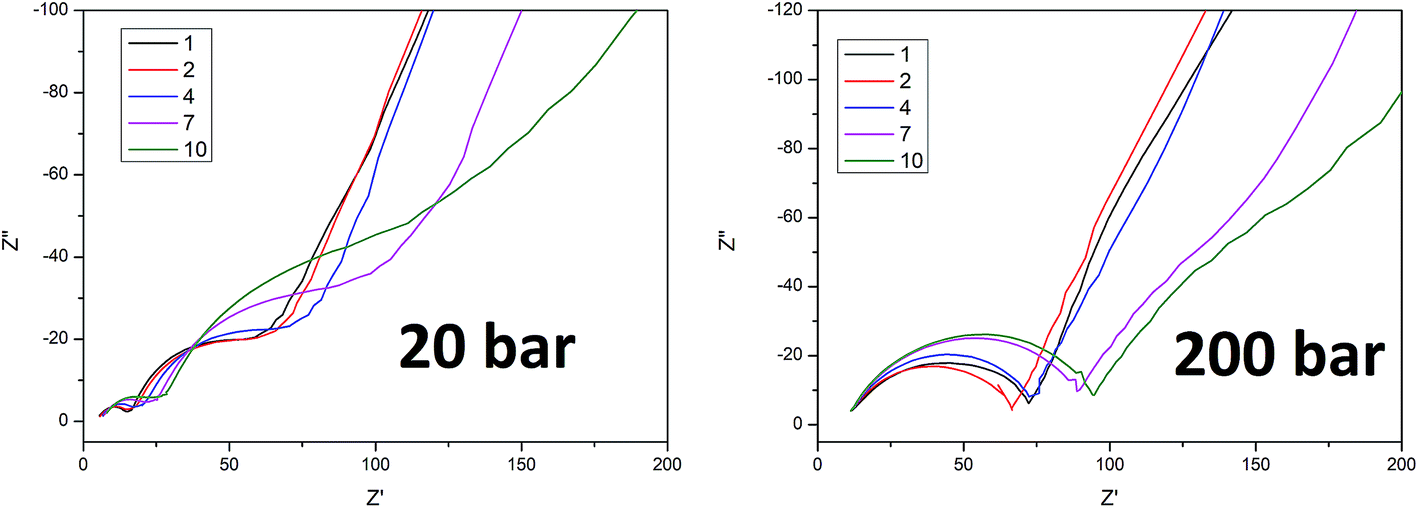 | ||
| Fig. 5 Nyquist plot for cycle 1, 2, 4, 7 and 10 for sample B pressed at 20 and 200 bar. | ||
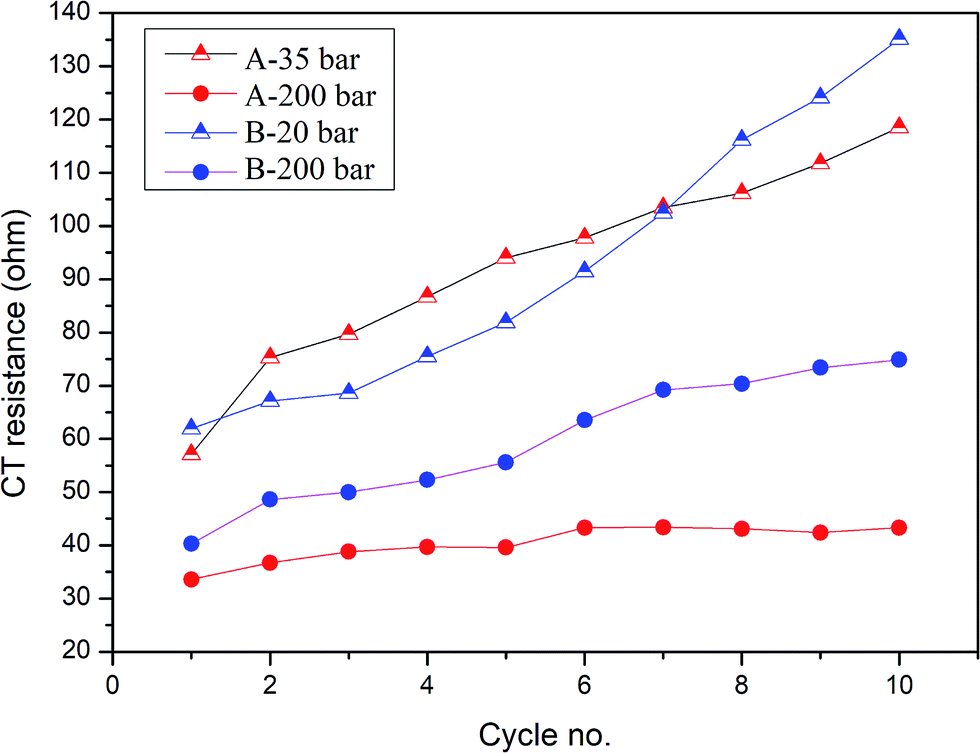 | ||
| Fig. 6 Charge transfer resistance of measured samples prepared at different pressures in cycles 1–10. | ||
A higher charge transfer resistance value for low pressed electrodes may be attributed to a partial loss of electrical contact between the grains and/or between the copper current collector. CT parameters refer to the elemental process of lithium ion reduction/oxidation on the particle’s surface, however, as was previously stated,22,23 both lithium ions and electrons on the particle surface are needed for the reaction to take place. If there is a poor electrical connection with the current collector (mainly by the conductive carbon) only a small part of the surface is electrochemically active and poor kinetics of the lithium ion reduction/oxidation are observed. This directly connects CT resistance observed in the EIS measurements to cell degradation effects. It can be clearly seen that low pressure prepared electrodes have a greater CT resistance and this value increases faster in following cycles compared to for high pressure prepared electrodes. This is in good agreement with capacity measurements which show the fast degradation of low pressure prepared electrodes and confirms that degradation of the silicon electrodes is mainly caused by a loss of electrical contact between the grains and the current collector.
Summary
We have investigated the effect of applying external pressure during cell preparation and its further electrochemical behavior as a Li-ion battery electrode. Silicon nanoparticles were chosen as the active material due to their recently discovered advantages and their still-unsolved stress to cycle life dependency. Despite theoretical calculations we have discovered that high pressure prepared electrodes have a higher specific capacity and cycle life compared to those prepared under low pressure. We believe that compressive stress introduced to the active mass by pressing and further intensified by swelling during silicon lithiation is responsible for the reaction front movement speed decrease. The results of this reaction front slowdown include less internal stress in the silicon particles, more time for stress relaxation and by consequence a better electrode cycle life. Our research shows that high pressure pressed electrodes retain over 4 times more reversible capacity after 15 cycles. This finding could be used to enhance the cycle life and capacity of silicon and other volume changing electrodes.Conflicts of interest
There are no conflicts to declare.Acknowledgements
This project has received funding from the European Union’s Horizon 2020 research and innovation programme under grant agreement No. 685716. This work was supported by The Polish National Centre of Research and Development through the research grant PBS1/A1/4/2012 and by the Polish National Centre of Science through the research grant UMO-2014/15/B/ST5/02118.References
- L. Werblan and A. Cisak, High-energy non-aqueous batteries, Ellis Horwood Ltd., 1993 Search PubMed.
- J. Kleperis, G. Kucinskis and G. Bajars, J. Power Sources, 2013, 240, 66 CrossRef.
- R. J. Brodd, Batteries for Sustainability: Selected Entries from the Encyclopedia of Sustainability Science and Technology, Springer Science, 2013 Search PubMed.
- J. Collins, G. Gourdin, M. Foster and D. Qu, Carbon, 2015, 92, 193 CrossRef.
- S. Srivastav, C. Xu, K. Edstrom, T. Gustafsson and D. Brandell, Electrochim. Acta, 2017, 258, 755 CrossRef.
- B. Liang, Y. Liu and Y. Xu, J. Power Sources, 2014, 267, 469 CrossRef.
- G.-A. Nazri and G. Pistoia, Lithium Batteries: Science and Technology.Springer Science, 2009 Search PubMed.
- M. Pharr, Z. Suo and J. J. Vlassak, Nano Lett., 2013, 13, 5570 CrossRef PubMed.
- J. C. J. Liu, Y. Qi, T. Sun and X. Li, J. Electrochem. Soc., 2013, 9, 160 CrossRef.
- Z. Karkar, D. Guyomard, L. Rou and B. Lestriez, Electrochim. Acta, 2017, 258, 453 CrossRef.
- S. D. Beattie, D. Larcher, M. Morcrette, B. Simon and J.-M. Tarascon, J. Electrochem. Soc., 2008, 155, A158 CrossRef.
- M. T. McDowell, I. Ryu, S. W. Lee, C. Wang, W. D. Nix and Y. Cui, Adv. Mater., 2012, 24, 6034 CrossRef PubMed.
- M. T. McDowell, S. W. Lee, J. T. Harris, B. A. Korgel, C. Wang, W. D. Nix and Y. Cui, Nano Lett., 2013, 13, 758 CrossRef PubMed.
- A. F. Bower, P. R. Guduru and V. A. Sethuraman, J. Mech. Phys. Solids, 2011, 59, 804 CrossRef.
- Z. Cui, F. Gao and J. Qu, J. Mech. Phys. Solids, 2013, 61, 293 CrossRef.
- X. Zhang, A. Krischok and C. Linder, Computer Methods in Applied Mechanics and Engineering, 2016, 312, 51 CrossRef.
- A. B. Freidin, I. K. Korolev, S. P. Aleshchenko and E. N. Vilchevskaya, Int. J. Fract., 2016, 202, 245 CrossRef.
- R. Deshpande, Y.-T. Cheng, M. W. Verbrugge and A. Timmonsc, J. Electrochem. Soc., 2011, 158, A718 CrossRef.
- Z. W. Cui, F. Gao and J. M. Qu, J. Mech. Phys. Solids, 2012, 60, 1280 CrossRef.
- I. Ryu, S. W. Lee, H. Gao, Y. Cui and W. D. Nix, J. Power Sources, 2014, 255, 274 CrossRef.
- J. R. Szczech and S. Jin, Energy Environ. Sci., 2011, 4, 56 RSC.
- M. Krajewski, B. Hamankiewicz and A. Czerwiński, Electrochim. Acta, 2016, 219, 277 CrossRef.
- M. Krajewski, B. Hamankiewicz, M. Michalska, M. Andrzejczuk, L. Lipińska and A. Czerwinski, RSC Adv., 2017, 7, 52151 RSC.
| This journal is © The Royal Society of Chemistry 2018 |