 Open Access Article
Bioactive terpenoids from Santalum album derived endophytic fungus Fusarium sp. YD-2†
Chong Yan‡
a,
Weiyang Liu‡a,
Jing Lia,
Yanlian Denga,
Senhua Chen *b and
Hongju Liu*a
aSchool of Pharmacy, Guangdong Medical University, Dongguan, 523808, China. E-mail: liuhj8@mail2.sysu.edu.cn; Fax: +86769-22896560; Tel: +86769-22896599
bSchool of Marine Sciences, Sun Yat-Sen University, Guangzhou 510275, China. E-mail: chensenh@mail.sysu.edu.cn; Tel: +8620-84725459
First published on 19th April 2018
Abstract
Two new spiromeroterpenoids, namely fusariumin A (1) and B (2), along with four known terpenoids, asperterpenoid A (3), agathic acid (4), guignardone N (5), and trametenolic acid (6), were obtained from the endophytic fungus Fusarium sp. YD-2, derived from the twigs of Santalum album. Their structures were elucidated by a combination of spectroscopic analyses. The absolute configuration of 1 was determined by single-crystal X-ray diffraction using Cu Kα radiation, and that of 2 was elucidated on the basis of experimental and calculated electronic circular dichroism spectra. Compound 2 exhibited moderate anti-inflammatory activity in vitro by inhibiting nitric oxide (NO) production in lipopolysaccharide activated RAW264.7 cells with an IC50 value of 50 μM, and compound 3 showed strong anti-inflammatory activity with an IC50 value of 1.6 μM. In the antibacterial assay, compound 1 displayed significant activities against Staphylococcus aureus and Pseudomonas aeruginosa with an MIC value of 6.3 μg mL−1, and compound 3 showed moderate activities against Salmonella enteritidis and Micrococcus luteus with MIC values of 6.3 and 25.2 μg mL−1, respectively.
Introduction
Santalum album L, called “Tanxiang” in China, is an evergreen and hemi-parasitic tree belonging to the Santalaceae family. The tree was highly valued for its fragrant heartwood (sandalwood), which was used in religious rituals in India and was also used as a medium to carve deities and temples.1 Sandalwood was also used as a traditional medicine to remedy many ailments2 and was recorded in Pharmacopoeia of China.3An endophyte is an organism that lives inside a plant. The plants that host endophytes do not show symptoms of disease, at least during the endophytic phase of their life cycle.4 Endophytes are known to be able to biosynthesize some of the same chemical compounds as their host plant.5 The metabolites of endophytic fungi, especially in medicinal plants, have been attracting attention as sources of potentially valuable compounds.6
As part of our research, a strain of Fusarium sp. YD-2 was collected from the twigs of S. album. It has been previously reported that endophytic fungi Fusarium sp. could produce various bioactive secondary metabolites, such as azaphilone,7 isocoumarin,8 isoquinoline,9 macrolide,9 cyclic depsipeptide,10 glycolipid,11 triterpenoid.12 Phytochemical analysis of an EtOAc extract of fermentation of the fungus YD-2 led to the identification of two new spiromeroterpenoids (1 and 2), along with four known terpenoids (3–6). The structures of compounds 1–6 were established by a combination of 1D and 2D NMR data, ECD data analysis, and X-ray diffraction crystallographic data. All isolated compounds were evaluated for anti-inflammatory activities and antibacterial activities. Herein, details of the isolation, structure elucidation, and bioactivities of all isolated compounds are reported.
Results and discussion
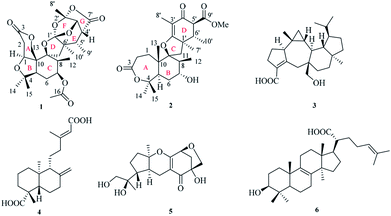
The endophytic fungus Fusarium sp. YD-2 was cultured on solid rice medium for four weeks. The EtOAc extract of the fermentation was seperated by repeated silica gel chromatography and Sephadex LH-20 column chromatography to afford the compounds 1–6 (Fig. 1).Fusariumin A (1) was obtained as a white solid. The molecular formula determined by HR-ESIMS analysis to be C27H36O10, with ten degrees of unsaturation, by observing a quasi-molecular ion at m/z 519.2229 [M − H]− (calcd for 519.2236). The 1H NMR spectrum exhibited signals for seven methyl groups [δH 1.02 (d, J = 7.5 Hz), H3-12; 1.28, s, H3-14; 1.15, s, H3-15; 2.0, s, H3-17; 1.74, s, H3-8′; 1.19 (d, J = 7.3 Hz), H3-9′; 0.90, s, H3-10′], four methylene groups [δH 4.50 (d, J = 3.9 Hz), H-1; 2.88 (dd, J = 15.9, 4.2 Hz), 2.78 (d, J = 15.9, Hz), H-2; 1.65, m, H-6; 2.25 (d, J = 13.8 Hz), 1.97, (d, J = 13.8 Hz), H-11], and seven methine groups [δH 4.50 (d, J = 3.9 Hz), H-5; 4.85, m, H-7; 2.51, m, H-8; 4.72 (d, J = 13.0 Hz), 4.50 (d, J = 13.0 Hz), H-13; 4.81 (d, J = 8.6 Hz), H-3′; 2.72 (d, J = 6.3, 8.6 Hz), H-4′; 2.16, m, H-5′] (Table 1). The 13C NMR and DEPT spectra of 1 revealed the presence of 27 carbon signals, including three carbonyls (δC 174.3, 170.4 and 170.1), six quaternary carbons, seven methines, four methylenes, and seven methyls. Three carbonyl carbons accounted for three degrees of unsaturation, remaining seven degrees of unsaturation indicated that the structure of 1 possessed seven rings.
| No. | 1a | 2b | ||
|---|---|---|---|---|
| δH (J in Hz) | δC | δH (J in Hz) | δC | |
| a 1H (400 MHz) and 13C (100 MHz) NMR data in CDCl3.b 1H (400 MHz) and 13C (100 MHz) NMR data in MeOH-d4. | ||||
| 1 | 4.23, d (3.9) | 75.3, CH2 | α 1.98, m | 40.9, CH2 |
| β 1.77, m | ||||
| 2 | α 2.88, dd (15.9, 4.2) | 35.5, CH2 | 2.33, m | 32.2, CH2 |
| β 2.78, d (15.9) | ||||
| 3 | 170.1, C | 173.3, C | ||
| 4 | 80.3, C | 85.6, C | ||
| 5 | 1.62, dd (11.6, 4.1) | 51.2, CH | 1.83, m | 52.9, CH |
| 6 | 1.65, m | 22.8, CH2 | α 2.45, m | 34.8, CH2 |
| β 1.93, m | ||||
| 7 | 4.85, m | 72.4, CH | 3.91, m | 80.5, CH |
| 8 | 2.51, m | 46.0, CH | 1.92, m | 50.1, CH |
| 9 | 86.3, C | 100.3, C | ||
| 10 | 50.0, C | 45.5, C | ||
| 11 | α 2.25, d (13.8) | 49.9, CH2 | α 2.50, m | 44.5, CH2 |
| β 1.97, d (13.8) | β 1.87, m | |||
| 12 | 1.02, d (7.5) | 10.8, CH3 | 0.91, d (7.0) | 13.9, CH3 |
| 13 | α 4.72, d (13.0) | 65.5, CH | 1.32, s | 23.1,CH3 |
| β 4.50, d (13.0) | ||||
| 14 | 1.28, s | 30.8, CH3 | 1.30, s | 34.2, CH3 |
| 15 | 1.15, s | 21.6, CH3 | 1.71, s | 27.0, CH3 |
| 16 | 170.4, C | |||
| 17 | 2.08, s | 21.0, CH3 | ||
| 1′ | 128.1, C | 44.9, C | ||
| 2′ | 107.7, C | 186.8, C | ||
| 3′ | 4.81, d (8.6) | 78.7, CH | 106.7, C | |
| 4′ | 2.72, dd (6.3, 8.6) | 41.8, CH | 195.6, C | |
| 5′ | 2.16, m | 39.6, CH | 3.32, d (3.4) | 59.4, CH |
| 6′ | 47.4, C | 2.52, m | 42.8, CH | |
| 7′ | 174.3, C | 1.26, s | 22.4, CH3 | |
| 8′ | 1.74, s | 22.2, CH3 | 1.70, s | 8.6, CH3 |
| 9′ | 1.19, d (7.3) | 12.2, CH3 | 173.3, C | |
| 10′ | 0.9, s | 19.1, CH3 | 1.05, d (6.7) | 14.7, CH3 |
| 11′ | 3.71, s | 52.7, CH3 | ||
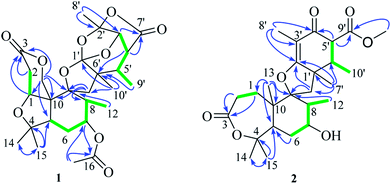
Extensive analysis of 2D NMR, revealed the planar structure of 1 as described below (Fig. 2). The 1H–1H COSY correlations indicated three sequences of CH(1)-CH2(2), CH2(6)-CH(7)-CH(8)-CH3(12), and CH(3′)-CH(4′)-CH(5′)-CH3(9′), as shown by green bold lines in Fig. 2. In the HMBC spectrum, the observed key correlations from H3-14 and H3-15 to C-4 and C-5, from H2-13 to C-1, C-3, C-9, and C-10, from H-1 to C-3 and C-13, from H2-2 to C-3 and C-10, from H3-12 to C-9, from H-17 to C-16 and C-7, from H-7 to C-16 completed the structure of rings A, B, and C (Fig. 2). The HMBC correlations of H-8′ with C-2′ and C-3′, H-3′ with C-1′, C-5′, C-7′ and C-8′, H-4′ with C-6′ and C-7′, H-5′with C-6′ and C-10′, H3-10′ with C-11, C-1′ and C-6′, H2-11 with C-9, C-1′ and C-10′, together with their chemical shift values (δC 128.1, C-1′; 107.7, C-2′; 78.7, C-3′) indicated the presence of rings E, F, and G. rings A/B/C and rings E/F/G were connected through a methylene C-11 and an oxygen atom to construct a spiro ring D according to HMBC correlations of H2-11 with C-8, C-9, and C-10. A remaining acetyl group was linked to C-7 (δC 72.4) of ring B, supported by the HMBC correlations of H-7 with carbonyl carbon C-16 and H3-17 with C-7.
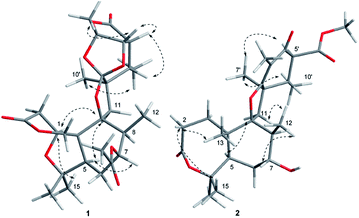
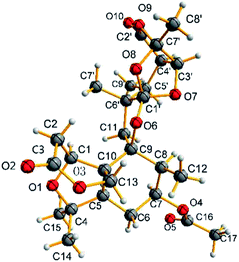
The relative configuration of 1 was determined by the detailed analysis of NOESY data. The relative configurations of three methyl groups (CH3-12′, CH3-14 and CH3-15) and three methine groups (CH-5, CH-7 and CH-8) in the rings A, B, and C, were identified on the base of key NOESY correlations: H-1/H3-10′, H-6, and H-11α (δH 2.25, d, J = 13.8), H3-17/H-15 and H3-12, H3-16/H-1. Key NOESY correlations of H-3′ with H-4′ and H3-8′, H-5′ with H-4′ and H-11β (δH 1.97, d, J = 13.8), H3-10′ with H-11α and H3-9′ indicated that the relative configurations of the rings E, F and G as shown in Fig. 3. Key NOESY correlations of H-8 with H-2β (δH 2.78, d, J = 15.9), H3-10′ with H-2β and H-11α, H-5 with 11α and H-7 revealed the relative configuration of the two rings system (rings A/B/C and rings E/F/G) as shown in Fig. 3. The absolute configuration of 1 was determined as shown in Fig. 4 by X-ray diffraction analysis using Cu Kα radiation with a Flack parameter of 0.031 (13)13 (Fig. 3). Fusariumin A (1) was an unusual polycyclic spiromeroterpenoid, whose structure possessed a unique and congested heptacyclic skeleton with 6/5/6/5/6/5/5 system.
Fusariumin B (2) was isolated as a white, amorphous powder. The molecular formula was assigned to be C26H38O7, with eight degrees of unsaturation, based on its HR-ESIMS (m/z 461.2549, calcd for 461.2545). The 1H NMR spectrum exhibited eight methyl groups, one methoxy group, four methylene groups and five methine groups (Table 1). Three signals (δC 195.6, 173.3 and 173.3) in the 13C NMR data revealed the presence of three carbonyl carbons (one ketone and two esters), and two signals (δC 186.8, 106.7) revealed one olefin. These units accounted for four degrees of unsaturation, indicating that four rings were present.
The planar structure of 2 was mainly elucidated by 2D NMR (1H–1H COSY and HMBC). A seven-membered lactone (ring A) was identified on the base of 1H–1H COSY correlation between H2-1 and H2-2, and the key HMBC correlations of H2-1 and H2-2 with C-3 (δC 173.3), H2-1, H3-14 and H3-15 with C-5, H2-1 with C-9, H3-14 and H3-15 with C-4. The 1H–1H COSY correlations of H-12, H-8, H-7 with H2-6 and the HMBC correlations from H3-12 and H3-13 to C-9, H-7 to C-5, H3-13 to C-10 and C-5 indicated the presence of a hexatomic ring (ring B). A cyclohexanone unit (ring D) was established by the HMBC correlations of H-5′ and H-6′ with C-4′ and C-9′, H-6′ and H-7′ with C-1′, H-6′ and H3-8 with C-4′, H3-8′ with C-2′ and C-3′, H-7′ with C-2′, H-11′ with C-9′, as well as the 1H–1H COSY correlations of H-5′, H-6′ and H-10′. The rings B and D were linked through a methylene C-11 and an oxygen atom to construct a tetrahydrofuran with a spiro ring (ring D) based on HMBC correlations of H-7′ with C-1′, H-11 with C-2′, H2-11 with C-1′, C-2′, C-8 and C-9.
The relative configuration of 2 was established from the analysis of NOESY data (Fig. 3), which was similar to those of asnovolin A.14 The NOESY correlations of H-1β/H3-12 and H-6β, H3-12/H-11β, H-7, H3-13, H3-13/H3-15, H-5, H3-14/H-1α and H-5 suggested that the three methyl groups (H3-12, H3-13, and H3-14), and H-7 are on the same side in the rings A and B, whereas H3-15 and H-5 are on the opposite side. The NOESY correlations of H3-7′/H3-10′ and H-5′, H3-10′/H-11α, H-6′/H-11β, indicated that the two methyl groups (H3-7′ and H3-10′) and H-5′ are on the same side in the rings C and D.
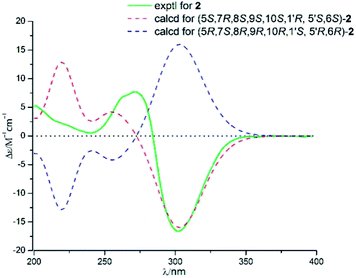
Compound 2 and asnovolin A showed quite similar ECD spectra (Fig. 5), with a positive cotton effect (CE) at 270 nm and negative cotton effect at 303 nm, indicating that they share the similar absolute configuration. In addition, the absolute configuration of 2 was further assigned by comparison of the experimental and theoretical ECD spectra, which was calculated by a quantum chemical method at the [B3LYP/6-311tg(2d,p)] level. The predicted ECD spectrum of (5R,7R,8S,9S,10S,1′R,5′S,6′S)-2 was in agreement with that of the experimental one. The absolute configuration of 2 was established as 5R,7R,8S,9S,10S,1′R,5′S,6′S.
Four known compounds, asperterpenoid A (3),15 agathic acid (4),16 guignardone N (5),17 trametenolic acid (6)18 were identified by comparison of their physical and spectroscopic data with those reported in the literature. Asperterpenoid A (3), a sesterterpenoid with a new carbon skeleton, was initially isolated from a mangrove endophytic fungus Aspergillus sp., which displayed potent inhibitory activity against Mycobacterium tuberculosis protein tyrosine phosphatase B (mPTPB).15 It is firstly reported from the fungus Fusarium species herein.
All isolates 1–6 were evaluated for their anti-inflammatory activity in vitro by inhibiting nitric oxide (NO) production in lipopolysaccharide (LPS) activated RAW264.7 cells using the Griess assay with indomethacin as the positive control (IC50 = 37.5 μM). Compound 2 exhibited moderate anti-inflammatory activity with IC50 values of 50.3 μM, while compound 3 showed promising anti-inflammatory activity with IC50 value of 1.6 μM (Table 2).
The antibacterial activities of all isolates 1–6 were tested for eight bacteria (Staphylococcus aureus, Staphylococcus albus, Bacillus subtilis, Bacillus cereus, Micrococcus luteus, Escherichia coli, Pseudomonas aeruginosa, Salmonella enteritidis), using a standard screening protocol.19 Compound 1 exhibited moderate activities against S. aureus and P. aeruginosa with MIC value 6.3 μg mL−1. Compounds 3 and 4 showed weak activities against S. enteritidis and M. luteus (Table 3).
| Compounds | MICb (μg mL−1) | |||||||
|---|---|---|---|---|---|---|---|---|
| Staphylococcus aureus | Staphylococcus albus | Bacillus subtilis | Bacillus cereus | Micrococcus luteus | Escherichia coli | Pseudomonas aeruginosa | Salmonella enteritidis | |
| a Ciprofloxacin was used as positive control.b Data was expressed in MIC values. | ||||||||
| 1 | 6.3 | >50 | >50 | >50 | >50 | >50 | 6.3 | >50 |
| 2 | >50 | >50 | >50 | >50 | >50 | >50 | >50 | >50 |
| 3 | >50 | >50 | >50 | >50 | 25.2 | >50 | >50 | 6.3 |
| 4 | >50 | >50 | >50 | 12.5 | 25.4 | >50 | >50 | >50 |
| 5 | >50 | >50 | >50 | >50 | >50 | >50 | >50 | >50 |
| 6 | >50 | >50 | >50 | >50 | >50 | >50 | >50 | >50 |
| Ciprofloxacina | 0.25 | 0.5 | 0.25 | 0.5 | 0.5 | 0.5 | 0.5 | 0.25 |
Experimental
General experiment procedures
Optical rotations were measured on an MCP 300 (Anton Paar) polarimeter at 28 °C. Melting points were measured on an X-4 micromelting point apparatus. IR spectrum was recorded on a Nicolet Nexus 670 in KBr discs and UV spectrum was recorded in MeOH solution on a PERSEE TU-1900 spectrophotometer. ECD data were obtained on a Chirascan CD spectrometer (Applied Photophysics). NMR spectra were recorded on a Bruker Avance 400 MHz spectrometer with tetramethylsilane as internal standard. EIMS on a DSQ EI-mass spectrometer (Thermo) and HREIMS data were measured on a MAT9-5XP high-resolution mass spectrometer (Thermo). Sephadex LH-20 and Silica gel (100-200 mesh, 200-300 mesh, Qing dao Marine Chemical Factory, Qingdao, Qingdao, People's Republic of China) were used for column chromatography. Analytical thin layer chromatography (TLC) was performed with GF254 plates (Qingdao Marine Chemical Factory). The reagents in the research process were analytical (Guangzhou chemical reagent factory). Single-crystal data were carried out on an Agilent Gemini Ultra diffractometer (Cu Kα radiation).Fungal material
The fungus was isolated from twigs of the Santalum album, which was collected from Dongguan, Guangdong Province, People's Republic of China, in April 2016. The fungus was obtained using the standard protocol for isolation. Fungal identification was carried out using a molecular biological protocol by DNA amplification and sequencing of the ITS region. The sequence data obtained from the fungal strain which have been deposited at GeneBank with accession no. MH057323. Then A BLAST search result showed that the sequence was the most similar (99%) to the sequence of Fusarium sp. (compared to FJ624268.1 KF918593.1).Fermentation, extraction, and isolation
The fungus was cultured on autoclaved rice solid-substrate medium (100 × 1000 mL Erlenmeyer flasks; each containing 50 g of rice, 50 mL of distilled H2O) at room temperature under static conditions and daylight for 28 days.Following incubation, the mycelia and solid rice medium were extracted with EtOAc. The extract was evaporated under reduced pressure to yield 60 g of residue. The residue was then divided into eight fractions (Fr.1–Fr.8) by column chromatography on silica gel, eluting with a gradient of petroleum ether/EtOAc from 1![[thin space (1/6-em)]](https://www.rsc.org/images/entities/char_2009.gif) :
:![[thin space (1/6-em)]](https://www.rsc.org/images/entities/char_2009.gif) 0 to 0
0 to 0![[thin space (1/6-em)]](https://www.rsc.org/images/entities/char_2009.gif) :
:![[thin space (1/6-em)]](https://www.rsc.org/images/entities/char_2009.gif) 1. Fr.3 (200 mg) was applied to silica gel CC, eluting with petroleum ether/EtOAc (v/v, 7
1. Fr.3 (200 mg) was applied to silica gel CC, eluting with petroleum ether/EtOAc (v/v, 7![[thin space (1/6-em)]](https://www.rsc.org/images/entities/char_2009.gif) :
:![[thin space (1/6-em)]](https://www.rsc.org/images/entities/char_2009.gif) 3), to obtain compound 6 (4.33 mg, 98%). Fr.4 (5.6 g, 99%) was subsequently separated by Sephadex LH-20 CC eluting with CH2Cl2/MeOH (v/v, 1
3), to obtain compound 6 (4.33 mg, 98%). Fr.4 (5.6 g, 99%) was subsequently separated by Sephadex LH-20 CC eluting with CH2Cl2/MeOH (v/v, 1![[thin space (1/6-em)]](https://www.rsc.org/images/entities/char_2009.gif) :
:![[thin space (1/6-em)]](https://www.rsc.org/images/entities/char_2009.gif) 1) to give subfraction Fr.4.1–Fr.4.5. Fr.4.2 was purified on silica gel chromatography (CH2Cl2/MeOH v/v, 98
1) to give subfraction Fr.4.1–Fr.4.5. Fr.4.2 was purified on silica gel chromatography (CH2Cl2/MeOH v/v, 98![[thin space (1/6-em)]](https://www.rsc.org/images/entities/char_2009.gif) :
:![[thin space (1/6-em)]](https://www.rsc.org/images/entities/char_2009.gif) 2), to yield compounds 1 (3.68 g, 99%) and 2 (5.79 mg, 98%). Fr.4.4 (300 mg) was subjected to repeated Sephadex LH-20 CC (CH2Cl2/MeOH v/v, 1
2), to yield compounds 1 (3.68 g, 99%) and 2 (5.79 mg, 98%). Fr.4.4 (300 mg) was subjected to repeated Sephadex LH-20 CC (CH2Cl2/MeOH v/v, 1![[thin space (1/6-em)]](https://www.rsc.org/images/entities/char_2009.gif) :
:![[thin space (1/6-em)]](https://www.rsc.org/images/entities/char_2009.gif) 1) and silica gel (CH2Cl2/MeOH v/v, 98
1) and silica gel (CH2Cl2/MeOH v/v, 98![[thin space (1/6-em)]](https://www.rsc.org/images/entities/char_2009.gif) :
:![[thin space (1/6-em)]](https://www.rsc.org/images/entities/char_2009.gif) 2) to yield compound 3 (3.37 mg, 98%) and compound 4 (3.48 mg, 96%). Fr.5 (208 mg) was also chromatographed on Sephadex LH-20 CC (CH2Cl2/MeOH v/v, 1
2) to yield compound 3 (3.37 mg, 98%) and compound 4 (3.48 mg, 96%). Fr.5 (208 mg) was also chromatographed on Sephadex LH-20 CC (CH2Cl2/MeOH v/v, 1![[thin space (1/6-em)]](https://www.rsc.org/images/entities/char_2009.gif) :
:![[thin space (1/6-em)]](https://www.rsc.org/images/entities/char_2009.gif) 1) to give subfraction Fr.5.2, which was purified using silica gel (CH2Cl2/MeOH v/v, 97
1) to give subfraction Fr.5.2, which was purified using silica gel (CH2Cl2/MeOH v/v, 97![[thin space (1/6-em)]](https://www.rsc.org/images/entities/char_2009.gif) :
:![[thin space (1/6-em)]](https://www.rsc.org/images/entities/char_2009.gif) 3) to afford 5 (3.65 mg, 96%).
3) to afford 5 (3.65 mg, 96%).
![[thin space (1/6-em)]](https://www.rsc.org/images/entities/char_2009.gif) ε) 262 (4.02), 268 (3.81) nm; IR (KBr) νmax 3311, 2917, 2850, 1730, 1639, 1470, 1418, 1393, 1197, 1180, 1103, 1047, 991, 944, 914, 721 cm−1; 1H and 13C NMR, see Table 1; ESIMS m/z 519 [M − H]−; HR-ESIMS m/z 519.2229 [M − H]−, (C27H36O10, calcd for 519.2236).
ε) 262 (4.02), 268 (3.81) nm; IR (KBr) νmax 3311, 2917, 2850, 1730, 1639, 1470, 1418, 1393, 1197, 1180, 1103, 1047, 991, 944, 914, 721 cm−1; 1H and 13C NMR, see Table 1; ESIMS m/z 519 [M − H]−; HR-ESIMS m/z 519.2229 [M − H]−, (C27H36O10, calcd for 519.2236).![[thin space (1/6-em)]](https://www.rsc.org/images/entities/char_2009.gif) ε) 270 (4.06) nm; ECD (MeOH) λmax (Δε) 270 (+7.7), 302 (−16.6) nm; IR (KBr) νmax 3363, 2919, 2850, 1737, 1633, 1471, 1392, 1272, 1132 cm−1; 1H and 13C NMR, see Table 1; ESIMS m/z 461 [M − H]−; HR-ESIMS m/z 461.25488 [M − H]−, (C27H36O10, calcd for 461.25448).
ε) 270 (4.06) nm; ECD (MeOH) λmax (Δε) 270 (+7.7), 302 (−16.6) nm; IR (KBr) νmax 3363, 2919, 2850, 1737, 1633, 1471, 1392, 1272, 1132 cm−1; 1H and 13C NMR, see Table 1; ESIMS m/z 461 [M − H]−; HR-ESIMS m/z 461.25488 [M − H]−, (C27H36O10, calcd for 461.25448).X-ray crystallographic analysis of compound 1
Compound 1 was obtained as colourless crystals from CHCl3 using slow evaporation method. Crystal data were obtained at 150 K for 1 on an Agilent Gemini Ultra diffractometer with Cu Kα radiation (λ = 1.54178 Å). The structure was solved by direct methods with SHELXS-97, and all non-hydrogen atoms were refined anisotropically using the least-squares method. All hydrogen atoms were positioned by geometric calculations and difference Fourier overlapping calculations. Crystallographic data for 1 has been deposited at the Cambridge Crystallographic Data Centre.![[thin space (1/6-em)]](https://www.rsc.org/images/entities/char_2009.gif) 189 [Rint = 0.0320, Rsigma = 0.0357]. The final R1 values were 0.0605, wR2 = 0.1718 (I > 2σ(I)). The goodness of fit on F2 was 1.043. Flack parameter value was 0.031 (13). CCDC number: 1815613.
189 [Rint = 0.0320, Rsigma = 0.0357]. The final R1 values were 0.0605, wR2 = 0.1718 (I > 2σ(I)). The goodness of fit on F2 was 1.043. Flack parameter value was 0.031 (13). CCDC number: 1815613.Calculation of ECD spectra
Molecular Merck force field (MMFF) and DFT/TD-DFT calculations were carried out with Spartan' 14 software (Wavefunction Inc.) and Gaussian 09 program, respectively. Conformers were generated and optimized using DFT calculations at the B3LYP/6-31G(d) level. Conformers with a Boltzmann distribution over 1% were chosen for ECD calculations in MeOH at the B3LYP/6-311tg(2d,p) level. The IEF-PCM solvent model for MeOH was used. ECD spectra were generated using the program SpecDis 3.0 (University of Würzburg) and Origin Pro 8.5 (Origin Lab, Ltd.) from dipole-length rotational strengths by applying Gaussian band shapes with sigma = 0.30 ev. All calculations were performed by High-Performance Grid Computing Platform of Sun Yat-Sen University.Antibacterial activity
Metabolites were tested in vitro for the antimicrobial activity by the conventional broth dilution assay as described previously.19 Eight bacterial strains, Staphylococcus aureus (ATCC 12598), Pseudomonas aeruginosa (ATCC 27853), Escherichia coli (ATCC 25922), Bacillus subtilis (ATCC 6633), Staphylococcus albus (ATCC 8032), Bacillus cereus (ATCC 14579), Micrococcus luteus (ATCC 10240), and Salmonella enteritidis (ATCC 13076) were used.Cell viability assay and anti-inflammatory activity
Cell viability was measured using the conventional MTT assay.20 RAW 264.7 cells were seeded in 96-well plates at a density of 1.5 × 10⁵ cells per mL. After 12 h, the cells were treated with LPS (1 μg mL−1) and samples, followed by additional incubation for 24 h at 37 °C. MTT stock solution (2 mg mL−1) was added to wells for a total reaction volume of 110 μL. After 4 h incubation, the supernatants were aspirated. The formazan crystals in each well were dissolved in 50 μL of DMSO, and the absorbance was measured using a microplate reader (ThermoMax, Sunnyvale, CA, USA) at the wavelength of 490 nm. Relative cell viability was evaluated based on the quantity of MTT converted to the insoluble formazan salt. The optical density of formazan generated in the control cells represented 100% viability. The data were expressed as mean percentages of the viable cells compared to the respective control.After pre-incubation of RAW 264.7 cells (1.5 × 10⁵ cells per mL) with LPS (1 μg mL−1) and samples at 37 °C for 24 h, the quantity of nitrite accumulated in the culture medium was measured as an indicator of NO production.21 Briefly, 50 μL of cell culture medium were mixed with 100 μL Griess reagent, and incubated at room temperature for 10 min, and absorbance was measured at 540 nm in a microplate reader (ThermoMax, Sunnyvale, CA, USA). Fresh culture medium was used as the blank in all determinations.
Conclusions
In summary, six fungal metabolites (1–6), including two new spiromeroterpenoids, fusariumin A (1) and B (2), were isolated from the Santalum album derived endophytic fungus Fusarium sp. YD-2 in rice solid-substrate fermentation. Fusariumin A (1) was an unusual polycyclic spiromeroterpenoid, whose structure possessed a unique and congested heptacyclic skeleton with 6/5/6/5/6/5/5 system. Compound 1 exhibited selective activities against Staphylococcus aureus and Pseudomonas aeruginosa, and compound 3 exhibited moderate activities against Salmonella enteritidis and Micrococcus luteus. The potent anti-inflammatory activity of compound 3, suggested that 3 would be a promising lead compound for the development of inflammatory inhibitor agent.Conflicts of interest
There are no conflicts to declare.Acknowledgements
This work was financially supported from the National Nature Science Foundation of China (No. 81303156), the Science and Technology Development Program of Dongguan (2014108101056) and Program for Outstanding Young Teachers in Higher Education Commission of Guangdong Province of China (No. Yq2013085).Notes and references
- G. A. Burdock and I. G. Carabin, Food Chem. Toxicol., 2008, 46, 421–432 CrossRef CAS PubMed.
- J. A. Duke, CRC Handbook of Medicinal Herbs, Boca Raton, CRC Press. Inc., 1985, pp. 426–427 Search PubMed.
- Chinese Pharmacopoeia Commission, The Pharmacopoeia of Chinese People's Republic, ed. Y. Li, The Chemical Industry Publishing House, Beijing, China, 2015, vol. 1, pp. 380–381 Search PubMed.
- D. Wilson, Oikos, 1995, 73, 274–276 CrossRef.
- H. W. Zhang, Y. C. Song and R. X. Tan, Nat. Prod. Rep., 2006, 23, 753–771 RSC.
- P. Golinska, M. Wypij, G. Agarkar, D. Rathod, H. Dahm and M. Rai, Antonie van Leeuwenhoek, 2015, 108, 267–289 CrossRef PubMed.
- S. Yang, J. Gao, H. Laatsch, J. Tian and G. Pescitelli, Chirality, 2012, 24, 621–627 CrossRef CAS PubMed.
- S. Yang, J. Gao, Q. Zhang and H. Laatsch, Bioorg. Med. Chem. Lett., 2011, 21, 1887–1889 CrossRef CAS PubMed.
- S. Yang, J. Xiao, H. Laatsch, J. Holstein, B. Dittrich, Q. Zhang and J. Gao, Tetrahedron Lett., 2012, 53, 6372–6375 CrossRef CAS.
- A. R. Ola, D. Thomy, D. Lai, H. Brötzoesterhelt and P. Proksch, J. Nat. Prod., 2013, 76, 2094–2099 CrossRef CAS PubMed.
- S. Yang, H. Wang, J. Gao, Q. Zhang, H. Laatsch and Y. Kuang, Org. Biomol. Chem., 2012, 10, 819–824 CAS.
- S. R. Ibrahim, H. M. Abdallah, G. A. Mohamed and S. A. Ross, Fitoterapia, 2016, 112, 161–167 CrossRef CAS PubMed.
- H. D. Flack, Acta Crystallogr., Sect. A: Found. Crystallogr., 1983, 39, 876–881 CrossRef.
- K. Ishikawa, F. Sato, T. Itabashi, H. Wachi, H. Takeda, D. Wakana, T. Yaguchi, K. I. Kawai and T. Hosoe, J. Nat. Prod., 2016, 79, 2167–2174 CrossRef CAS PubMed.
- X. Huang, H. Huang, H. Li, X. Sun, H. Huang, Y. Lu, Y. Lin, Y. Long and Z. She, Org. Lett., 2013, 15, 721–723 CrossRef CAS PubMed.
- A. B Souza, M. G. M. Souza, M. A. Moreira, M. R. Moreira, N. A. J. C. Furtado, C. H. G. Martins, J. K. Bastos, R. A. Santos, V. C. G. Heleno, S. R. Ambrosio and R. C. S. veneziani, Molecules, 2011, 16, 9611–9619 CrossRef PubMed.
- T. Li, M. Yang, X. Wang, Y. Wang and L. Kong, J. Nat. Prod., 2015, 78, 2511–2520 CrossRef CAS PubMed.
- K. Yoshikawa, K. Matsumoto and S. Arihara, J. Nat. Prod., 2016, 62, 543–545 CrossRef PubMed.
- S. Chen, Y. Liu, Z. Liu, R. Cai, Y. Lu, X. Huang and Z. She, RSC Adv., 2016, 6, 26412–26420 RSC.
- J. B. S. Anouhe, A. A. Adima, F. B. Niamké, D. Stien, B. K. Amian, P. A. Blandinières, D. Virieux, J. L. Pirat, S. Kati-Coulibaly and N. Amusant, Phytochem. Lett., 2015, 12, 158–163 CrossRef CAS.
- K. S. Kim, X. Cui, D. S. Lee, W. Ko, J. H. Sohn, J. H. Yim, R. B. An, Y. C. Kim and H. Oh, Int. J. Mol. Sci., 2014, 15, 23749–23765 CrossRef PubMed.
Footnotes |
| † Electronic supplementary information (ESI) available: Spectra of all new compounds (1H NMR, 13C NMR, 2D NMR, and HRESIMS). CCDC 1815613. For ESI and crystallographic data in CIF or other electronic format see DOI: 10.1039/c8ra02430h |
| ‡ These authors contributed equally to this work. |
| This journal is © The Royal Society of Chemistry 2018 |

