 Open Access Article
Ternary composites by an in situ hydrolytic polymerization process†
K. Nagel a,
L. Kaßnera,
A. Seiferta,
R.-E. Grütznerb,
G. Coxb and
S. Spange*a
aPolymer Chemistry, Technische Universität Chemnitz, 09107 Chemnitz, Germany. E-mail: stefan.spange@chemie.tu-chemnitz.de
bBASF SE, 67056 Ludwigshafen am Rhein, Germany
First published on 18th April 2018
Abstract
Polyamide 6/modified silica composite materials have been prepared by a coupled polymerization procedure. For this purpose, the three-component-system we presented in a previous publication, consisting of ε-aminocaproic acid (ε-ACA), ε-caprolactam (ε-CL), and 1,1′,1′′,1′′′-silanetetrayltetrakis-(azepan-2-one) (Si(ε-CL)4), has been combined with other silicon monomers with one or two methyl groups (MeSi(ε-CL)3 and Me2Si(ε-CL)2). The simultaneous polymerization of ε-CL and silicon monomers leads to the in situ formation of silica/polysiloxane particles and the surrounding polyamide 6 matrix in one step. Moreover, 3-aminopropyltriethoxysilane has been added to the three-component-system to achieve covalent bonding between organic and inorganic phases and to inhibit agglomeration of the silica particles. Chemical structures and morphologies of the composites have been investigated by solid-state NMR and FTIR spectroscopy as well as electron microscopy and SEC measurements. Structural effects on thermal properties have been studied by DSC and TGA measurements.
Introduction
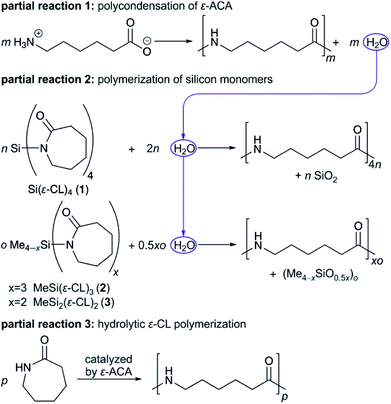
Polyamides are widely used in automotive industry, electronics, and packaging due to their mechanical performance, stiffness and strength, chemical resistance, and good processability. However, especially in load-bearing appliances, such as under-the-hood applications, the low heat deflection temperature, high water absorption, and dimension instability limit the use of polyamides.1 A possibility to overcome some of these drawbacks is the incorporation of inorganic fillers into the polyamide matrix. Especially the use of filler particles with domain size in the nanometer scale (<100 nm) has caused considerable attention in material research for over twenty years owing to the strong improvement of the mechanical strength and thermal resistance even at low filler content.2 Various inorganic fillers such as clay minerals,2–5 carbon materials,6,7 and silica nanoparticles8–12 have been used for this purpose. The strong improvement of rigidity and stability observed in polymer nanocomposites, in comparison with conventional macroscopic composites, is caused by the large interface boundary between both components relative to the volume. Therefore, it is important to achieve a homogeneous distribution of the inorganic filler, which is still a major challenge because of the pronounced agglomeration tendency of nanoparticles.13 One possible solution to retard agglomeration and to increase the interfacial attraction between inorganic particles and polymer matrices is the surface modification of the filler. Especially for silica nanoparticles, there are manifold possibilities to improve particle dispersion in organic polymers by surface modification. One way is the increase of hydrophobicity of the silica particles by alkylation reactions of silanol groups with alkoxy- or chloroalkylsilanes. The surface modification leads to a reduced interfacial energy between nanoparticles and organic polymer.14 But often reproducibility is problematic due to exact setting of reaction parameters like temperature, molar ratios, humidity, or mixing conditions.15–18 Another route is the attachment of functional groups on the silica surface, which can interact with the polymer matrix by electrostatic forces, hydrogen bonds, or covalent bonding. In literature, 3-amino-,19 3-methacryloxy-,20,21 or 3-glycidoxypropyltrialkoxysilanes22 are used to obtain phase-interconnected nanocomposites. Preformed functionalized silica particles are used in most approaches for nanocomposite synthesis. These particles are mixed with monomer or dissolved or molten polymers. In the first case, monomer is polymerized in situ around the filler particles.20,23 Beside the use of preformed functionalized silica particles, the in situ formation of filler by the sol–gel process during polymerization of the organic matrix24,25 or by mixing with polymer are possible routes for the synthesis of nanocomposites. In a previous work we introduced a method for the one-pot synthesis of polyamide 6 (PA6)/silica composite materials by a coupled polymerization reaction of ε-caprolactam (ε-CL), ε-aminocaproic acid (ε-ACA), and 1,1′,1′′,1′′′-silane-tetrayltetrakis-(azepan-2-one) (Si(ε-CL)4, 1).26 The silicon monomer serves as precursor for PA6 as well as SiO2. The water, which is necessary for the hydrolysis of 1 and the formation of the organic and inorganic polymers, is delivered by the condensation of ε-ACA. This amino acid also catalyzes the hydrolytic polymerization of ε-CL. The latter has two different functions during composite synthesis as well. First, it is necessary for the adjustment of the final filler content. Furthermore, it facilitates homogenization of the three reaction components. Therefore, it is necessary to adjust the stoichiometry of all reaction components precisely.In this strategy, the coupling of the polymerization reactions leads to the formation of nanometer sized silica particles embedded in a PA6 matrix.26
In the here presented work, the established three-component-system is extended by an additional, methyl-substituted silicon monomer to a four-component-system (see Scheme 1). The polymerizations of the heterobifunctional silicon monomer 1 as well as 2 and 3, respectively, in combination with the hydrolytic ε-CL polymerization, allows the synthesis of homogeneous PA6/silica/polysiloxane composites in one single step. By simultaneous polymerization of different silicon monomers, inorganic particles with covalently linked polar silica and nonpolar polysiloxane units could be obtained. Furthermore, commercially available 3-aminopropyltriethoxysilane (APTES, 4) has been proven suitably as fourth reaction component. In this case, the primary amino functionality allows a covalent bonding between the organic PA6 phase and the inorganic silica phase.
Experimental
Materials and methods are described in ESI.†Synthesis of monomer 1 is known from the literature.26
Synthesis of monomer 2 and 3
In a typical procedure, ε-CL (20.0 g, 0.177 mol) was dissolved under stirring in dry toluene (300 mL). Triethylamine (20.2 g, 0.200 mol) was added in slight excess in a single portion. This solution was cooled by water bath and either MeSiCl3 (8.82 g, 0.059 mol) or Me2SiCl2 (11.49 g, 0.089 mol), dissolved in 100 mL of dry toluene, was added slowly through a dropping funnel under vigorous stirring. Immediately, a white precipitate from triethylammonium chloride was observed. Subsequently, the solution was stirred at room temperature for 16 h. Triethylammonium chloride was separated by filtration and the solvent was removed under vacuum. 2 was recrystallized in n-hexane to remove residual ε-CL. Compound 3 can be purified by Kugelrohr distillation at 170 °C and 0.5 mbar.Synthesis of composites
Composites were synthesized in a high-pressure lab autoclave of Berghof company. A Teflon beaker was used as insert. Prior to heating to the defined reaction temperature (Table 1), the reactants ε-ACA, ε-CL, 1, and the fourth reaction component 2–4 were filled in the autoclave in the specified molar ratios (Table 1) at room temperature. Then it was purged thrice with argon up to 8 bar with relaxation to atmospheric pressure in between. The reaction took place under an initial argon pressure of 8 bar for at least 210 min, including ca. 60 min heating phase. During reaction, pressure increased to approximately 14 bar. 15 min before the reaction termination, the pressure was released slowly to start the post-condensation phase. After cooling down to ambient temperature, the white to beige-colored monolithic samples were crushed into smaller pieces. To remove residual monomers and oligomers the composites were purified by soxhlet extraction for 48 h with methanol and dried in a vacuum oven at 40 °C to constant mass.| No. | Filler amount | Molar ratios of reactants | Reaction temperature | Amount of extractables | |||
|---|---|---|---|---|---|---|---|
| ε-ACA | Si(ε-CL)4 1 | ε-CL | 4 Reactant (monomer) | ||||
| a 24 h H2O, 24 h EtOH.b 48 h MeOH. | |||||||
| P_0 | 0 | 1.0 | 0 | 4.4 | — | 230 °C | 10 wt%b |
| P_SiO2 | 2.0 wt% SiO2 | 4.0 | 1.0 | 18.0 | — | 230 °C | 11 wt%b |
| P_2_2.2 | 2.2 wt% SiO2/MeSiO1.5 | 19.0 | 4.0 | 83.9 | 1.0 (2) | 230 °C | 13 wt%a |
| P_2_2.5 | 2.5 wt% SiO2/MeSiO1.5 | 11.0 | 2.0 | 42.0 | 1.0 (2) | 230 °C | 7 wt%a |
| P_2_5.1 | 5.1 wt% SiO2/MeSiO1.5 | 19.1 | 4.0 | 11.3 | 1.0 (2) | 230 °C | 4 wt%a |
| P_2_3.3-210 | 3.3 wt% SiO2/MeSiO1.5 | 17.5 | 3.6 | 36.6 | 1.0 (2) | 210 °C | 15 wt%b |
| P_2_3.3-220 | 3.3 wt% SiO2/MeSiO1.5 | 17.5 | 3.6 | 36.6 | 1.0 (2) | 220 °C | 14 wt%b |
| P_2_3.3-230 | 3.3 wt% SiO2/MeSiO1.5 | 17.5 | 3.6 | 36.6 | 1.0 (2) | 230 °C | 12 wt%b |
| P_3_2.1 | 2.1 wt% SiO2/Me2SiO | 3.5 | 0.75 | 18.8 | 0.25 (3) | 230 °C | 24 wt%b |
| P_3_2.4 | 2.4 wt% SiO2/Me2SiO | 2.8 | 0.46 | 20.1 | 0.54 (3) | 230 °C | 18 wt%b |
| P_3_2.7 | 2.7 wt% SiO2/Me2SiO | 2.2 | 0.22 | 21.4 | 0.78 (3) | 230 °C | 26 wt%b |
| P_3_2.9 | 2.9 wt% Me2SiO | 1.7 | 0 | 22.1 | 1 (3) | 230 °C | 28 wt%b |
| P_4_2.0-1 | 2.0 wt% SiO2/APTES | 4.0 | 1.0 | 18.1 | 0.002 (0.2 mol% 4) | 230 °C | 12 wt%b |
| P_4_2.0-2 | 2.0 wt% SiO2/APTES | 4.0 | 1.0 | 18.1 | 0.005 (0.5 mol% 4) | 230 °C | 11 wt%b |
| P_4_2.0-3 | 2.0 wt% SiO2/APTES | 5.0 | 1.0 | 23.0 | 0.25 (20 mol% 4) | 230 °C | 7 wt%b |
| P_4_6.0 | 6.0 wt% SiO2/APTES | 4.0 | 1.0 | 2.0 | 0.25 (20 mol% 4) | 230 °C | 10 wt%b |
For sample nomenclature an explanation should be given: letter P means polymerization product. In reference sample P_0, which was synthesized according to the same polymerization procedure without the addition of silicon monomers, no filler is present. In second reference P_SiO2 only bare silica arises during reaction.
For all other samples, the first number P_X stands for the second silicon monomer used as fourth reaction component. The following number P_X_X stands for the filler content. If existent, the last number P_X_X-X stands for variations for the given filler content, e.g., in reaction temperature or concentration of fourth reaction component. Samples P_3_X contain monomer 1 and 3 in different ratios; the overall amount of silicon monomers is equal to the molar amount of monomer 1 in P_SiO2. Because of the different molecular weights of SiO2- and Me2SiO-units, the filler content rises with increasing amount of 3.
Results and discussion
The four reaction components ε-aminocaproic acid, ε-caprolactam, monomer 1, and one of the monomers 2, 3, or 4 were used for composite material synthesis (see Scheme 1 and Table 1). For these four-component-systems, homogeneity, thermal properties, and molar mass distribution in dependency of filler content, molar ratios of the reactants, and reaction conditions were investigated. The influence of added monomer 4 was studied additionally in perspective to an enhanced interaction between organic and inorganic phases due to covalent bonding. Owing to the different types of interactions between organic and inorganic phase, results for composites with polymethylsiloxane units (monomers 2 and 3) and composites with chemical bonding introduced by monomer 4 are presented separately.Polyamide 6/silica/polymethylsiloxane composites
Through combination of silicon monomers 1 and 2 or 3 during polymerization, a silica/polysiloxane network, containing methyl groups, is formed. Favorably, an assembly of methyl groups at the surface of the silica particles would occur, covering or blocking free silanol groups. Thus, the condensation reaction leading to agglomeration and the formation of silica particles in the μm-scale should be inhibited. The effect of introduced methyl units on materials' homogeneity is shown later with the help of electron microscopic images as well as the analysis of thermal behavior of composite materials.The chemical structure of composite materials was investigated by means of ATR-FTIR spectroscopy as well as solid-state 13C{1H} NMR and 29Si{1H} NMR spectroscopy. FTIR spectra indicate typical bands for PA6 like amide I at 1636 cm−1 and amide II at 1536 cm−1 as well as N–H vibration at 3295 cm−1. Furthermore, the typical Si–O stretching vibration at 1073 cm−1 for SiO2 is observed (see Fig. 1 and S3†). Due to sub-stoichiometric contents of monomer 2 or 3, the polymers contain little polysiloxane and therefore no significant IR bands for methyl groups bonded to silicon atoms are observed in the range of 865–750 cm−1. However, for the weak IR band due to the methyl group's symmetric deformation vibration between 1250 and 1260 cm−1 an increase in intensity compared to P_0 and P_SiO2 could be detected.
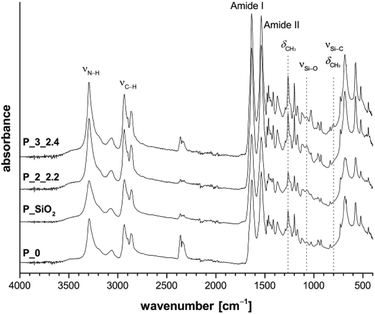 | ||
| Fig. 1 ATR-FTIR spectra of samples P_2_2.2 and P_3_2.4 synthesized with different fourth components in comparison to pure PA6 (P_0) and PA6/SiO2 composite (P_SiO2). | ||
ATR-FTIR spectra give additional information about the crystallization behavior of PA6. The positions of the amide V band at 690 cm−1 and amide VI band at 580 cm−1 indicate crystallization mainly in α-modification.27–29 Variation of reaction temperature between 210 °C and 230 °C seems to have no influence on the chemical structure of the obtained composites, indicated by the non-changing PA6-typical IR bands in Fig. S3.†
Solid-state NMR spectra of selected samples are shown in Fig. 2. All PA6-typical signals can be assigned in these state 13C{1H} CP/MAS NMR spectra. Additionally, position of carbon signals 2–6 between 20–45 ppm indicate crystallization mainly in α-modification, confirming the results from FTIR measurements.30 Methyl groups 7 and 8 are detectable between 0 ppm and −5 ppm. The 29Si{1H} CP/MAS NMR spectrum of P_SiO2 shows Q3 and Q4 signals at −100 ppm and −110 ppm, respectively, resulting from a strongly cross-linked silica network.31 Composites synthesized under addition of methyl derivatives 2 and 3 further show T2 and T3 signals at ca. −64 ppm31,32 and a broad D2 signal at −16 ppm, respectively.33,34
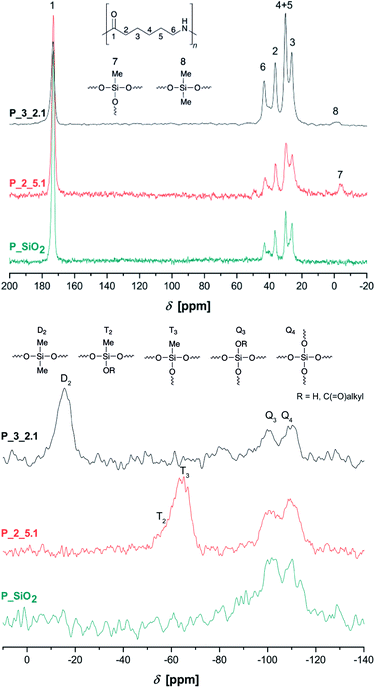 | ||
| Fig. 2 Solid-state 13C{1H} CP/MAS (top) and 29Si{1H} CP/MAS NMR spectra (bottom) of the extracted samples P_SiO2, P_2_5.1, and P3_2.1. | ||
Pure PDMS with its long flexible chains leads to a narrow signal at −22 ppm in 29Si NMR spectroscopy.34 The observed broadening of D2 signal and shift to lower field is caused by the bonding of short chain segments of Me2SiO-units on the silica surface and the resulting change in bond angles and distances.35 To further investigate the formation of polydimethylsiloxane/silica particles, sample P_3_2.7 was extracted with dichloromethane due to the better solubility of PDMS. The extracted composite material still show signals of siloxane units (Fig. S5 in ESI†). Additionally, the sample P_3_2.4 was dissolved in formic acid and the insoluble inorganic phase was separated by centrifugation and washed with deionized water three times. The obtained white powder was dried and studied by FTIR spectroscopy (Fig. S6 in ESI†). Absorption bands at 1262 cm−1 (CH3 deformation), 846 cm−1 and 800 cm−1 (Si–C stretching vibration) next to the band of the asymmetric Si–O–Si stretching vibration at 1000–1100 cm−1 prove the presence of polydimethylsiloxane fragments. Therefore, the formation of polysiloxane/silica particles could be expected.
Organic polymers were investigated by size exclusion chromatography in 1,1,1,3,3,3-hexafluoro-2-propanol as shown on selected examples in Fig. S7–S9† and Table 2. For all samples, a monomodal molecular mass distribution was observed. The results of samples obtained from monomer 2 as fourth reactant (P_2_2.2, P_2_2.5, and P_2_5.1 in comparison to P_0 (Fig. S8†)) show a minor decrease in molar mass with increasing filler content, whereas polydispersity hardly changes at all. Furthermore, average molecular weight as well as polydispersity for samples P_2_3.3_210, P_2_3.3_220, and P_2_3.3_230 decrease with elevated reaction temperature as shown in Table 2. The broadening of the molecular weight distribution may be explained by an increase in viscosity with decreasing temperature as well as formation of crystallites because reaction temperatures are in range of the melting temperature of the resulting PA6. Therefore, trapping of reactive chain ends, diffusion effects, and non-equilibrium conditions can lead to an additional broadening of the molecular weight distribution as has been published for the solid-state polymerization of PA6.28
| Sample | Filler content [wt%] | Filler | Polymer | ||
|---|---|---|---|---|---|
| Mn [g mol−1] | Mw [g mol−1] | PDI Mw/Mn | |||
| P_0 | 0 | — | 17![[thin space (1/6-em)]](https://www.rsc.org/images/entities/char_2009.gif) 500 500 |
48![[thin space (1/6-em)]](https://www.rsc.org/images/entities/char_2009.gif) 000 000 |
2.7 |
| P_SiO2 | 2.0 | SiO2 | 17![[thin space (1/6-em)]](https://www.rsc.org/images/entities/char_2009.gif) 400 400 |
49![[thin space (1/6-em)]](https://www.rsc.org/images/entities/char_2009.gif) 700 700 |
2.8 |
| P_2_2.2 | 2.2 | SiO2/MeSiO1.5 | 17![[thin space (1/6-em)]](https://www.rsc.org/images/entities/char_2009.gif) 100 100 |
45![[thin space (1/6-em)]](https://www.rsc.org/images/entities/char_2009.gif) 700 700 |
2.7 |
| P_2_2.5 | 2.5 | 16![[thin space (1/6-em)]](https://www.rsc.org/images/entities/char_2009.gif) 400 400 |
43![[thin space (1/6-em)]](https://www.rsc.org/images/entities/char_2009.gif) 600 600 |
2.7 | |
| P_2_5.1 | 5.1 | 15![[thin space (1/6-em)]](https://www.rsc.org/images/entities/char_2009.gif) 500 500 |
37![[thin space (1/6-em)]](https://www.rsc.org/images/entities/char_2009.gif) 400 400 |
2.4 | |
| P_2_3.3-210 | 3.3 | 17![[thin space (1/6-em)]](https://www.rsc.org/images/entities/char_2009.gif) 500 500 |
53![[thin space (1/6-em)]](https://www.rsc.org/images/entities/char_2009.gif) 500 500 |
3.1 | |
| P_2_3.3-220 | 3.3 | 17![[thin space (1/6-em)]](https://www.rsc.org/images/entities/char_2009.gif) 000 000 |
47![[thin space (1/6-em)]](https://www.rsc.org/images/entities/char_2009.gif) 500 500 |
2.8 | |
| P_2_3.3-230 | 3.3 | 16![[thin space (1/6-em)]](https://www.rsc.org/images/entities/char_2009.gif) 500 500 |
44![[thin space (1/6-em)]](https://www.rsc.org/images/entities/char_2009.gif) 500 500 |
2.7 | |
| P_3_2.1 | 2.1 | SiO2/Me2SiO | 13![[thin space (1/6-em)]](https://www.rsc.org/images/entities/char_2009.gif) 900 900 |
32![[thin space (1/6-em)]](https://www.rsc.org/images/entities/char_2009.gif) 600 600 |
2.3 |
| P_3_2.4 | 2.4 | 16![[thin space (1/6-em)]](https://www.rsc.org/images/entities/char_2009.gif) 500 500 |
41![[thin space (1/6-em)]](https://www.rsc.org/images/entities/char_2009.gif) 700 700 |
2.5 | |
| P_3_2.7 | 2.7 | 15![[thin space (1/6-em)]](https://www.rsc.org/images/entities/char_2009.gif) 500 500 |
36![[thin space (1/6-em)]](https://www.rsc.org/images/entities/char_2009.gif) 800 800 |
2.4 | |
| P_3_2.9 | 2.9 | Me2SiO | 12![[thin space (1/6-em)]](https://www.rsc.org/images/entities/char_2009.gif) 200 200 |
28![[thin space (1/6-em)]](https://www.rsc.org/images/entities/char_2009.gif) 900 900 |
2.4 |
The decreasing extractable contents of the samples P_2_3.3-210, P_2_3.3-220, and P_2_3.3-230 indicate the faster reaction with rising reaction temperature, since equilibrium conditions are not attained due to the relatively short reaction times.
Samples containing monomer 3 have lower molecular weights than P_0 or P_SiO2 (Fig. S9 in ESI†), whereas molecular weight decreases and amount of extractables rises with increasing amount of monomer 3.
Methanol extracts of samples P_0, P_2_3.3_210, and P_2_3.3_230 were investigated by SEC and 1H NMR spectroscopy (Fig. S10 in ESI†). All extracts show comparable compositions, containing a major proportion of unreacted ε-caprolactam and smaller fractions of dimers, trimers, and higher oligomers as described in literature for related synthetic procedures.36–40
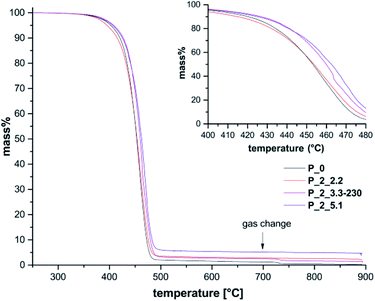
Thermal properties of PA6 composites were investigated by thermogravimetric analysis as well as differential scanning calorimetry (see Table 3, Fig. 3, S11, S12† and Table S1). TGA measurements show an increased temperature stability with higher filler contents.
| Sample | TD (°C) | Residue [wt%] | Filler content [wt%] |
|---|---|---|---|
| a TD – maximum of first derivation; wt% residue referred to mass at 250 °C. | |||
| P_0 | 458.1 | 0.1 | 0 |
| P_SiO2 | 454.7 | 1.8 | 2.0 |
| P_2_2.2 | 458.4 | 2.0 | 2.2 |
| P_2_3.3-210 | 470.9 | 2.7 | 3.3 |
| P_2_3.3-220 | 464.9 | 2.6 | 3.3 |
| P_2_3.3-230 | 463.5 | 1.3 | 3.3 |
| P_2_5.1 | 468.3 | 3.9 | 5.1 |
For sample P_0 without filler a decomposition temperature TD of 458 °C is observed, while P_2_5.1 with 5.1 wt% filler shows an increased TD of 468 °C.
Most likely, the containing SiO2 protects the organic polymer against degradation to a certain degree. The use of 1 as only silicon monomer leads to composites; which show a slight increase in thermal stability at low filler content of 1 wt% but the opposite effect for higher filler contents.26 Hence, addition of 2 has a positive effect on thermal stability at higher silica content. Beside the amount of filler, also reaction temperature has an influence on decomposition behavior. Samples with constant filler content of 3.3 wt% but different reaction temperatures (P_2_3.3) show a decreasing TD with increasing polymerization temperature from 210 °C up to 230 °C. Differences between mass of residue and theoretical filler content can be ascribed to inhomogeneities within the composites.
In contrast to this, but accordingly to ATR-FTIR and solid-state 13C{1H} NMR measurements, both reaction temperature as well as filler content have no significant influence on crystallization behavior as observed in DSC measurements (see ESI, Table S1 and Fig. S11†). The composites show a melting peak at ca. 220 °C with a shoulder at 210 °C during the second heating in a cyclic measurement.
The doublet melting indicates the presence of γ- and α-crystallites, which melt around 212–215 °C and 220–225 °C, respectively.41,42 However, crystal size and perfection as well as fillers can influence the melting temperature. Li et al. observed different melting peaks above 200 °C for isothermal crystallized PA6, which could be assigned to α-crystals of different size and perfection by XRD.43 For this reason, melting peaks of the second heating are just labeled as TIm and TIIm without assignment to crystal modification. The melting peak in the first heating curve could be assigned to the α-modification, verified by 13C solid-state NMR and FTIR spectroscopy.
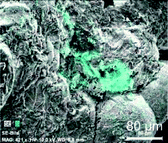
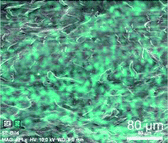
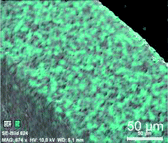
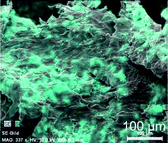
Electron microscopic images show homogeneity of composites (Fig. 4, and S13−S17 in ESI†) synthesized as four-component-system with monomer 2.
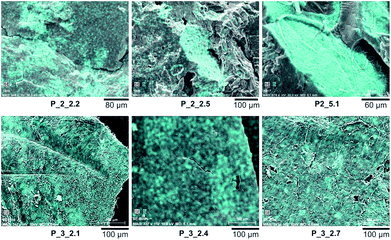 | ||
| Fig. 4 Scanning electron microscopic images of samples P_2_2.2, P_2_2.5, and P_2_5.1 as well as P_3_2.1, P_3_2.4, and P_3_2.7. Distribution of silicon is marked cyan. | ||
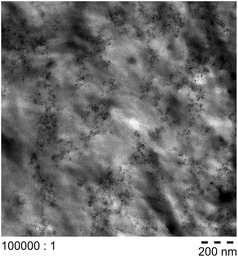
Generally, an increasing tendency for agglomeration can be observed with increasing filler content as well as for increasing polymerization temperature. For sample P_2_2.2 with 2.2 wt% filler the most homogeneous particle distribution could be realized compared to higher filler contents up to 5.1 wt%. For P_2_2.2 relatively loose agglomerates as well as very homogeneous areas were obtained. TEM images validate this observation (Fig. 5). The obtained particles are a few micrometers in size consisting of primary particles of around 5 nm. For filler content of 5.1 wt% agglomerates of several hundred μm were received. For composites P_3 with varying portion of monomer 3 a slightly better homogeneity can be observed, but there are some larger agglomerates with sizes of a few μm (see Fig. 4, and S18–S21 in ESI†). Probably, capping of the surface silanol groups lead to an inhibition of hydrogen bonding between silica particles and PA6 chains. Hence, the methyl groups of monomer 2 and 3 did not result in the purposed improvement of homogeneity compared to systems with the exclusive use of monomer 1.
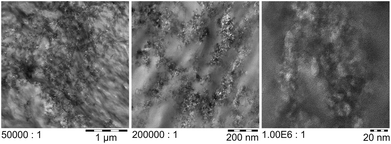 | ||
| Fig. 5 Bright-field TEM images of sample P_2_2.2 in different magnifications (freezing ultra-thin cut). | ||
Covalent linkage between organic and inorganic phase
Beside investigations of four-component mixtures with methyl-substituted monomers 2 or 3 also 3-aminopropyltriethoxysilane 4 was added to the reaction mixture as fourth component with additional functionality. The amino function leads to formation of amide bonds between carbonic acid functionalities of the organic PA6 matrix and the inorganic silica phase due to the high reaction temperature (Scheme 2).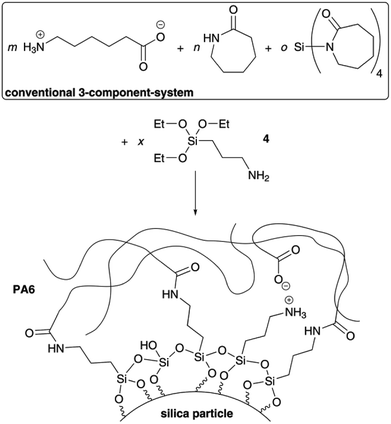 | ||
| Scheme 2 Illustration of synthesis of PA6/silica/polysiloxane composites with covalent bonding between the organic and inorganic phase introduced by 3-aminopropyltriethoxysilane 4. | ||
Additionally, ionic interactions between ammonium and carboxylate units as well as the formation of hydrogen bonds are possible. Two different total filler amounts of 2 wt% and 6 wt% were chosen for investigations.
Furthermore, overall filler content of 2 wt% was examined in detail with regard to different contents of 4 as fourth reaction component. The molar fraction of 0.2 mol% to 20 mol% given in Table 1 is related to the total amount of silicon species used as reagent.
Especially, distribution and size of silica particles were investigated but also thermal properties have been of interest.
Chemical structure of composite materials was investigated by ATR-FTIR spectroscopy (ESI, Fig. S22†). Stretching vibrations of N–H, C–H, and Si–O bonds were observed as well as amide I and II bands. Probably because of the small fraction of 4, no significant differences to P_SiO2 can be detected.
The solid-state 13C{1H} NMR spectrum of P_4_6.0 (ESI, Fig. S23†) shows signals for PA6 which indicate crystallization mainly in α-modification. No signal for the propyl group could be detected due to the low content of 4. The 29Si{1H} NMR spectrum (ESI, Fig. S23†) shows Q4 and Q3 as well as T3 signals, proving the formation of a highly cross-linked silica network with siloxane units.
Extraction experiments with 2,2,2-trifluoroethanol (TFE) are an useful tool for the investigation of interactions between organic and inorganic phase because PA6 covalently bonded to silica is not soluble in TFE. As a result, the amount of residue was significantly higher than the theoretical calculated filler content (Tables 1 and 4). Moreover, signals of PA6 could be detected beside typical bands for silica and polysiloxane units in the FTIR spectra of the residues. Unfortunately, it was impossible to investigate composite P_4_2.0-3 by this method. Despite several trials, either clogging of the extraction tube or nearly complete extraction was observed. In the latter case, about 1 wt% residue could be detected by TGA measurements at 900 °C in air atmosphere, indicating extraction of silica.
| Sample | Total filler content | TD in °C | Residue TGA | Residue TFE-extraction (48 h) |
|---|---|---|---|---|
| a TD – maximum of first derivation; wt% residue referred to mass at 250 °C. | ||||
| P_SiO2 | 2 wt% | 454.7 | 1.8 wt% | n. a. |
| P_4_2.0-1 | 2 wt% | 457.2 | 4.1 wt% | 5.4 wt% |
| P_4_2.0-2 | 2 wt% | 461.7 | 0.6 wt% | 7.9 wt% |
| P_4_2.0-3 | 2 wt% | 479.8 | 1.9 wt% | n. a. |
| 480.7 | 3.3 wt% | |||
| 486.7 | 2.2 wt% | |||
| P_4_6.0 | 6 wt% | 460.6 | 9.4 wt% (black) | 63.7 wt% |
Thermal properties of composites were investigated by differential scanning calorimetry (Fig. 6 and Table S1† in ESI), and thermogravimetric analysis (Table 4 and Fig. S24†).
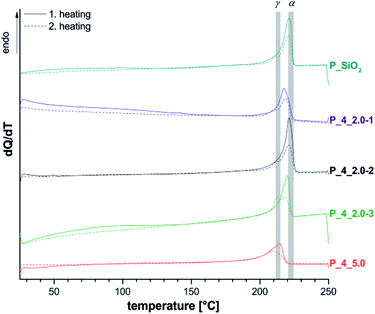 | ||
| Fig. 6 Cyclic DSC measurements of extracted materials P_4 with different filler content (see Table 4) as well as different portions of 4 compared to P_SiO2. Range of literature values for melting points of α- and γ-crystallites are marked gray.41,42 | ||
DSC measurements of P_4_2.0 show, corresponding to three-component-systems with 2 wt% SiO2 (P_SiO2), a signal maximum at 220 °C (TIIm), which indicates the formation of α-crystallites in accordance with 13C{1H} NMR results. An observed shoulder at 210 °C (TIm) may be interpreted as melting of γ-crystalline regions, with the uncertainty discussed above. For sample P_4_6.0 a shift to lower temperatures as well as a broadening of the melting peak could be observed. This behavior is discussed as result of a decrease in lamellar thickness of the polymer crystals.44 The effect is clearly stronger than for P_2_5.1 with similar filler content, and just non-covalent interactions between organic and inorganic matrix. This difference could originate from a finer dispersion of the silica particles, which was observed by electron microscopy. Another possible reason is the formation of branching points due to the covalent linkage between inorganic filler particles and the polymer inhibiting the crystallization. Lower degrees of crystallization have been observed for all samples P_4 in comparison to P_2 as well as reference experiments P_0, and P_SiO2.
Beside crystallization behavior, the filler further influences decomposition behavior of the organic phase (Table 4 and Fig. S24†). TGA measurements show that covalent bonding of PA6 on silica slightly increases decomposition temperature of composites P_4 compared to samples without covalent bonding (P_SiO2). The strongest effects can be observed for sample P_4_2.0-3 with the highest amount of 4 (20 mol%) regarding the total amount of silicon-containing monomers.
Three independently prepared samples of P_4_2.0-3 have been investigated concerning their decomposition behavior to study reproducibility. All samples show an increase of TD of at least 25 K compared to P_SiO2 without modification of silica particles. An increase of the filler content to 6 wt% leads to a decreased TD. This is probably the result of distinct agglomeration with higher silica content. The variable amount of residue of TGA measurements hint at partly inhomogeneous distribution of filler in the organic matrix. It should be mentioned, that residue of sample P_4_6.0 after TGA measurement was black. This indicates protection of organic residues against burning due to encapsulation in the silica network.
Table 5 and Fig. S25–S28 in ESI† show scanning electron microscopic images of the samples P_4. Noticeable is the tendency for agglomeration in case of the highest filler content of 6 wt% (P_4_6.0), which is comparable to samples with 5 wt% SiO2 in the three-component-system and the four-component-systems of monomers 2 and 3 (e.g., P_2_5.1). Furthermore, proportion of 4 seems to have an influence on particle distribution for 2 wt% total filler content (P_4_2.0). Although, large agglomerates of several tens of micrometers could be obtained for 0.2 mol% 4 (P_4_2.0-1), a homogeneous dispersion could be observed by SEM measurements for samples with 0.5 mol% 4 (P_4_2.0-2). Sample P_4_2.0-3 with the highest ratio of 4 shows a good homogeneity over large areas, but also a few larger particles could be detected. Though these agglomerates may originate from sample preparation or hydrolysis of monomer 1.
In energy filtered transmission electron microscopic images (EFTEM, Fig. 7) for high magnifications agglomerates of several hundred nanometers were observed, which shows a homogeneous distribution over the whole sample. Concluding, the addition of at least 0.5 mol% 4 improved homogeneity compared to the use of monomers 2 or 3.
Conclusion
A coupled polymerization reaction of four different reactants, namely ε-aminocaproic acid, ε-caprolactam as well as the silicon-containing monomers 1 (Si(ε-CL)4), and 2 (MeSi(ε-CL)3) or 3 (Me2Si(ε-CL)2) was carried out for synthesis of polyamide 6 composite materials with embedded methyl-functionalized silica. Composites showed a distinct dependency of homogeneity on filler content. It was found that agglomeration tendency increased with rising filler content independent of the used silicon monomer 1, 2 or 3. Melting points were not influenced by filler content or fourth reactant in contrast to decomposition behavior. Thermal stability could be improved with increasing filler content.An additional four-component-system, namely a mixture of ε-ACA, ε-CL, 1, and 3-aminopropyltriethoxysilane 4 was examined. The latter facilitates a covalent bonding of PA6 on silica surface. The covalently bonded filler influenced crystallization as well as decomposition behavior of PA6 due to strong interactions between silica surface and PA6 chains. Higher amounts of 4 led to an improvement in homogeneity and thermal stability. Agglomeration tendency of silica particles increased with higher filler content comparable to other three- or four-component systems with the same filler content.
Conflicts of interest
There are no conflicts to declare.Acknowledgements
We thank Fonds der Chemischen Industrie and Deutsche Forschungsgemeinschaft (DFG Sp 392/39-1) for financial support. We acknowledge BASF SE for financial support as well as composite characterization by SEC and TEM. Furthermore, we thank Prof. Hietschold and T. Jagemann (TU Chemnitz) for the opportunity of measuring SEM images. We acknowledge T. Windberg and R. John for their practical work as well as S. Schmidt for proof-reading.References
- J. Njuguna, Z. Mouti and K. Westwood, Toughening Mechanisms in Composite Materials, Woodhead Publishing, Cambridge, 2015 Search PubMed.
- A. Usuki, Y. Kojima, M. Kawasumi, A. Okada, Y. Fukushima, T. Kurauchi and O. Kamigaito, J. Mater. Res., 1993, 8, 1179–1184 CrossRef CAS.
- Y. Kojima, A. Usuki, M. Kawasumi, A. Okada, Y. Fukushima, T. Kurauchi and O. Kamigaito, J. Mater. Res., 1993, 8, 1185–1189 CrossRef CAS.
- Y. Kojima, A. Usuki, M. Kawasumi, A. Okada, T. Kurauchi and O. Kamigaito, J. Polym. Sci., Part A: Polym. Chem., 1993, 31, 983–986 CrossRef CAS.
- A. I. Alateyah, H. N. Dhakal and Z. Y. Zhang, Adv. Polym. Technol., 2013, 32, 21368 CrossRef.
- W. D. Zhang, L. Shen, I. Y. Phang and T. Liu, Macromolecules, 2004, 37, 256–259 CrossRef CAS.
- X. Fu, C. Yao and G. Yang, RSC Adv., 2015, 5, 61688–61702 RSC.
- F. Z. Rafique and N. Vasanthan, J. Phys. Chem. B, 2014, 118, 9486–9495 CrossRef CAS PubMed.
- I. A. Rahman and V. Padavettan, J. Nanomater., 2012, 2012, 1–15 CrossRef.
- H. Mahfuz, M. Hasan, V. Dhanak, G. Beamson, J. Stewart, V. Rangari, X. Wei, V. Khabashesku and S. Jeelani, Nanotechnology, 2008, 19, 445702 CrossRef PubMed.
- M. M. Hasan, Y. Zhou, H. Mahfuz and S. Jeelani, Mater. Sci. Eng., A, 2006, 429, 181–188 CrossRef.
- Q. Xu, X. Li, F. Chen and Z. Zhang, J. Braz. Chem. Soc., 2014, 118, 9486–9495 Search PubMed.
- W. E. van Zyl, M. García, B. A. G. Schrauwen, B. J. Kooi, J. T. M. De Hosson and H. Verweij, Macromol. Mater. Eng., 2002, 287, 106–110 CrossRef CAS.
- M. Q. Zhang, M. Z. Rong and W. H. Ruan, in Nano- and Micromechanics of Polymer Blends and Composites, ed. J. Karger-Kocsis and S. Fakirov, Hanser Publishers, Munich, 2009, pp. 91–140 Search PubMed.
- A. V. Rao, M. M. Kulkarni, D. P. Amalnerkar and T. Seth, Appl. Surf. Sci., 2003, 206, 262–270 CrossRef CAS.
- P. Van Der Voort and E. F. Vansant, J. Liq. Chromatogr. Relat. Technol., 1996, 19, 2723–2752 CrossRef CAS.
- I. V. Soares, E. G. Vieira, N. L. Dias Filho, N. C. da Silva, A. d. C. Bastos, L. J. A. Lima, L. F. Fraceto and A. H. Rosa, J. Sep. Sci., 2013, 36, 817–825 CrossRef CAS PubMed.
- D. L. Sonin, D. V. Korolev, V. N. Postnov, E. B. Naumysheva, E. I. Pochkaeva, M. L. Vasyutina and M. M. Galagudza, Drug Delivery, 2015, 1–10 Search PubMed.
- G. Rusu and E. Rusu, High Perform. Polym., 2006, 18, 355–375 CrossRef CAS.
- Y. Li, J. Yu and Z.-X. Guo, J. Appl. Polym. Sci., 2002, 84, 827–834 CrossRef CAS.
- H. B. Sunkara, J. M. Jethmalani and W. T. Ford, Chem. Mater., 1994, 6, 362–364 CrossRef CAS.
- J. Liu, H. Yi, H. Lin, T. Wei and B. Zheng, Polym. Compos., 2014, 35, 435–440 CrossRef CAS.
- L. F. Giraldo, M. Echeverri and B. L. López, Macromol. Symp., 2007, 258, 119–128 CrossRef CAS.
- C. Zhao, P. Zhang and S. Lu, J. Mater. Sci., 2007, 42, 9083–9091 CrossRef CAS.
- Z. s. Kalkan-Sevinc and L. a. Goettler, Polym. Eng. Sci., 2012, 52, 2410–2416 CAS.
- L. Kaßner, K. Nagel, R.-E. Grützner, M. Korb, T. Rüffer, H. Lang and S. Spange, Polym. Chem., 2015, 6, 6297–6304 RSC.
- A. Miyake, J. Polym. Sci., 1960, 44, 223–232 CrossRef CAS.
- M. I. Kohan, Nylon plastics handbook, Hanser Publishers, Munich, 1995 Search PubMed.
- I. Matsubara and J. H. Magill, Polymer, 1966, 7, 199–215 CrossRef CAS.
- G. R. Hatfield, J. H. Glans and W. B. Hammond, Macromolecules, 1990, 23, 1654–1658 CrossRef CAS.
- R. Joseph, S. Zhang and W. T. Ford, Macromolecules, 1996, 29, 1305–1312 CrossRef CAS.
- D. W. Sindorf and G. E. Maciel, J. Am. Chem. Soc., 1981, 103, 4263–4265 CrossRef CAS.
- G. Engelhardt, H. Jancke, M. Mägi, T. Pehk and E. Lippmaa, J. Organomet. Chem., 1971, 28, 293–300 CrossRef CAS.
- F. Uhlig and H. C. Marsmann, in Gelest Catalog 3000-A, Gelest Inc., Morrisville, PA, 2004, pp. 195–209 Search PubMed.
- V. M. Litvinov, H. Barthel and J. Weis, Macromolecules, 2002, 35, 4356–4364 CrossRef CAS.
- H. K. Reimschuessel, J. Polym. Sci., Part D: Macromol. Rev., 1977, 12, 65–139 CrossRef CAS.
- M. Rothe, J. Polym. Sci., 1958, 30, 227–238 CrossRef CAS.
- P. Schlack, K. Kunz and R. Pummerer, Chemische Textilfasern, Filme und Folien, Enke Verlag, Stuttgart, 1953 Search PubMed.
- P. H. Hermans, Recl. Trav. Chim. Pays-Bas, 1953, 72, 798–812 CrossRef.
- I. Rothe and M. Rothe, Chem. Ber., 1955, 88, 284–289 CrossRef CAS.
- Y. P. Khanna, Macromolecules, 1992, 25, 3298–3300 CrossRef CAS.
- F. J. Medellín-Rodríguez, L. Larios-López, A. Zapata-Espinoza, O. Dávalos-Montoya, P. J. Phillips and J. S. Lin, Macromolecules, 2004, 37, 1799–1809 CrossRef.
- J. Li, Z. Fang, Y. Zhu, L. Tong, A. Gu and F. Liu, J. Appl. Polym. Sci., 2007, 105, 3531–3542 CrossRef CAS.
- M. García, G. van Vliet, M. G. J. ten Cate, F. Chávez, B. Norder, B. Kooi, W. E. van Zyl, H. Verweij and D. H. A. Blank, Polym. Adv. Technol., 2004, 15, 164–172 CrossRef.
Footnote |
| † Electronic supplementary information (ESI) available. See DOI: 10.1039/c8ra02402b |
| This journal is © The Royal Society of Chemistry 2018 |

