
 Open Access Article
 This Open Access Article is licensed under a Creative Commons Attribution-Non Commercial 3.0 Unported Licence
Magnetically targeted co-delivery of hydrophilic and hydrophobic drugs with hollow mesoporous ferrite nanoparticles†
Chao Xu,
Suchun Yu,
Langlang Liu,
Xiaopei Wu and
Honglian Dai *
*
State Key Laboratory of Advanced Technology for Materials Synthesis and Processing, Wuhan University of Technology, Wuhan 430070, P. R. China. E-mail: daihonglian@whut.edu.cn; Tel: +86-13697333860
First published on 23rd April 2018
Abstract
A magnetically targeted drug delivery system (DDS) is developed to solve the delivery problem of hydrophobic drugs by using hollow mesoporous ferrite nanoparticles (HMFNs). The HMFNs are synthesized by a one-pot hydrothermal method based on the Ostwald ripening process. The biocompatibility of the synthesized HMFNs was determined by MTT assay, lactate dehydrogenase (LDH) leakage assay and hemolyticity against rabbit red blood cells. Moreover, Prussian blue staining and bio-TEM observations showed that the cell uptake of nanocarriers was in a dose and time-dependent manner, and the nanoparticles accumulate mostly in the cytoplasm. A typical highly hydrophobic anti-tuberculosis drug, rifampin (RFP) was loaded into HMFNs using supercritical carbon dioxide (SC-CO2) impregnation, and the drug loading amount reached as high as 18.25 wt%. In addition, HMFNs could co-encapsulate and co-deliver hydrophobic (RFP) and hydrophilic (isoniazide, INH) drugs simultaneously. The in vitro release tests demonstrated extra sustained co-release profiles of rifampicin and isoniazide from HMFNs. Based on this novel design strategy, the co-delivery of drugs in the same carrier enables a drug delivery system with efficient enhanced chemotherapeutic effect.
1. Introduction
Existing chemotherapeutic drugs are far from perfect with undesirable severe side effects, low bioavailability or development of drug resistance. Moreover, many active antidisease substances possess a hydrophobic nature.1 Hydrophobicity makes them difficult to develop as pharmaceutical products because low water solubility will strongly prevent their delivery by the intravenous route.2 Overcoming these limitations requires effective delivery of drugs to a diseased region. In order to improve therapeutic efficacy and reduce toxicity, various drug delivery systems have been developed. Over the past few decades, copolymer micelles, polymeric nanoparticles and liposomes have been used, many of which have been engineered for improved drug stability and in vivo circulation time.3–6 However, these organic drug delivery systems show low drug encapsulation efficiency and thermal instability, which have impeded their clinical application.7 Alternatively, inorganic drug delivery systems have attracted attention in biomedicine due to their excellent biocompatibility and stability.8In recent years, mesoporous silica nanoparticles (MSNs) have attracted more attention for their biomedical applications. With their mesoporous structure and high surface area, MSNs as drug delivery systems show significant advantages.9,10 However, MSNs have no magnetic responsiveness, hard to achieve magnetically targeted delivery drugs. Over the past few decades, magnetic nanoparticles, especially iron oxides, have been extensively studied due to their stability under physiological conditions, unique magnetic reactivity and biocompatibility.11–13 These specific features endow them with great potential in nanomedicine as targeted delivery vehicles for drug delivery.14–16 Therefore, integration of magnetic nanomaterials and hollow structures to form magnetic hollow mesoporous ferrite nanoparticles, which possess large cavity, strong magnetic responsiveness and enhanced drug loading capacity, is undoubtedly of significance as versatile carriers for diagnostic and therapeutic applications. In addition, traditional nanocarriers are effective at physical encapsulation and subsequent release of hydrophobic therapeutics, but the simultaneously delivery of hydrophilic and hydrophobic drugs is still challenging to achieve without chemical drug conjugations.17 Therefore, it is important to develop a drug delivery system that simultaneously encapsulate different drugs to facilitate combination therapy, particularly the co-delivery of hydrophobic and hydrophilic therapeutics.
Herein, we would like to report hollow mesoporous ferrite nanoparticles (HMFNs) to targeted co-delivery of hydrophilic and hydrophobic drugs. As shown in Fig. 1, the HMFNs exhibit unique structural characteristics, such as large hollow interiors and mesoporous shells. The large hollow interior act as reservoirs for hydrophobic drugs and the hydrophilic mesoporous shell adsorbed hydrophilic drugs and guarantees the water dispersivity of the nanocarriers. Furthermore, the HMFNs nanocarriers can be manipulated by an external magnet owing to their magnetic responsiveness.18
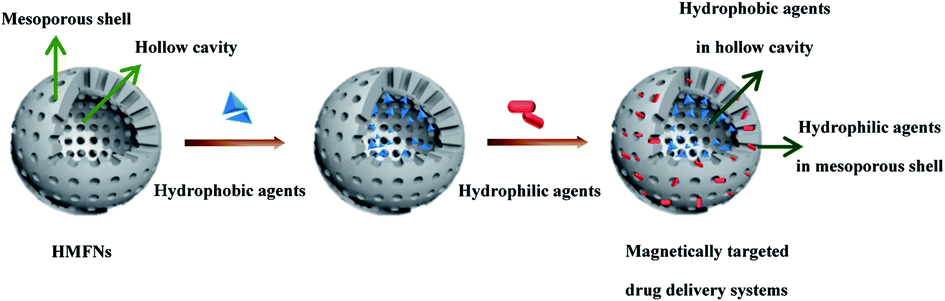 | ||
| Fig. 1 Schematic illustration of the formation procedure of magnetically targeted drug delivery systems co-loading/co-delivery of hydrophobic and hydrophilic agents. | ||
However, how to fill the hydrophobic drugs into the deeper pore canals of the HMFNs and improve the drugs loading capacity would be the key problems for a better application of the HMFNs in sustained-release drug delivery system. In recent years, the SC-CO2 technique has also been widely used in the production of drug delivery systems.19–21 High diffusibility and high dissolving capacity were two main features of the SC-CO2.22,23 We proposed a hypothesis that using of these features of the SC-CO2 technique for the hydrophobic drug loading, and then improve the loading capacity and prolong the releasing time of hydrophobic drugs.
In this study, first we synthesized hollow mesoporous ferrite nanoparticles (HMFNs) by one-pot hydrothermal method based on Ostwald ripening process, and MTT assay, lactate dehydrogenase (LDH) leakage assay, and hemolysis assay were used to demonstrate HMFNs exhibit excellent biocompatibility. Furthermore, a typical highly hydrophobic drug-rifampin (RFP) was loaded into HMFNs using SC-CO2. Last but not least, the HMFNs successful co-encapsulation hydrophobic drug (rifampin, RFP) and hydrophilic drug (isoniazide, INH) in HMNCs.
2. Materials and methods
2.1. Materials
Ferric chloride hexahydrate (FeCl3·6H2O), sodium citrate, polyacrylamide (PAM, Mn = 3![[thin space (1/6-em)]](https://www.rsc.org/images/entities/char_2009.gif) 000000), urea and polyethylene glycol-2000 (PEG-2000) were all purchased from Sinopharm Chemical Reagent Co., Ltd (China). Rifampicin was obtained from Sigma-Aldrich (St. Louis, MO, USA). Isonicotinic were purchased from Aladdin Industrial Corporation (Shanghai, China). 3-(4,5-dimethylthiazol-2-yl)-2,5-diphenyl tetrazolium bromide (MTT) were purchased from Sigma-Aldrich. The aforementioned chemicals without denotation were of analytical grade and used as received without further purification. RPMI-1640 medium, fetal bovine serum (FBS), penicillin and streptomycin were purchased from Hyclone. Carbon dioxide was purchased from Xiangyun Industry Co., Ltd (China). The deionized water was prepared by UPT ultrapure water polishing system.
000000), urea and polyethylene glycol-2000 (PEG-2000) were all purchased from Sinopharm Chemical Reagent Co., Ltd (China). Rifampicin was obtained from Sigma-Aldrich (St. Louis, MO, USA). Isonicotinic were purchased from Aladdin Industrial Corporation (Shanghai, China). 3-(4,5-dimethylthiazol-2-yl)-2,5-diphenyl tetrazolium bromide (MTT) were purchased from Sigma-Aldrich. The aforementioned chemicals without denotation were of analytical grade and used as received without further purification. RPMI-1640 medium, fetal bovine serum (FBS), penicillin and streptomycin were purchased from Hyclone. Carbon dioxide was purchased from Xiangyun Industry Co., Ltd (China). The deionized water was prepared by UPT ultrapure water polishing system.
2.2. Cell culture
Murine fibroblast L929 cells was purchased from China Center for Type Culture Collection (CCTCC, Wuhan, China), Cells were cultured in a RPMI-1640 medium (Hyclone, USA) supplemented with 10% fetal bovine serum (FBS, Hyclone, USA), 100 IU ml−1 penicillin, and 100 mg ml−1 streptomycin in an incubator (Heal Force, China) with 5% CO2 at 37 °C and saturated humidity. Once the cells reached 80% confluency, the L929 cells were digested by 0.25% trypsin (Hyclone, USA) and were resuspended in fresh complete medium before plating.2.3. Synthesis and characterization of HMFNs
HMFNs were prepared through a modified hydrothermal reaction according to previous report.24 In a typical synthesis procedure, 2 mmol FeCl3·6H2O, 6 mmol urea and 4 mmol sodium citrate were dissolved in 40 ml deionized water. Then 0.2 g PEG-2000 and 0.3 g PAM were added under continuous stirring until they were dissolved totally and transferred into an autoclave (100 ml capacity). The autoclave was heated to 200 °C and maintained for 12 h, and collect the product after it was cooling. The black product washed with deionized water and ethanol and then dried under vacuum overnight.X-ray powder diffraction (XRD) on a D8 Advance diffractometer using Cu Kα radiation (λ = 1.5418 Å) at a scanning rate of 4° min−1. The microstructures of the resultant products observed using transmission electron microscopy (TEM, HITACHI H-7000FA, Japan) and fieldemission scanning electron microscopy (FESEM, S-4800, Hitachi Corp, Japan). Fourier transform infrared (FT-IR) spectra were measured on a Nicolet6700 (Nicolet, USA) spectrometer by using a KBr pellet method. Magnetic investigation was carried out at 300 K on a vibrating sample magnetometer (ppms-9T, Quantum Design, USA). The thermogravimetric analysis (TG) was conducted by STA449F3 with a heating rate of 10 °C min−1 in N2. The Brunauer–Emmett–Teller (BET) specific surface areas and pore size distributions of the resultant products were measured with a Micromeritics ASAP 2020 M instrument.
2.4. Assessment of the biocompatibility of HMFNs
2.5. Cellular uptake experiment
The cellular uptake of the HMFNs were evaluated in L929 cells by Prussian blue staining. The cells were seeded in a 24-well plate in RPMI-1640 medium containing 10% FBS. After an incubation for 24 h, the culture medium was replaced with RPMI-1640 medium containing HMFNs with the concentration of 0, 50, 100 μg ml−1 and co-incubation for different time intervals (12 and 24 h). At the end of incubation, cells were washed with PBS 3 times, and Prussian blue staining analysis was performed. In Prussian blue staining, cells were fixed for 30 min by using 4% paraformaldehyde. After washing with PBS, the cells were incubated with Perls' reagent (4% potassium ferrocyanide and 6% HCl) for 30 min, and followed by a neutral red counterstain. The cells were observed using a light microscopy.27,28In addition, Bio-TEM analysis was conducted on ultrathin sections of L929 cells to illustrate the possible uptake mechanism and intracellular location of HMFNs. The L929 cells were incubated with 100 μg ml−1 HMFNs in RPMI-1640 medium in 5% CO2 at 37 °C for 24 and 48 h. Then, the cells were washed twice with PBS (pH = 7.4) and detached by incubation with 0.25% trypsin. The cell suspension was centrifuged at 1000 rpm for 5 min. After removing RPMI-1640, the cells were fixed by glutaraldehyde at room temperature. The samples were rinsed with PBS and dehydrated through a graded ethanol series. The samples were then embedded in EPOM812 and polymerized in the oven at 37 °C for 12 h, 45 °C for 12 h and 60 °C for 48 h.29 Ultrathin sections of approximately 70 nm thick were cut with a diamond knife on a Leica EM UC7 ultramicrotome and transferred to the copper grid. The images were viewed on HT7700 electron microscopy.
2.6. RFP encapsulation in HMFNs
In all experiments of the drug loading by SC-CO2 technique, the supercritical impregnation set-up used in the study is schematically represented in Fig. S1.† A 34 factorial experiment was designed to determine the optimum SC-CO2 pressure (10, 15, 20 MPa), vessel temperature (30, 40, 50 °C), the amount of RFP (20, 30, 40 ml) and duration (2, 3, 4 h) for loading of HMFNs with RFP. For each run, a constant amount of the HMFNs was 0.5 g. At the end of the loading period, the reactor was depressurized and the HMFNs powders loaded with RFP were retrieved. The obtained samples (RFP-HMFNs) were washed with 5 ml acetone to remove RFP that adsorbed on the surface of the HMFNs and dried for 12 h at room temperature.2.7. Characterization of drug-loaded HMFNs (RFP-HMFNs)
The drug loading capacities of the samples were determined by thermogravimetric analysis (TGA). In detail, Samples of the range 2–10 mg were loaded on tared platinum pans and heated from ambient temperature to 1000 °C, at a heating rate of 10 °C min−1 under an inert nitrogen atmosphere. All samples were analysed in triplicate. Drug-loading amount was calculated using the following formula. Drug-loading amount (%) = (weight loss of RFP-HMFNs − weight loss of HMFNs)/amount of HMFNs × 100%2.8. INH and RFP co-encapsulation in HMFNs
RFP-HMFNs (10 mg) were dispersed into INH PBS solutions (10 ml: 50 mg ml−1) by ultrasonic treatment. The mixture was mechanically stirred for 24 h at room temperature. The solvents were then evaporated to allow penetration of INH through mesoporous shell channels and entrapped in the mesoporous channels or adsorbed on the external surfaces of HMFNs. The INH-loaded HMFNs isolated by an external magnet and dried under vacuum at room temperature.2.9. Characterization of drug-loaded HMFNs (INH-RFP-HMFNs)
Fourier transform infrared (FT-IR) spectroscopy was used to determine chemical bonding between the RFP/INH and HMFNs in the processed RFP-HMFNs/INH-RFP-HMFNs samples. The drug loading capacities of the samples were determined by thermogravimetric analysis (TGA). Magnetic characterization was carried out with a vibrating sample magnetometer at 300 K.2.10. In vitro release studies
100 mg INH-RFP-HMFNs were transferred to a dialysis tube and immersed in 20 ml of PBS (pH = 7.4) buffer solution in a water bath at 37 °C with gentle shaking. At different time points, 2 ml of the release medium was extracted and replaced with fresh buffer solution. The concentrations were determined by UV-vis spectrophotometer by measuring the maximum absorbance at the wavelengths of 260 nm for INH and 340 nm for RFP, respectively. The calibration curves were obtained using solutions of INH and RFP respectively.2.11. Statistical analysis
Statistical analyses were performed using the one-way analysis of variance (ANOVA), and statistical values are presented as mean ± standard deviation. Throughout, p < 0.05 was considered significant.3. Results and discussion
3.1. Synthesis and characterization of HMFNs
The morphology of the resulting product was investigated by SEM and TEM. Fig. 2a showed the typical SEM image of the as-prepared HMFNs, which indicated that the products contain very uniform spheres. The corresponding histograms with the particle size distribution of the as-prepared HMFNs are presented in Fig. 2b. As clearly seen, the nearly monodispersed HMFNs with a diameter ranging from 100 to 400 nm, average diameter is about 290 nm. It should be noted that the spheres with narrow size distribution are well dispersed. Under higher magnification (Fig. 2c), the HMFNs are composed of small irregular particles, and some broken hollow spheres can also be observed. The hollow structure is further investigated by TEM image shown in Fig. 2d, the intensive contrast between the black margin and the bright center of the sphere confirms the existence of hollow structure, consistent with the SEM observation. X-ray diffraction (XRD) (Fig. 3a) gives further support to the phase structure of the HMFNs. The positions and relative intensities of all diffraction peaks matched well with the JCPDS card (JCPDS 79-0419) for magnetite. No evidence of impurities can be found in the XRD pattern. The sharp, strong peaks confirmed the products were well crystallized.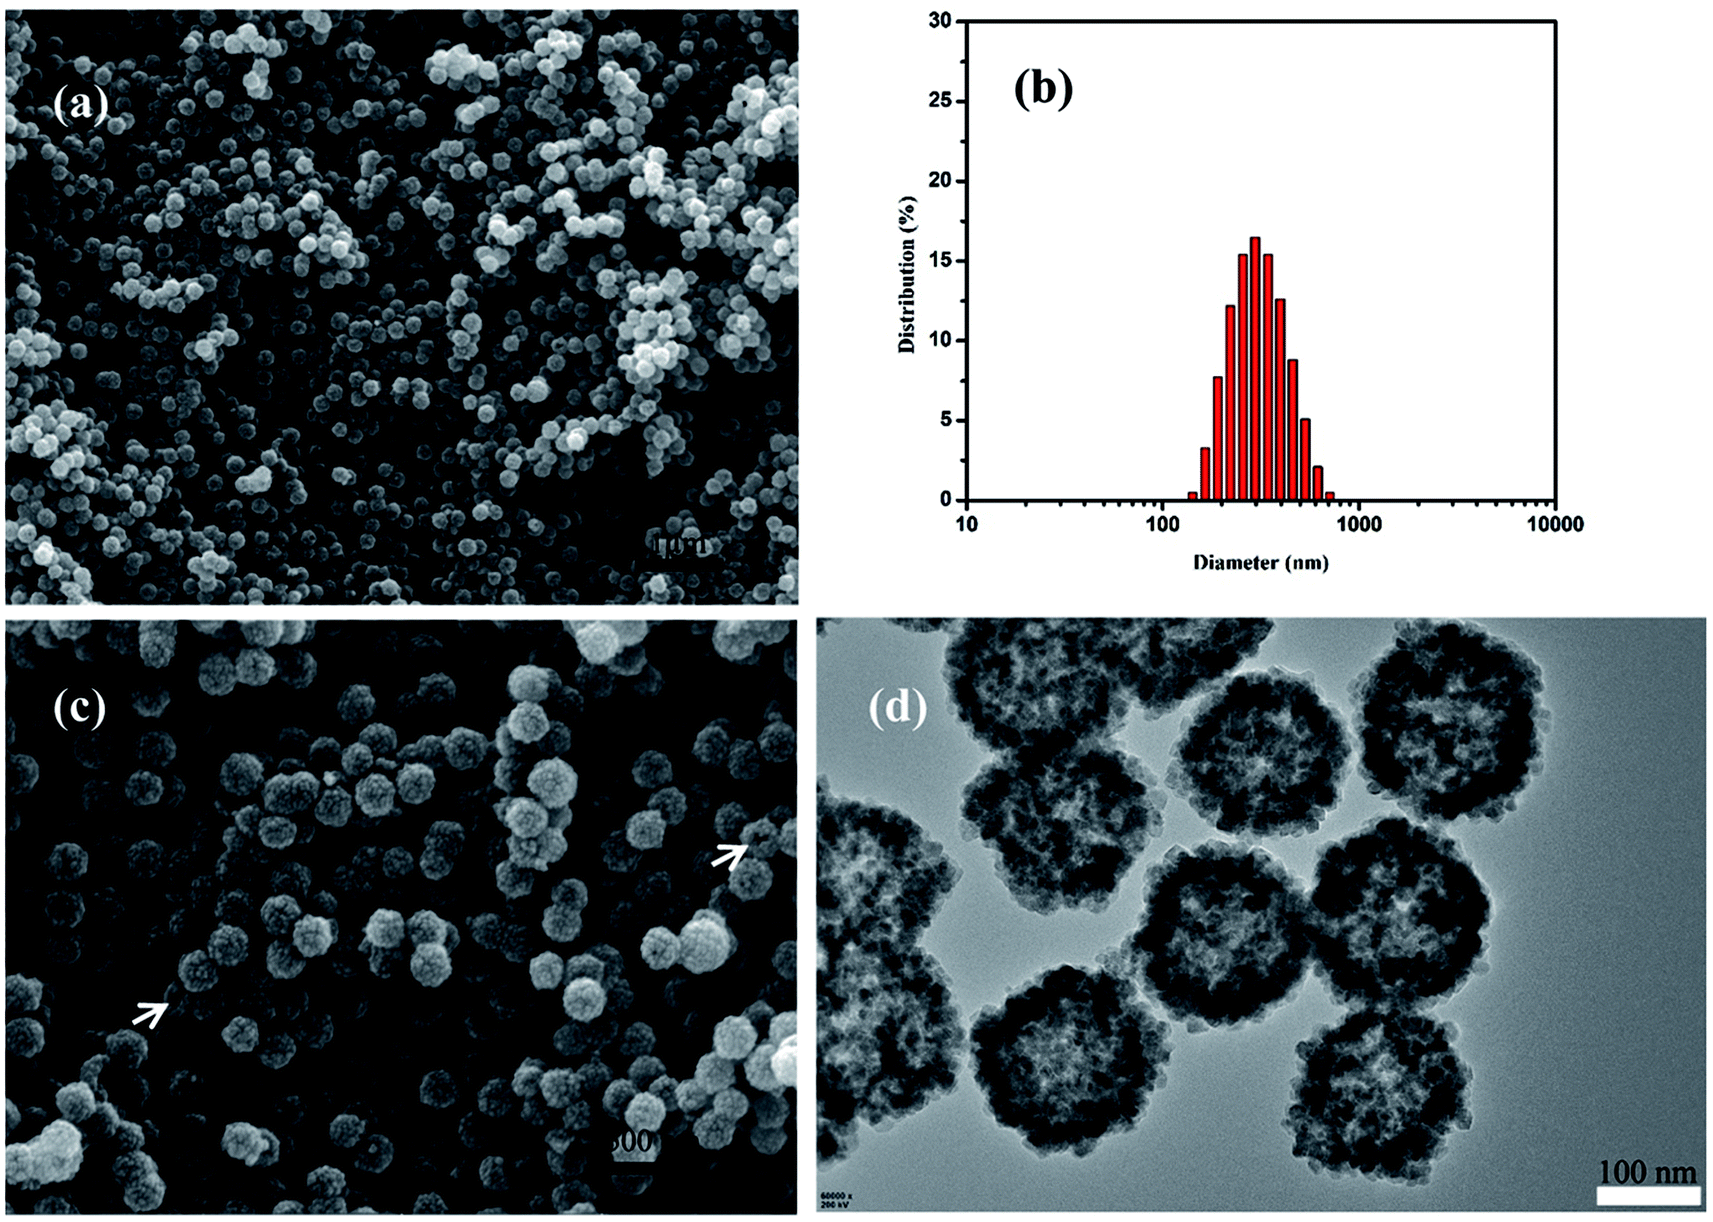 | ||
| Fig. 2 (a) Low-magnification SEM image of the HMFNs, (b) the corresponding particle size distribution of the HMFNs, (c) high-magnification SEM image of the HMFNs, the arrows indicate the broken spheres of the HMFNs (d) TEM image of the HMFNs. | ||
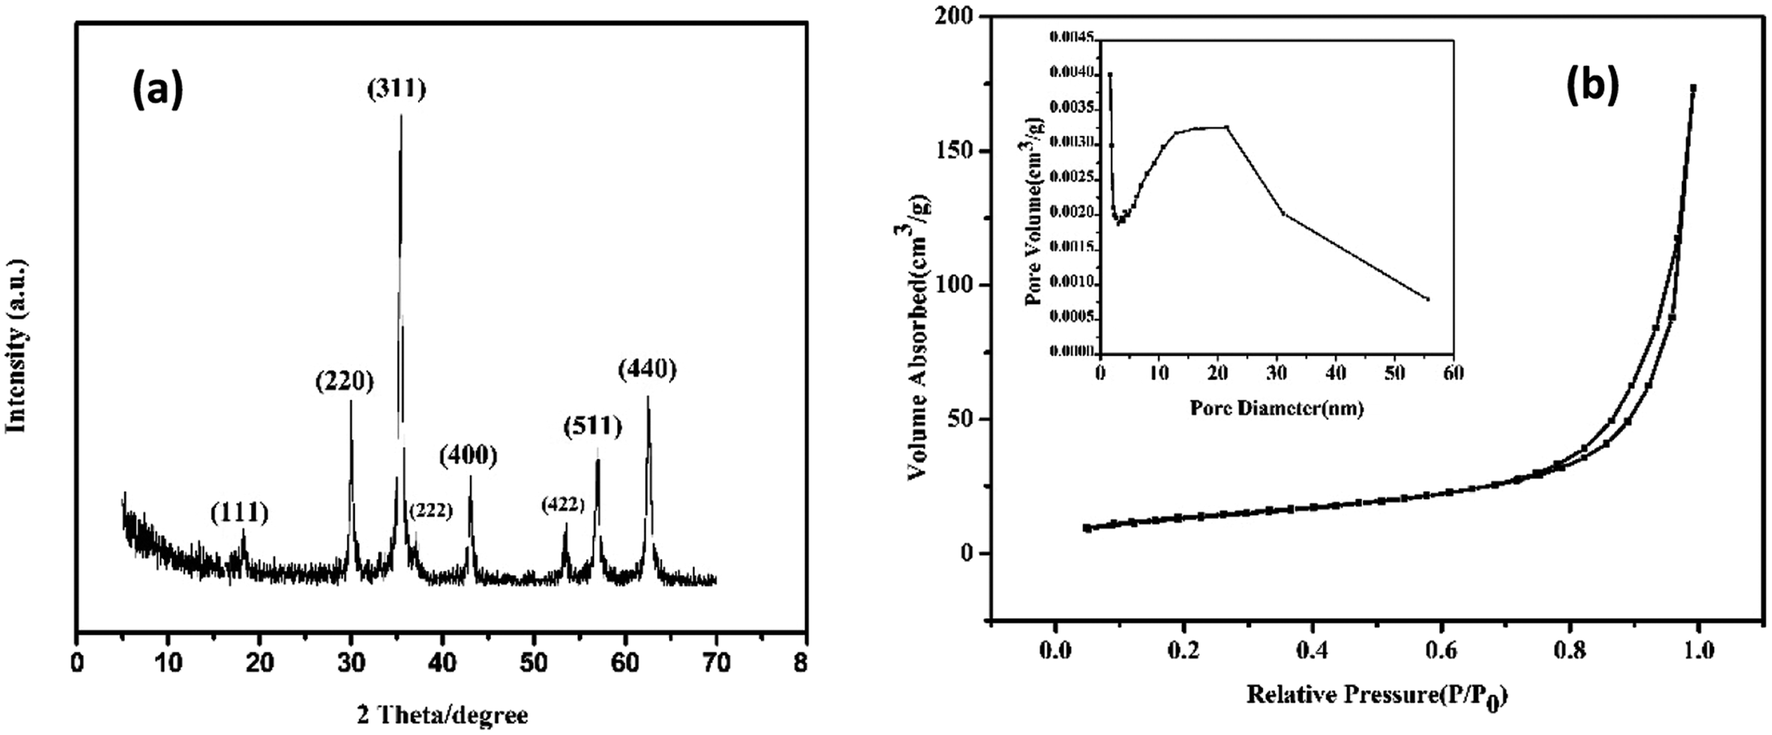 | ||
| Fig. 3 (a) XRD pattern of the HMFNs, (b) nitrogen adsorption/desorption isotherm and BJH pore plot (inset) of the HMFNs. | ||
The nitrogen adsorption–desorption isotherms and the Barrett–Joyner–Halenda (BJH) pore size distributions derived from the adsorption isotherms for the HMFNs are shown in Fig. 3b. The isotherm is of type IV and displays the H3 hysteresis loop (inset of Fig. 3b). The hysteresis loop of Fig. 3b should be assigned to the textural mesopores of nanoparticles.30 The strong adsorption at P/P0 close to 1.0 should be a result of the accessible large mesoporous cavities of the prepared samples.31 The mesoporous size distribution using the Barrett–Joyner–Halenda (BJH) model shows the prepared mesoporous ferrite nanoparticles mainly has a mesopore size distribution centered at 22.12 nm in diameter (inset in Fig. 3b). The Brunauer–Emmett–Teller (BET) surface area and total pore volume are calculated to be 48.5 m2 g−1 and 0.27 cm3 g−1, respectively. The higher BET surface area and larger pore volume strongly support the fact that the product has a mesoporous structure.
To further explore their surface property, the FT-IR spectroscopy of HMFNs is shown in Fig. S2.† The peaks appearing at 577 cm−1, attributed to the typical band of Fe3O4, correspond to the stretching vibration modes of Fe–O. 3430 and 1550 cm−1 can be assigned to the –OH stretching vibration and bending vibration, indicating the existence of the free –OH group on the HMFNs, which showed that the HMFNs exhibited to be hydrophilic shell.32
3.2. Assessment of the biocompatibility of HMFNs
The study on biocompatibility of drug delivery vehicles is very important for drug delivery systems. L929 cells were exposed to HMFNs at the concentrations of 0, 25, 50, 100, and 200 μg ml−1 and cytotoxicity was determined using MTT assay and LDH leakage assay. All the three assays had shown that HMFNs up to the concentration of 200 μg ml−1, did not produce significant cytotoxicity (p > 0.05 for each). Fig. 4a showed the effects of HMFNs on cell viabilities of L929 cells measured by MTT assay, which showed that no significant cytotoxic activity for HMFNs could be observed for 24, 48, and 72 h co-incubation.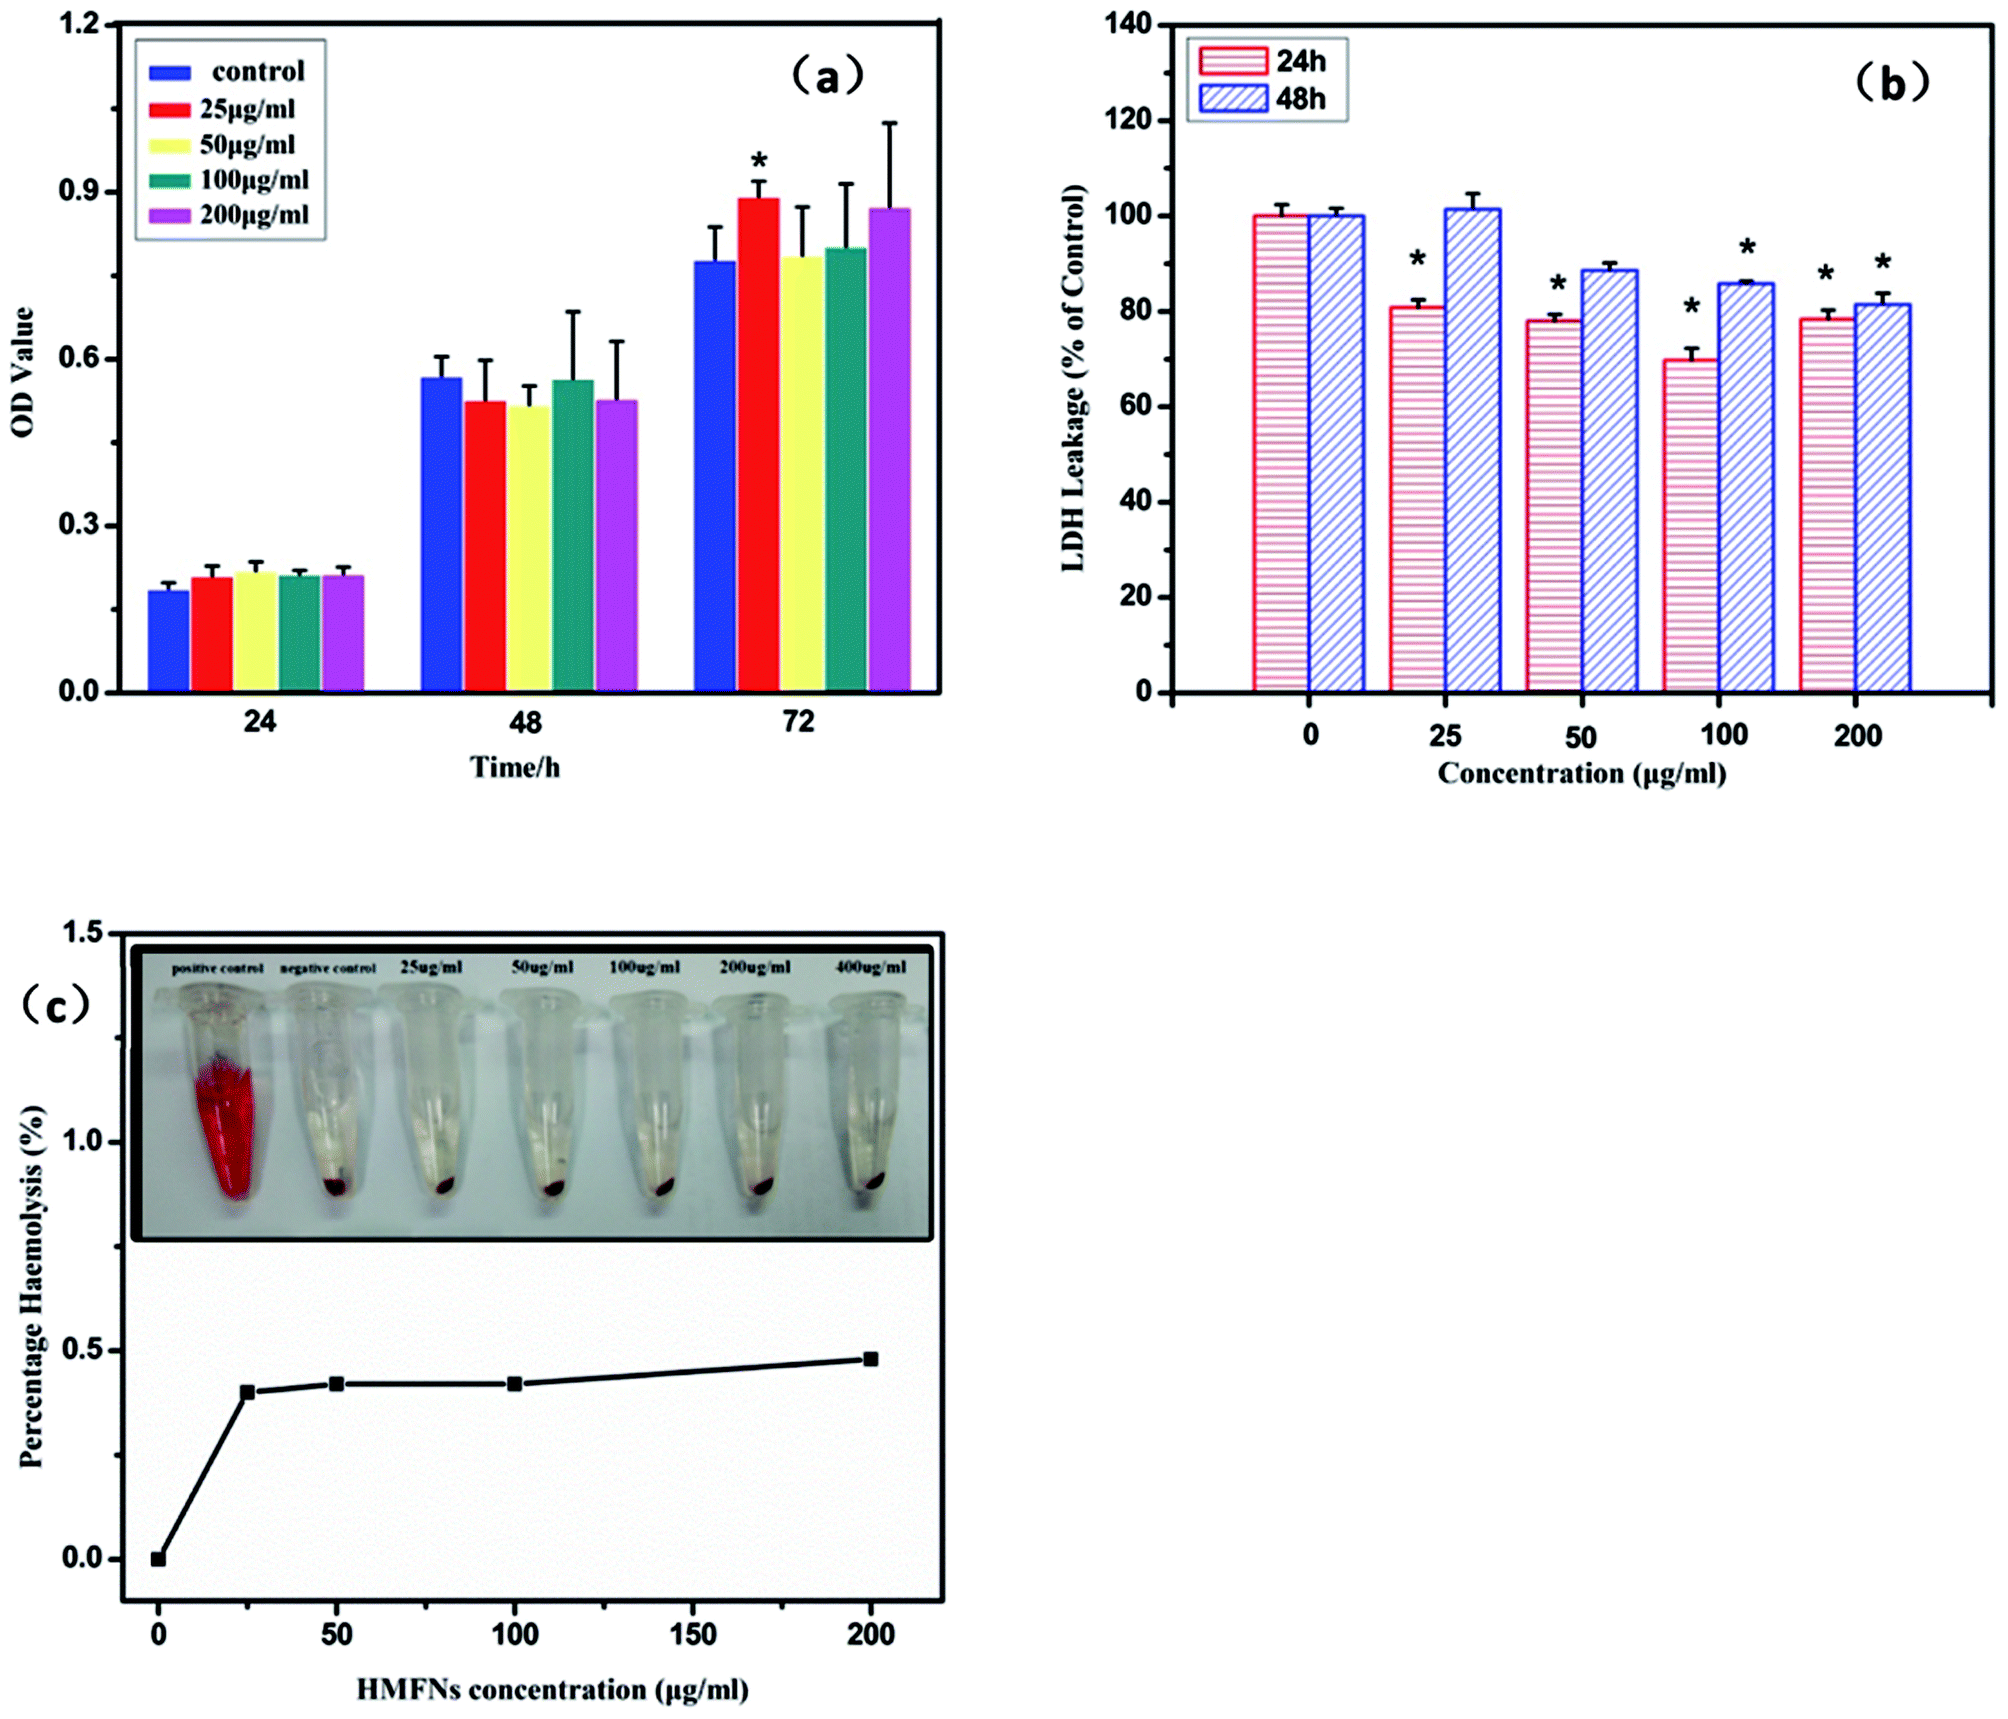 | ||
| Fig. 4 (a) The proliferation of L929 cells treated with HMFNs for 24, 48 and 72 h; (b) LDH leakage of L929 cells treated with HMFNs; (c) percentage of hemolysis of RBCs incubated with HMFNs at different concentrations ranging from 25 to 200 μg ml−1 for 3 h (inset: photographic images for direct observation of hemolysis by HMFNs, using water as a positive control and PBS as a negative control, and HMFNs suspensions of different concentrations). Data represent means ± SD (n = 6). *Statistically significant difference as compared to the controls (p < 0.05 for each). | ||
LDH is an enzyme widely present in cytosol that converts lactate to pyruvate. When plasma membrane integrity is disrupted, LDH leaks into media and its extracellular levels elevate. Therefore, higher LDH values in the medium indicate higher cytotoxicity.33 In this study, no significant LDH leakage was observed at 24 and 48 h on exposure to HMFNs at the concentrations of 0, 25, 50, 100, and 200 μg ml−1 (p > 0.05 for each) (Fig. 4b), which indicated that HMFNs did not induce cell membrane damage (LDH leakage) in L929 cells in all the concentrations used as above.
It is seen from the above, HMFNs have good cytocompatibility. However, it is equally important to assay the biocompatibility of HFNEs with blood cells to guarantee the safety of the nanocarriers. Red blood cells (RBCs) were isolated from freshly obtained EDTA-stabilized rabbit blood by centrifugation and purified by successive washing with PBS solution. After co-incubation of HMFNs with RBCs for 3 h, the hemolytic activity of HMFNs was assayed by microplate reader, the result of which was shown in Fig. 4c. The RBCs are red due to the presence of hemoglobin. During the hemolysis assay experiment, hemoglobin is released into the solution by hemolysis, resulting in a visually red solution in the case of strong hemolysis (inset of Fig. 4c). No or negligible hemolysis of RBCs was detected when exposed to HMFNs at concentrations ranging from 25 to 200 μg ml−1. About 0.48% hemolytic activities were measured at concentration reach up to 200 μg ml−1 (Fig. 4c), demonstrating the excellent blood compatibility of HMFNs.
It is seen from the above, HMFNs exhibits excellent cytocompatibility and blood compatibility, which can be used as drug delivery vehicles.
3.3. Cellular uptake
Effective intracellular drug delivery is necessary for improved therapeutic efficacy because many clinically important therapeutic agents have an intracellular site of action.34 Therefore, we investigated the cellular internalization of the HMFNs nanocarrier. As shown in Fig. S3,† Prussian blue staining was performed to detect the presence of HMFNs in the cells, and HMFNs were absorbed into the L929 cell is in a dose and time-dependent manner.We further investigated the possible uptake mechanism and intracellular location of HMFNs. Bio-TEM analysis was conducted on ultrathin sections of L929 cells. The distribution of HMFNs in L929 cells could be clearly observed in TEM images, and a large number of them could be found in cytoplasm (Fig. 5a and c), which maintained their hollow spherical structure (Fig. 5d). As shown in Fig. 5a, a few HMFNs could be found near the cell membrane, while no nanocarriers were observed in the nucleus. With the longer incubation time, more HMFNs were observed in cytoplasm, (Fig. 5c). Based on the present Prussian blue staining and bio-TEM observations, the major route for HMFNs to enter the L929 cells may be through endocytosis. Co-incubating with L929 cells, HMFNs are easily enclosed by the cell membrane to form vesicles driven by electrostatic interaction, then internalized by L929 cells.35
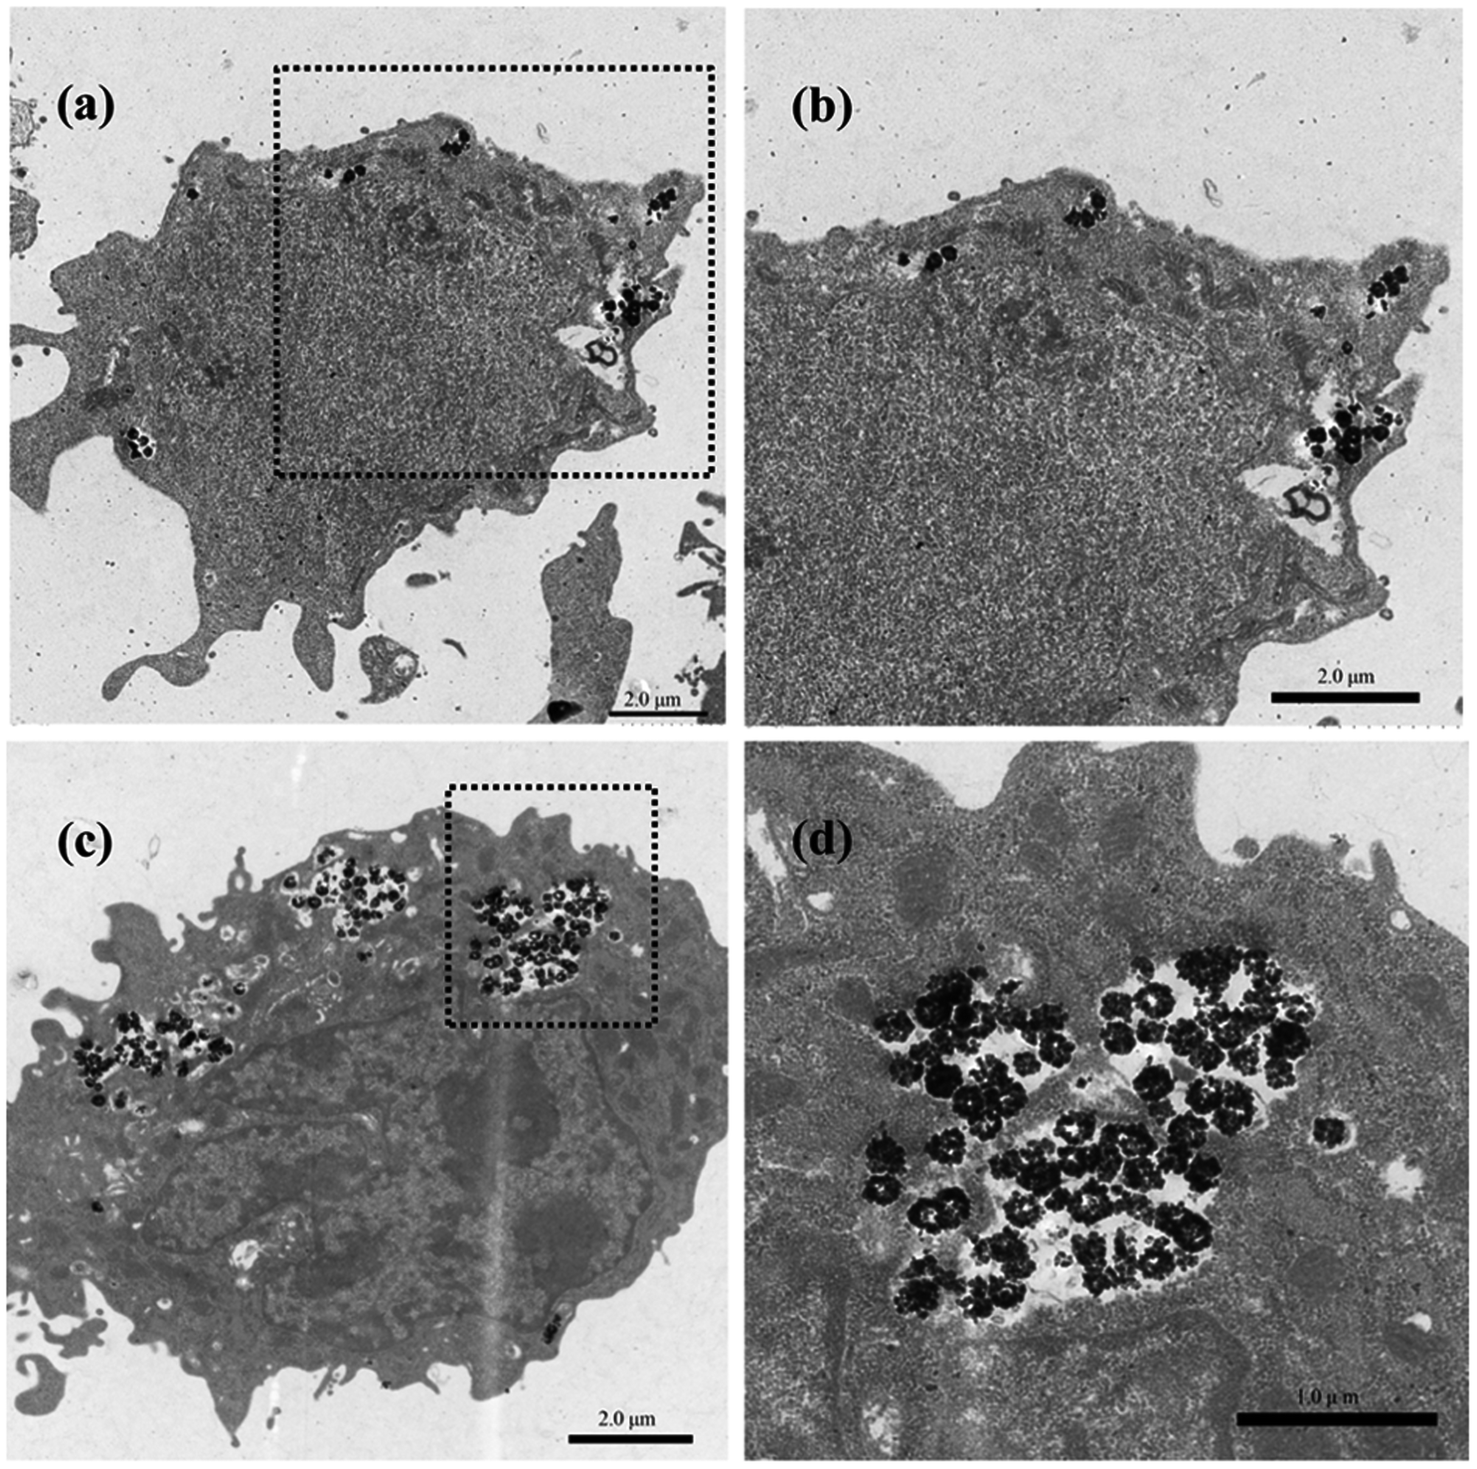 | ||
| Fig. 5 Bio-TEM images of HMFNs uptake by L929 cells. (a) and (c) HMFNs are internalized into the L929 cell after 12 and 24 h of incubation; (b) and (d) the internalized HMFNs trapped inside the cytoplasm are viewed from an enlarged rectangular area and the trapped HMFNs show the hollow structure. | ||
3.4. HMFNs efficient delivery of hydrophobic agents (RFP)
RFP, a representative and hydrophobic anti-tuberculosis drug, was selected as a typical model of hydrophobic agents. RFP was loaded into HMFNs using SC-CO2 impregnation. The influence of different experimental conditions on SC-CO2 impregnation efficiency was studied: different drug solution volume (20 to 40 ml), different pressure conditions (10 to 20 MPa), different temperature conditions (30 to 50 °C), and the contact duration between the SC-CO2 and the silica (2 to 4 h). Results in terms of the loading amount are reported in Table 1.| Run no. | Pressure (MPa) | Temperature (°C) | Amount of RFP solution (ml) | Duration time (h) | Drug loading (%) |
|---|---|---|---|---|---|
| 1 | 10 | 30 | 20 | 2 | 19.19 |
| 2 | 10 | 40 | 30 | 3 | 15.65 |
| 3 | 10 | 50 | 40 | 4 | 8.51 |
| 4 | 15 | 30 | 30 | 4 | 10.01 |
| 5 | 15 | 40 | 40 | 2 | 15.81 |
| 6 | 15 | 50 | 20 | 3 | 11.41 |
| 7 | 20 | 30 | 40 | 3 | 9.75 |
| 8 | 20 | 40 | 20 | 4 | 11.58 |
| 9 | 20 | 50 | 30 | 2 | 11.16 |
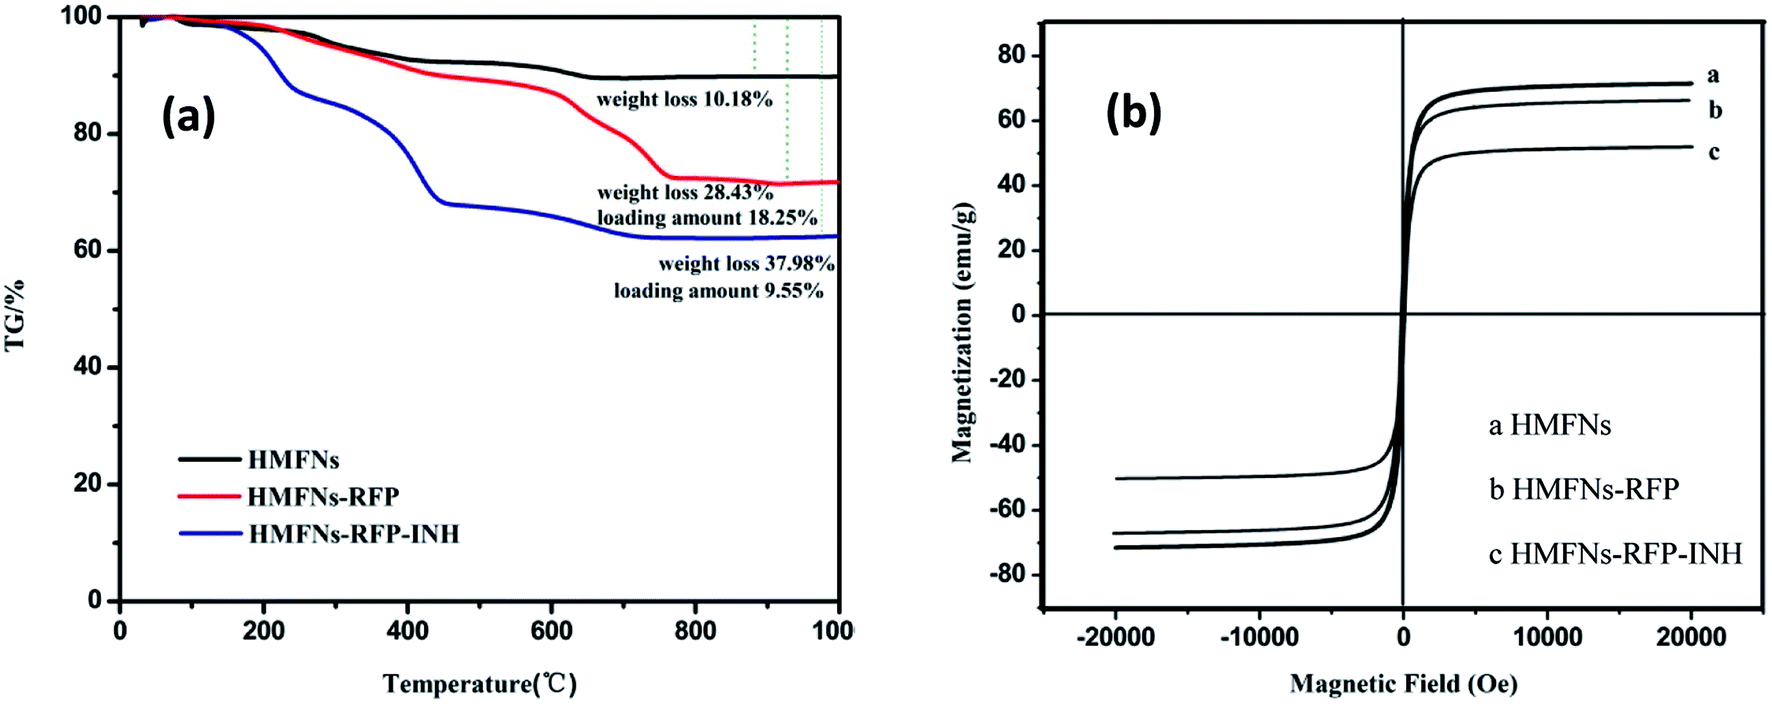
The loading amount of RFP in HMFNs can be determined by thermo-gravimetric (TG) analysis (Fig. S4†). Native HMFNs before drug loading had a small amount of weight loss between ambient temperature and 1000 °C, because of the moisture and organics present. Compared with the native HMFNs before drug loading, RFP-carrying HMFNs revealed an approximate 18.25% weight loss between ambient temperature and 1000 °C (sample1), indicating that a considerable amount of RFP was loaded into the carriers through the available mesoporous channels. Sample1 had the highest drug loading amount. The duration of processing time, processing pressure and processing temperature had no significant impact on drug loading (p > 0.05).
3.5. HMFNs co-delivery of hydrophobic and hydrophilic drugs
Successful loading of RFP and INH is confirmed by Fourier transform infrared (FT-IR) spectroscopy as shown in Fig. 6. The peak appearing at 569 cm−1, attributed to the typical band of Fe3O4, corresponds to the stretching vibration modes of Fe–O. For the RFP loading, the detection of a band centered around 2923 cm−1 due to the –CH3 stretching vibration, as well as the –OCH3 symmetrical stretching vibration (∼2853 cm−1) and C–O stretching vibration (∼1093 cm−1), indicates the incorporation of RFP into the HMFNs (Fig. 6a). Spectra of standard INH show characteristic absorptions at 3111, 1665 and 1334 cm−1, which are ascribed to the stretching vibration of N–H, C![[double bond, length as m-dash]](https://www.rsc.org/images/entities/char_e001.gif) O and bending vibration of C–H, respectively. As for HMFNs-RFP after loading with INH, the new peak located at 3111, 1665 and 1334 cm−1 corroborate that INH has been loaded into the HMFNs-RFP (Fig. 6b).
O and bending vibration of C–H, respectively. As for HMFNs-RFP after loading with INH, the new peak located at 3111, 1665 and 1334 cm−1 corroborate that INH has been loaded into the HMFNs-RFP (Fig. 6b).
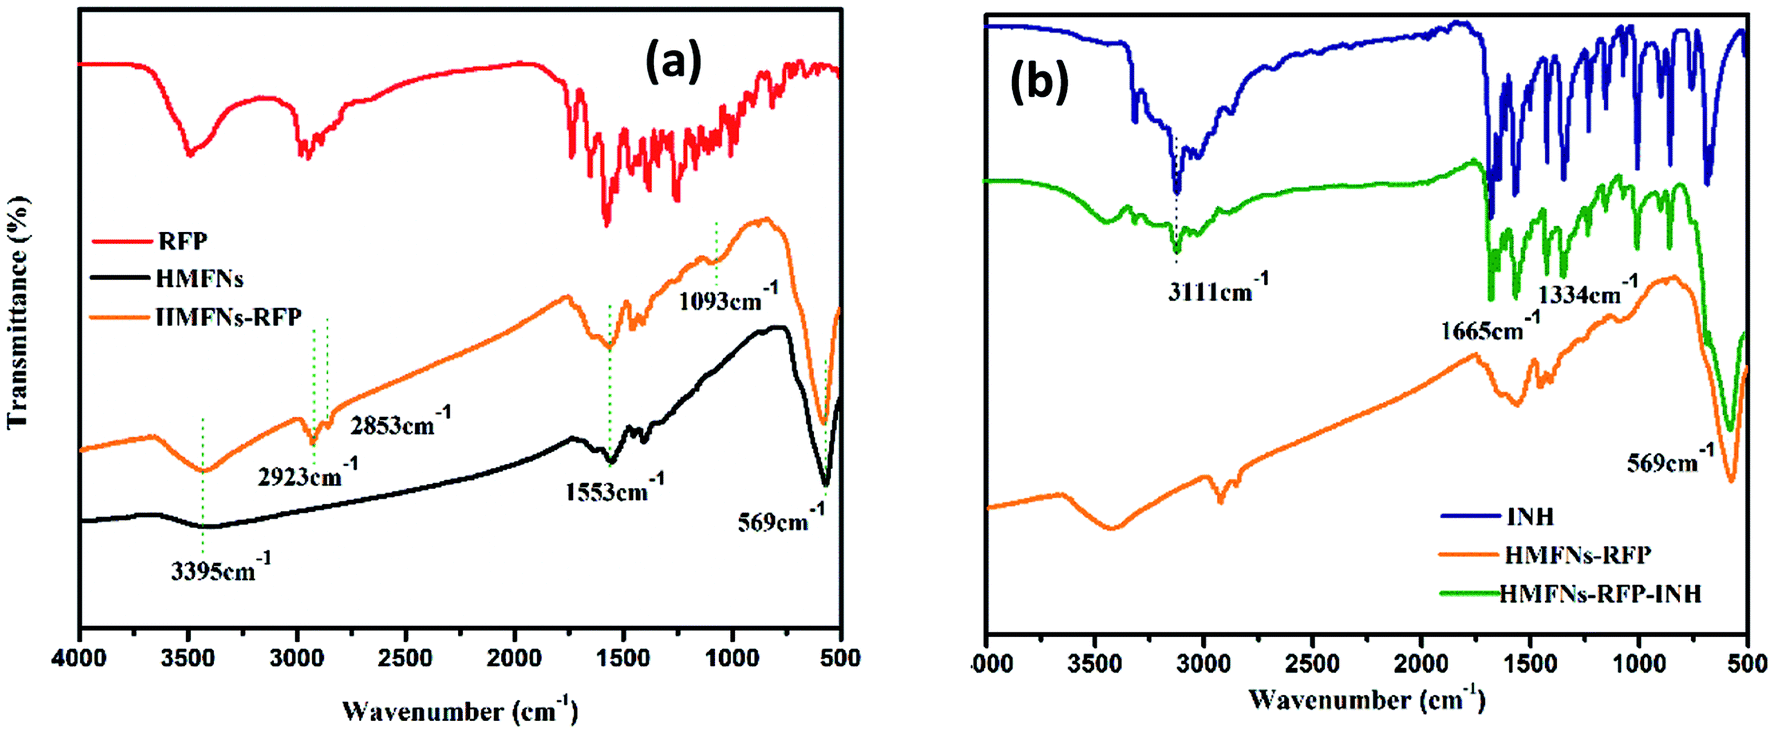 | ||
| Fig. 6 FT-IR spectra of the pure RFP, INH, and the drug-loaded HMFNs. | ||
To determine the amount of INH storage in the HMFNs, TG was employed to directly measure the weight loss of as-prepared product as shown in Fig. 7a. We selected sample1 (RFP-HMFNs) which had the highest RFP loading amount to continue loading INH. The INH weight losses were estimated to be 9.55%, by subtracting the weight loss of RFP-HMFNs.
 | ||
| Fig. 7 (a) TG curves of HMFNs, RFP-loaded HMFNs, INH and RFP co-loaded HMFNs, (b) the magnetic hysteresis curves of HMFNs, RFP-loaded HMFNs, INH and RFP co-loaded HMFNs. | ||
Magnetic properties were investigated with a vibrating sample magnetometer at 300 K, as shown in magnetization curves in Fig. 7b. The HMFNs have saturation magnetization values of 71.5 emu g−1. After loading hydrophobic drug (RFP) and hydrophilic drug (INH), the saturation magnetization values reduce to 66.7 and 51.1 emu g−1, respectively. Wang et al.36 reported a targeted delivery system whose saturation magnetization was 39.8 emu g−1. This result proved that the magnetic properties of the HMFNs would reduce slightly after loading drug, but still had a high saturation magnetization. A magnetic drug carrier could be made to selectively target the affected organs or tissues in the presence of an external magnetic field. This special property can be applied as the magnetically targeted drug delivery vehicles.
3.6. In vitro drug release
The release profiles of RFP, INH from HMFNs are shown in Fig. 8. About 37% of the RFP was released within 4 h, and the release was not as rapid in the remaining part of the assay. After being loaded into the inner core of the nanoparticles, RFP was released slowly into PBS solution and exhibited a typical sustained release behavior without any burst effect. Only about 82% of the loaded RFP was released from the carriers within 72 h. Recently, Chen et al. employed hollow/rattle-type mesoporous nanoparticles for the encapsulation and delivery of the anticancer drug doxorubicin.37 The large cavities between the core and mesoporous shell could store large quantities of drugs, and the mesoporous shell could exhibit sustained release profiles. Fig. 8 showed the release behavior of INH in PBS (pH = 7.4) at 37 °C. A burst release was observed at the early stage, indicative of the released drug adsorbed in the shallow nanochannels. The released percentage reached a value approximately 60% at the first 4 hours. The INH release rate decreased dramatically 4 hours later, which resulted from chemical adsorption, INH molecules could bond onto the surface of HMFNs through hydrogen bonding, thus release relatively slowly in the later stage.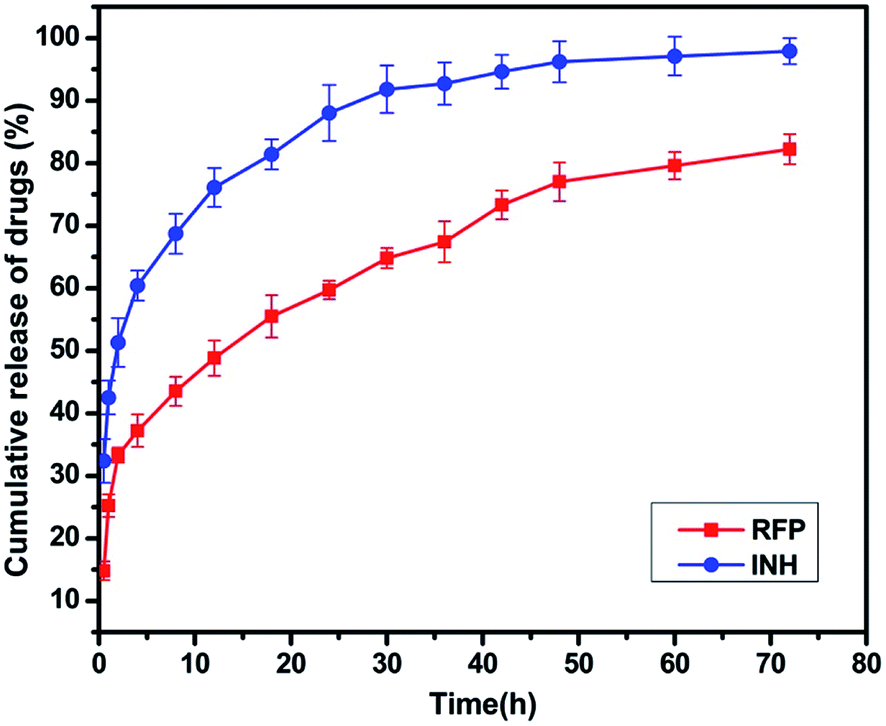 | ||
| Fig. 8 Release profile of RFP and INH from INH-RFP-HMFNs in PBS at 37 °C. | ||
4. Conclusions
In summary, we reported a very simple hydrothermal method for the synthesis of monodisperse magnetite ferrite nanoparticles with hollow mesoporous structure. The prepared HMFNs act as inorganic nano-drug carrier, which could efficiently encapsulate hydrophobic drug (RFP) and simultaneous co-load hydrophobic (RFP) and hydrophilic (INH) drugs, respectively. Besides, the prepared HMFNs exhibit excellent biocompatibility, high saturation magnetization and large amount uptake by L929 cells. These special properties endow HMFNs with great potential applications in the magnetically targeted drug delivery system. In addition, we used supercritical carbon dioxide (SC-CO2) for drug loading into HMFNs, which could enhance drug loading capacity of inorganic carriers and solved the delivery problem of hydrophobic drug molecules.Conflicts of interest
The authors declare that they have no competing interests.Acknowledgements
This work was supported by the National Natural Science Foundation of China (No. 51772233 & 1172171 & 81190133), the National Key Research and Development Program of China (No. 2016YFC1101605 & 2016YFB1101302), the Science and Technology Support Program of Hubei Province (No. 2015BAA085) and the Natural Science Foundation of Hubei Province (No. 2015CFB551).References
- Y. Wang, Y. Yan, J. Cui, L. Hosta-Rigau, J. K. Heath, E. C. Nice and F. Caruso, Adv. Mater., 2010, 22, 4293–4297 CrossRef CAS PubMed.
- J. M. Rosenholm, E. Peuhu, J. E. Eriksson, C. Sahlgren and M. Lindén, Nano Lett., 2009, 9, 3308–3311 CrossRef CAS PubMed.
- N. A. Peppas, J. Z. Hilt, A. Khademhosseini and R. Langer, Adv. Mater., 2006, 18, 1345–1360 CrossRef CAS.
- Y. Wang, S. Gao, W. H. Ye, H. S. Yoon and Y. Y. Yang, Nat. Mater., 2006, 5, 791–796 CrossRef CAS PubMed.
- L. Zhang, A. F. Radovic-Moreno, F. Alexis, F. X. Gu, P. A. Basto, V. Bagalkot, S. Jon, R. S. Langer and O. C. Farokhzad, ChemMedChem, 2007, 2, 1268–1271 CrossRef CAS PubMed.
- G. J. Wu, L. Z. Zhou, K. W. Wang, F. Chen, Y. Sun, Y. R. Duan, Y. J. Zhu and H. C. Gu, J. Colloid Interface Sci., 2010, 345, 427–432 CrossRef CAS PubMed.
- A. Kumari, S. K. Yadav and S. C. Yadav, Colloids Surf., B, 2010, 75, 1–18 CrossRef CAS PubMed.
- B. Fadeel and A. E. Garcia-Bennett, Adv. Drug Delivery Rev., 2010, 62, 362–374 CrossRef CAS PubMed.
- F. Tang, L. Li and D. Chen, Adv. Mater., 2012, 43, 1504–1534 CrossRef PubMed.
- A. M. Chen, M. Zhang, D. Wei, D. Stueber, O. Taratula, T. Minko and H. He, Small, 2009, 5, 2673 CrossRef CAS PubMed.
- Y. Yang, X. Guo, K. Wei, L. Wang, D. Yang, L. Lai, M. Cheng and Q. Liu, J. Nanopart. Res., 2013, 16 CAS.
- F. X. Ma, H. Hu, H. B. Wu, C. Y. Xu, Z. Xu, L. Zhen and X. W. David Lou, Adv. Mater., 2015, 27, 4097–4101 CrossRef CAS PubMed.
- J. Wang, J. Fang, P. Fang, X. Li, S. Wu, W. Zhang and S. Li, J. Biomater. Sci., Polym. Ed., 2017, 28, 337–349 CrossRef CAS PubMed.
- J. Li, L. Zheng, H. Cai, W. Sun, M. Shen, G. Zhang and X. Shi, Biomaterials, 2013, 34, 8382–8392 CrossRef CAS PubMed.
- F. Wang, G. M. Pauletti, J. Wang, J. Zhang, R. C. Ewing, Y. Wang and D. Shi, Adv. Mater., 2013, 25, 3485–3489 CrossRef CAS PubMed.
- X. Mou, Z. Ali, S. Li and N. He, J. Nanosci. Nanotechnol., 2015, 15, 54–62 CrossRef CAS PubMed.
- D. Liu, H. Zhang, E. Mäkilä, J. Fan, B. Herranz-Blanco, C. F. Wang, R. Rosa, A. J. Ribeiro, J. Salonen and J. Hirvonen, Biomaterials, 2015, 39, 249–259 CrossRef CAS PubMed.
- F. Peng, Y. Tu, Y. Men, J. C. van Hest and D. A. Wilson, Adv. Mater., 2017, 29 Search PubMed.
- Z. Zhang, G. Quan, Q. Wu, C. Zhou, F. Li, X. Bai, G. Li, X. Pan and C. Wu, Eur. J. Pharm. Biopharm., 2015, 92, 28–31 CrossRef CAS PubMed.
- A. Bouledjouidja, Y. Masmoudi, M. Sergent, V. Trivedi, A. Meniai and E. Badens, Int. J. Pharm., 2016, 500, 85–99 CrossRef CAS PubMed.
- A. Bouledjouidja, Y. Masmoudi, M. Van Speybroeck, L. Schueller and E. Badens, Int. J. Pharm., 2016, 499, 1–9 CrossRef CAS PubMed.
- M. Champeau, J. M. Thomassin, T. Tassaing and C. Jerome, J. Controlled Release, 2015, 209, 248–259 CrossRef CAS PubMed.
- O. Nuchuchua, M. R. Nejadnik, S. C. Goulooze, N. J. Lješković, H. A. Every and W. Jiskoot, J. Supercrit. Fluids, 2017, 128, 244–262 CrossRef CAS.
- C. Xu, X. Lu and H. Dai, Nanoscale Res. Lett., 2017, 12, 234 CrossRef PubMed.
- Y.-S. Lin and C. L. Haynes, J. Am. Chem. Soc., 2010, 132, 4834–4842 CrossRef CAS PubMed.
- W. He, K. Ai, C. Jiang, Y. Li, X. Song and L. Lu, Biomaterials, 2017, 132, 37–47 CrossRef CAS PubMed.
- S. F. Lee, X. M. Zhu, Y. X. Wang, S. H. Xuan, Q. You, W. H. Chan, C. H. Wong, F. Wang, J. C. Yu, C. H. Cheng and K. C. Leung, ACS Appl. Mater. Interfaces, 2013, 5, 1566–1574 CAS.
- C. Y. Yeh, J. K. Hsiao, Y. P. Wang, C. H. Lan and H. C. Wu, Biomaterials, 2016, 99, 1–15 CrossRef CAS PubMed.
- Y. Chen, H. Chen, S. Zhang, F. Chen, L. Zhang, J. Zhang, M. Zhu, H. Wu, L. Guo, J. Feng and J. Shi, Adv. Funct. Mater., 2011, 21, 270–278 CrossRef CAS.
- B. Luo, S. Xu, A. Luo, W.-R. Wang, S.-L. Wang, J. Guo, Y. Lin, D.-Y. Zhao and C.-C. Wang, ACS Nano, 2011, 5, 1428–1435 CrossRef CAS PubMed.
- S. Guo, D. Li, L. Zhang, J. Li and E. Wang, Biomaterials, 2009, 30, 1881–1889 CrossRef CAS PubMed.
- L. Ren, S. Huang, W. Fan and T. Liu, Appl. Surf. Sci., 2011, 258, 1132–1138 CrossRef CAS.
- M. Ahamed, M. J. Akhtar, M. A. Siddiqui, J. Ahmad, J. Musarrat, A. A. Al-Khedhairy, M. S. AlSalhi and S. A. Alrokayan, Toxicology, 2011, 283, 101–108 CrossRef CAS PubMed.
- Y. Lv, G. Ding, J. Zhai, Y. Guo, G. Nie and L. Xu, Colloids Surf., B, 2013, 110, 411–418 CrossRef CAS PubMed.
- Y. Chen, H. Chen, D. Zeng, Y. Tian, F. Chen, J. Feng and J. Shi, ACS Nano, 2010, 4, 6001–6013 CrossRef CAS PubMed.
- Y. Wang, B. Li, L. Zhang, H. Song and L. Zhang, ACS Appl. Mater. Interfaces, 2013, 5, 11–15 CAS.
- Y. Chen, H. Chen, L. Guo, Q. He, F. Chen, J. Zhou, J. Feng and J. Shi, ACS Nano, 2010, 4, 529–539 CrossRef CAS PubMed.
Footnote |
| † Electronic supplementary information (ESI) available. See DOI: 10.1039/c8ra02343c |
| This journal is © The Royal Society of Chemistry 2018 |