
 Open Access Article
 This Open Access Article is licensed under a Creative Commons Attribution-Non Commercial 3.0 Unported Licence
The effect of meat processing methods on changes in disulfide bonding and alteration of protein structures: impact on protein digestion products†
Jing He,
Guanghong Zhou,
Yun Bai,
Chao Wang,
Shuran Zhu,
Xinglian Xu and
Chunbao Li *
*
Key Laboratory of Meat Processing, MOA; Key Laboratory of Meat Processing and Quality Control, MOE; Jiang Synergetic Innovation Center of Meat Production, Processing and Quality Control, Nanjing Agricultural University, Weigang 1#, Nanjing 210095, P. R. China. E-mail: chunbao.li@njau.edu.cn; Fax: +86 25 84395679; Tel: +86 25 84395679
First published on 15th May 2018
Abstract
We investigated the effects of different pork preparation methods (cooked pork, emulsion-type sausage, dry cured pork, and stewed pork) on protein structures and in vitro digestion. Compared with raw meat, processed meats contained lower levels of free sulfhydryl groups (P < 0.05). Sodium dodecyl sulfate polyacrylamide gel electrophoresis (SDS-PAGE) showed different protein profiles for pork products treated without or with 5% βME, which indicated different extents of disulfide bond formation. Emulsion-type sausage showed significantly higher α-helix content and lower β-sheet, β-turn, and random coil contents than cooked pork (P < 0.05). Correspondingly, emulsion-type sausage and dry-cured pork had the highest values of surface hydrophobicity (P < 0.05). Proteome data showed that the long salting and drying times used for dry-cured pork as well as long-term high-temperature cooking of stewed pork might alter the accessibility of digestive proteolytic enzymes to the protein cleavage sites.
1. Introduction
In recent decades, protein oxidation in muscle foods has been widely studied. The formation of disulfide bonds, which are crucial in protein structures, is among the most important outcomes of oxidation in meat and can be promoted by processing. Although different cooking methods have been applied in meat processing, changes in heating temperature and time have the most significant effects. The loss of sulfhydryl groups and increasing surface hydrophobicity have been observed during cooking.1,2 The loss of sulfhydryl groups is dependent on both the heating temperature and heating time.1 In addition to cooking conditions, salt can also induce the formation of disulfide bonds. Muscle proteins have shown increased susceptibility to oxidation in a high-ionic strength environment (0.6 M NaCl).3 Furthermore, salt directly affects protein conformation, functionality, and solubility. Myofibrillar proteins have loose structures in 0.6 M NaCl owing to electrostatic repulsion, making them more susceptible to hydroxyl radicals under these conditions.4 Furthermore, in emulsion systems, heat-induced gels are formed by covalent bonds (such as disulfide bonds) and non-covalent interactions (such as hydrophobic interactions), which decrease the amount of sulfhydryl groups and increase surface hydrophobicity after heating at 50–60 °C.5,6 Such changes not only affect the sensory or technological attributes of meat and meat products but also affect their nutritional properties.Processing has a significant effect on the protein digestibility and particle size of pork products.7 The degree of cooking can affect the in vitro protein digestibility of meat products.2,8 Other processing steps, including chopping and drying, may also affect protein digestibility.9 The processing methods not only affect the protein digestibility of meat products but also the peptide fractions released after digestion.10 This can be attributed to protein oxidation and aggregation,11 which would change the surface hydrophobicity and protein secondary structures.12 In a previous study, stewed pork was observed to have the lowest protein digestibility after pepsin digestion alone or with subsequent trypsin digestion, while the highest protein digestibility was obtained for emulsion-type sausage under both these conditions.7 However, the underlying mechanisms are not clear.
Protein secondary structures can be estimated by Raman spectroscopy. Raman bands corresponding to amide regions I, II, and III are used to infer the protein backbone conformation. Changes in Raman bands can reflect the transformation of protein structures, including tyrosyl doublets and tryptophan residues. In meat products, large changes in Raman spectra that are closely associated with meat quality have been observed during processing.13
However, the formation of disulfide bonds and their effect on the protein structure during processing is poorly understood. Furthermore, little is known about associations between the structural changes and digestion products of meat proteins. Therefore, this study aimed to determine associations among disulfide bonds, structural changes, and digestion of pork prepared using different methods.
2. Materials and methods
2.1. Chemicals and reagents
Cyanine3 maleimide (Cy3m) was purchased from GE Healthcare (Little Chalfont, UK). Dimethyl sulfoxide (DMSO), β-mercaptoethanol (βME), dithiothreitol (DTT), iodoacetamide (IAM), and 8-anilino-1-naphthalene sulfonic acid (ANS) were purchased from Aladdin (Shanghai, China). N-Ethylmaleimide was purchased from Sinopharm Chemical Reagent Co. Ltd. (Shanghai, China). Precast gel (4–12%) was purchased from GenScript (USA). Sequencing grade modified trypsin was purchased from Promega (Madison, WI, USA)2.2. Meat product preparation
Meat products were prepared from pork longissimus dorsi muscles taken from seven carcasses (replicates) obtained from Jiangsu Food Group Co. Ltd (Jiangsu, China). Pork samples used for analysis were prepared using different methods, namely, cooked pork, emulsion-type pork sausage, dry-cured pork, and stewed pork, in addition to raw pork. Cooked pork was prepared at 80 °C by steam-cooking pork blocks (size: 10 × 10 × 5 cm) to a core temperature of 72 °C for about 30 min. Emulsion-type sausage was prepared by chopping pork muscle and back fat at a 4![[thin space (1/6-em)]](https://www.rsc.org/images/entities/char_2009.gif) :1 ratio with 2.2% salt and 38.9% ice water, then stuffing into casings (diameter, 30 mm) and steam-cooking at 80 °C to a core temperature of 72 °C for about 15 min. Dry-cured pork was prepared from pork cuts by dry-curing with 5% salt, sun-drying for one month, and then steam-cooking (size: 10 × 10 × 5 cm) under the same conditions used for cooked pork. Stewed pork was prepared by cutting the pork into strips, blanching in boiling water for 5 min, and then cutting into 1 × 5 × 5 cm pieces. These pieces were then pan-fried (180 °C) for 5 min in soybean oil (10 g kg−1 of meat) using a pot with an induction surface. The pieces were fried, turning twice at intervals of 60 s, and then cooked in boiling water (water/meat, 1:4) for 5 min. The pieces were then stewed at 100 °C for 150 min.
:1 ratio with 2.2% salt and 38.9% ice water, then stuffing into casings (diameter, 30 mm) and steam-cooking at 80 °C to a core temperature of 72 °C for about 15 min. Dry-cured pork was prepared from pork cuts by dry-curing with 5% salt, sun-drying for one month, and then steam-cooking (size: 10 × 10 × 5 cm) under the same conditions used for cooked pork. Stewed pork was prepared by cutting the pork into strips, blanching in boiling water for 5 min, and then cutting into 1 × 5 × 5 cm pieces. These pieces were then pan-fried (180 °C) for 5 min in soybean oil (10 g kg−1 of meat) using a pot with an induction surface. The pieces were fried, turning twice at intervals of 60 s, and then cooked in boiling water (water/meat, 1:4) for 5 min. The pieces were then stewed at 100 °C for 150 min.
2.3. Protein extraction
The total proteins were extracted according to the method of Zarkadas and Maloney.14 Briefly, meat sample (0.3 g) was homogenized in 2% sodium dodecyl sulfate (SDS; 4.5 mL) for 3 × 30 s at 10000 rpm, cooling for 15 s between bursts (T 25 digital ULTRA-TURRAX Disperser, IKA, USA), which achieved the complete extraction of total proteins. The homogenates were centrifuged for 20 min at 4000 × g at 4 °C. The supernatants containing total proteins were transferred to new tubes and stored at −80 °C until analysis.
2.4. Determination of sulfhydryl groups by fluorescence measurement
Cy3m is a specific labeling reagent for sulfhydryl groups, and fluorescence intensities were measured to indicate the contents of sulfhydryl groups using the method of Maeda et al. with minor modifications.15 The protein concentration was adjusted to 1 mg mL−1. A 100 μL aliquot of the protein solution was mixed with Cy3m (8 μg) in DMSO (2 μL) and incubated overnight at 4 °C in the dark. Labeled proteins were desalted using a G25 desalting column (Illustra MicroSpin G-25 Columns, GE Healthcare, Little Chalfont, UK) to remove excessive Cy3m. Fluorescence intensities (FI) of labeled proteins were measured at excitation and emission wavelengths of 550 nm and 570 nm, respectively (SpectraMax M2, Molecular Devices Limited, USA). These FI values represented the sulfhydryl group contents. All measurements were performed at room temperature in triplicate, and FI values were expressed in arbitrary units.2.5. Gel electrophoresis of muscle proteins
Sodium dodecyl sulfate polyacrylamide gel electrophoresis (SDS-PAGE) was performed according to the procedure of Xiong et al. with minor modifications.16 Prior to electrophoresis, a given volume of protein sample was mixed with the SDS-PAGE sample buffer (4% SDS, 20% glycerol, and 0.125 M Tris, pH 6.8), with or without 5% βME, and made up to a final protein concentration of 1.5 mg mL−1. For samples without βME, 0.5 mM N-ethylmaleimide (a thiol blocking agent) was added to prevent disulfide artifacts. All mixtures were heated in boiling water (100 °C) for 5 min. A 12 μL sample aliquot (18 μg of protein) was loaded onto the 4–12% precast gel. The gels were run in Tris-MOPS-SDS running buffer (1 L; GenScript, USA) at 140 V for 1.5 h. Proteins were then stained with Coomassie Brilliant Blue R250 for 0.5 h and destained until the bands were clear. Gel images were captured using an image scanner (GE Healthcare, Little Chalfont, UK), and the band intensities were quantified using Quantity One software (GE Healthcare, Little Chalfont, UK). The relative intensity of each band was calculated from the actual intensity of the measured band relative to the actual intensity of the 130 kDa band in the prestained calibration marker.2.6. Determination of protein conformation by Raman spectroscopy
Raman spectroscopy was conducted using a LabRAM HR Evolution spectrometer (Horiba/Jobin, Yvon, Longjumeau, France) and following the method of Xu et al. with minor modifications.17 A microscope was used to focus an excitation wavelength of 785 nm from a laser onto the sample and collect Raman signals in the backscattered direction. The laser power at the sample surface was about 100 mW. The meat sample was spread on a glass slide for measurement. Raman spectra were recorded in the range 400–3200 cm−1. Each spectrum was achieved using three scans with a 20 s exposure time between each scan. Spectra were smoothed and baselined using Labspec version 5 (Horiba/Jobin. Yvon, Longjumeau, France). The Phe ν-ring band located near 1003 cm−1 was used as the internal standard to normalize the spectra because it was not sensitive to the microenvironment. The visible bands were assigned to vibration modes of amino acid side chains or the peptide backbone.17,18 Protein secondary structures were determined as percentages of α-helices, β-sheets, β-turns, and random coils using Alix's method.192.7. Protein surface hydrophobicity (H0)
Protein surface hydrophobicity was measured using 8-anilino-1-naphthalene sulfonic acid (ANS) according to the method of Mustapha et al.20 Briefly, meat sample (1.0 g) was homogenized (2 × 30 s at 9500 rpm; 2 × 30 s at 13500 rpm at 4 °C) in PBS (15 mL, 10 mmol L−1, pH 7.0) with a cooling period of 30 s between bursts. The protein concentration was determined using the Biuret method. A solution of 8 mM ANS (20 μL) was added to proteins diluted to different concentrations using PBS (10 mmol L−1) (0.05, 0.125, 0.25, 0.375, 0.5, and 1 mg mL−1; 4 mL). Fluorescence intensity was measured at 470 nm for excitation at 390 nm (SpectraMax M2, Molecular Devices Limited, USA). The relative fluorescence intensity was plotted against protein concentration to calculate the slope of the curve, which was used as an index of surface hydrophobicity (H0).
2.8. Identification of digestion products by liquid chromatography-tandem mass spectrometry (LC-MS/MS)
Trypsin-digested products were identified according to the method described by Li et al.7 Briefly, a protein sample (200 μg) was taken from each sample solution and loaded onto ultra 0.5 mL centrifugal filter units (Amicon Ultra, Millipore, Billerica, MA, USA). Next, Tris–HCl (200 μL, 50 mM, pH 8.0) was added to the centrifugal filter unit and centrifuged at 14000 × g for 15 min to replace the buffer solution, which was performed three times. The protein structures were able to recover after removal of the SDS denaturation reagent. The recovered protein was digested with trypsin (Promega, Madison, WI, USA) at a 50:1 protein/trypsin ratio at 37 °C for 16 h without adding DTT and IAM, and then centrifuged at 14000 × g for 15 min. The filtrates were retained. Next, DTT (5 μL, 1 M) was mixed with the filter residues and incubated at 60 °C for 1 h. IAM (20 μL, 0.5 M) was then added and incubated for 45 min in the dark. After centrifugation at 14000 × g for 15 min to remove excess DTT and IAM, the proteins were digested again and centrifuged to obtain the filtrates. Both collected filtrates were dried by vacuum centrifugation and reconstituted using 0.2% formic acid in ultrapure water. The reconstituted mixtures were desalted with ZipTip C18 (Millipore, Billerica, MA, USA). Concentrated peptide mixture (2 μg) was dissolved in 0.2% formic acid in ultrapure water (10 μL), loaded onto a C18 column (2 cm × 200 μm, 5 μm), and passed through a C18 chromatographic column (75 μm × 100 mm, 3 μm) to achieve separation. A step-gradient elution was applied at a flow rate of 300 nL min−1 using 0.2% formic acid in 60% acetonitrile (A) and 0.2% formic acid in ultrapure water (B), as follows: 0–10 min (97% A, 3% B), 10–70 min (92% A, 8% B), 70–72 min (62% A, 38% B), 72–82 min (2% A, 98% B), and 82–90 min (97% A, 3% B). The eluted peptides were identified using a hybrid quadrupole orbitrap mass spectrometer equipped with a nanoelectrospray ionization source (Thermo Fisher Scientific, USA). Data-dependent mode was selected as the ‘top ten’ mode and a scan cycle was initiated with a full-scan MS spectrum (300–1800 amu). MS/MS spectra were processed using Proteome Discoverer software (version 1.4; Thermo Fisher Scientific, Palo Alto, CA, USA) against Sus scrofa for pork (http://www.uniprot.org/). Data matching was performed in the Swiss-Prot database with a parent ion tolerance of 10 ppm and two missing cleavages allowed. Trypsin was chosen as the digestive enzyme for the peptide match.
2.9. Statistical analysis
The fluorescence intensities, protein surface hydrophobicity, and percentages of secondary structures were analyzed by one-way analysis of variance (ANOVA) and Duncan's multiple-range test using the SAS software (version 9.2, 2009, SAS Institute Inc., USA). Values were considered significantly different if the P value was smaller than 0.05 (P < 0.05). MS spectra data were mainly analyzed qualitatively and similarity analysis was performed using Venn diagrams (http://bioinformatics.psb.ugent.be/webtools/Venn/). Partial least squares discriminant analysis (PLS-DA) was performed on digested products using Ezinfo 3.0 software (Waters, Milford, USA), heat maps were produced using Cluster 3.0 software (Stanford University, USA), and the results were compiled using Eisen's TreeView software.3. Results and discussion
To perform this investigation, it was necessary to first solubilize the muscle proteins. SDS was used for protein extraction and, like all protein solubilizing agents, caused some protein denaturation and affected the protein structure. However, this study was interested in changes in disulfide bonds during processing, which are not affected by SDS treatment. This study aimed to investigate changes in disulfide bonds formed during various processing procedures and the effect of these changes on protein structures and in vitro protein digestion.3.1. Effect of processing on disulfide bond formation in protein
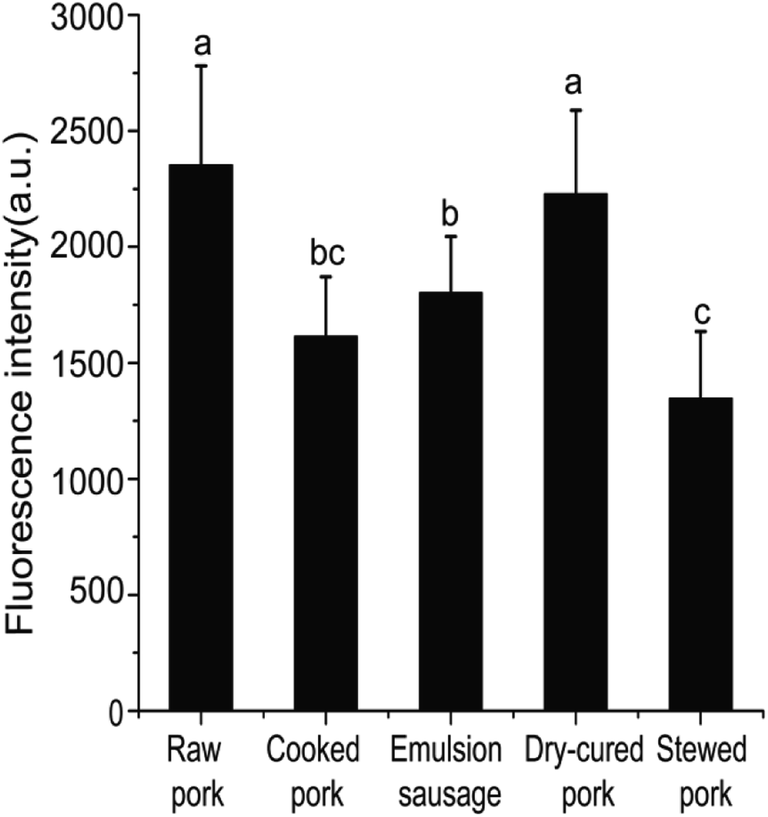 | ||
| Fig. 1 Fluorescence intensities of pork products. Different letters (a, b, c) indicate significant differences (P < 0.05). | ||
Differences in SH contents might be attributed to several factors. Cooking temperature has a great influence on protein structure. It has been reported that meat proteins unfold and form irreversible oligomers at 70 °C, while at 100 °C or higher, the proteins are further modified by oxidation, which promotes aggregation.21 For stewed pork, long cooking times and high temperatures induce protein aggregation, which would result from the formation of disulfide bonds.22 Although dry-cured pork and cooked pork were heated under the same conditions, the SH contents were significantly different, which indicated that salting and drying were the two critical factors. In the present study, the SH contents of dry-cured pork were higher than those of other pork products. This increased SH content can be attributed to a loose or more disrupted myofibril structure caused by electrostatic repulsion in the high-ionic-strength salty environment.4 In emulsion-type sausage, emulsion systems and gels are formed by protein denaturation through the formation of intermolecular covalent bonds (such as disulfide bonds) and noncovalent interactions (such as hydrophobic interactions) after chopping and subsequent heating.5,23
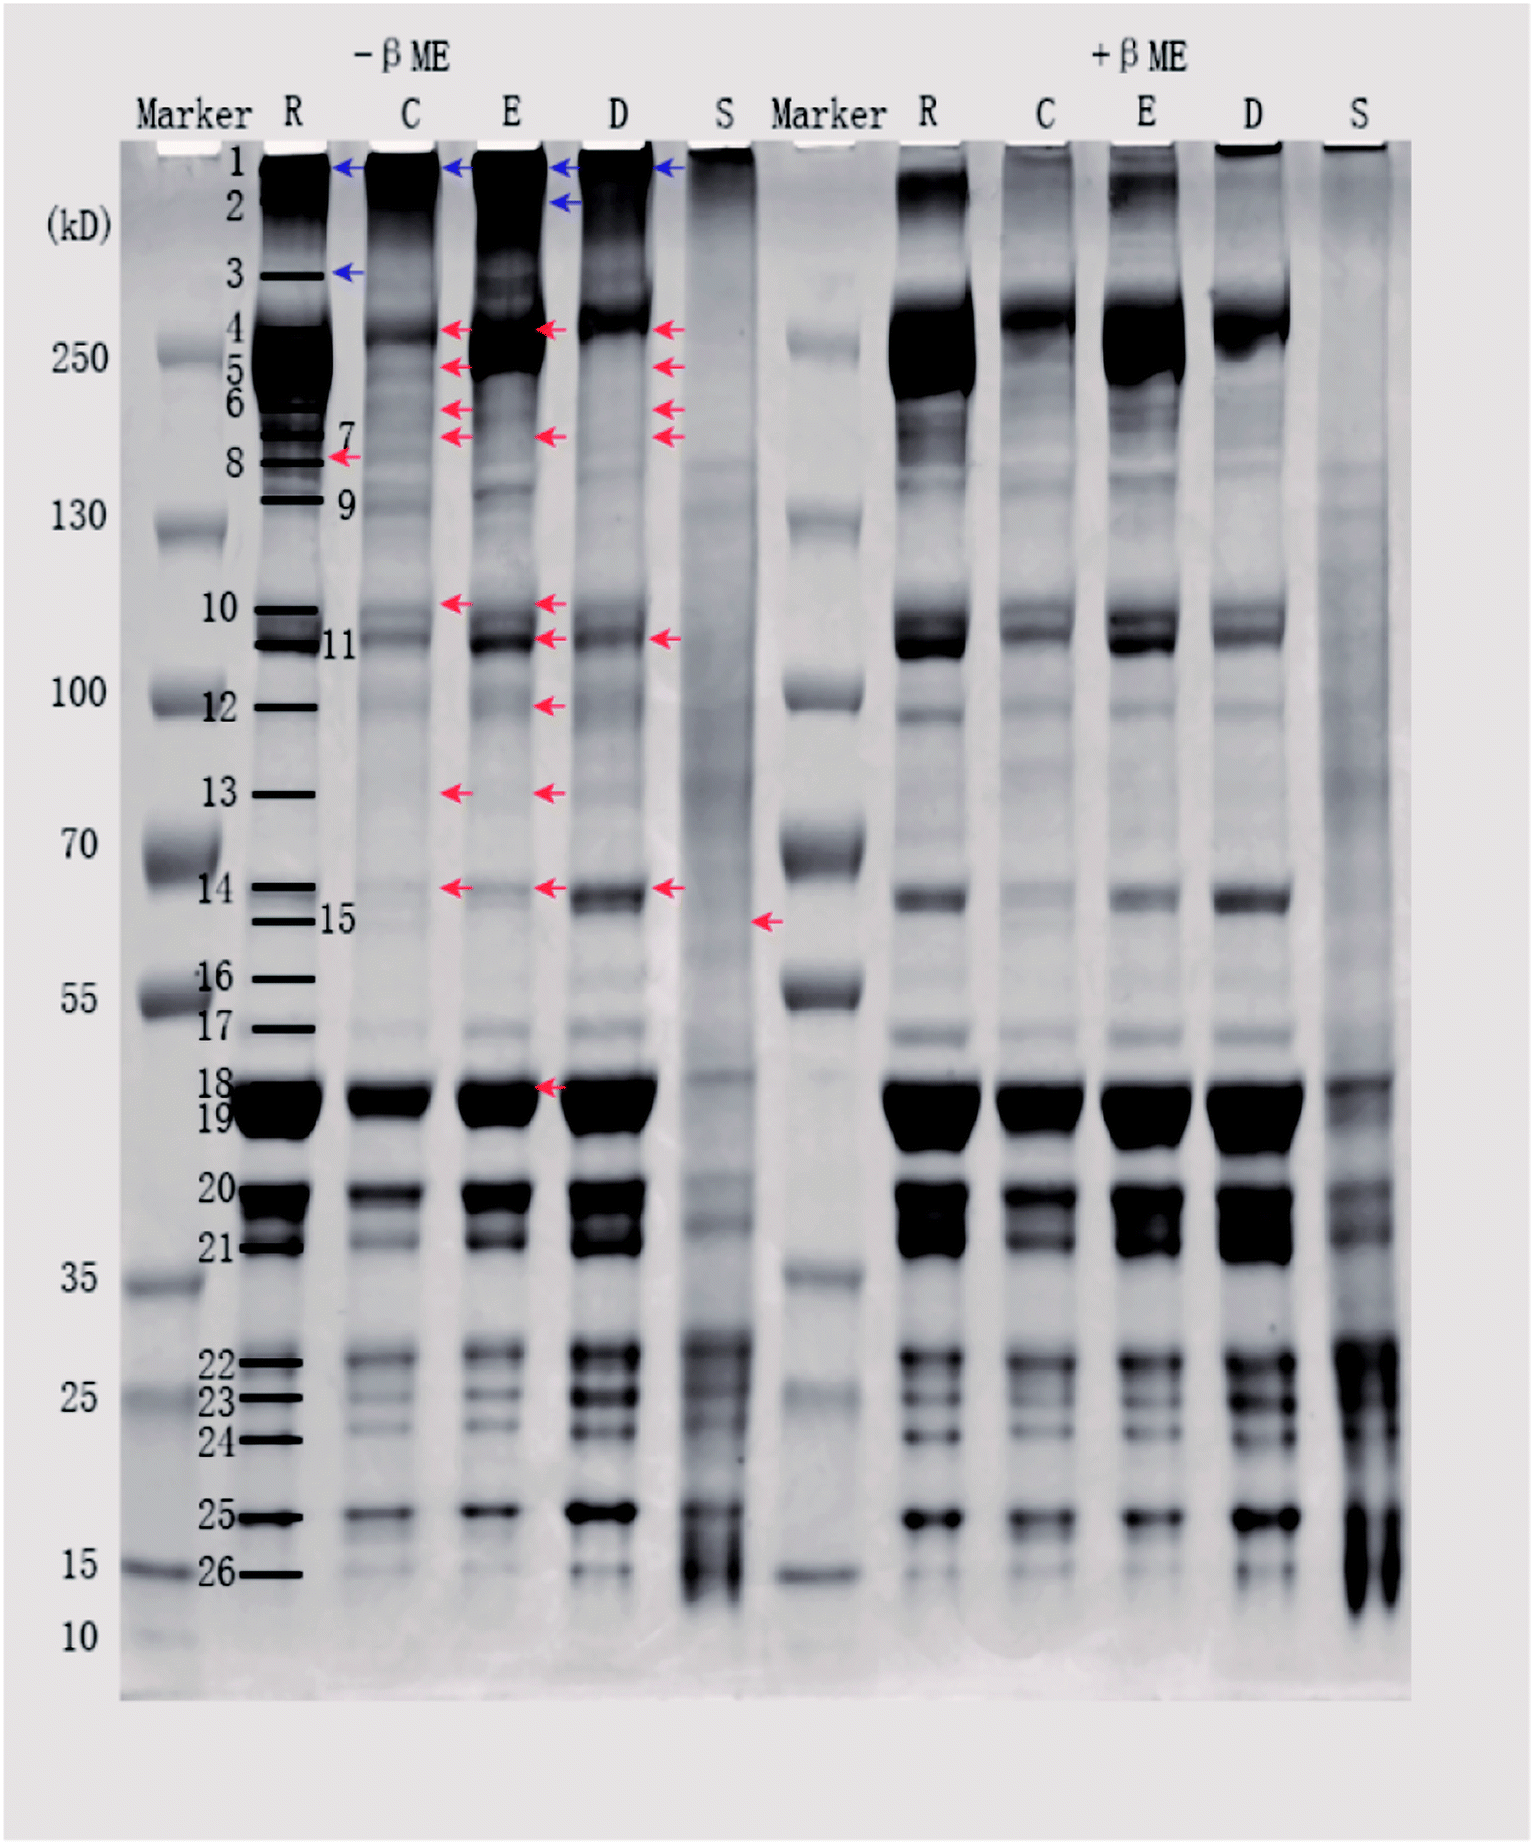 | ||
| Fig. 2 SDS-PAGE patterns of proteins from different pork products. Samples were prepared without (−βME) or with (+βME) 5% βME. Lanes R, C, E, D, and S represent raw pork, cooked pork, emulsion-type sausage, dry-cured pork, and stewed pork, respectively. Blue and red arrows represent decreased and increased intensities of lanes after treatment with 5% βME, respectively. | ||
| Band | Raw pork | Cooked pork | Emulsion-type sausage | Dry-cured pork | Stewed pork | |||||
|---|---|---|---|---|---|---|---|---|---|---|
| –βME | +βME | –βME | +βME | –βME | +βME | –βME | +βME | –βME | +βME | |
| a Different letters (a,b) in the same row of each pork product indicate significant differences (P < 0.05). Bold figures indicate that the band relative intensities changed significantly after βME treatment of the same pork product (P < 0.05). | ||||||||||
| 1 | 2.61 ± 1.53 a | 1.17 ± 0.68 b | 3.67 ± 1.34 a | 1.99 ± 0.62 b | 3.72 ± 1.10 a | 1.43 ± 0.55 b | 3.59 ± 1.05 a | 1.97 ± 0.41 b | 3.12 ± 1.27 a | 2.53 ± 1.26 a |
| 2 | 4.30 ± 2.22 a | 6.41 ± 1.72 a | 3.72 ± 1.68 a | 2.50 ± 0.97 a | 3.66 ± 0.99 a | 1.01 ± 1.12 b | 2.93 ± 1.58 a | 1.94 ± 1.79 a | 3.02 ± 1.58 a | 2.29 ± 1.64 a |
| 3 | 0.13 ± 0.09 a | 0.04 ± 0.03 b | 0.13 ± 0.12 a | 0.05 ± 0.02 a | 0.17 ± 0.13 a | 0.07 ± 0.04 a | 0.03 ± 0.03 a | 0.02 ± 0.01 a | 0.23 ± 0.19 a | 0.03 ± 0.03 b |
| 4 | 1.07 ± 0.41 a | 2.30 ± 0.85 a | 0.66 ± 0.47 b | 1.64 ± 0.81 a | 0.69 ± 0.39 b | 1.53 ± 0.72 a | 0.59 ± 0.48 b | 2.07 ± 1.08 a | n.d. | n.d. |
| 5 | 2.62 ± 1.33 a | 3.01 ± 1.21 a | 0.11 ± 0.07 b | 0.30 ± 0.14 a | 0.28 ± 0.28 a | 0.52 ± 0.67 a | 0.13 ± 0.14 b | 2.18 ± 1.35 a | n.d. | n.d. |
| 6 | 0.28 ± 0.21 a | 0.19 ± 0.16 a | 0.10 ± 0.05 b | 0.24 ± 0.19 a | 0.32 ± 0.14 a | 0.58 ± 0.35 a | 0.02 ± 0.01 b | 0.11 ± 0.08 a | n.d. | n.d. |
| 7 | 0.27 ± 0.13 a | 0.30 ± 0.24 a | 0.08 ± 0.03 b | 0.14 ± 0.05 a | 0.13 ± 0.07 b | 0.23 ± 0.05 a | 0.05 ± 0.03 b | 0.40 ± 0.42 a | n.d. | n.d. |
| 8 | 0.20 ± 0.08 b | 0.39 ± 0.21 a | 0.30 ± 0.18 a | 0.65 ± 0.50 a | 0.37 ± 0.17 a | 0.58 ± 0.39 a | 0.07 ± 0.03 a | 0.15 ± 0.13 a | 0.05 ± 0.04 a | 0.04 ± 0.02 a |
| 9 | 0.02 ± 0.02 a | 0.04 ± 0.03 a | 0.10 ± 0.02 a | 0.13 ± 0.09 a | 0.15 ± 0.11 a | 0.37 ± 0.38 a | 0.02 ± 0.01 a | 0.01 ± 0.01 a | 0.04 ± 0.03 a | 0.05 ± 0.02 a |
| 10 | 0.99 ± 0.26 a | 1.57 ± 0.80 a | 0.26 ± 0.14 b | 0.79 ± 0.32 a | 0.44 ± 0.20 b | 0.89 ± 0.30 a | 0.46 ± 0.21 a | 1.04 ± 0.51 a | 0.02 ± 0.02 a | 0.02 ± 0.02 a |
| 11 | 1.83 ± 0.23 a | 1.82 ± 0.50 a | 0.66 ± 0.45 a | 1.11 ± 0.44 a | 0.77 ± 0.53 b | 1.48 ± 0.40 a | 0.61 ± 0.42 b | 1.49 ± 0.43 a | 0.05 ± 0.04 a | 0.06 ± 0.04 a |
| 12 | 0.48 ± 0.26 a | 0.54 ± 0.15 a | 0.22 ± 0.12 b | 0.25 ± 0.08 a | 0.19 ± 0.07 b | 0.44 ± 0.10 a | 0.14 ± 0.06 a | 0.24 ± 0.15 a | 0.05 ± 0.03 a | 0.04 ± 0.01 a |
| 13 | 0.18 ± 0.12 a | 0.05 ± 0.03 b | 0.09 ± 0.06 b | 0.20 ± 0.09 a | 0.03 ± 0.01 b | 0.08 ± 0.04 a | 0.07 ± 0.04 a | 0.09 ± 0.04 a | 0.12 ± 0.04 a | 0.13 ± 0.05 a |
| 14 | 1.73 ± 0.29 a | 1.54 ± 0.28 a | 0.29 ± 0.20 b | 1.00 ± 0.52 a | 0.66 ± 0.48 b | 1.27 ± 0.39 a | 0.99 ± 0.33 b | 1.76 ± 0.48 a | 0.04 ± 0.04 a | 0.06 ± 0.04 a |
| 15 | 0.40 ± 0.10 a | 0.24 ± 0.35 a | 0.16 ± 0.11 a | 0.18 ± 0.11 a | 0.27 ± 0.30 a | 0.23 ± 0.17 a | 0.67 ± 0.61 a | 0.08 ± 0.05 b | 0.02 ± 0.01 b | 0.04 ± 0.04 a |
| 16 | 0.05 ± 0.04 a | 0.06 ± 0.04 a | 0.03 ± 0.02 a | 0.03 ± 0.02 a | 0.03 ± 0.02 a | 0.04 ± 0.04 a | 0.11 ± 0.08 a | 0.11 ± 0.10 a | 0.02 ± 0.01 a | 0.01 ± 0.01 a |
| 17 | 1.02 ± 0.20 a | 1.05 ± 0.18 a | 0.44 ± 0.29 a | 0.79 ± 0.35 a | 0.75 ± 0.31 a | 0.92 ± 0.25 a | 0.75 ± 0.30 a | 0.88 ± 0.21 a | 0.06 ± 0.03 a | 0.09 ± 0.04 a |
| 18 | 1.96 ± 0.52 a | 1.93 ± 0.57 a | 0.99 ± 0.53 a | 1.43 ± 0.38 a | 1.04 ± 0.14 b | 1.25 ± 0.19 a | 1.59 ± 0.62 a | 1.46 ± 0.54 a | 0.87 ± 0.76 a | 1.38 ± 0.85 a |
| 19 | 4.26 ± 1.53 a | 4.29 ± 1.50 a | 3.23 ± 0.95 a | 3.68 ± 1.46 a | 2.92 ± 0.50 a | 4.06 ± 1.35 a | 3.56 ± 1.38 a | 3.96 ± 1.40 a | 1.11 ± 1.26 a | 0.76 ± 0.49 a |
| 20 | 1.7 ± 0.86 a | 0.96 ± 0.44 a | 1.43 ± 0.63 a | 1.10 ± 0.56 a | 1.58 ± 0.33 a | 1.19 ± 0.61 a | 0.85 ± 0.45 a | 0.51 ± 0.31 a | 0.34 ± 0.29 a | 0.37 ± 0.25 a |
| 21 | 0.90 ± 0.51 a | 1.08 ± 0.54 a | 0.67 ± 0.29 a | 0.64 ± 0.34 a | 0.54 ± 0.23 a | 0.76 ± 0.56 a | 0.77 ± 0.37 a | 1.16 ± 0.68 a | 0.41 ± 0.29 a | 0.39 ± 0.33 a |
| 22 | 0.95 ± 0.61 a | 0.71 ± 0.52 a | 1.00 ± 0.60 a | 1.01 ± 0.73 a | 0.99 ± 0.54 a | 1.20 ± 0.98 a | 0.63 ± 0.54 a | 0.61 ± 0.42 a | 0.29 ± 0.30 a | 0.35 ± 0.34 a |
| 23 | 0.27 ± 0.20 a | 0.18 ± 0.12 a | 0.27 ± 0.13 a | 0.59 ± 0.48 a | 0.30 ± 0.12 a | 0.37 ± 0.25 a | 0.39 ± 0.32 a | 0.25 ± 0.23 a | 0.09 ± 0.07 a | 0.07 ± 0.05 a |
| 24 | 0.63 ± 0.38 a | 0.47 ± 0.19 a | 0.38 ± 0.17 a | 0.54 ± 0.18 a | 0.34 ± 0.10 a | 0.37 ± 0.23 a | 0.38 ± 0.27 a | 0.39 ± 0.19 a | 0.14 ± 0.05 a | 0.17 ± 0.08 a |
| 25 | 1.36 ± 0.32 a | 1.62 ± 0.60 a | 0.97 ± 0.55 a | 1.33 ± 0.60 a | 0.94 ± 0.18 a | 1.30 ± 0.56 a | 1.39 ± 0.84 a | 1.47 ± 0.85 a | 0.37 ± 0.24 a | 0.48 ± 0.45 a |
| 26 | 0.19 ± 0.05 a | 0.17 ± 0.06 a | 0.30 ± 0.35 a | 0.45 ± 0.38 a | 0.25 ± 0.12 a | 0.38 ± 0.20 a | 0.29 ± 0.33 a | 0.25 ± 0.17 a | 0.36 ± 0.27 a | 0.26 ± 0.19 a |
3.2. Effect of processing on protein structure
![[double bond, length as m-dash]](https://www.rsc.org/images/entities/char_e001.gif) O stretching, and partly reflected the C–N stretching and N–H in-plane bending of peptide groups. The exact location of this peak is dependent on the secondary structure of the polypeptide chain, which can be used to estimate the protein secondary structure.25 Previous studies have shown a good relationship between the amide I peak and the amount of protein secondary structures.19 Generally, the amide I peak mainly consists of overlapping α-helices, β-sheets, β-turns, and random coil structures.
O stretching, and partly reflected the C–N stretching and N–H in-plane bending of peptide groups. The exact location of this peak is dependent on the secondary structure of the polypeptide chain, which can be used to estimate the protein secondary structure.25 Previous studies have shown a good relationship between the amide I peak and the amount of protein secondary structures.19 Generally, the amide I peak mainly consists of overlapping α-helices, β-sheets, β-turns, and random coil structures.As shown in Fig. 3a, the emulsion-type sausage had a significantly higher α-helix content and lower β-sheet, β-turn, and random coil contents than cooked pork (P < 0.05). There were no significant differences among other products. This indicated that the gelling structure formed in the emulsion-type sausage after chopping and subsequent heating could form a compact structure.26 However, Liu et al.6 reported a slight increase in β-sheets or random coils and decrease in α-helices in salted and heated pork paste, as compared with raw pork paste. This might be due to the raw pork in the present study not being homogenized, which indicated the importance of chopping in emulsion-sausage preparation. Compared with raw pork, cooked pork showed lower α-helix and higher β-sheet, β-turn, and random coil contents, although these differences were not significant. This result indicated that moderate denaturation and unfolding occurred in meat proteins during cooking at 72 °C. Previous studies have shown that increasing the cooking temperature from 50 °C to 70 °C decreased the α-helix content but increased the β-sheet and random coil content.27 As cooking temperature and time increased, stewed pork showed increased α-helix content, but decreased β-sheet and random coil contents, compared with cooked pork. High temperatures caused protein aggregation,22 while the liberation of bound water from random coil peptide-carbonyl groups was related to the formation of β-sheets upon heating at high temperatures.13 Dehydration, oxidation, and aggregation can occur during the preparation of dry-cured pork.
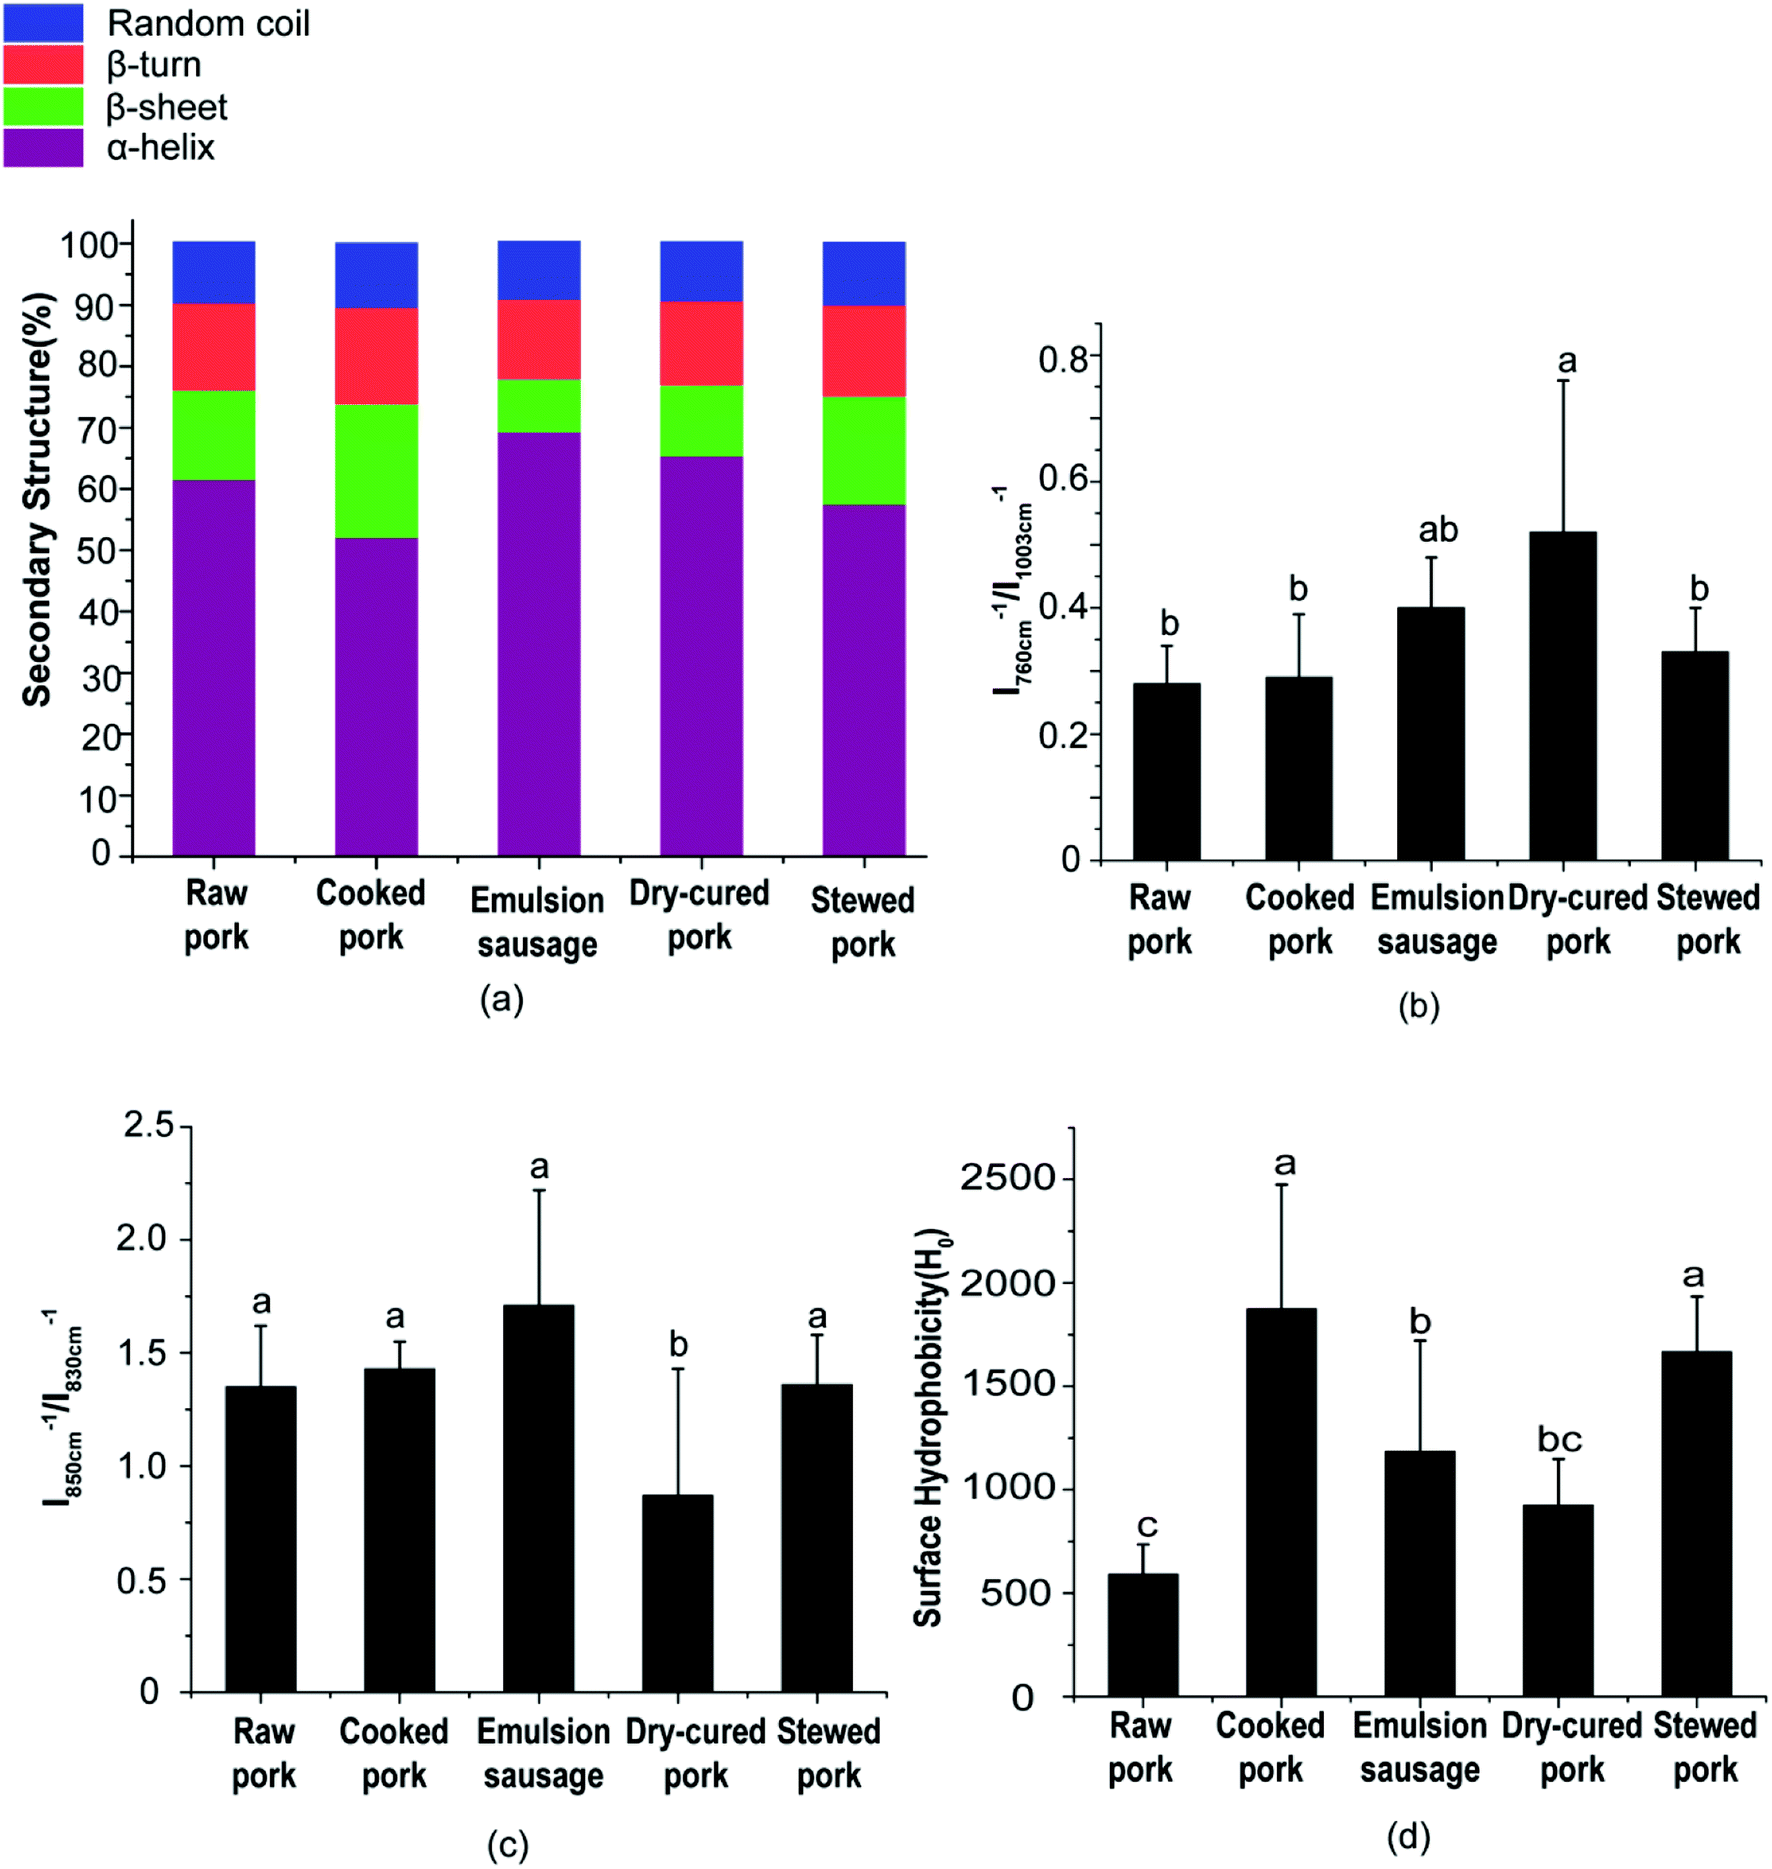 | ||
| Fig. 3 (a) Protein secondary structure, (b) tryptophan residues, (c) tyrosine residues, and (d) surface hydrophobicity of pork products. Different letters (a, b, c) indicate significant differences (P < 0.05). | ||
Aromatic amino acid side chains showed several characteristic Raman peaks, suggesting changes in the polarity of the microenvironment, the formation of hydrogen bonds, and modification of the protein tertiary structure. For example, the tryptophan residue band near 760 cm−1 showed a decrease in intensity (Table S3†) when exposed from a buried hydrophobic microenvironment to a polar aqueous solvent.28 In the present study, the peak at 760 cm−1 had a significantly higher relative intensity in dry-cured pork than in any other products (P < 0.05, Fig. 3b). This indicated a change in Trp residues from moderate exposure to a buried hydrophobic microenvironment.17
Tyrosine (Tyr) ring vibrations were located at 850 and 830 cm−1 (Table S3†), with the intensity ratio (I850/I830) related to Tyr residues that were exposed or buried.29 As the I850/I830 ratio increases, the number of exposed tyrosine residue increases. The I850/I830 ratio is a good indicator of the state of hydrogen bonds and ionization in the phenolic hydroxyl group.29 As shown in Fig. 3c, the I850/I830 ratio of dry-cured pork was the lowest (P < 0.05, Fig. 3c). No significant difference was observed in the I850/I830 ratio between any two other groups (P > 0.05, Fig. 3c). This result was consistent with the behavior of Trp.
Considering the changes in secondary and tertiary structures during processing, proteins in cooked pork and stewed pork were disrupted and had a loose conformation with more exposed hydrophobic groups compared with raw pork. However, the proteins in stewed pork became aggregated under the long-term high-temperature heat treatment. In emulsion-type sausage, proteins had tighter conformations with increased α-helix content and decreased β-sheet, β-turn, and random coil contents, which might be due to gel network formation after chopping and subsequent heating. The gel network was mainly formed of intermolecular links, including hydrophobic interactions and disulfide bonds, which agreed with the changes in tyrosine, tryptophan, and hydrophobic group contents. In dry-cured pork, the high α-helix content and low β-sheet, β-turn, and random coil contents were partially due to disulfide bonds, but might also be caused by abundant carbonyl groups reacting with an aldehyde moiety from another protein-bound carbonyl residue to form an aldol condensation product or with an amino group from a neighboring protein-bound amino acid (mainly lysine) to form a covalent bond via a Schiff base.31
3.3. Effect of processing on in vitro protein digestion
As shown above, processing induced the formation of disulfide bonds and altered the protein structures. To explore whether the structural changes caused by disulfide bonds affected protein digestion, LC-MS/MS was used to identify the digestion products of proteins before and after DTT treatment. To achieve the original protein structure, SDS buffer solution was replaced with Tris–HCl before trypsin digestion. The peptides identified are listed in Table S4 and S5.† PLS-DA showed significant differences in peptide compositions and abundance among different pork products. Peptides from raw pork and dry-cured pork were well separated from the other three groups in the untreated samples (Fig. 4a). This indicated that processing affected the digestion of pork proteins. Furthermore, peptides from raw pork and stewed pork were well separated from the other three groups in DTT-treated samples (Fig. 4b), which indicated that the extent of disulfide bonding differed depending on the processing method used. To investigate differences in digestion products during processing, proteins in pork products were normalized using raw pork in heat maps.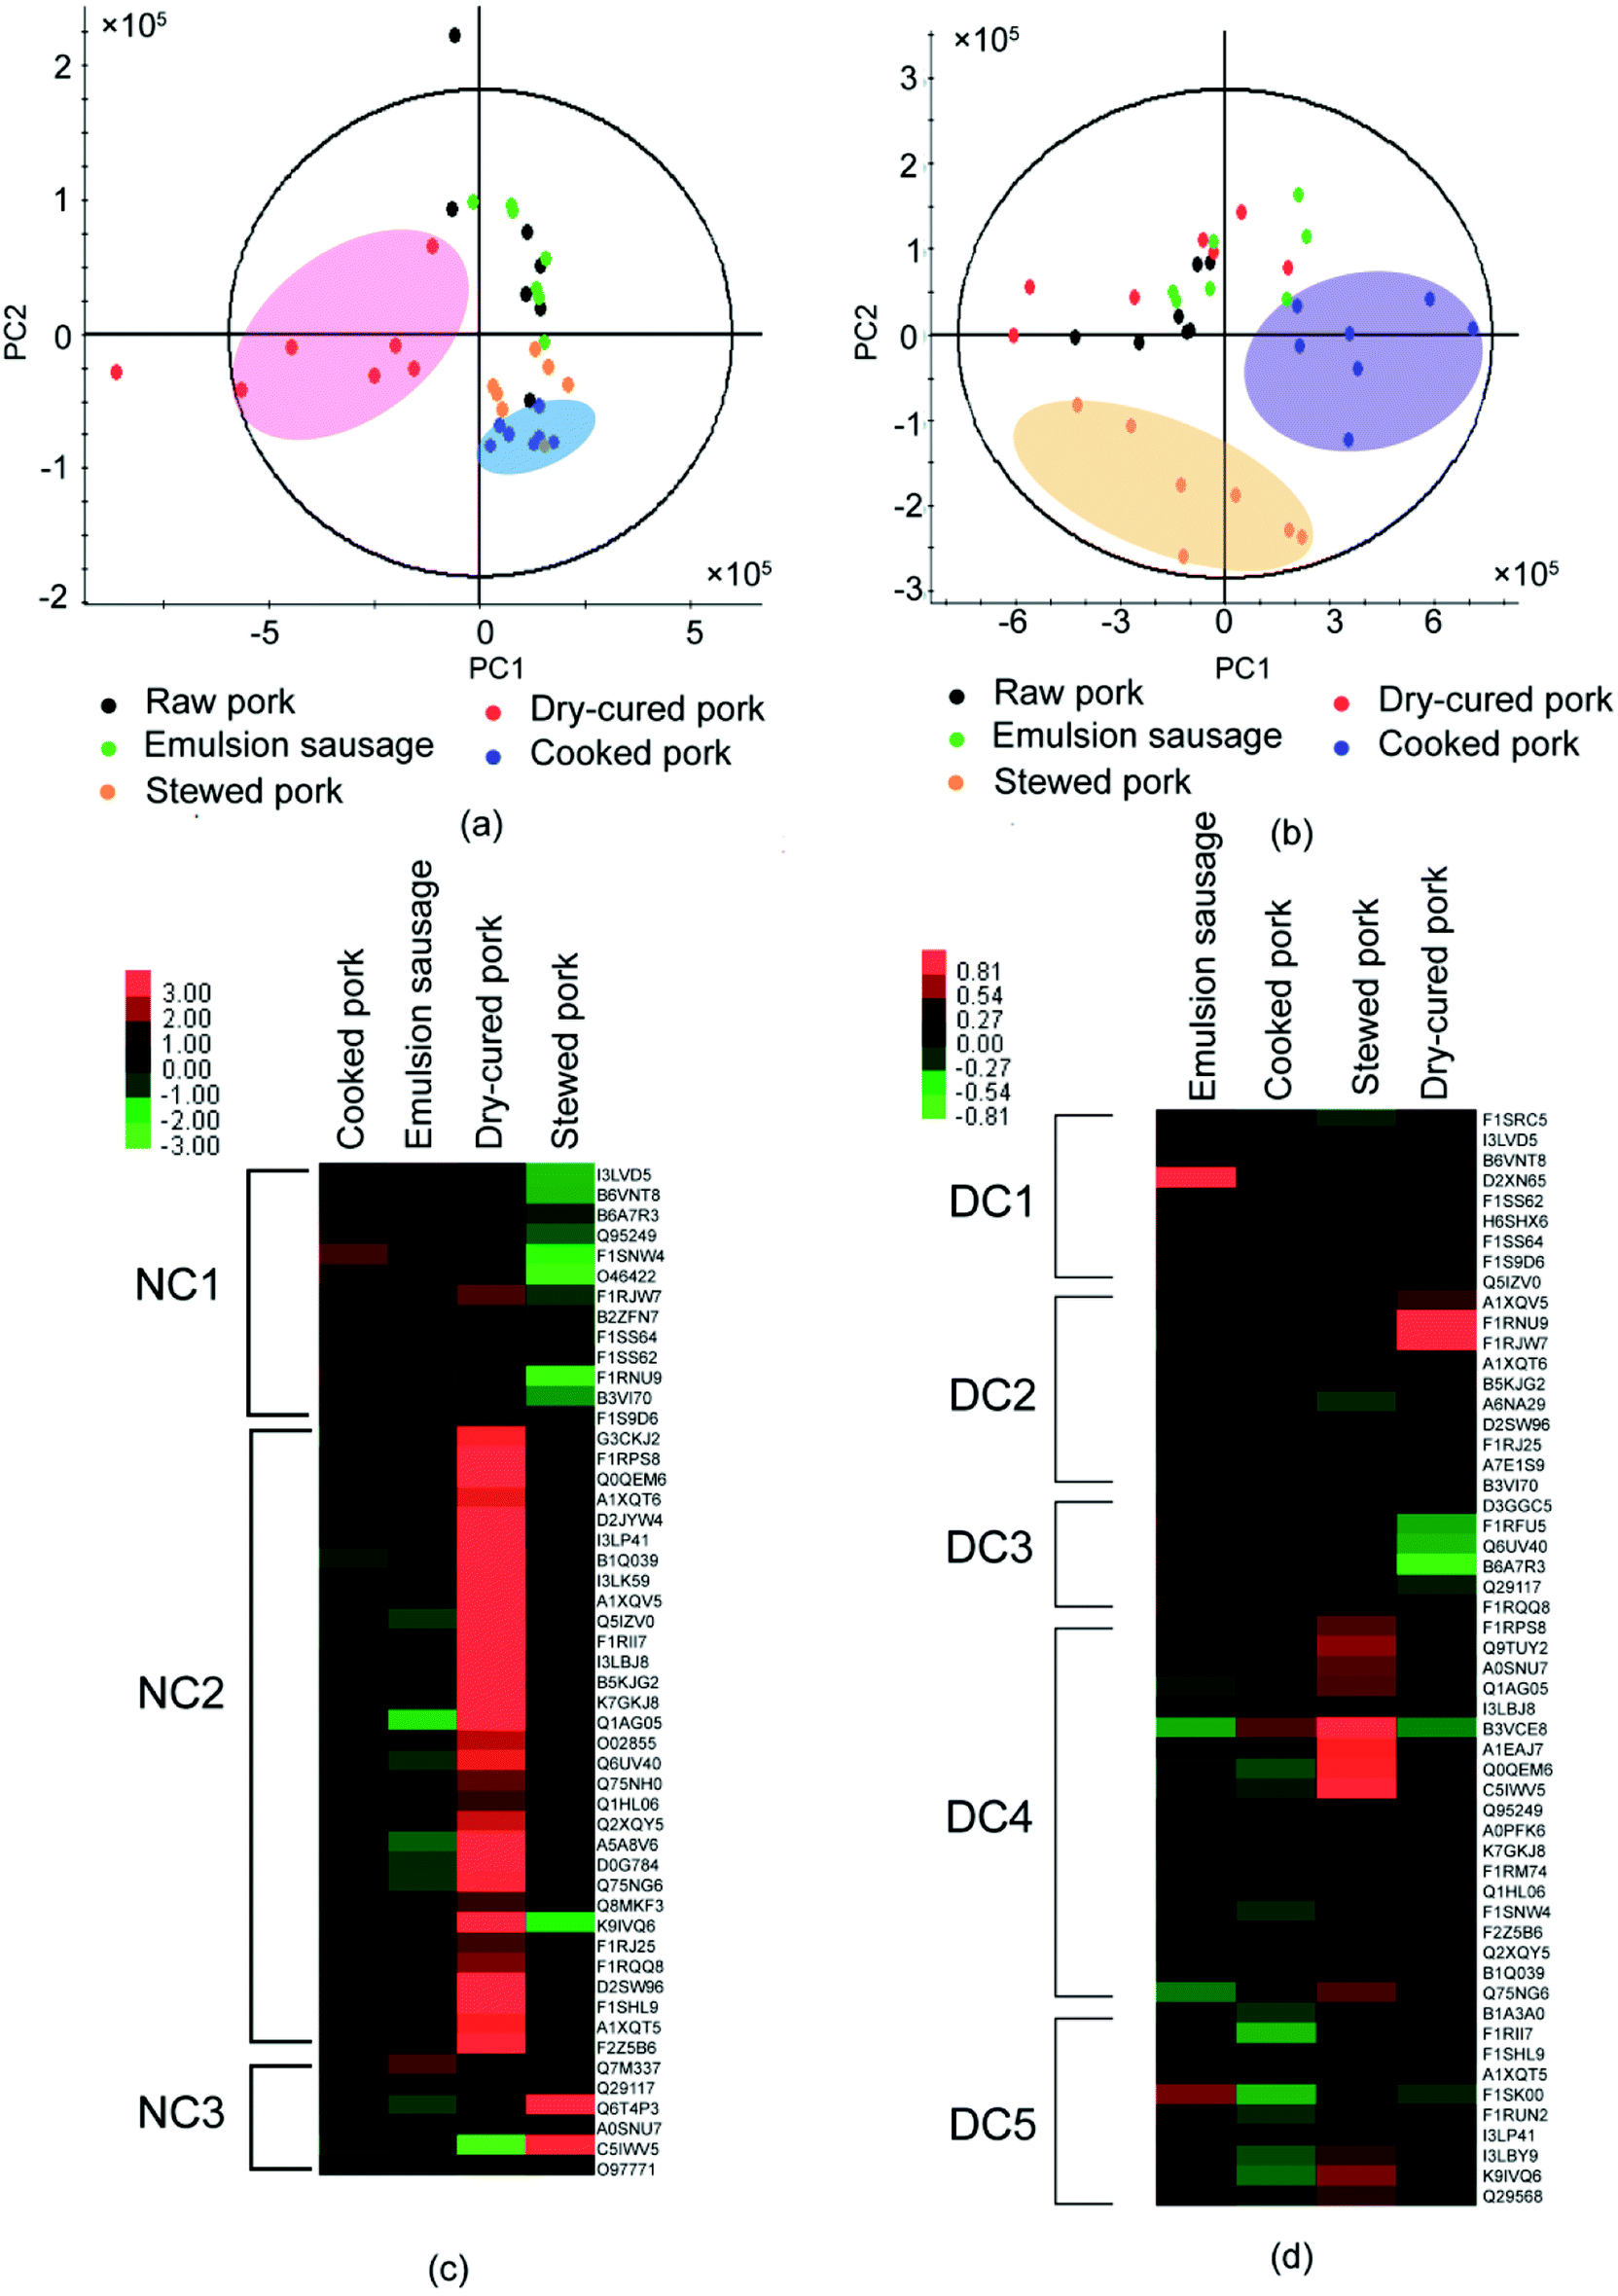 | ||
| Fig. 4 Heat maps and PLS-DA plots of peptides from different pork products. (a) PLS-DA plots of peptides after trypsin treatment without DTT, and (b) with DTT. (c) Heat map of hierarchical clustering analysis of digested meat proteins without DTT treatment; columns correspond to individual samples and rows correspond to proteins identified from the peptides; the three clusters corresponding to proteins are denoted NC1, NC2, and NC3. (d) Heat map of hierarchical clustering analysis of digested meat proteins with DTT treatment; columns correspond to individual samples and rows correspond to proteins identified from the peptides; the five clusters corresponding to proteins treated with DTT are denoted DC1, DC2, DC3, DC4, and DC5. | ||
Fifty common proteins (excluding the uncharacterized proteins) were present in the digestion products of the untreated samples (Table S6† & Fig. 4c). As shown in Fig. 4c, after trypsin digestion, the identified proteins were divided into three regions according to clustering analysis (Table S6† & Fig. 4c). Most proteins involved in cluster NC1 were myofibrillar proteins. Myofibrilar proteins from stewed pork were the least digested, while those from cooked pork and dry-cured pork were well digested. In cluster NC2, more sarcoplasmic proteins were identified. These proteins were the least digested from emulsion-type sausage, but well-digested from dry-cured pork. Highly-abundant proteins were identified in both clusters from dry-cured pork. Therefore, dry-cured pork gave the largest amount of peptides detected among digestion products relative to the other pork samples.
After trypsin digestion, 53 common proteins (excluding uncharacterized proteins) were identified from DTT-treated samples (Table S7† & Fig. 4d). DTT treatment increased protein digestion. These proteins were divided into five components according to clustering analysis (Table S7† & Fig. 4d). DTT treatment destroyed the disulfide bonds and unfolded the protein structures, which induced the exposure of more cleavage sites to trypsin. In cluster DC1, myofibrillar proteins, in particular myosin, accounted for the majority of digested peptides. Emulsion-type sausage gave the highest amount of peptides, which might be due to the disruption of disulfide bonds. In clusters DC2, DC3, DC4, and DC5, the digested products of proteins from emulsion-type sausage and dry-cured pork had opposite tendency, while proteins from emulsion-type sausage were well digested, proteins from dry-cured pork were least digested, which was probably due to the processing method.
The comparison of digested products among samples indicated that dry-cured pork and cooked pork proteins were highly digested prior to DTT treatment, while stewed pork was highly digested after DTT treatment, with DTT treatment only improving the digestion of myofibrillar proteins in emulsion-type sausage. This indicated that few disulfide bonds were formed in the dry-cured pork and cooked pork, while abundant disulfide bonds were formed in stewed pork. Meanwhile, in emulsion-type sausage, a small amount of disulfide bonds were formed among myofibrillar proteins. The dry-cured pork proteins being highly digested before DTT treatment might be attributed to the loose structures of myofibrillar proteins in high-ionic strength environments, owing to electrostatic repulsion, being more susceptible to digestion.4 Therefore, processing did affect protein digestion. However, Li et al.7 reported that stewed pork had the lowest protein digestibility after pepsin digestion alone, or when followed by trypsin digestion, but emulsion-type sausage showed the highest digestibility under both conditions. The differences found in the results of our study might be due to the different procedures used, with Li et al.7 digesting proteins in the meat directly. The textural components of meat might affect their protein digestibility.
The highly abundant peptides were observed to come mainly from several myofibrillar proteins (myosin, actin, tropomyosin, and titin) and sarcoplasmic proteins (phosphorylase, glyceraldehyde-3-phosphate dehydrogenase, creatine kinase, and 6-phosphofructokinase). To explore the effect of processing on the digestion pattern of proteins, we localized identified sequences to the intact protein sequence chains. An example of myosin heavy chain (myosin-2) is shown in Tables S8 and S9.† Large changes were observed by comparing peptide locations before and after DTT treatment (Tables S8 & S9†). The peptides in positions 16–20 were not detected in the DTT-untreated samples but were detectable in the DTT-treated samples. Peptides in positions 33–35 and 47–49 were not detected in the DTT-treated samples but were detectable in the DTT-untreated samples. This indicated that breakage of the disulfide bonds by DTT altered the protein cleavage sites.
In general, processing did affect the digestion products compared with raw pork. Furthermore, processing affected the formation of disulfide bonds, which might result in buried or exposed cleavage sites and alter the digestion products of the different meat products.
Although processing had a significant impact on disulfide bond formation, structural changes, and protein digestion, the behavior of proteins from different muscle sources after processing might be different. The disulfide bonds of chicken breast meat and rabbit skeletal muscle have been reported to increase, with a decrease in sulfhydryl groups, in a temperature-dependent or time-dependent manner.32,33 Furthermore, the surface hydrophobicity of myofibrillar proteins in both beef and rabbit skeletal muscle has been shown to significantly increase after cooking, with aggregation observed only after heating at temperatures of 75 °C or higher.2,33 The behaviors of different kinds of muscles after cooking are consistent. However, the behaviors of muscles from other animals after salting were different. With increasing salt concentration, it has been reported that salted pike eel and cod show decreased total protein SH contents,34,35 increased surface hydrophobicity, reduced α-helices and β-sheets, and increased random coils.34 In contrast, the SH content and surface hydrophobicity of myofibrillar proteins in beef were not affected by NaCl concentration,36 which is not consistent with the present results. These results might be caused by short salting time (12, 48, and 20 h, respectively) and the lack of sun-drying procedure. The gelation properties were also affected by the muscle source. Chan et al. studied the gel-forming abilities of cod, herring, and silver hake, finding significant differences among the three fish species.37 Furthermore, a study of the gelation properties of chicken and turkey (white and red) muscle myofibrils indicated that gels formed by red muscle were weaker than those formed by white muscle.38 However, Cofrades et al. investigated the thermal gelation properties of chicken, pork, and hake actomyosin and found no significant difference in the maximum gel strength among the three species unless the pH level, NaCl concentration, and protein concentration were different.39
The in vitro digestibility of meat proteins is also significantly different among muscle species. Wen et al. reported that the digestibility of pork and fish was significantly greater than that of beef after cooking under the same conditions,40 and that different pork cuts also affected the digestibility. Zou et al. found that biceps femoris muscle showed higher susceptibility to digestion compared with trapezius and longissimus dorsi muscles in pork.41 Moderate cooking, such as 15–20 g of bovine longissimus dorsi cooked at 72 °C for 20 min, typically improved the in vitro gastrointestinal digestibility,42 but an important decrease in the pepsin activity on myofibrillar proteins of beef was observed after overheating (100 °C).2 A significant decrease in protein digestibility has also been observed during Cantonese sausage processing,9 which was consistent with the results of the present study. The digestibility of oxidized myosin decreased,43 which indicated that the oxidation conditions could affect protein digestion.
4. Conclusions
Processing had a significant effect on the disulfide bond formation, structure, and digested products of meat proteins. Cooking at lower temperatures induced protein denaturation and reduced disulfide bond formation, which caused the meat proteins to form looser structures and become more susceptible to digestion. However, high-temperature and long-term cooking led to protein aggregation due to higher disulfide bond contents. The gel network formed after chopping, and subsequent heating led to reduced susceptibility to digestion. The structure of the gel network was stabilized mainly by hydrophobic interactions and disulfide bonding. Few disulfide bonds were formed, but other types of interactions, such as Schiff bases, were likely induced, resulting in a more compact conformation of proteins during curing. However, the structures of myofibrils were initially disrupted in a high-ionic-strength environment and could be susceptible to digestion. The protein structures were affected differently by processing conditions owing to the formation of disulfide bonds. These changes in proteins structures altered the accessibility of proteolytic enzymes to the cleavage sites, thereby causing changes in the digestion products.Conflicts of interest
There are no conflicts to declare.Acknowledgements
This work was supported by the National Natural Science Foundation of China (31530054), the modern agricultural industry technology system (CARS35), the Priority Academic Program Development of Jiangsu Higher Education Institutions (PADP) and Overseas Expertise Introduction Center for Discipline Innovation(“111 Center”) On Quality & Safety Control and Nutrition of Muscle Food. We especially thank Ronald Keith Tume at Commonwealth Scientific and Industrial Research Organisation for providing suggestions for this experiment.References
- P. Gatellier, A. Kondjoyan, S. Portanguen and V. Santé-Lhoutellier, Meat Sci., 2010, 85, 645–650 CrossRef PubMed.
- V. Santé-Lhoutellier, T. Astruc, P. Marinova, E. Greve and P. Gatellier, J. Agric. Food Chem., 2008, 56, 1488–1494 CrossRef PubMed.
- R. Liu, S. M. Zhao, B. J. Xie and S. B. Xiong, Food Hydrocolloids, 2011, 25, 898–906 CrossRef.
- O. P. Soladoye, M. L. Juárez, J. L. Aalhus, P. Shand and M. Estévez, Compr. Rev. Food Sci. Food Saf., 2015, 14, 106–122 CrossRef.
- H. G. Lee and T. C. Lanier, J. Muscle Foods, 1995, 6, 125–138 CrossRef.
- Z. Liu, Y. L. Xiong and J. Chen, J. Agric. Food Chem., 2011, 59, 13026–13034 CrossRef PubMed.
- L. Li, Y. Liu, X. Y. Zou, J. He, X. L. Xu, G. H. Zhou and C. B. Li, Food Res. Int., 2017, 92, 88–94 CrossRef PubMed.
- S. Y. Wen, G. H. Zhou, L. Li, X. L. Xu, X. B. Yu, Y. Bai and C. B. Li, J. Agric. Food Chem., 2015, 63, 250–261 CrossRef PubMed.
- W. Z. Sun, M. M. Zhao, B. Yang, H. F. Zhao and C. Cui, Meat Sci., 2011, 88, 462–467 CrossRef PubMed.
- A. Berardo, B. Devreese, H. De Maere, D. A. Stavropoulou, R. G. Van, F. Leroy and S. De Smet, Food Chem., 2017, 221, 1322–1332 CrossRef PubMed.
- V. Santé-Lhoutellier, L. Aubry and P. Gatellier, J. Agric. Food Chem., 2007, 55, 5343–5348 CrossRef PubMed.
- S. Traore, L. Aubry, P. Gatellier, W. Przybylski, D. Jaworska, K. Kajak-Siemaszko and V. Santé-Lhoutellier, Meat Sci., 2012, 91, 14–21 CrossRef PubMed.
- R. C. Gao, X. P. Feng, W. W. Li, L. Yuan, J. Ge, D. L. Lu, B. Chen and G. Yu, Food Sci. Biotechnol., 2016, 25, 21–26 CrossRef.
- C. G. Zarkadas and S. A. Maloney, J. Poultry Sci., 1998, 77, 770–779 CrossRef PubMed.
- K. Maeda, C. Finnie and B. Svensson, Biochem. J., 2004, 378, 497–507 CrossRef PubMed.
- Y. L. Xiong, D. Park and T. Ooizumi, J. Agric. Food Chem., 2009, 57, 153–159 CrossRef PubMed.
- X. L. Xu, M. Y. Han, Y. Fei and G. H. Zhou, Meat Sci., 2011, 87, 159–164 CrossRef PubMed.
- E. C. Y. Li-Chan and S. Nakai, J. Agric. Food Chem., 1911, 39, 1238–1245 CrossRef.
- A. J. P. Alix, G. Pedanou and M. Berjot, J. Mol. Struct., 1988, 174, 159–164 CrossRef.
- N. A. Mustapha, K. Ruttarattanamongkol and S. Rizvi, Food Res. Int., 2012, 48, 470–477 CrossRef.
- J. S. Philo and T. Arakawa, Curr. Pharm. Biotechnol., 2009, 10, 348–351 Search PubMed.
- M. L. Bax, L. Aubry, C. Ferreira, J. D. Daudin, P. Gatellier, D. Rémond and V. Santé-Lhoutellier, J. Agric. Food Chem., 2012, 60, 2569–2576 CrossRef PubMed.
- E. A. Foegeding, C. E. Allen and W. R. Dayton, J. Food Sci., 1986, 51, 104–108 CrossRef.
- A. M. Herrero, Crit. Rev. Food Sci. Nutr., 2008, 48, 512–523 CrossRef PubMed.
- M. Bouraoui, S. Nakai and E. C. Y. Li-Chan, Food Res. Int., 1997, 30, 65–72 CrossRef.
- B. C. Paterson, F. C. Parrish Jr and M. H. Stromer, J. Food Sci., 1988, 53, 1258–1265 CrossRef.
- D. T. Berhe, S. B. Engelsen, M. S. Hviid and R. Lametsch, Food Res. Int., 2014, 66, 123–131 CrossRef.
- E. C. Y. Li-Chan, Trends Food Sci. Technol., 1996, 7, 361–370 CrossRef.
- K. Li, Y. Y. Zhao, Z. L. Kang, P. Wang, M. Y. Han, X. L. Xu and G. H. Zhou, J. Poultry Sci., 2015, 94, 111–122 CrossRef PubMed.
- Y. Y. Cao, T. L. Xia, G. H. Zhou and X. L. Xu, Innovative Food Sci. Emerging Technol., 2012, 16, 41–46 CrossRef.
- D. R. Eyre, M. A. Paz and P. M. Gallop, Annu. Rev. Biochem., 1984, 53, 717–748 CrossRef PubMed.
- C. Cui, X. S. Zhou, M. M. Zhao and B. Yang, Innovative Food Sci. Emerging Technol., 2009, 10, 37–41 CrossRef.
- A. Promeyrat, J. D. Daudin and P. Gatellier, Food Chem., 2013, 138, 581–589 CrossRef PubMed.
- J. L. Si, J. Q. Zheng, H. Li and Y. L. Zhang, J. Appl. Ichthyol., 2015, 31, 767–770 CrossRef.
- M. V. Nguyen, K. A. Thorarinsdottir, A. Gudmundsdottir, G. Thorkelsson and S. Arason, Food Chem., 2011, 125, 1013–1019 CrossRef.
- D. Sharedeh, P. Gatellier, T. Astruc and J. D. Daudin, Meat Sci., 2015, 110, 24–31 CrossRef PubMed.
- J. K. Chan, T. A. Gill and A. T. Paulson, J. Food Sci., 1992, 57, 906–912 CrossRef.
- X. D. Sun and R. A. Holley, Compr. Rev. Food Sci. Food Saf., 2011, 10, 33–51 CrossRef.
- S. Cofrades, M. Careche, J. Carballo and F. Jimknez Colmenero, Meat Sci., 1997, 47, 157–166 CrossRef PubMed.
- S. Wen, G. H. Zhou, S. X. Song, X. L. Xu, J. Voglmeir, L. Liu, F. Zhao, M. J. Li, L. Li, X. B. Yu, Y. Bai and C. B. Li, J. Proteomics, 2015, 15, 3688–3698 CrossRef PubMed.
- X. Y. Zou, G. H. Zhou, X. B. Yu, Y. Bai, C. Wang, X. L. Xu, C. Dai and C. B. Li, Food Res. Int., 2018, 106, 344–353 CrossRef PubMed.
- M. M. Farouk, G. Wu, D. A. Frost, S. Clerens and S. O. Knowles, Food Funct., 2014, 5, 2759–2767 Search PubMed.
- G. Liu and Y. L. Xiong, J. Agric. Food Chem., 2000, 48, 624–630 CrossRef PubMed.
Footnote |
| † Electronic supplementary information (ESI) available. See DOI: 10.1039/c8ra02310g |
| This journal is © The Royal Society of Chemistry 2018 |