 Open Access Article
An alternative method to enhance w/o emulsion stability using modified dimer acid and its application in oil based drilling fluids
Xianbin Huang *,
Jinsheng Sun,
Kaihe Lv,
Jingping Liu and
Haokun Shen
Department of Petroleum Engineering, China University of Petroleum (East China), Qingdao, Shandong 266580, P. R. China. E-mail: 634640236@qq.com; Tel: +8615621081336
First published on 23rd July 2018
Abstract
This study presents an alternative method to enhance the emulsion stability of oil based drilling fluids (OBMs). Modified dimer acid (MDA) was synthesized with a molecular structure having two hydrophilic heads and two hydrophobic tails. Theoretically, the adsorption of MDA on an oil–water interface makes it possible to increase hydrogen bonding between water droplets and form three dimensional networks which benefit emulsion stability. The influence of MDA on the stability of base emulsions was studied by visual observation. Then the stabilization mechanism of MDA was analyzed from the micro and macro points of view by morphology study using a cryo-scanning electron microscope (cryo-SEM) and rheological measurements including viscosity vs. shear rates, zero-shear viscosity (η0), and creep and recovery tests. Experimental results showed that a substantial improvement in emulsion stability was visually observed when the MDA concentration was 2 g L−1. From cryo-SEM observation, a honeycomb structure was observed in the emulsion containing 2 g L−1 MDA, which can provide a physical barrier to restrain the movement of water droplets. In comparison with the rheological behaviors of the emulsion without MDA, a remarkably larger zero-shear viscosity, a solid-like behavior and a greater elasticity were observed when 2 g L−1 MDA was present. Finally, the application in OBMs shows that MDA can largely enhance electrical stability (ES) and reduce the filtration volume. The method proposed in the paper could be used to enhance the stability of w/o emulsions in a variety of fields.
1. Introduction
During drilling of subterranean oil and gas resources, drilling fluid1 plays an important role in carrying drill cuttings, lubricating and cooling drill bits, balancing formation pressure, etc. Oil based drilling fluids (OBMs) also known as invert emulsion drilling fluids, typically consisting of an internal water phase, continuous oil phase, emulsifiers, fluid loss additives and weighting materials, are often used in the drilling of deep wells, high temperature wells, shale gas wells, and horizontal and complicated wells for their superior performances1 over water based drilling fluids. Emulsion stability is the basis to obtain other functional properties of OBMs. OBMs are typically formulated using two kinds of emulsifiers to achieve a better stability: primary emulsifiers (e.g. calcium soaps) and secondary emulsifiers (e.g. polyamides). OBMs do not easily lose emulsion stability during normal drilling operations due to continuous shearing and stirring. However, the longer-time emulsion stability is highly demanded when the circulation of OBMs is ceased, such as running or pulling drill pipe into or out of a wellbore that may take days for deep wells.Since emulsions are thermodynamically unstable, various breakdown phenomena2–4 may occur such as creaming and sedimentation, flocculation, coalescence, etc. How to maximize emulsion stability has been intensively studied in various industries, such as food,5,6 cosmetics,7 petroleum development,8 and pharmaceutics.9
The common methods to enhance emulsion stability include use of fine particles8,10 and high-molecular-weight polymers.11,12 Fine particles can stabilize emulsions by providing steric hindrance to drop–drop coalescence and modifying the rheological properties of the interfacial region. It has been demonstrated that fine particles stabilized emulsion, often known as “Pickering emulsion13,14”, can have better stability by the use of partially hydrophobic particles15 with contact angle close to 90°. High-molecular-weight polymers can act as thickeners to increase the viscosity of continuous phase to overcome gravity stress and modify the rheology of emulsions. Specifically, amphiphilic polymers16 can also act as polymeric emulsifiers that can adsorb on the oil–water interface.
The structuring of internal phases using structuring agent17–19 to form three dimensional networks in emulsions has received intensive attention. According to many studies, the network structures are beneficial to achieve better emulsion stability due to enhanced interactions between internal droplets. For example, Eric Dickinson and Karin Pawlowsky20 used a kind of polysaccharide (é-carrageenan) to form a gel-like emulsion network in a protein-stabilized emulsion. Utai Klinkesorn and co-workers21 observed a decrease in creaming rate when studying the influence of maltodextrin on stability of corn-oil-in-water emulsions. The enhancement in emulsion stability is due to network formation of droplets according to his analysis. However, most of previous studies are concentrated on stability of oil in water emulsions. And no reference has been conducted to study the influence of structuring agents on the performance of OBMs.
In this paper, we firstly synthesized the modified dimer acid having two hydrophilic heads and two hydrophobic tails in one molecule. The performance of MDA to enhance emulsion stability was then visually observed using bottle tests. The emulsion stabilizing mechanism was studied on the micro level in terms of morphology and macro level using rheological measurements. Finally, the influence of MDA on the property of OBMs was studied.
2. Experimental section
2.1 Reagents
Octadecadienoic acid dipolymer (OAD, dibasic acid > 98 wt%) was purchased from Jiangxi Aturex Co., Ltd. Diethanolamine (DEA, 99.5 wt%) and sorbitan monooleate (Span 80, 99 wt%) were obtained from Aladdin Company (Shanghai, China). Mineral oil (density = 0.88 g cm−3 at 25 °C, viscosity = 244 mPa s at 20 °C) was purchased from J&K Scientific Company (Beijing, China). Drilling fluid additives include primary emulsifier (modified fatty acid), secondary emulsifier (polyaminated fatty acid), lecithin (soybean lecithin), organo-bentonite (modified natural bentonite with quaternary ammonium salt), and blown asphalt were all obtained from Halliburton Company. Barite (BaSO4, ρ = 4.3 g cm−3) was obtained from Sichuan Zhengrong Company, China.2.2 MDA synthesis
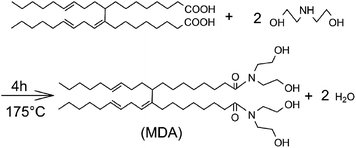
MDA was synthesized as shown in Scheme 1 using OAD and DEA at a mole ratio of 1![[thin space (1/6-em)]](https://www.rsc.org/images/entities/char_2009.gif) :
:![[thin space (1/6-em)]](https://www.rsc.org/images/entities/char_2009.gif) 2.05. The reaction was carried at 175 °C for 4 hours in an oil bath with a continuous stirring rate of 250 rpm. The water generated in the reaction was removed by a Dean–Stark trap.
2.05. The reaction was carried at 175 °C for 4 hours in an oil bath with a continuous stirring rate of 250 rpm. The water generated in the reaction was removed by a Dean–Stark trap.
2.3 Preparation and characterization of base emulsions
The following rheological measurements were performed: viscosity at different shear rates, zero-shear viscosity (η0) measurements, and creep and recovery tests. All the rheological measurements were carried out at 20 °C. The viscosities of the prepared base emulsion samples were measured under different shear rates from 1 s−1 to 200 s−1. A constant stress of 0.1 Pa, which is inside the linear viscoelastic region for all studied emulsion samples, was applied to the following rheological measurements. (1) η0 was measured by oscillation method and approximated as the complex viscosity at 0.001 Hz as recommended in the literature.22 (2) For creep and recovery tests, both the creep time and the recovery time were 2 min.
2.4 Application of MDA in OBMs
| Adding order | Components | Amounts | Function |
|---|---|---|---|
| 1 | Mineral oil | 320 mL | Base oil |
| 2 | Emulsifiers | 14 g | Two emulsifiers |
| 3 | MDA | 0 g, 0.4 g, 0.8 g, 0.12 g, 0.20 g | Structuring agent |
| 4 | Lecithin | 2 g | Wetting agent |
| 5 | Brine | 80 mL | Internal phase |
| 6 | Organo-bentonite | 4 g | Thickener |
| 7 | Blown asphalt | 8 g | Fluid loss additive |
| 8 | CaO | 12 g | pH enhancer |
| 9 | Barite | 856 g | Weighting agent |
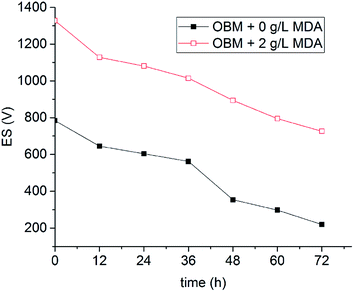
After that, the OBMs containing no MDA (control group) and 2 g L−1 MDA were transferred into two high-temperature aging cells (175 mL) in a roller oven (Model 705ET, FANN). The temperature was set at 150 °C. Roller power was kept closed so the OBMs can be kept static in the oven to simulate the situation when the circulation stops. ES was measured every 12 hours at 50 °C. The concentrations of MDA in Sections 2.4 and 3.6 are based on the sum of oil volume and brine volume in OBMs.
3. Results and discussion
3.1 Three-day stability of emulsions
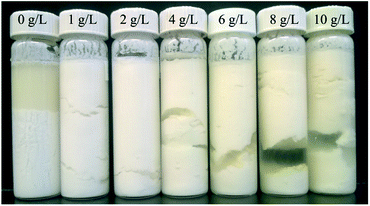
Fig. 1 visualizes the stability of emulsions with different MDA concentrations after the emulsions were let stand for three days. As shown in Fig. 1, the emulsion without MDA (pure emulsion) displayed a very serious sedimentation phenomenon. While the emulsions containing MDA showed a slight sedimentation phenomenon. The optimum emulsion stability was achieved when MDA concentration was 2 g L−1. But when MDA concentration exceeded 2 g L−1, the stability of the emulsions was starting to decline.Flocculation was observed for all the emulsions containing MDA. For pure emulsion + 2 g L−1 MDA, flocculation was weak. This phenomenon could be interpreted in terms of attractive interactions. When MDA concentration was low, attractive interaction was low and flocculation was weak. As MDA concentration increased, the attractive interactions increased, leading to stronger aggregation of the water droplets.
Morphology and rheological tests were conducted to explore the stabilization mechanisms at the optimal MDA concentration from micro and macro perspective in Sections 3.3 and 3.4, respectively.
3.2 Morphology
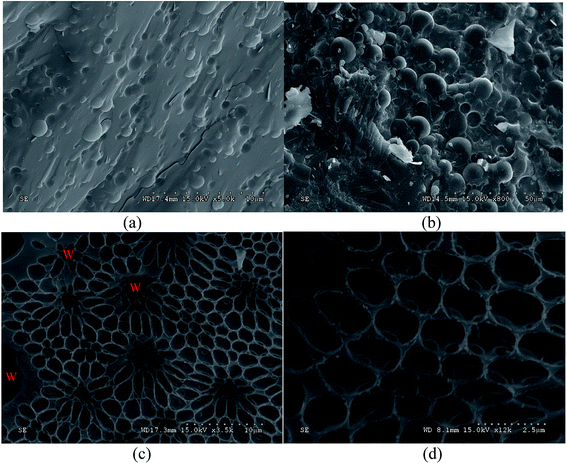
Cryo-SEM was utilized to visualize two emulsion samples: pure emulsion and pure emulsion + 2 g L−1 MDA. Fig. 2 shows the cryo-SEM micrographs of pure emulsion (a) and pure emulsion + 2 g L−1 MDA (b–d). Fig. 2a is the micrograph of pure emulsion where water droplets are embedded in continuous phase, which is similar to the structure of most ordinary emulsions described in many literatures.24,25 The images of Fig. 2b–d were taken from the same freeze-fractured surface of pure emulsion + 2 g L−1 MDA. Fig. 2b has the similar structure to Fig. 2a but with a larger droplet size, one reason of which is that MDA enhance attractions of water droplets and lead to weak flocculation and therefore larger particle size. Both oil and water at the surface of emulsion samples sublimated during sample preparation and SEM observation processes. Water was easier to sublimate than oil. So the sublimation of both oil and water and the heavier sublimation of water made it possible to see the honeycomb structure of continuous phase as shown in Fig. 2c and d. The holes in Fig. 2c are the positions of water droplets before sublimation. For clarity, the distribution of water droplets was depicted in Fig. 2c. However, the honeycomb structure was not observed in freeze-fractured surface of pure emulsion.The honeycomb structure indicates the existence of “gel-like” structures of emulsions as described in many studies.6,26,27 The formation of honeycomb structure in continuous phase needs further explanation because MDA did not affect the viscosity of mineral oil as shown in Section 3.4. On the other hand, as is explained in these studies,6,26,27 the honeycomb structure observed in continuous phase can provide a physical barrier to restrain the movement of internal droplets, which contributes to emulsion stability. Thus, the cryo-SEM results confirmed MDA's contribution in structuring the studied w/o emulsions.
3.3 Rheological measurements
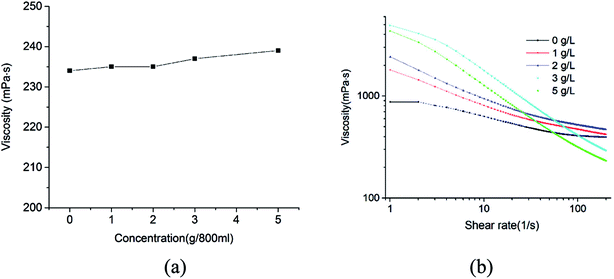
As shown in Fig. 3b, the emulsions containing various amounts of MDA showed a non-newtonian shear-thinning behavior that the viscosity decreased with increasing shear rates. When the shear rates were relatively high (150–200 s−1), the viscosities of the emulsions containing 0–2 g L−1 MDA did not show remarkable changes. During normal drilling process, shear rates in a drill pipe generally encompass the range from 511 s−1 to 1022 s−1, so the effect of MDA (0–2 g L−1) on the high-shear-rate viscosity of drilling fluid is slight. When circulation of drilling fluid is ceased (shear rates approach zero), the viscosities for all the samples are very large, which is beneficial to suspension of water droplets.
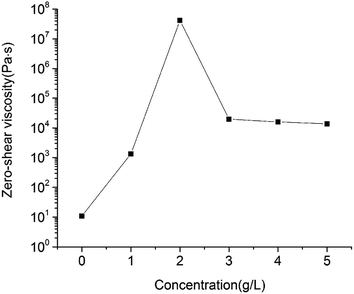
It is well documented that zero-shear viscosity has a good correlation with the rate of sedimentation.28,29 In our study, maximum η0 was remarkably more than 6 orders of magnitude larger than η0 of pure emulsion, which is the reason why stability of pure emulsion + 2 g L−1 was substantially increased compared with that of pure emulsion. The decrease of η0 when MDA concentration exceeded 2 g L−1 could due to the stronger flocculation and less emulsion stability.
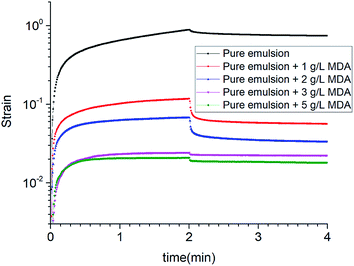 | ||
| Fig. 5 Creep and recovery curves of emulsions with various concentrations of MDA. A constant shear stress of 0.1 Pa was applied for the first two minutes and then removed. | ||
| Emulsion samples | Peak strain | Recovery ratio |
|---|---|---|
| Pure emulsion | 0.88757 | 0.1621 |
| Pure emulsion + 1 g L−1 MDA | 0.11748 | 0.5209 |
| Pure emulsion + 2 g L−1 MDA | 0.06761 | 0.5082 |
| Pure emulsion + 3 g L−1 MDA | 0.02431 | 0.0802 |
| Pure emulsion + 5 g L−1 MDA | 0.02083 | 0.1330 |
During the creep phase, the strain increased over time for all the emulsions. The peak strain decreased remarkably from 0.88757 to 0.02083 as the concentration of MDA increased from 0 to 5 g L−1. In comparison with pure emulsion, other emulsions showed great decreases in peak strain. A lower peak strain indicates a less flexible structure that is harder to deform under the controlled stress. Thus, as the MDA concentration increased, the emulsion samples had a more “solid like” structure.
During recovery phase, the elimination of the stress resulted in decrease in strain. Pure emulsion + 1 g L−1 MDA and pure emulsion + 2 g L−1 MDA had the similar recovery ratios which were much larger than those of the other emulsions. Recovery ratio is an indicator to elastic response. A larger recovery ratio indicates a greater elasticity. But compared with pure emulsion + 1 g L−1 MDA, pure emulsion + 2 g L−1 MDA had a much lower peak strain. So taking into account both peak strain and recovery ratio, it is possible to determine that pure emulsion + 2 g L−1 MDA was best structured. The results of creep and recovery tests are in accordance with the results of zero-shear viscosity measurements.
3.4 Possible emulsion stabilizing theory by MDA
As can be seen in Scheme 1, MDA has two hydrophobic tails and two hydrophilic heads. The amphiphilic nature of MDA makes it to adsorb on oil–water interface, which might increase the intermolecular hydrogen bonding of water droplets. Consequently, a three dimensional networks might form because of the weak attraction force.On one hand, MDA as a structuring agent can establish the network structures in emulsions, which can provide a resistant force to slow down the rate of sedimentation and aggregation, benefiting the emulsion stability. But on the other hand, the negative effect is that the attraction force strengthened by MDA can cause flocculation. As MDA concentration increases in the emulsions, flocculation is becoming increasingly obvious.
At an appropriate concentration (2 g L−1), the positive effect of MDA on emulsion stability is significantly more obvious than the negative effect caused by flocculation. At this point, the presence of MDA in w/o emulsions can greatly enhance the emulsion stability. In fact, the formation of the network structures in emulsions is due to weak flocculation.20,30 In other words, the mechanism of MDA to enhance emulsion stability can be concluded that the network structures in the emulsion formed by weak flocculation is beneficial to emulsion stability, which is in accordance with other work.20,30
3.5 Application of MDA in OBMs
The OBM with 2 g L−1 MDA having the highest ES value and the OBM without MDA were aged statically at 150 °C for three days. The ES values of OBMs containing no MDA and 2 g L−1 MDA changing with time were shown in Fig. 7. It is apparent that the ES values of the two OBMs decreased with time because the OBMs are thermodynamically unstable. After three-day aging, the ES value of the OBM containing 2 g L−1 MDA was more than 700 V which was far larger than that of the control group (220 V). This made it possible to keep a longer-term emulsion stability of OBMs.
4. Conclusions
This paper presents an alternative method to enhance w/o emulsion stability using MDA which was synthesized by reacting OAD with DEA. Bottle tests showed that a substantial improvement in emulsion stability was observed after addition of MDA, and the optimum concentration of MDA was 2 g L−1.A honeycomb structure was observed in continuous phase of pure emulsion + 2 g L−1 MDA from cryo-SEM, which indicates a “gel-like” structure. According to rheological experiments of pure emulsion + 2 g L−1 MDA, a remarkably larger zero-shear viscosity, a solid-like behavior and a greater elasticity were observed in comparison with pure emulsion. The “gel-like” structure and improvements in rheological properties are both beneficial to emulsion stability.
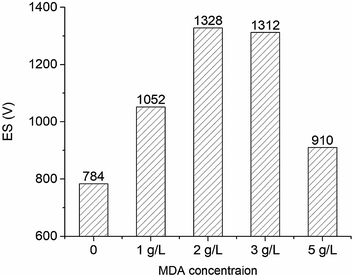
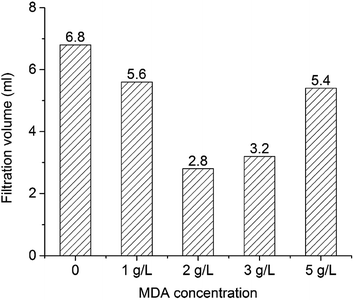
MDA can largely enhance electrical stability and reduce HTHP filtration volume of OBMs.
The possible mechanism of emulsion stabilization was proposed as follows: theoretically, the amphiphilic nature of MDA makes it possible to adsorb on oil–water interface, which might enhance the interaction force of water droplets and establish three dimensional network structures in emulsions. The network structures in the emulsion is beneficial to emulsion stability.
Conflicts of interest
None.Acknowledgements
The authors are thankful to China Postdoctoral Science Foundation (2018M630812), the Fundamental Research Funds for the Central Universities (No. 18CX02171A), Scientific Research Foundation for the Introduction of Talents (YJ20170014) and Joint Funds of the National Natural Science Foundation of China (U1762212).References
- R. Caenn, H. C. H. Darley and G. R. Gray, Composition and properties of drilling and completion fluids, Gulf Professional Publishing, 2011 Search PubMed.
- C. K. Reiffers-Magnani, J. L. Cuq and H. J. Watzke, Food Hydrocolloids, 2000, 14, 521–530 CrossRef.
- M. Moradi, V. Alvarado and S. Huzurbazar, Energy Fuels, 2010, 25, 260–268 CrossRef.
- L. G. Torres, R. Iturbe, M. J. Snowden, B. Z. Chowdhry and S. A. Leharne, Colloids Surf., A, 2007, 302, 439–448 CrossRef.
- E. Dickinson, Food Hydrocolloids, 2009, 23, 1473–1482 CrossRef.
- I. Heertje, Food Struct., 2013, 1, 3–23 CrossRef.
- M. Kowalska, M. Ziomek and A. Żbikowska, Int. J. Cosmet. Sci., 2015, 37, 408–416 CrossRef PubMed.
- A. Perino, C. Noïk and C. Dalmazzone, Energy Fuels, 2013, 27, 2399–2412 CrossRef.
- N. Nihant, C. Schugens, C. Grandfils, R. Jérôme and P. Teyssié, Pharm. Res., 1994, 11, 1479–1484 CrossRef.
- D. E. Tambe and M. M. Sharma, Adv. Colloid Interface Sci., 1994, 52, 1–63 CrossRef.
- E. Kettler, C. B. Müller, R. Klemp, M. Hloucha, T. Döring, W. Von Rybinski and W. Richtering, in Progress in Colloid and Polymer Science, Springer, 2007, vol. 134, pp. 90–100 Search PubMed.
- D. Krajisnik and J. Milić, Drug Dev. Ind. Pharm., 2003, 29, 701–711 CrossRef PubMed.
- Y. Tan, K. Xu, C. Liu, Y. Li, C. Lu and P. Wang, Carbohydr. Polym., 2012, 88, 1358–1363 CrossRef.
- Y. Jiang, X. Liu, Y. Chen, L. Zhou, Y. He, L. Ma and J. Gao, Bioresour. Technol., 2014, 153, 278–283 CrossRef PubMed.
- S. Lam, K. P. Velikov and O. D. Velev, Curr. Opin. Colloid Interface Sci., 2014, 19, 490–500 CrossRef.
- F. Marchal, A. Roudot, N. Pantoustier, P. Perrin, J. Daillant and P. Guenoun, J. Phys. Chem. B, 2007, 111, 13151–13155 CrossRef PubMed.
- Unilever BCS US Inc, US Pat. 8940355B2, 2011.
- E. Dickinson, J. Colloid Interface Sci., 2015, 449, 38–45 CrossRef PubMed.
- A. Bot, Y. S. J. Veldhuizen, R. den Adel and E. C. Roijers, Food Hydrocolloids, 2009, 23, 1184–1189 CrossRef.
- E. Dickinson and K. Pawlowsky, J. Agric. Food Chem., 1997, 45, 3799–3806 CrossRef.
- U. Klinkesorn, P. Sophanodora, P. Chinachoti and D. J. McClements, Food Res. Int., 2004, 37, 851–859 CrossRef.
- J. De Visscher, H. Soenen, a. Vanelstraete and P. Redelius, in Proceedings of the 3rd Eurasphalt and Eurobitume Congress Held Vienna, 2004, vol. 2, pp. 1501–13 Search PubMed.
- A. P. Institute, API RP 13B-2 Recommended Practice for Field Testing of Oil-based Drilling Fluids, 5th edn, 2014 Search PubMed.
- J. O'Sullivan, M. Arellano, R. Pichot and I. Norton, Food Hydrocolloids, 2014, 42, 386–396 CrossRef.
- M. Reger, T. Sekine, T. Okamoto, K. Watanabe and H. Hoffmann, Soft Matter, 2011, 7, 11021 RSC.
- A. Beri, J. E. Norton and I. T. Norton, Int. J. Cosmet. Sci., 2013, 35, 613–621 CrossRef PubMed.
- J. Y. Kim, J. Y. Song, E. J. Lee and S. K. Park, Colloid Polym. Sci., 2003, 281, 614–623 CrossRef.
- M. V. Tzoumaki, T. Moschakis, V. Kiosseoglou and C. G. Biliaderis, Food Hydrocolloids, 2011, 25, 1521–1529 CrossRef.
- M. C. García, M. C. Alfaro and J. Muñoz, Colloids Surf., B, 2015, 135, 465–471 CrossRef PubMed.
- T. Tadros, Adv. Colloid Interface Sci., 2004, 108, 227–258 CrossRef PubMed.
- F. B. Growcock, C. F. Ellis, D. D. Schmidt and J. J. Azar, SPE Drill. Completion, 1994, 9, 39–46 CrossRef.
| This journal is © The Royal Society of Chemistry 2018 |

