DOI:
10.1039/C8RA02267D
(Paper)
RSC Adv., 2018,
8, 16902-16909
Template-assisted synthesis of NiCoO2 nanocages/reduced graphene oxide composites as high-performance electrodes for supercapacitors†
Received
15th March 2018
, Accepted 27th April 2018
First published on 8th May 2018
Abstract
Here we reported a coordinating etching and precipitating method to synthesize a complex binary metal oxides hollow cubic structure. A novel NiCoO2/rGO composite with a structure of NiCoO2 nanocages anchored on layers of reduced graphene oxide (rGO) were synthesized via a simple template-assisted method and the electrochemical performance was investigated by cyclic voltammetry, galvanostatic charge–discharge and electrochemical impedance spectroscopy tests as a faradaic electrode for supercapacitors at a graphene weight ratio of 1 wt% (1%). When used as electrode materials for electrochemical capacitors, the NiCoO2/rGO composites achieved a specific capacity of 1375 F g−1 at the current density of 1 A g−1 and maintained 742 F g−1 at 10 A g−1. After 3000 cycles, the supercapacitor based on these nanocage structures shows long-term cycling performance with a high capacity of 778 F g−1 at a current density of 1 A g−1. These outstanding electrochemical performances are primarily attributed to the special morphological structure and the combination of mixed transition metal oxides and rGO, which not only maintains a high electrical conductivity for the overall electrode but also prevents the aggregation and volume expansion of electrochemical materials during the cycling processes.
1 Introduction
Electrochemical capacitors (ECs), also called supercapacitors, a new energy storage system, have great potential as next generation energy storage systems, due to their outstanding electrochemical performance including high specific capacitance, high power density, good rate capability and excellent cycling stability.1,2 Supercapacitors have been successfully utilized in many fields including communication, transportation, electronics, and aviation, and have considerable application prospects.3,4 Based on different energy storage mechanisms, ECs are classified into two categories: double-layer capacitors (DLC) and pseudocapacitors (PC).5,6 In particular, PCs rely on reversible redox reactions between active materials and electrolyte ions to more rapidly complete the storage of energy and the release of charge.7 As is well-known, the electrode material is the most important component of supercapacitors, which affects the supercapacitors' performance to a large extent. Many researchers are aiming at producing new substances and structures to achieve better properties for supercapacitors.
Various materials, such as transition metal oxides,8 metal sulfides,9 metal hydroxides10 and modified carbons,11 have been explored for pseudocapacitor applications. Among them, nickel hydroxide is an attractive pseudocapacitive material due to its well-known electro-chemical redox activity, high specific capacitance, good rate capability and low cost.12,13 Nickel hydroxide is a kind of p-type semiconductor, which can increase the internal resistance of the electrode.14 To minimize the internal resistance of the electrode among nickel hydroxide, nickel substrate and electrolyte, it is suggested to incorporate some additives in the electrode. Meanwhile, cobalt oxides have special structure and surface redox reactivity.15 Cobalt oxides comprise two readily accessible cation oxidation states: Co2+ and Co3+, which are thermodynamically competitive under common ambient conditions, and two species of cobalt oxide are stable in the natural environment, which make them potential additive candidates for advanced materials.16 One of the most promising materials based on transition metal oxides is the mixed Ni and Co oxide, which is a cheap and stable electrode material. As a novel two-dimensional single-atom-thick carbon material with a honeycomb lattice structure, graphene has attracted huge research interest in both academia and industry. Its unique structural features provide excellent mechanical, thermal and optical properties. In particular, its great theoretical specific surface area and high electronic conductivity make graphene a promising material for high-performance supercapacitors. However, there are still several considerable barriers preventing graphene's effective application in supercapacitors. The foremost obstacles are serious aggregation and restacking of grapheme, which not only decrease its actual specific surface area but also hinder the rapid transport of electrolyte ions. To date, there have been several reports on the synthesis and electrochemical evaluation of NiCo2O4 material with various morphologies.17–20 Mondal et al. developed rGO–NiCo2O4 hollow spheres for supercapacitor application. The synthesized rGO–NiCo2O4 showed a specific capacity as high as 971 F g−1 at a current density of 0.5 A g−1, which is much superior to that of pristine NiCo2O4 hollow spheres (416 F g−1).21 Zhang et al. reported the synthesis method of mesoporous NiCo2O4 with nanoflake@nanoneedles-like multiple hierarchical structures (NCO-MHs) and urchin-like hierarchical structures (NCO-urchin-like HSs). The performance of synthesized NiCo2O4 as supercapacitor electrode materials were measured and the results demonstrated that the NCO-MHSs and NCO-urchin-like HSs exhibits higher specific capacitance of 640 F g−1 and 655 F g−1 at current density of 1 A g−1 respectively, and capacitance retention is 99.6% and 95% after 1000 cycles at a current density of 5 A g−1.22 However, few of NiCoO2 materials, as another mixed Ni and Co oxide, have been reported on the synthesis and electrochemical evaluation. Especially, the study on the template-assisted synthesis of novel NiCoO2/rGO nanocage composites for supercapacitors has been rarely been reported.
Herein, we explored a general strategy for fabricating uniform nanocages of NiCo(OH)2/rGO (MHs) by templating against cubic Cu2O nanocrystals at room temperature and then obtaining homologous metal oxide (MO) porous nanocages by simple thermal treatment of the as-prepared MHs. Due to positive synergistic effects, the composites maintained a high electrical conductivity, a distinct volume change cushion, and all effective prevention of rGO's agglomeration or restacking during the charge–discharge process. The electrochemical performance of the hollow NiCo(OH)2, NiCoO2, NiCo(OH)2/rGO and NiCoO2/rGO nanocages were further researched and compared in detail based on cyclic voltammetry (CV), galvanostatic charge–discharge (GCD) and electrochemical impedance spectroscopy (EIS) techniques.
2 Experimental
2.1 Sample preparation
All of the chemical reagents used in this experiment were of analytical grade and used without further purification.
Preparation of graphene oxides. Graphene oxides (GO) were synthesized via a modified Hummers method using pristine graphite powders as raw materials. The detail procedure are shown in the ESI,† as well as the SEM of GO in Fig. S1.†
Preparation of solid Cu2O crystals. The synthesis of Cu2O followed Zhang's previous report23 with some modification, which increased the quantity of products than Zhang's. In a typical synthesis, 6 mmol CuCl2·6H2O was dissolved in 200 mL of deionized water with magnetic stirring for 30 min to obtain transparent light green solution. Then, 20 mL NaOH aqueous solution (2 mol L−1) was dropwise added into the above solution, which turned into turbid blue-green and then dark brown. After stirring for 1 h, 20 mL ascorbic acid solution (0.6 mol L−1) was dropwise added into the dark brown solution and a turbid red liquid gradually formed. The liquid was aged for 3 h. All of the procedure was carried out under constant stirring and heated in a water bath at 60 °C. The resulting precipitate was collected by centrifugation and decanting, followed by washing with distilled water and absolute ethanol and finally dried in vacuum at 60 °C for 12 h, and after that, the cubic nanostructures of Cu2O samples was obtained. The cubic nanostructures of Cu2O samples are shown in Fig. S2 in the ESI, as well as XRD in Fig. S3.†
Preparation of NiCo(OH)2, NiCo(OH)2/rGO nanocages. In a typical procedure,24 a certain amount of Cu2O templates, NiCl2·2H2O and CoCl2·2H2O (Co![[thin space (1/6-em)]](https://www.rsc.org/images/entities/char_2009.gif) :Ni = 3:2, molar ratio) were added to 120 mL of the ethanol/water mixed solvent (MS) in the presence of PVP (Mw = 30000). After the mixture was stirred for 10 min, a certain amount of Na2S2O3 aqueous solution was dropwise added. Then the reaction was carried out at room temperature for some time until the suspension solution changed from red to the expected color. Eventually, NiCo(OH)2 nanocages were fabricated respectively. As for the synthesis of NiCo(OH)2/rGO nanocages, GO of one percent (1%) is added to the above mixed solvent (MS). The cubic nanostructures of NiCo(OH)2, 1%NiCo(OH)2/rGO samples are shown in Fig. S4 in the ESI.†
:Ni = 3:2, molar ratio) were added to 120 mL of the ethanol/water mixed solvent (MS) in the presence of PVP (Mw = 30000). After the mixture was stirred for 10 min, a certain amount of Na2S2O3 aqueous solution was dropwise added. Then the reaction was carried out at room temperature for some time until the suspension solution changed from red to the expected color. Eventually, NiCo(OH)2 nanocages were fabricated respectively. As for the synthesis of NiCo(OH)2/rGO nanocages, GO of one percent (1%) is added to the above mixed solvent (MS). The cubic nanostructures of NiCo(OH)2, 1%NiCo(OH)2/rGO samples are shown in Fig. S4 in the ESI.†
Preparation of NiCoO2, NiCoO2/rGO nanocages. In a typical procedure,25 the as-prepared NiCo(OH)2 and NiCo(OH)2/rGO samples were treated with calcination under a nitrogen atmosphere at a certain temperatures for a certain time. The heating rate was kept at 1 °C min−1 for each sample. After thermal treatment, NiCoO2 and NiCoO2/rGO nanocages were obtained.
2.2 Characterization
The samples were examined by X-ray diffraction (XRD-7000), recorded using a Shimadzu X-ray powder diffractometer with Cu-Kα radiation (λ = 0.15405 nm). The morphology and size of the products were obtained using scanning electron microscopy (SEM) with a JSM-6510A microscope and by sputtering with gold. The internal structures of the products were observed using a JEOL JEM-2100F microscope used for transmission electron microscopy (TEM). The elemental composition of the products was determined using energy dispersive X-ray spectroscopy (EDS; Hitachi SU8010 IXRP Systems). Thermogravimetric analysis (TG) was carried out using Switzerland Mettler-Toledo TGA/DSC1 apparatus.
2.3 Fabrication of the working electrode and electrochemical measurements
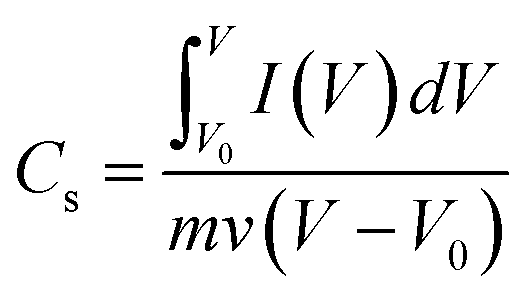
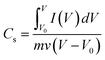
To prepare the working electrode with the following procedure, the as-prepared active materials, acetylene black and a polytetrafluoroethylene (PTFE) emulsion, were mixed in ethanol at a weight ratio of 8:1:1, and dispersed by ultrasonic treatment for 10 min. The slurry was coated on a nickel foam (1 × 1 cm2) current collector and then pressed at 8 MPa for 30 s and dried under vacuum at 60 °C for 12 h. Finally, the working electrode was obtained, and the mass of the active loading on the nickel foam was about 10 mg. The electrochemical properties of the active material were tested using an electrochemical workstation by a conventional three-electrode system (a reference electrode, counter electrode and working electrode). Hg/HgO was used as the reference electrode, a platinum foil as the counter electrode and the working electrode was prepared using the active materials. All of the electrochemical measurements were carried out in a 2.0 M KOH solution on a Parstat 4000 workstation at room temperature. Based on the CV curves, the average specific capacitance of the electrodes was calculated via eqn (1),| |
 | (1) |
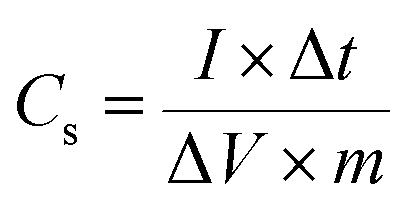
where Cs (F g−1), m (g), v (V s−1), (V − V0), and I(V) are the specific capacitance, mass of the active material, potential scan rate, potential range and current density, respectively. Based on the discharge curves, the average specific capacitance of the electrodes was calculated according to eqn (2),| |
 | (2) |
where Cs (F g−1), I (A), Δt (s), ΔV (V) and m (g) are the specific capacitance, discharge current, discharge time, potential range of discharge and mass of the active material, respectively.
3 Results and discussion
3.1 Strategy for the NiCoO2/rGO nanocages fabrication
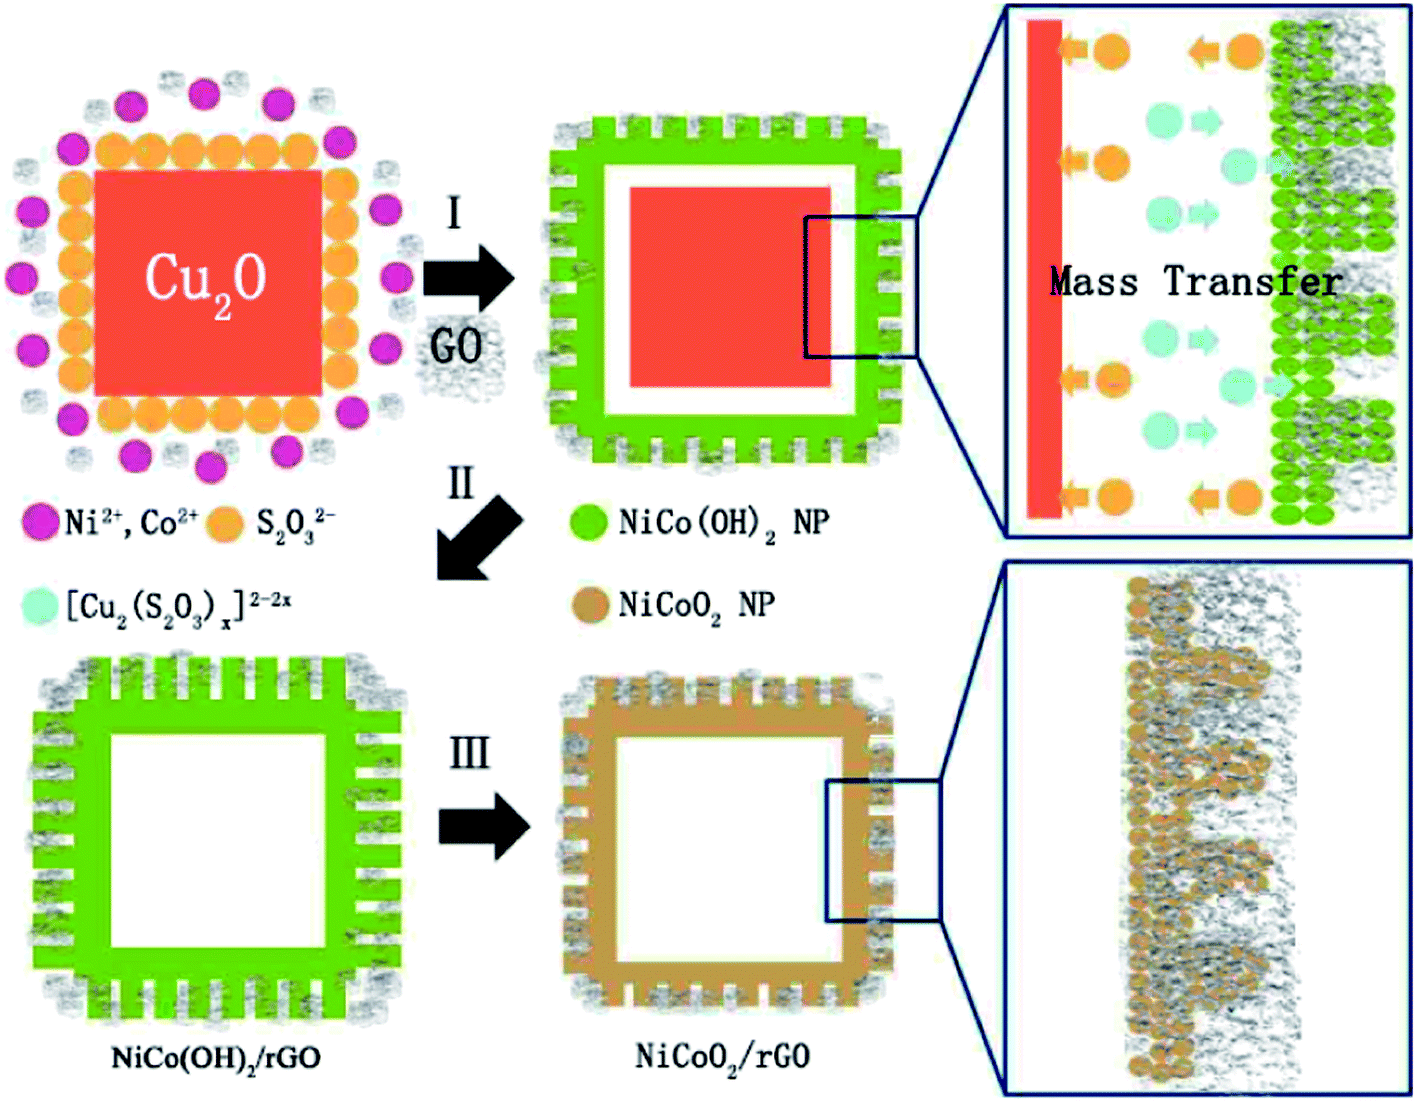
A possible formation mechanism of NiCoO2/rGO nanocages is illustrated in Scheme 1. The formation process is illustrated as steps I, II and III in Scheme 1, and the general chemical route could be described as,| | |
Cu2O + xS2O32− + H2O → [Cu2(S2O32−)x]2−2x + 2OH−1
| (3) |
| | |
S2O32− + H2O → HS2O3− + OH−
| (4) |
| | |
Ni2+ +Co2+ + 2OH− → NiCo(OH)2
| (5) |
During this process, continuous dissolution of Cu2O can occur even in closed shells, proving that species such as S2O32− and the [Cu2(S2O3)x]2−2x complex can freely transport across the shells through interparticle interstitials and driven by the as-buildup concentration gradient during the etching process (occurs in both steps I and II). Meanwhile, rGO can be added to synthetise the reduced graphene oxide of homologous composites. In a further procedure, NiCoO2 and NiCoO2/rGO nanocages can be readily obtained by the common thermal treatment of the as-prepared NiCo(OH)2 and NiCo(OH)2/rGO, illustrated as step III in Scheme 1.
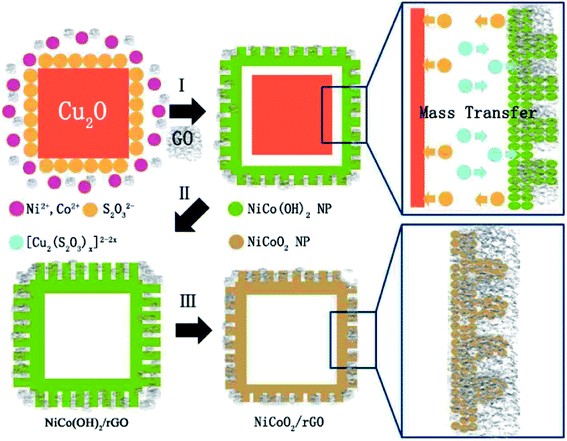 |
| | Scheme 1 Schematic illustration of the fabrication of NiCoO2/rGO nanocages by synchronous coordinating etching of Cu2O nanocrystals and the fabrication of NiCoO2 by thermal treating of relevant NiCo(OH)2/rGO. (Step I: coordinating etching and precipitating. Step II: coordinating etching; Step III: thermal treatment). | |
The calcination temperature of NiCo(OH)2/rGO composites can be further investigated by TGA, which was performed up to 900 °C in nitrogen with a heating rate of 10 °C min−1. As shown in Fig. S5 (ESI†), there is an initial mass loss of approximately 10% below 150 °C, which is associated with the deintercalation of surface-absorbed water. Subsequently, NiCo(OH)2/rGO composites display a dramatic mass loss at approximately 350 °C. And this fully 11% of mass loss should be attributed to the removal of ions OH−, and at this time NiCoO2/rGO composites have be prepared. After 700 °C, this fully 1% of mass loss should be attributed to the removal of carbon sketch by burning rGO, while the remainder is NiCoO2, which has a better thermal property.
3.2 Characterization of structure and morphology
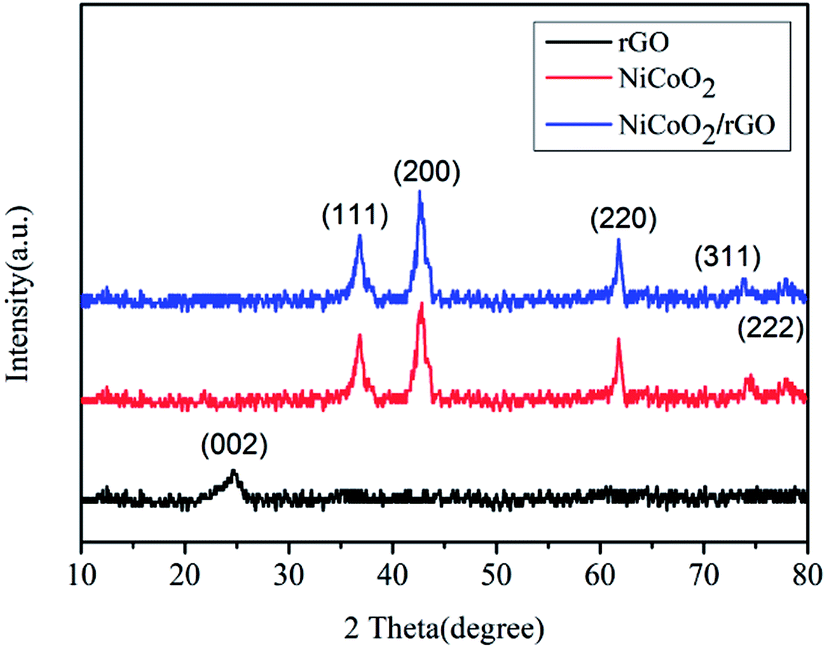
XRD characterizations were used to determine the crystalline structure and phase composition of the samples. As shown in Fig. 1, there are the patterns of rGO, NiCoO2 and NiCoO2/rGO composites. All diffraction peaks of NiCoO2 arc perfectly in accordance with the standard data of cubic NiCoO2 (JCPDS no. 10-0188), indicating the pure quality of the as-prepared sample.26 Meanwhile, the strong and narrow diffraction peaks show that the material possesses high crystallinity. In Fig. 1, the broad diffraction peak of rGO appearing at approximately 25° corresponds to the (002) plane of grapheme.27–29 And the diffraction peaks of 1% NiCoO2/rGO composites are similar to that of NiCoO2. However, this characteristic peak of rGO is not observed in the XRD pattern of 1% NiCoO2/rGO, the reason of which may be the content of rGO under the detection limit.30
 |
| | Fig. 1 XRD patterns of rGO, NiCoO2 and NiCoO2/rGO composites. | |
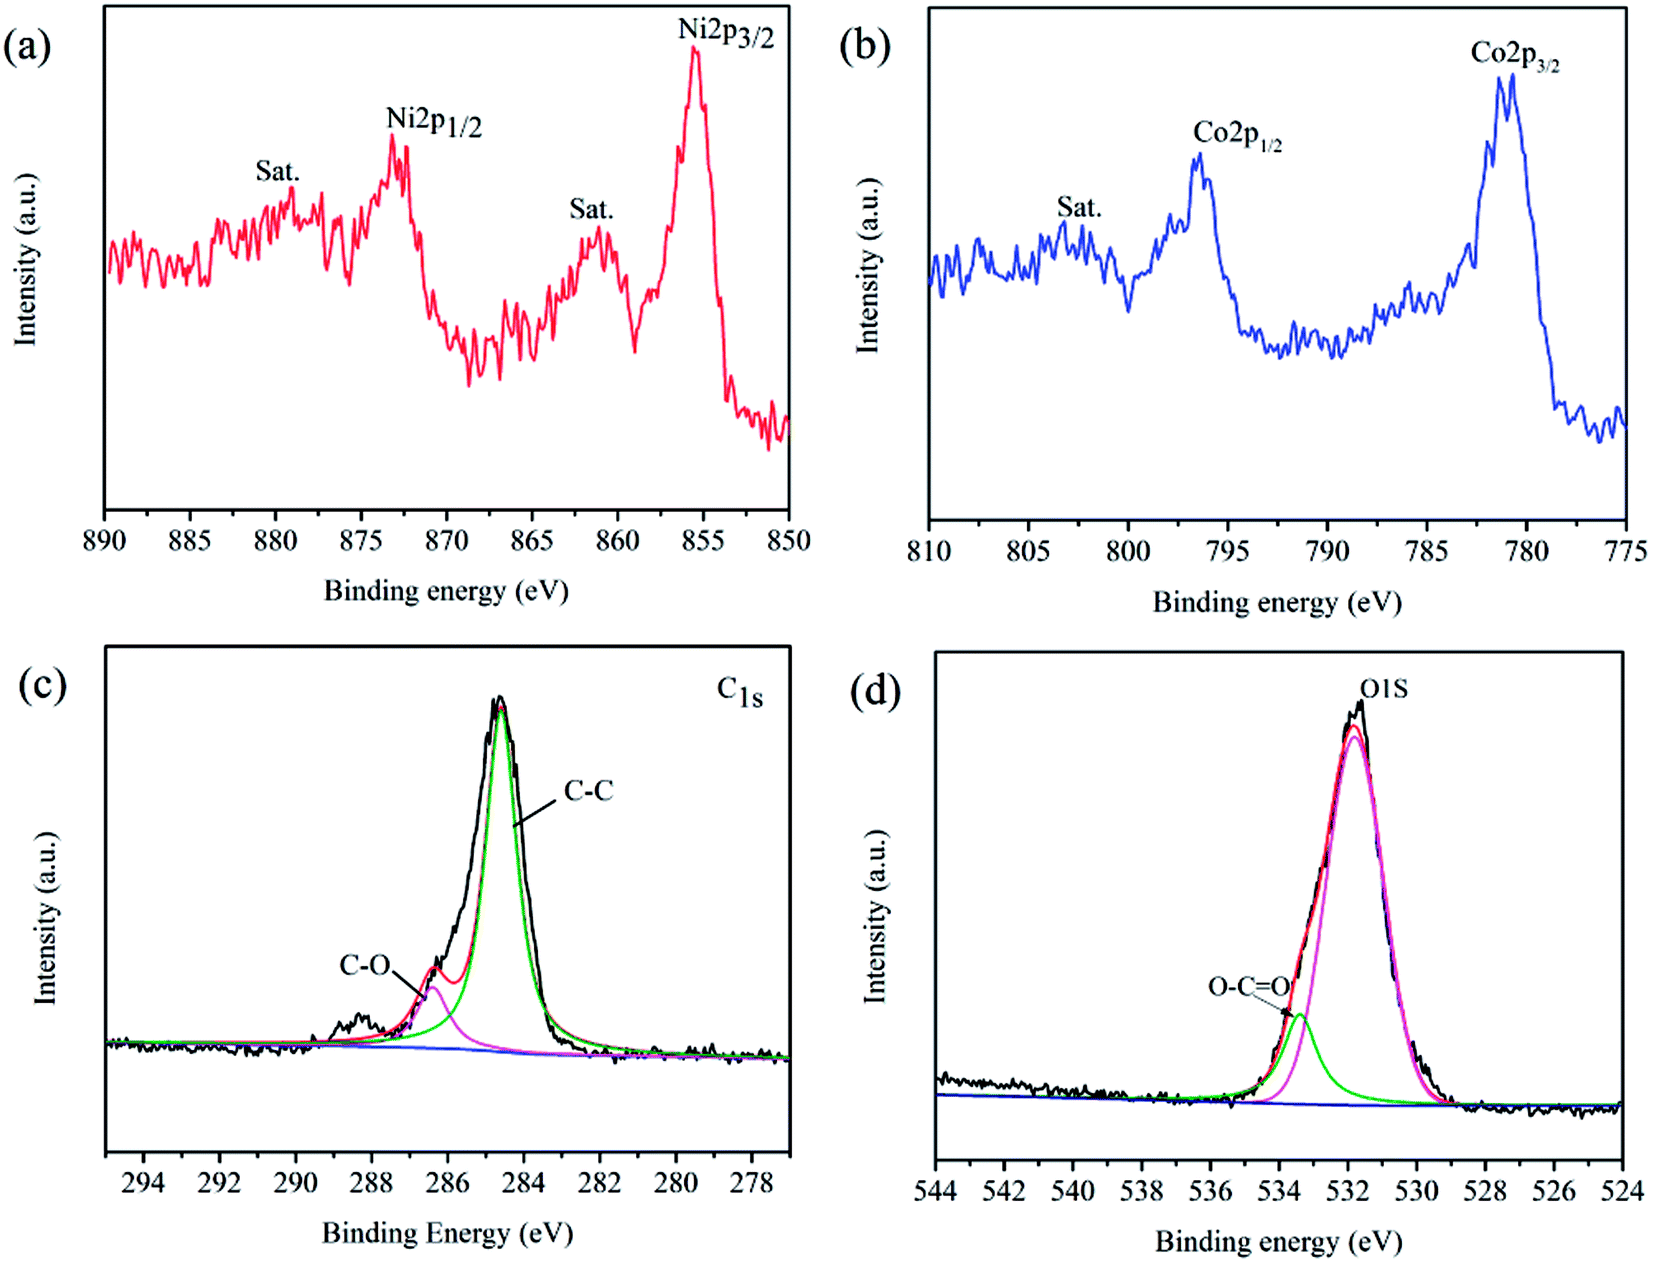
In addition, XPS characterization was used to further confirm the crystal phase of the NiCoO2/rGO composites. As shown in Fig. S5 (ESI†), the survey spectrum of NiCoO2/rGO composites mainly confirms presence of carbon, oxygen, cobalt and nickel species. In Fig. 2(a), the major peak of the Ni2p XPS spectrum can be assigned to the Ni2p3/2 (approximately 857.0 eV).31 In Fig. 2(b), the major peak of the Co2p XPS spectrum can be assigned to the Co2p3/2 (approximately 782.4 eV). The Ni2p and Co2p XPS spectra show that both the cobalt and nickel elements in the composites exist in the bivalent form, which is in accordance with results from the XRD. Moreover, the peak located at 284.6 eV is assigned to the characteristic peak of C1s, and a detailed deconvolution of the C1s spectrum is shown in Fig. 2(c).32 It is noteworthy that there are two types of carbon bonds, including C–C at 284.6 eV and C–O at 286.9 eV.33 The deconvoluted O1s spectrum (Fig. 2(d)) demonstrates the formation of NiCoO2 at 531.7 eV, and the presence of the oxygen atoms of the relevant surface functional groups at 533.6 eV (O![[double bond, length as m-dash]](https://www.rsc.org/images/entities/char_e001.gif) C–O).34 The presence of these residual oxygen-containing groups can be attributed to the partial oxidation of GO during the hydrothermal process. However, these hydrophilic groups can act as anchoring sites to enable NiCoO2 to interact tightly with rGO. Moreover, these groups can enhance the wettability of the electrode, which brings a further positive effect on the compatibility between the electrode and the electrolyte.
C–O).34 The presence of these residual oxygen-containing groups can be attributed to the partial oxidation of GO during the hydrothermal process. However, these hydrophilic groups can act as anchoring sites to enable NiCoO2 to interact tightly with rGO. Moreover, these groups can enhance the wettability of the electrode, which brings a further positive effect on the compatibility between the electrode and the electrolyte.
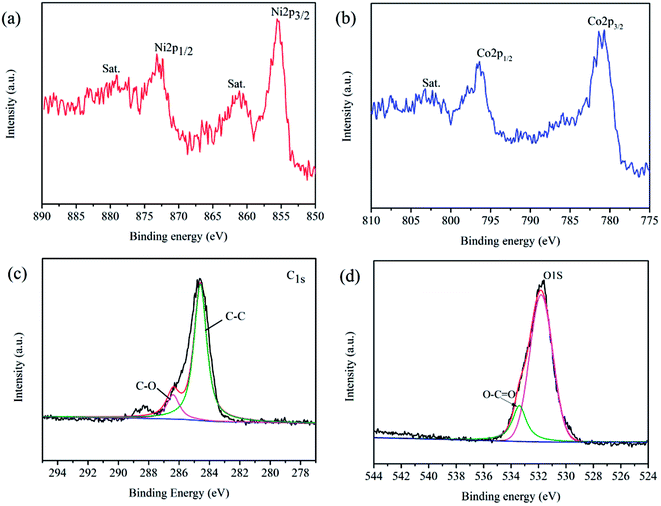 |
| | Fig. 2 XPS spectra of NiCoO2/rGO composites. (a) Ni2p spectrum; (b) Co2p spectrum; (c) C1s spectrum; (d) O1s spectrum. | |
Fig. 3 displays Raman spectra of pure GO and NiCoO2/rGO composites, which show that all samples contain the D and G bands due to the GO. The G band denoted as the characteristic Raman band at ∼1585 cm−1 resulted from the E2g phonon vibration of the carbon sp2 atoms and D band at ∼1365 cm−1 associated with the structural disorders and defects attributed to the amorphous sp3 C–C vibrations.35,36 Also, the broad 2D band position around ∼2700 cm−1, which is highly sensitive to stacking of grapheme sheets.37,38 It can be seen that D and G band intensity varies for the as synthesized composites. Also, the ratio of intensities of the D and G bands (ID/IG) is an important parameter and gives significant information about the structural defects present in carbon materials.39 The calculated ID/IG intensity ratios were 0.88 and 1.03 for pure GO and NiCoO2/rGO composites, respectively. The small value of the intensity ratio of pure GO indicates the presence of lower number of defects in as synthesized GO. However, the NiCoO2/rGO composite shows the highest defect (1.03) due to the formation of NiCoO2 nanoparticles of metal oxide on the rGO.40
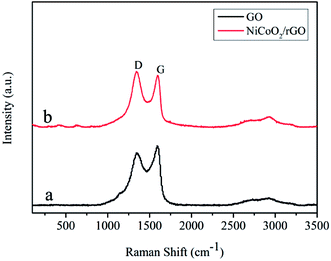 |
| | Fig. 3 Comparison of Raman spectra of there products. (a) Pure GO; (b) NiCoO2/rGO. | |
The morphology and microstructure of the NiCoO2 and NiCoO2/rGO samples were characterized by SEM and TEM observations, shown in Fig. 4. When cube of Cu2O templates are introduced, the overall sample was dominated by the three-dimensional cubic structure of nanocages. It can be distinctly observed from the large number of nanocages and some of the broken nanocages that the nanocages are hollow and the side length of the hollow nanocages is approximately 500 nm, as shown in Fig. 4(a and b). And compared with NiCoO2, the NiCoO2 nanocage in NiCoO2/rGO composites are covered by the lavers of rGO (SEM images c and d in Fig. 4). The features of the cubic nanocages, including uniform dimensions, good exterior texture, and amorphous, intact, and regular shell structure, can also be clearly observed in these cubic nanocages, which can be confirmed by the TEM image in Fig. 4(e). In particular, Fig. 4(f) shows NiCoO2 nanoparticles (NiCoO2 NPs) in size distribution of 10–20 nm are well anchored on the lavers of rGO.
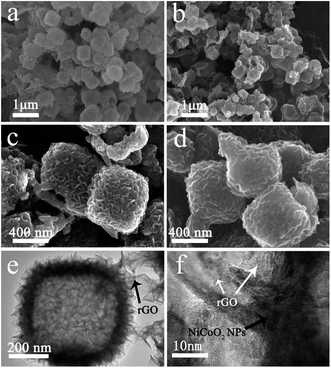 |
| | Fig. 4 SEM images (a and c) of NiCoO2, SEM images (b and d) and TEM images (e and f) of 1% NiCoO2/rGO composites. | |
3.3 Electrochemical performance
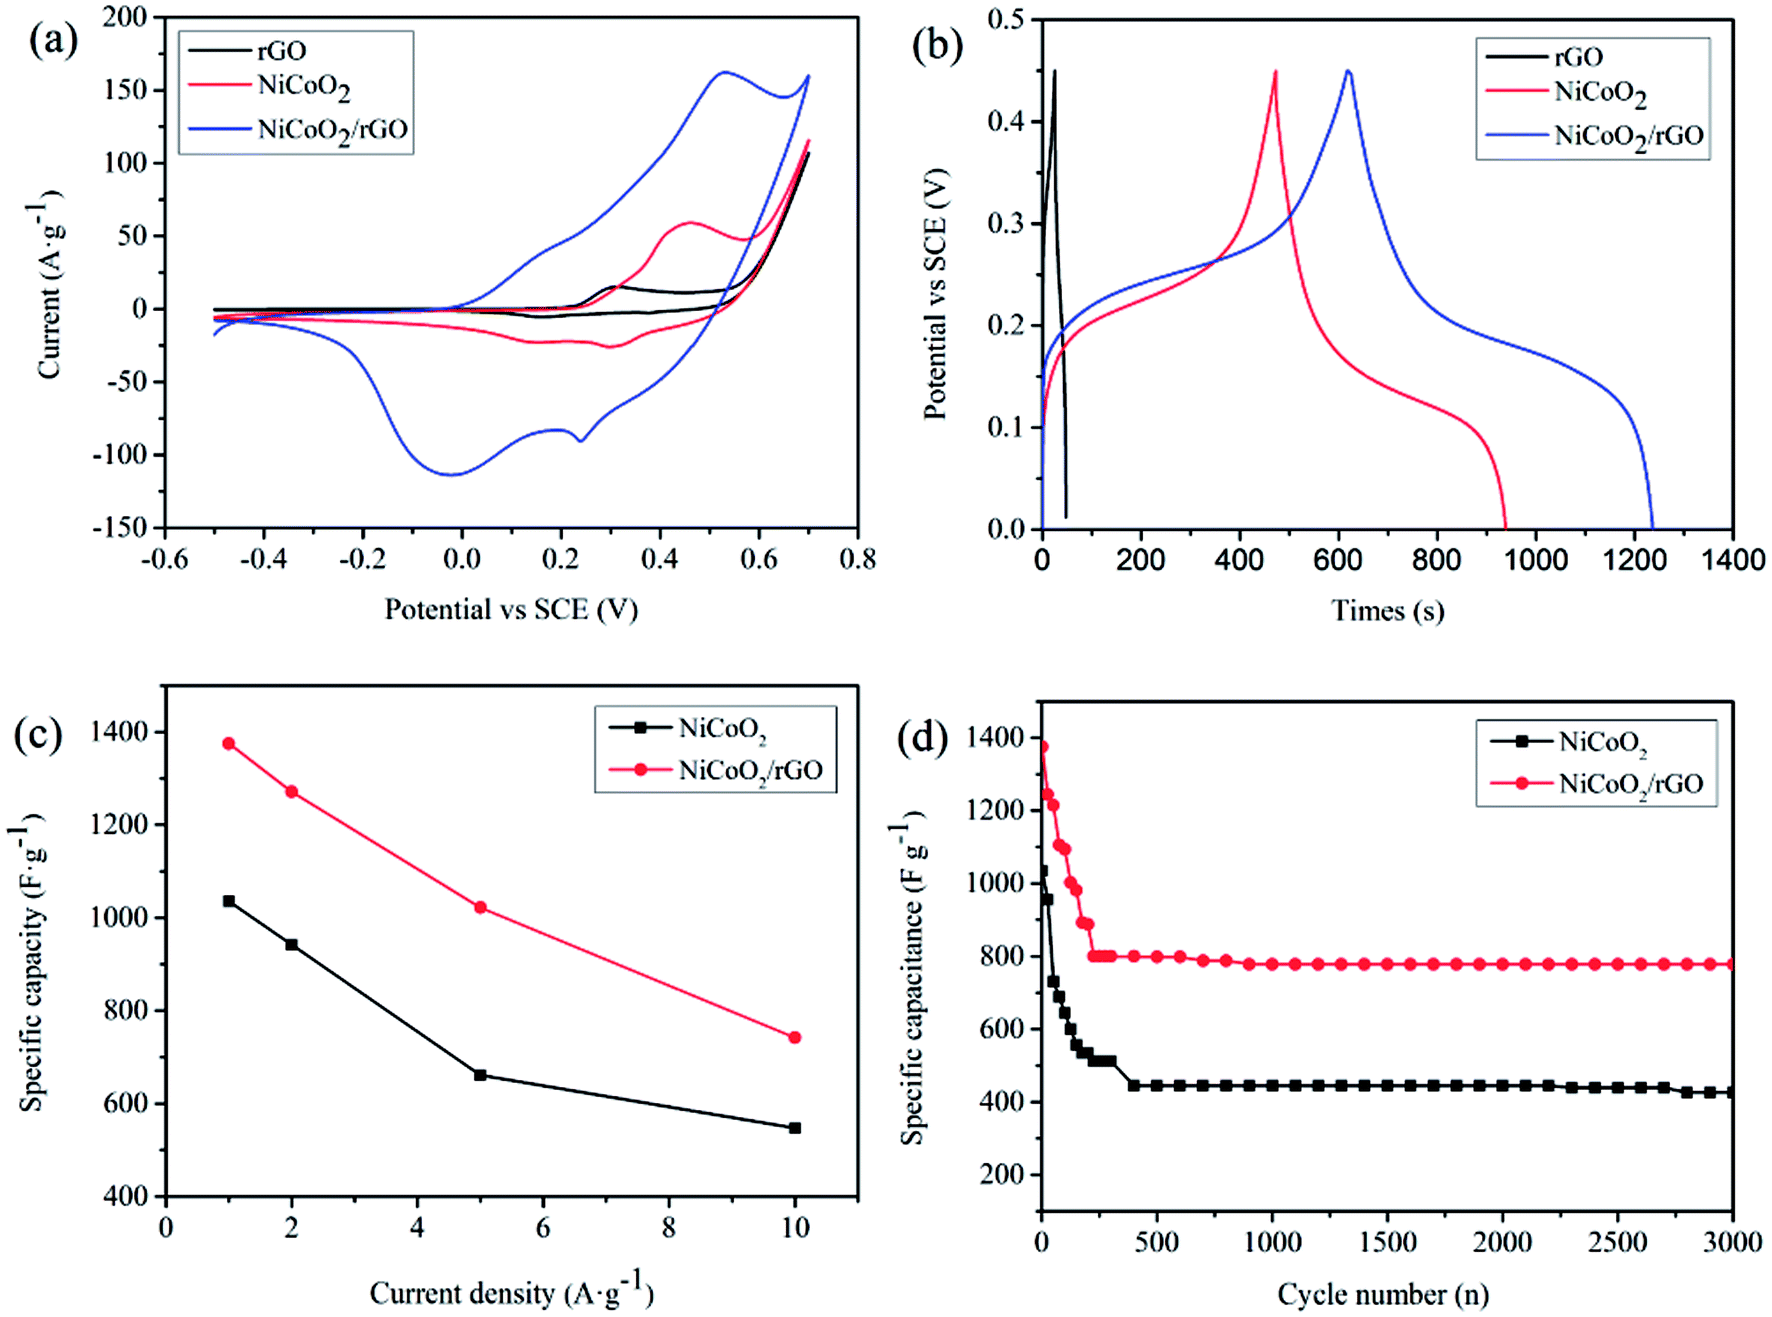
The electrochemical properties of NiCo(OH)2, NiCo(OH)2/rGO, NiCoO2 and NiCoO2/rGO were evaluated using CV and GCD techniques. Fig. S6† shows the typical CV curves of NiCo(OH)2, NiCo(OH)2/rGO, NiCoO2 and NiCoO2/rGO at different scan rates with a potential window ranging from −0.5 V to 0.7 V. From Fig. S8 (ESI†), each pair of peaks is visible in each voltammogram. In the cathodic scan, a small amount of charges would be stored in the interphase between the electrode material and electrolyte, which occurs at different peaks. In the reverse anodic scan, the stored charge would be released, which displays different peaks. When the scan rate is increased, the shapes of the curves are maintained and the peak current increases. The CV curves of all of the electrodes involving the reversible redox reactions are expected to exhibit good quasi-capacitance. Obviously, NiCoO2/rGO, the target product, shows the best electrochemical performance among them. From Fig. S10,† the capacitances of NiCoO2/rGO composites with different weight ratios of rGO (0.5%, 1%, 1.5%, and 2%) at 1 A g−1 are 806, 1375, 508, and 490 F g−1, respectively. It is clear that with the increasing rGO weight ratio, the specific capacitance first increased, and then decreased. The specific capacitance of the 1% NiCoO2/rGO is the highest. From Fig. 5(a), CV curves cycled at 10 mV s−1 on the NiCoO2/rGO electrode shows a pair of obvious redox peaks, which differs from the CV curves of rGO and NiCoO2 displaying a smaller peak area. Fig. S6(d)† shows the CV curves on the NiCoO2/rGO composite electrodes at scan rates from 1 to 20 mV s−1. The strong pairs of peaks in the CV curves indicate that the capacitive behaviors mainly attributed to faradic redox reaction. The faradic behavior is consistent with a battery-type electrode, coming from the following redox reactions,41–43| | |
NiCoO2 + 2OH− ⇔ NiOOH + CoOOH + 2e−
| (6) |
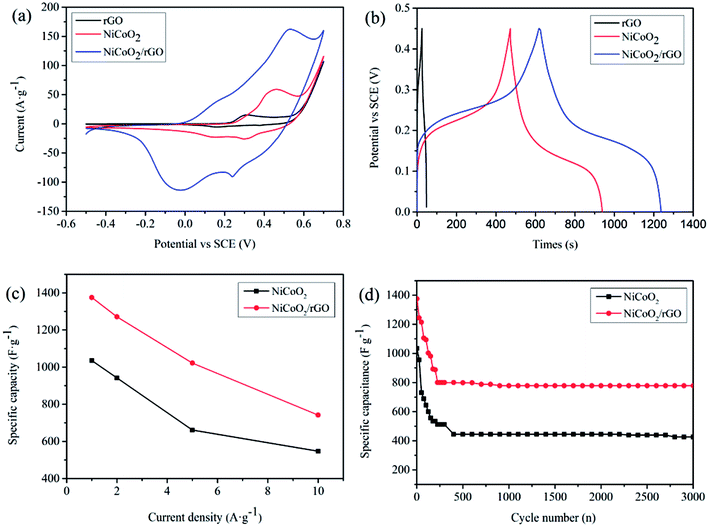 |
| | Fig. 5 (a) CV curves of rGO and 1% NiCoO2/rGO composites at a scan rate of 10 mV s−1; (b) GCD plots of rGO and 1% NiCoO2/rGO composites at a current density of 1 A g−1; (c) specific capacities of 1% NiCoO2/rGO composites at various current densities and (d) cycling performance of 1% NiCoO2/rGO composites at a current density of 1 A g−1. | |
In alkaline media, NiCoO2 tends to change to NiOOH and CoOOH, as such in reaction (6), which have a high electron and proton conductivity and significant voltammetric response, due to the combined effect of the oxygen donation from Ni and Co oxide/hydroxide.
In Fig. 5(b), the obvious plateau regions demonstrate faradic behaviors in the GCD curve of NiCoO2/rGO electrode, which is caused by redox reactions. And this also is in accordance with the CV results. In addition, GCD curves on NiCoO2/rGO composites at various current densities ranging from 1 to 10 A g−1 were also employed in Fig. S7(d).† The relationship between the capacitance and the area bounded by the CV curves can be described by eqn (2).44,45 According to eqn (2), the specific capacities of the NiCoO2/rGO composites are calculated at current densities of 1, 2, 5 and 10 A g−1, respectively, and the calculated capacitances of NiCoO2/rGO composites at corresponding current densities are 1375, 1271, 1022 and 742 F g−1, as shown in Fig. 5(c). And compared with NiCoO2, the specific capacities of the NiCoO2/rGO composites have an obvious improvement and show higher rate capacity and high multiplier performance, for which the reason is closely related to the combination of NiCoO2 and rGO. In Fig. 5(d), it shows the cycling performance of the NiCoO2/rGO working electrodes for electrochemical energy storage at a current density of 1 A g−1 between 0 V and 0.45 V, which reveals a higher initial specific capacitance for the first 300 cycles. Meanwhile, they undergo a rapid consecutive capacity reduction along with the increase in cycle number. After 300 cycles, the NiCoO2/rGO electrodes retain a capacity of 800 F g−1. The decrease of the capacitance could be caused by mainly decreasing the electroactive sites and a slight collapse of the hollow structure when the ions were intercalated/extracted into/out of the hollow structures. From the 300th to 3000th cycle, we can see that the long-term cycling performance of the NiCoO2/rGO electrode at a current density of 1 A g−1. In particular, the NiCoO2/rGO composites show a stable cycle performance with 97% capacity retention ratios (approximately from 800 to 778 F g−1) from the 300th to 3000th cycle of charging and discharging. Even if compared with the specific capacities, the capacity retention of NiCoO2/rGO composites is still 56% at a current density of 1 A g−1 (approximately from 1375 to 778 F g−1). And the good rate capability and excellent cycling stability of NiCoO2/rGO electrodes are closely related to the combination of mixed transition metal oxides and rGO. The unique hybrid architecture can maintain a high electrical conductivity for the overall electrode, which promotes a fast faradic charging and discharging process on the composites. Moreover, the aggregation and volume expansion/contraction of electrochemical materials can be effectively prevented during the cycling processes by virtue of the hybrid structure. Meanwhile, the high specific capacitance of NiCoO2/rGO electrodes is closely related to annealing in nitrogen, which makes NiCoO2/rGO possessing high crystallinity.
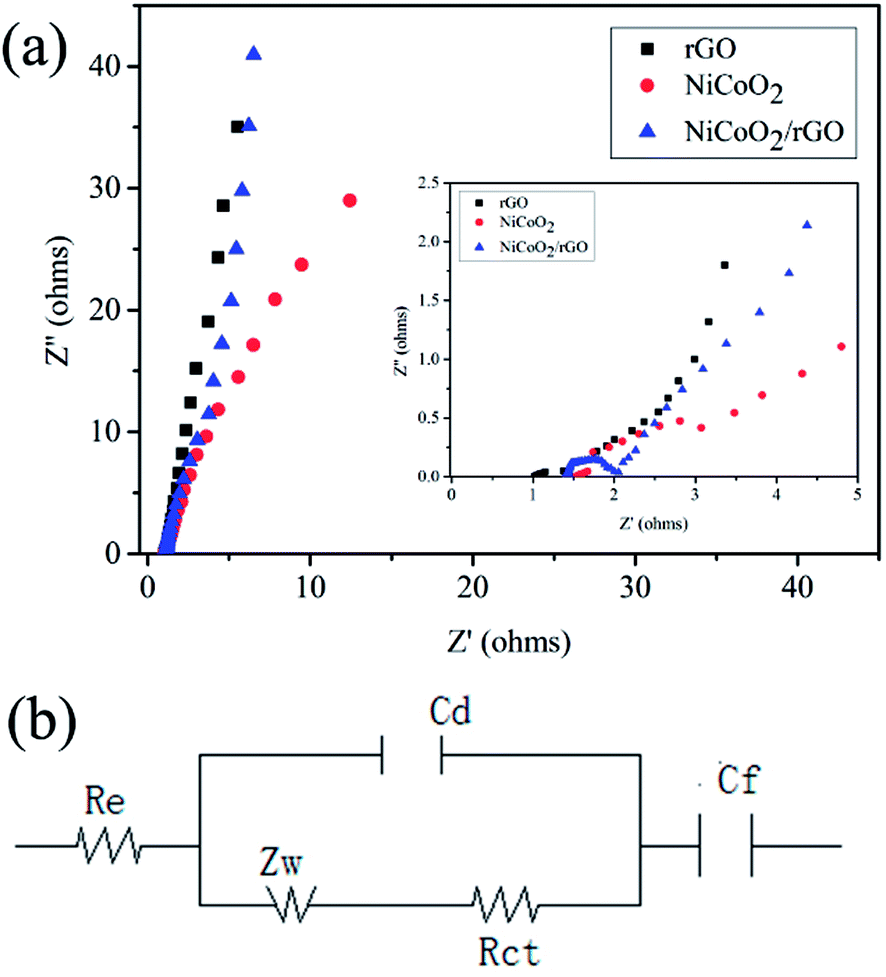
Electrochemical impedance spectra (EIS) measurement is also a significant aspect for quantitatively evaluating the electrical resistance of NiCoO2/rGO composites.46,47 Fig. 6(a) demonstrates the Nyquist plots of the rGO, NiCoO2 and NiCoO2/rGO electrodes to illustrate their impedance characteristics. The Nyquist plots are composed of semicircles in the higher (left) frequency region (in the inset of Fig. 6(a)) and sloping lines in the lower (right) frequency region. The equivalent circuit model of the EIS analysis is shown in Fig. 6(b), where Re, Rct, Zw, Cd and Cf are denoted as electrode series resistance, charge transfer resistance, Warburg impedance, electric double layer capacitance and faradic capacitance, respectively. From Fig. 6(a), we can see that NiCoO2/rGO displays a slightly bigger Re value (1.327 Ω) than that of rGO (0.898 Ω), indicating that the outstanding electronic conductivity of rGO is maintained in NiCoO2/rGO composites. Moreover, the charge transfer resistance (Rct) of NiCoO2/rGO composites is estimated to be 0.978 Ω, which is bigger than that of pure rGO. This can be attributed to the following facts: a portion of the charges in NiCoO2/rGO composites is used to transfer between the rGO sheets, and the remainder is used to participate in the faradic redox reaction. In addition, the NiCoO2/rGO composite electrode exhibits a 1ine that is more vertical than rGO in the low frequency region, indicating the fast ion diffusion in the electrolyte, and the adsorption onto the electrode surface.
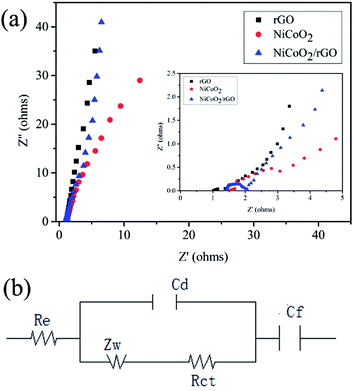 |
| | Fig. 6 EIS spectra (a) of rGO, NiCoO2 and NiCoO2/rGO electrodes in the frequency range from 100 kHz to 0.01 Hz and the electrical equivalent circuit (b) used for fitting the impedance spectra of NiCoO2/rGO. | |
4 Conclusion
We demonstrated a facile synthesis of novel hollow cubic NiCoO2/rGO composites with the structure of NiCoO2 nanoparticles anchored on layers of rGO through a template-assisted method and we investigated their electrochemical performance as a faradic electrode for supercapacitors. The 1% NiCoO2/rGO composites achieve a specific capacity of 1375 F g−1 at the current density of 1 A g−1 and maintain 742 F g−1 at 10 A g−1. From a 3000 cycle test, we can see that the long-term cycling performance of the 1%NiCoO2/rGO electrode at a current density of 1 A g−1. In particular, the specific capacity of NiCoO2/rGO composites is still 778 F g−1 after a 3000 cycle test of charging and discharging. Even if compared with other researchers' results (Table S2, ESI†), the hollow cubic 1% NiCoO2/rGO nanocage composites in this work show a superior specific capacity and high capacity retention. It has been observed that the 1% NiCoO2/rGO composites exhibit all improved capacitive performance, which can be attributed to the combination of mixed transition meta1 oxides and rGO, as well as its extraordinary hollow cubic structure. Owing to the synergistic effects between the two kinds of materials, there is efficient charge transport and electrolyte diffusion during the charge–discharge process. Moreover, the aggregation and volume expansion/contraction of electrochemical materials can be effectively prevented. These features make the NiCoO2/rGO composite a suitable and promising electrode material for efficient supercapacitors. Moreover, this template-assisted method can be easily generalized to other syntheses of mixed transition metals and carbon materials for supercapacitors.
Conflicts of interest
The authors have declared that no conflicts of interest exists.
Acknowledgements
This work was supported by the National Natural Science Foundation of China (No. 51672040) and the Fundamental Research Funds for the Central Universities.
Notes and references
- L. Wang, H. Tian and D. Wang, et al., Electrochim. Acta, 2015, 151, 407–414 CrossRef CAS.
- X. Q. Li, S. Y. Lin and M. Zhang, et al., Nano, 2016, 11, 1650050–1650057 CrossRef CAS.
- C. Zheng, C. Cao and Z. Ali, et al., J. Mater. Chem. A, 2014, 2, 16467–16473 CAS.
- Z. Xing, Q. Chu and X. Ren, et al., Electrochem. Commun., 2013, 32, 9–13 CrossRef CAS.
- A. P. D. Moura, L. H. D. Oliveira and P. F. S. Pereira, et al., Adv. Chem. Eng. Sci., 2012, 2, 465–473 CrossRef.
- Y. Wang, B. Chang and D. Guan, et al., Mater. Lett., 2014, 135, 172–175 CrossRef CAS.
- M. Kundu and L. Liu, Mater. Lett., 2015, 144, 114–118 CrossRef CAS.
- W. Deng, Y. Sun and Q. Su, et al., Mater. Lett., 2014, 137, 124–127 CrossRef CAS.
- J. Yang, X. Duan and Q. Qin, et al., J. Mater. Chem. A, 2013, 1(27), 7880–7884 CAS.
- B. Hua, X. Qin and A. M. Asirib, et al., Electrochim. Acta, 2013, 107, 339–342 CrossRef.
- C. Yuan, Y. Long and L. Hou, et al., Adv. Funct. Mater., 2012, 22, 2560–2566 CrossRef CAS.
- J. Yang, M. Cho and Y. Lee, Sens. Actuators, B, 2016, 222, 674–681 CrossRef CAS.
- W. Jiao and L. Zhang, Curr. Appl. Phys., 2016, 16, 115–119 CrossRef.
- R. Wu, X. Qian and K. Zhou, et al., American Chemical Society, 2014, 8, 6297–6303 CAS.
- L. Yu, L. Zhang and H. B. Wu, et al., Angew. Chem., 2014, 53, 3711–3714 CrossRef CAS PubMed.
- Y. Q. Zou, I. A. Kinloch and R. A. W. Dryfe, ACS Appl. Mater. Interfaces, 2015, 7, 22831–22838 CAS.
- J. Zhang, Z. Chen and Y. Wang, et al., Energy, 2016, 113, 943–948 CrossRef CAS.
- S. Sharma, M. Kumar and S. Rani, et al., Mater. Sci. Semicond. Process., 2016, 48, 1–8 CrossRef CAS.
- X. Leng, Y. Shao and L. Wu, et al., J. Mater. Chem. A, 2016, 4, 10304–10313 CAS.
- H. Wan, X. Ji and J. Yu, et al., J. Power Sources, 2013, 243, 396–402 CrossRef CAS.
- A. Mondal, S. Maiti and S. Mahanty, et al., J. Mater. Chem. A, 2017, 5, 16854–16864 CAS.
- L. Zhang, D. Zhang and Z. Ren, et al., ChemElectroChem, 2017, 4(2), 638–648 CrossRef.
- H. Zhang, D. F. Zhan and L. Guo, et al., J. Mater. Chem., 2009, 19, 5220–5225 RSC.
- J. W. Nai, Y. Tian, X. Guan and L. Guo, et al., J. Am. Chem. Soc., 2013, 135, 16082–16091 CrossRef CAS PubMed.
- M. C. Liu, L. B. Kong and C. Lu, et al., ACS Appl. Mater. Interfaces, 2012, 4, 4631–4636 CAS.
- X. Xu, B. Dong and S. Ding, et al., J. Mater. Chem. A, 2014, 2, 13069–13074 CAS.
- S. N. Tiruneh, B. K. Kang and Q. T. Ngoc, et al., RSC Adv., 2016, 6, 4764–4769 RSC.
- B. D. Chen, C. X. Peng and Z. Cui, Trans. Nonferrous Met. Soc. China, 2012, 22, 2517–2522 CrossRef CAS.
- R. Zhang, J. Liu and H. Guo, et al., Mater. Lett., 2014, 136, 198–201 CrossRef CAS.
- X. H. Guan, Z. W. Zhang and L. Yang, et al., Chempluschem, 2017, 82, 1174–1181 CrossRef CAS.
- F. Z. Deng, L. Yu and M. Sun, et al., Electrochim. Acta, 2014, 133, 382–390 CrossRef CAS.
- H. C. Chen, J. J. Jiang and L. Zhang, et al., Nanoscale, 2013, 5, 8879–8883 RSC.
- M. S. Kolathodi, M. Palei and N. S. Tirupattur, J. Mater. Chem. A, 2015, 3, 7513–7522 CAS.
- J. B. Wu, R. Q. Guo and X. H. Huang, et al., J. Power Sources, 2014, 248, 115–121 CrossRef CAS.
- A. C. Ferrari and J. Robertson, Phys. Rev. B, 2000, 61, 14095–14107 CrossRef CAS.
- J. W. Li, Y. Y. Liu and L. H. Xie, et al., Adv. Chem. Phys., 2015, 17, 4919–4925 CAS.
- L. M. Malard, M. A. Pimenta and G. Dresselhaus, et al., Phys. Rep., 2009, 473, 51–87 CrossRef CAS.
- H. Peng, M. Sun and D. Zhang, et al., Surf. Coat. Technol., 2016, 306, 171–175 CrossRef CAS.
- F. C. Tai, S. C. Lee and J. Chen, et al., J. Raman Spectrosc., 2009, 40, 1055–1059 CrossRef CAS.
- R. Kumar, R. K. Singh and P. K. Dubey, et al., Adv. Mater. Interfaces, 2015, 2, 1500191 CrossRef.
- X. Wang, W. Li and X. Wang, et al., RSC Adv., 2017, 7, 50753–50759 RSC.
- J. Liang, Z. Y. Fan and S. Chen, et al., Chem. Mater., 2014, 26, 4354–4360 CrossRef CAS.
- S. Raj, S. K. Srivastava and P. Kar, et al., RSC Adv., 2016, 6, 95760–95767 RSC.
- R. A. Patil, C. P. Chang and R. S. Devan, et al., ACS Appl. Mater. Interfaces, 2016, 8, 9872–9880 CAS.
- C. Yuan, L. Hou and Y. Feng, et al., Electrochim. Acta, 2013, 88, 507–512 CrossRef CAS.
- S. K. Meher, P. Justin and G. R. Rao, ACS Appl. Mater. Interfaces, 2011, 3, 2063–2073 CAS.
- A. Al-Osta, V. V. Jadhav and M. K. Zate, et al., Scr. Mater., 2015, 99, 29–32 CrossRef CAS.
Footnote |
| † Electronic supplementary information (ESI) available. See DOI: 10.1039/c8ra02267d |
|
| This journal is © The Royal Society of Chemistry 2018 |
Click here to see how this site uses Cookies. View our privacy policy here. 
 Open Access Article
 This Open Access Article is licensed under a Creative Commons Attribution-Non Commercial 3.0 Unported Licence
 a,
Mu Lia,
Hai-Zhen Zhanga,
Liu Yanga and
Guang-Sheng Wang
a,
Mu Lia,
Hai-Zhen Zhanga,
Liu Yanga and
Guang-Sheng Wang