 Open Access Article
Photocatalytic degradation of ethylene by Ga2O3 polymorphs
Hongshuai Liua,
Zeyan Wang*a,
Huiliang Lia,
Xiaoyang Zhanga,
Xiaoyan Qina,
Ying Daib,
Peng Wang a,
Yuanyuan Liua and
Baibiao Huang
 *a
*a
aState Key Laboratory of Crystal Materials, Shandong University, 250100, P. R. China. E-mail: wangzeyan@sdu.edu.cn; bbhuang@sdu.edu.cn
bSchool of Physics, Shandong University, 250100, P. R. China
First published on 17th April 2018
Abstract
In this work, we fabricated four different Ga2O3 polymorphs, namely, α-, β-, γ-, δ-Ga2O3, and investigated their photocatalytic activities by the degradation of ethylene under ultraviolet (UV) light irradiation. Owing to the more positive valence band, all these Ga2O3 polymorphs are more photocatalytic reactive than P25 during the degradation of ethylene. The normalized photocatalytic ethylene degradation rate constants of the as-prepared Ga2O3 polymorphs follow the order: α-Ga2O3 > β-Ga2O3 > γ-Ga2O3 > δ-Ga2O3, which is mainly determined by the position of VBM and the crystallinity of the samples. Among these Ga2O3 polymorphs, γ-Ga2O3, with the highest surface area, exhibits the highest activity during photocatalytic ethylene degradation, and the degradation rate constant is almost 10 times as that of P25. Furthermore, with the most positive CBM, γ-Ga2O3 produces the least CO. These attributes are beneficial for ethylene degradation during post-harvest storage of fruits and vegetables, which makes γ-Ga2O3 a potential candidate for practical photocatalytic ethylene degradations.
1. Introduction
Ethylene is a colorless and odorless gas that can be produced naturally by plant tissues and biomass fermentation. As ethylene can greatly accelerate the ripening process of fruits and vegetables, serious problems would be encountered during the postharvest storage of fruits and vegetables such as over-ripening, senescence, stimulated chlorophyll loss or promoted abscission of leaves and flowers, etc.1,2 Therefore, it is important to prevent the ethylene action during postharvest storage of fruits and vegetables. Up to now, various methods have been developed to control the action of ethylene such as the use of strong oxidizing agents to decompose ethylene, employing carbon or zeolites as ethylene absorber, or the use of ethylene inhibitor to prevent the synthesis of ethylene, etc.3–7 However, these techniques are usually expensive and require either long exposure times or complicated systems.Photocatalysis is a potential technique that can utilize solar energy to decompose organic pollutants or generate H2 by water splitting. Recently, it also emerges as a promising route to prevent ethylene action during the postharvest storage of fruit and vegetables owing to its low cost and continuity.8–12 For example, Amodio et al. demonstrated the completely elimination of ethylene (100 ppm) over TiO2/SiO2 composites under UV light irradiation for 2 h. However, comparing to traditional technique, i.e., potassium permanganate based formulation, the photocatalytic degradation rate is still lower.11 Therefore, it is still needed to further improve the photocatalytic ethylene degradation activity for practical applications.
Up to now, most studies on photocatalytic ethylene degradations are mainly based on the use of TiO2 as photocatalyst. As the photocatalytic activity on decomposing organic pollutants are mainly determined by the position of the conduction and valence bands of semiconductors, photocatalysts with wider band gaps, such as Ga2O3, ZrO2, are expected to be more efficient than TiO2. Among these wide band gap semiconductors, Ga2O3 is regarded as one of the most promising semiconductors owing to its superior physical and chemical properties and a wide band gap 4.2–5.0 eV, which has been widely investigated on overall water splitting, benzene decomposition and CO2 reduction, etc.13–17 Therefore, Ga2O3 is expected to be more efficient than TiO2 on photocatalytic ethylene degradations. Moreover, Ga2O3 has four polymorphs, namely, α-, β-, γ-, δ-, and ε-Ga2O3, which could lead to the variations on photocatalytic activities. For example, Hou et al. systematically investigated the photocatalytic activity of Ga2O3 polymorphs by decomposing volatile organic compounds, i.e., benzene, toluene, and ethylbenzene. And β-Ga2O3 is found to be the most efficient among the Ga2O3 polymorphs, which is more than 3 times higher than that of TiO2.18 However, the investigations on the photocatalytic ethylene degradations over Ga2O3 polymorphs have not been systematically investigated yet.
In this work, we fabricated four Ga2O3 polymorphs, namely, α-, β-, γ-, and δ-Ga2O3, and investigated their photocatalytic activities on ethylene degradation. The normalized photocatalytic degradation rate constant of the as-prepared Ga2O3 polymorphs is found to follow the order of α-Ga2O3 > β-Ga2O3 > γ-Ga2O3 > δ-Ga2O3, which is mainly determined by the position of VBM and the crystallinity of the samples. Owing to the highest surface area, γ-Ga2O3 exhibits the highest apparent photocatalytic activity on oxidizing ethylene to CO2, which makes it a potential candidate for practical photocatalytic ethylene degradations.
2. Experimental details
2.1 The fabrication of Ga2O3 polymorphs
The Ga2O3 polymorphs were fabricated by following the procedures reported elsewhere.19–21 α- and β-Ga2O3 were prepared by calcining GaO(OH) precursors at different temperatures according to literature.19 In details, 3 g of gallium nitrate hydrate was firstly dissolved in 40 ml ethanol (50 vol%). And then, the solution was slowly added into the aqueous ammonia with the same volume with continuous stirring. After stirring for 1 h at room temperature, the precipitates were filtered and washed with ethanol and deionized water, which was subsequently dried at 60 °C overnight. α- and β-Ga2O3 were obtained by calcining the above precursors at 400 and 800 °C for 4 h, respectively. γ-Ga2O3 was prepared as follows: 3 g nitrate hydrate was dissolved in 50 ml ethanol solvents, concentrated aqueous ammonia diluted in ethanol (50 vol%) was slowly added under continuous stirring at room temperature until no further precipitate was observed to form. The resulting gel was filtered, thoroughly washed with distilled and ethanol, and vacuum-dried in a desiccator. After that, the metal oxide obtained after it was calcined at 500 °C for 1 hour.20,21 δ-Ga2O3 was prepared by directly calcining gallium nitrate hydrate at 320 °C for 12 hours as reported.222.2 Characterizations
The XRD patterns of the as-prepared Ga2O3 polymorphs were characterized on a Bruker D8 advanced X-ray diffractometer with Cu kα radiation (λ = 1.5418 Å). The morphologies of the Ga2O3 polymorphs were obtained by scanning electron microscopy (SEM, Hitachi S-4800), and high-resolution electron transmission electron microscopy (HR-TEM, JEM 2100). The BET surface areas were determined by using N2 adsorption/desorption isotherm measurements by a Micromeritics ASAP 2020 apparatus. The UV-vis diffuse reflectance spectroscopy (DRS) measurements were recorded on a Shimadzu UV 2550 spectrophotometer equipped with an integrating sphere. X-ray photoelectron spectroscopy (XPS) valence band spectra were measured in a VG Micro-Tech ESCA 3000 X-ray photoelectron spectroscope within monochromatic Al Kα radiation, the photo energy is 1486.6 eV at the condition of >1 × 10⁻⁹ torr.2.3 Photocatalytic experiments
The photocatalytic experiments were performed in a closed quartz reactor with a total volume of 420 ml under UV light irradiation (UV lamp, 30 W, 185 nm and 254 nm). Firstly, 0.3 g as-prepared Ga2O3 polymorph samples were spread uniformly at the bottom of the reactor. Then, 0.5 ml C2H4 was injected into the sealed quartz reactor by a micro-syringe. The quartz reactor was subsequently kept in dark under magnetic stirring for 2 h to reach adsorption–desorption equilibrium before turning on the UV lamp. The reaction temperature was kept at 5 °C by water cooling during the whole experiment. The humidity in the photocatalytic process was 10%. Finally, the quartz reactor was exposed to UV light irradiation for photocatalytic reactions. 30 μl gas was withdrawn from the reactor at 1 h intervals to analyze the concentration of ethylene and carbon dioxide by injection into a gas chromatograph (Shimadzu GC-2014C and GCMS-QP2010 Ultra) equipped with a thermal conductive detector (TCD) and a flame ionization detector (FID). The degradation percentage of ethylene was represented in terms of C/C0, where C is the concentration of remained ethylene at a certain time, and C0 is the initial concentration of ethylene injected.3. Result and discussion
Fig. 1 shows the XRD patterns of as-prepared Ga2O3 polymorphs. As shown in this figure, all the XRD peaks of as-prepared samples can be well identified to the characteristic reflections of α-Ga2O3 (JCPDS no. 6-503), β-Ga2O3 (JCPDS no. 76-573), γ-Ga2O3 (JCPDS no. 20-426), δ-Ga2O3 (JCPDS no. 06-529), respectively. The broad and poor diffraction peaks of both γ-Ga2O3 and δ-Ga2O3 indicated the low crystallinity of the materials, which are also in accordance with literature.23–26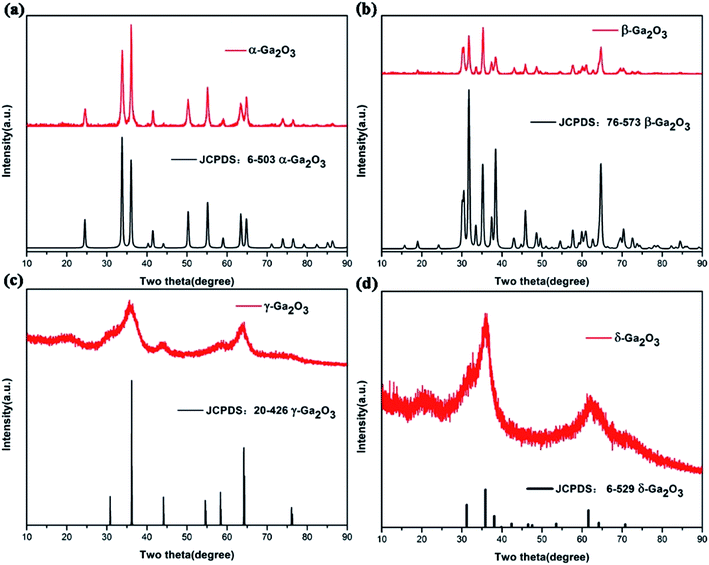 | ||
| Fig. 1 The XRD patterns of as-prepared Ga2O3 polymorphs: (a) α-Ga2O3, (b) β-Ga2O3, (c) γ-Ga2O3, (d) δ-Ga2O3, respectively. | ||
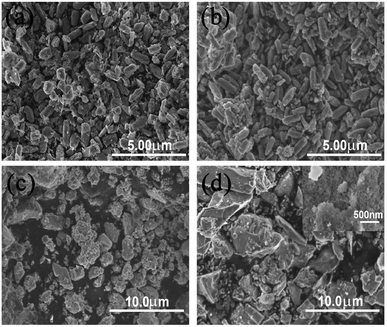
The morphologies of as-prepared Ga2O3 polymorphs were shown in Fig. 2. As shown in Fig. 2(a) and (b), the as-prepared α- and β-Ga2O3 exhibit similar morphologies, which are brick-like particles consisted of stacked nanosheets with evenly distributed sizes. The length and width (thickness) of the brick-like particles are ∼2 and ∼1 μm, respectively. Different from α- and β-Ga2O3, the as-prepared γ- and δ-Ga2O3 exhibit irregular morphologies consisted of some small nanoparticles as shown in Fig. 2(c) and (d).
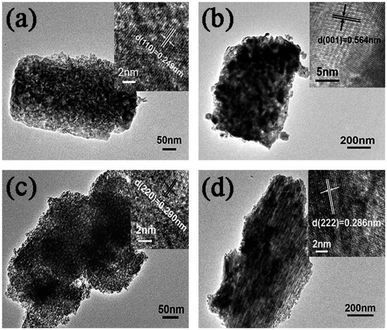
For a closer observation, HR-TEM characterizations of the as-prepared Ga2O3 polymorphs were carried out as shown in Fig. 3. Although the morphologies of the four Ga2O3 polymorphs are different as shown in Fig. 2, all these samples are consisted of some small nanoparticles according to the HR-TEM images as shown in Fig. 3. The clear lattice fringes as shown in the insets of Fig. 3 are corresponding to the (110) plane of α-Ga2O3, (001) plane of β-Ga2O3, (220) plane of γ-Ga2O3, (222) plane of δ-Ga2O3, which further confirmed the as-prepared samples are α-, β-, γ-, and δ-Ga2O3, respectively. The sizes of the nanoparticles building blocks are quite different, namely, the diameters of the nanoparticle building blocks are 6.6, 19.8, 4.1, and 6.3 nm for α-, β-, γ-, and δ-Ga2O3, respectively. And the BET surface areas of the as-prepared Ga2O3 polymorphs were also measured as shown in Table 1. The surface areas for α-, β-, γ-, and δ-Ga2O3 are 58.45, 17.75, 110.19, and 78.21 m2 g−1, respectively. This is accordant with the HR-TEM observations, where smaller nanoparticles lead to higher surface areas.
| α-Ga2O3 | β-Ga2O3 | γ-Ga2O3 | δ-Ga2O3 | |
|---|---|---|---|---|
| BET surface area (m2 g−1) | 58.45 | 17.75 | 110.19 | 78.21 |
| Band gap (eV) | 4.86 | 4.36 | 4.43 | 4.33 |
| Reaction rate constant (h−1) | 0.661 | 0.148 | 0.861 | 0.217 |
Fig. 4 shows the diffused reflectance spectra of as-prepared Ga2O3 polymorphs. As can be seen from this figure, the light absorption edge of β-, γ-, and δ-Ga2O3 is almost identical, which lies at ∼300 nm. But the absorption edge of α-Ga2O3 is much shorter, lying at ∼270 nm. And as shown in the Tauc's plots of Ga2O3 polymorphs in Fig. 4(b), the band gap for α-, β-, γ-, and δ-Ga2O3 is calculated to be 4.86, 4.36, 4.33, 4.43 eV, respectively.
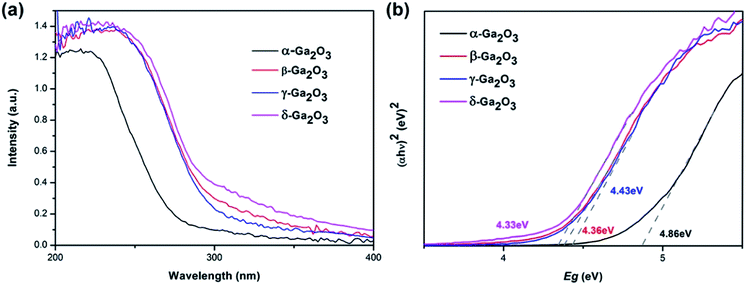 | ||
| Fig. 4 (a) The diffused reflectance spectra and (b) Tauc's plots of as-prepared α-, β-, γ- and δ-Ga2O3. | ||
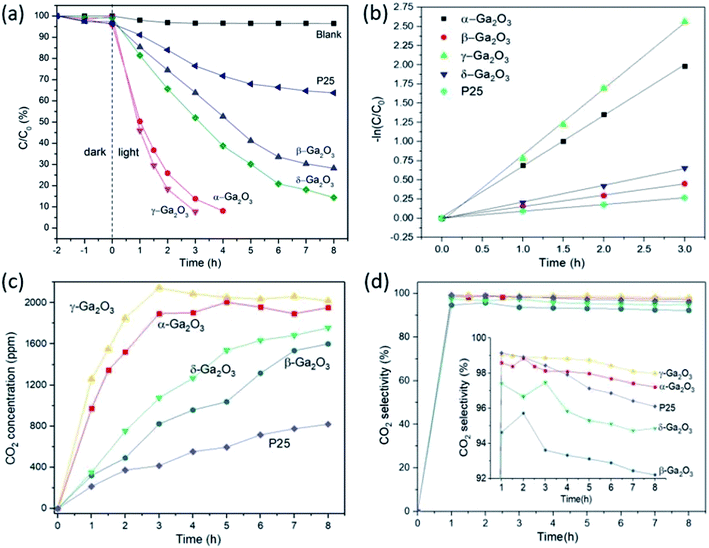
The photocatalytic activity of as-prepared Ga2O3 polymorphs was evaluated by the degradation of ethylene under UV irradiation. For comparison, P25 was also employed to decompose ethylene under identical condition. As shown in Fig. 5(a), before illumination, dark adsorption experiments were carried out in dark for 2 hours. After the adsorption equilibrium, only a small amount of ethylene was adsorbed by the as-prepared samples. And the ethylene concentrations decrease from 1100 ppm to 1057, 1072, 1096, 1091, 1060 ppm for α-, β-, γ-, δ-Ga2O3 and P25, respectively. As shown in the photocatalytic ethylene degradation plots in Fig. 5(a), γ-Ga2O3 exhibits the highest photocatalytic activity among these Ga2O3 polymorphs, which can decompose the ethylene gas in 3 h. And the photocatalytic activity of α-Ga2O3 is slightly lower than that of γ-Ga2O3, where the ethylene can be decomposed in 4 h. β- and δ-Ga2O3 are less photocatalytic reactive comparing to γ- and α-Ga2O3, which can decompose 72% and 86% after irradiated under UV light for 8 h, respectively. However, all the Ga2O3 polymorphs exhibit higher activity than P25, where only ∼36% of ethylene can be decomposed over P25 under identical conditions in 8 h. The photocatalytic degradation rates of the Ga2O3 polymorphs and P25 were also calculated as shown in Fig. 5(b), which exhibit a pseudo-first-order relationship. The degradation rate constant for α-, β-, γ-, δ-Ga2O3 and P25 is 0.661, 0.148, 0.861, 0.217 and 0.089 h−1, respectively (Table 1). Apparently, the highest ethylene degradation rate of γ-Ga2O3 is nearly 10 times as high as that of P25. As the activity of the photocatalysts is closely related to their specific surface areas, the highest photocatalytic activity of as-prepared γ-Ga2O3 could be mainly ascribed to the largest surface areas among these Ga2O3 polymorphs. By normalizing the degradation rate constants to the specific surface areas, α-Ga2O3 exhibited the highest photocatalytic activity with the normalized rate constant of 0.01132 m2 (g h)−1. While, the normalized constant for β-Ga2O3, γ-Ga2O3, δ-Ga2O3, P25 is 0.00836, 0.00781, 0.00278 and 0.00197 m2 (g h)−1, respectively. Thus, the photocatalytic activity of the as-prepared Ga2O3 polymorphs after normalizing to the surface areas should follow the order: α-Ga2O3 > β-Ga2O3 > γ-Ga2O3 > δ-Ga2O3.
As shown in Fig. 5(c), the concentration of CO2 increases constantly with the degradation of ethylene. As the CO2 is mainly produced by the photocatalytic degradation of ethylene, the amount of CO2 produced over different photocatalysts are mainly determined by the photocatalytic degradation of ethylene and accordant with the degradation rate constants as shown in Fig. 5(a) and Table 1. By analyzing the products during the photocatalytic experiments, CO2 was found to be the main products as shown in Fig. 5(d), which take part in more than 90% of the final products for all the samples. However, the percentage of CO2 produced over different Ga2O3 polymorphs varies a lot as shown in the inset of Fig. 5(d). In detail, the percentage of CO2 is the highest in γ-Ga2O3, which takes 98% of the final products at the end of the photocatalytic experiments. And the percentage of CO2 for α-Ga2O3, P25, δ-Ga2O3 and β-Ga2O3 is 97.2, 96.1, 94.8, and 92.2%, respectively. More interestingly, the percentage of CO2 in the products gradually decreased with the increase of the photocatalytic experiment time. This indicates part of the produced CO2 could be further converted to other secondary products, such as CO and CH4, which would be unfavorable for the practical applications during the postharvest storage of fruits and vegetables. From this aspect, γ-Ga2O3 with highest photocatalytic ethylene degradation rate and highest CO2 conversion efficiency could be the most suitable candidate among the as-prepared Ga2O3 polymorphs for photocatalytic ethylene degradation.
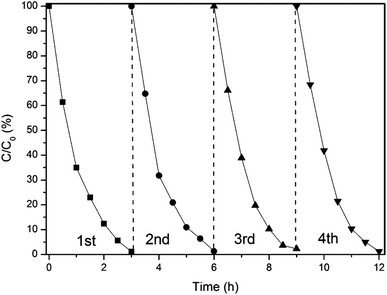
To evaluate the cycling stability of γ-Ga2O3, four consecutive-cycle ethylene degradation experiments were conducted. As shown in Fig. 6, the sample does not show any particular loss of photocatalytic activity for ethylene degradation during the repeated experiments. Therefore, γ-Ga2O3 can work as an effective photocatalyst for ethylene degradation with good stability.
To probe the mechanism for the different photocatalytic performances of the as-prepared Ga2O3 polymorphs, the band structures were investigated by XPS valence spectra. As shown in Fig. 7(a), the valence band maximum (VBM) of the as-prepared Ga2O3 polymorphs were determined by extrapolating a linear fit of the low binding energy edge of the valence band spectra to line fitted to the instrument background. The VBM of as-prepared Ga2O3 polymorphs can be determined according to the formula:
| EVB = E + φAl − 4.5 |
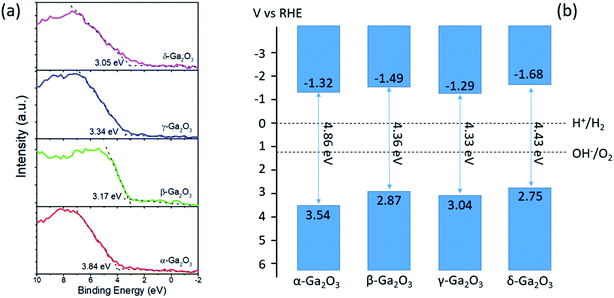 | ||
| Fig. 7 (a) The XPS valence spectra of as-prepared Ga2O3 polymorphs. (b) The calculated band diagrams for α-, β-, γ-, and δ-Ga2O3, respectively. | ||
As the photocatalytic ethylene degradation into CO2 is an oxidation process, the photocatalytic ethylene degradation activity of as-prepared Ga2O3 polymorphs is mainly determined by their VBM, and should follow the order: α-Ga2O3 > γ-Ga2O3 > β-Ga2O3 > δ-Ga2O3. This order is almost accordant with the normalized degradation rate constants for the as-prepared Ga2O3 polymorphs except for β-Ga2O3, where β-Ga2O3 with more negative VBM is more reactive than γ-Ga2O3. This could be due to the higher crystallinity of β-Ga2O3 as evidenced by the sharper XRD diffraction peaks as shown in Fig. 1 than γ-Ga2O3, because photogenerated charge carriers recombine more quickly in poorly crystallized photocatalysts. Besides the effects of VBM and crystallinity, the photocatalytic performances of photocatalysts were also closely related to the surface areas of the photocatalysts. Thus, although the normalized degradation rate constant of α- and β-Ga2O3 is higher than γ-Ga2O3, the overall photocatalytic performance of γ-Ga2O3 is the highest among the as-prepared Ga2O3 polymorphs owing to the highest specific surface areas. Additionally, with the most positive CBM, γ-Ga2O3 produces the least CO during the photocatalytic ethylene degradation among the Ga2O3 polymorphs. Both of these attributes are favorable for photocatalytic ethylene degradation during the post-harvest storage of fruits and vegetables, which make γ-Ga2O3 a potential candidate for practical photocatalytic ethylene degradations.
4. Conclusions
In this work, we fabricated four Ga2O3 polymorphs and investigated their photocatalytic activities on ethylene degradation. According to the experimental results, all the as-prepared Ga2O3 polymorphs exhibit higher photocatalytic activities on ethylene degradation than P25 under UV light irradiation. The normalized photocatalytic ethylene degradation rate constant of the as-prepared Ga2O3 polymorphs follows the order: α-Ga2O3 > β-Ga2O3 > γ-Ga2O3 > δ-Ga2O3, which could be ascribed to the synergistic effects of the VBM position and the crystallinity of the samples. Due to the highest surface area, γ-Ga2O3 exhibits the highest photocatalytic activity for ethylene degradation among these Ga2O3 polymorphs, which has a degradation rate constant 10 times as high as that of P25. Furthermore, γ-Ga2O3 produces the least CO during ethylene degradation due to its more positive CBM. Based on these attributes, γ-Ga2O3 is regarded as a potential candidate for photocatalytic ethylene degradations that could be applied in the post-harvest storage of fruits and vegetables.Conflicts of interest
The authors declare no competing financial interest.Acknowledgements
This work is financially supported by the National Natural Science Foundation of China (21333006, 21573135, and 51602179), the National Basic Research Program of China (the 973 program, 2013CB632401). B. B. H. acknowledges the support from Taishan Scholars Program of Shandong Province, and Z. Y. W. acknowledges support from Young Scholars Program of Shandong University (2015WLJH35).References
- B. Kartheuser and C. Boonaert, J. Adv. Oxid. Technol., 2007, 10(1), 107–110 CAS.
- M. E. Saltveit, Postharvest Biol. Technol., 1999, 15(3), 279–292 CrossRef CAS.
- L. Vermeiren, F. Devlieghere, M. Van Beest, N. De Kruijf and J. Debevere, Trends Food Sci. Technol., 1999, 10(3), 77–86 CrossRef CAS.
- G. Capitani, E. Hohenester, L. Feng, P. Storici, J. F. Kirsch and J. N. Jansonius, J. Mol. Biol., 1999, 294(3), 745–756 CrossRef CAS PubMed.
- D. Martínez-Romero, G. Bailén, M. Serrano, F. Guillén, J. M. Valverde, P. Zapata, S. Castillo and D. Valero, Crit. Rev. Food Sci. Nutr., 2007, 47(6), 543–560 CrossRef PubMed.
- Z.-X. Liu, J.-N. Park, S. H. R. Abdi, S.-K. Y Park, Y.-K. Park and C. W. Lee, Top. Catal., 2006, 39(3–4), 221–226 CAS.
- G. Bailén, F. Guillén, S. Castillo, M. Serrano, D. Valero, D. Martínez-Romero and J. Agric, Food Chem., 2006, 54, 2229–2235 CrossRef PubMed.
- C. Maneerat, Y. Hayata, N. Egashira, K. Sakamoto, Z. Hamai and M. Kuroyanagi, Trans. ASABE, 2003, 46(3), 725–730 CAS.
- S.-Y. Ye, Q.-M. Tian, X.-L. Song and S.-C. Luo, J. Photochem. Photobiol., A, 2009, 208(1), 27–35 CrossRef CAS.
- M. Hussain, S. Bensaid, F. Geobaldo, G. Saracco and N. Russo, Ind. Eng. Chem. Res., 2011, 50(5), 2536–2543 CrossRef CAS.
- M. L. V. De Chiara, S. Pal, A. Licciulli, M. L. Amodio and G. Colelli, Biosyst. Eng., 2015, 132, 61–70 CrossRef.
- X. Z. Liang, P. Wang, M. M. Li, Q. Q. Zhang, Z. Y. Wang, Y. Dai, X. Y. Zhang, Y. Y. Liu, M.-H. Whangbo and B. B. Huang, Appl. Catal., B, 2018, 220, 356–361 CrossRef CAS.
- M. Seijiro, Y. Yutaka and O. koichiro, Chem. Lett., 2004, 33(3), 294–295 CrossRef.
- Y. D. Hou, J. J. Zhang, Z. X. Ding and L. Wu, Powder Technol., 2010, 203(3), 440–446 CrossRef CAS.
- H. Oveisi, C. Anand, A. Mano, S. S. Al-Deyab, P. Kalita, A. Beitollahi and A. Vinu, J. Mater. Chem., 2010, 20, 10120–10129 RSC.
- T. F. Liu, L. Tranca, J. X. Yang, X. Zhou and C. Li, J. Mater. Chem. A, 2015, 3, 10309–10319 CAS.
- H. Abdullah, N. S. Gultom and D.-H. Kuo, New J. Chem., 2017, 41, 12397–12406 RSC.
- Y. D. Hou, L. Wu, X. C. Wang, Z. X. Ding, Z. H. Li and X. Z. Fu, J. Catal., 2007, 250(1), 12–18 CrossRef CAS.
- Y. D. Hou, X. C. Wang, L. Wu, Z. X. Ding and X. Z. Fu, Environ. Sci. Technol., 2006, 40(18), 5799–5803 CrossRef CAS PubMed.
- C. Otero Areán, A. L. Bellan, M. P. Mentruit, M. R. Delgado and G. T. Palomino, Microporous Mesoporous Mater., 2000, 40(1–3), 35–42 CrossRef.
- J. Bohm, Angew. Chem., 1940, 53, 131 CrossRef.
- R. Roy, V. G. Hill and E. F. Osborn, J. Am. Chem. Soc., 1952, 74, 719–722 CrossRef CAS.
- C.-C. Huang and C.-S. Yeh, New J. Chem., 2010, 34, 103–107 RSC.
- L. D. Li, W. Wei and M. Behrens, Solid State Sci., 2012, 14, 971–981 CrossRef CAS.
- M. Zinkevich, F. M. Morales, H. Nitsche, M. Ahrens, M. Rühle and F. Aldinger, Z. Metallkd., 2004, 95(9), 756–762 CrossRef CAS.
- M. Hegde, T. Wang, Z. L. Miskovic and P. V. Radovanovic, Appl. Phys. Lett., 2012, 100(14), 141903–141907 CrossRef.
- M. T. Greiner, M. G. Helander, W.-M. Tang, Z.-B. Wang, J. Qiu and Z.-H. Lu, Nat. Chem., 2012, 11, 76–81 CAS.
| This journal is © The Royal Society of Chemistry 2018 |

