 Open Access Article
On the synergy between silver nanoparticles and doxycycline towards the inhibition of Staphylococcus aureus growth
Heloiza F. O. Silvaa,
Rayane P. de Limaa,
Fernanda S. L. da Costaa,
Edgar P. Moraesa,
Maria C. N. Melob,
Celso Sant’Annac,
Mateus Eugênioc and
Luiz H. S. Gasparotto*a
aBiological Chemistry and Chemometrics Research Group, Institute of Chemistry, Federal University of Rio Grande do Norte, Natal 59072-970, RN, Brasil. E-mail: lhgasparotto@ufrnet.br; Tel: +55 84 33422323
bLaboratory of Medical Bacteriology, Center of Biosciences, Federal University of Rio Grande do Norte, Natal 59078-970, RN, Brasil
cLaboratory of Biotechnology – Labio, National Institute of Metrology, Quality and Technology – Inmetro, Duque de Caxias 25250-020, RJ, Brazil
First published on 28th June 2018
Abstract
In a previous paper (RSC Adv., 2015, 5, 66886–66893), we showed that the combination of silver nanoparticles (NanoAg) with doxycycline (DO) culminated in an increased bactericidal activity towards E. coli. Herein we further investigated the metabolic changes that occurred on Staphylococcus aureus upon exposure to NanoAg with the help of attenuated total reflectance Fourier transform infrared spectroscopy (ATR-FTIR) coupled with multivariate data analysis. It has been discovered that the combination of DO with NanoAg produced metabolic changes in S. aureus that were not simply the overlap of the treatments with DO and NanoAg separately. Our results suggest that DO and NanoAg act synergistically to impede protein synthesis by the bacteria.
1 Introduction
It is widely known that the indiscriminate administration of antibiotics has rendered pathogens resistant to a variety of broad-spectrum antibiotics.1 In order to circumvent this issue, nanoscience has worked in conjunction with biology and medicine to develop more efficient bactericidal agents.2 As examples, silver nanoparticles have been used against E. coli3,4 and gold nanoparticles for killing S. aureus.5 Some researchers have attempted to combine nanoparticles with antibiotics to generate more potent antimicrobial agents.6 Due to their large surface-area-to-volume ratio and biocompatibility, inorganic nanoparticles are considered ideal candidates for carrying large amounts of antibiotics without compromising their activity. Li et al.7 demonstrated that the combination of silver nanoparticles with amoxicillin produced stronger bactericidal effect towards Escherichia coli in comparison to the administration of the components separately. Our group8 showed that the conjugation of polyvinylpyrrolidone (PVP)-capped silver nanoparticles (NanoAg) with doxycycline (DO) yielded quite a potent agent for the inhibition of E. coli. An interesting question that follows is what biological changes occur upon contacting bacteria with NanoAg and DO-modified NanoAg. With that information in hand, it would be possible to fashion NanoAg with superior biocidal activities against a broader range of pathogens.Silver nanoparticles may act via four main routes:9 (1) adhesion to the microbial cell membrane causing damage and altering transport activity; (2) penetration inside the cell leading to organelle (ribosomes, DNA, RNA) dysfunction; (3) oxidation of proteins, lipids and DNA bases through oxidative stress; (4) alteration of cell signaling. Thus, as multiple factors are altered simultaneously, it is logical to measure the metabolism directly instead of selecting a single marker at a time. To that end, infrared spectroscopy (FT-IR) emerges as an interesting technique for metabolic fingerprinting,10 owing to its capability to examine proteins, carbohydrates, lipids, amino acids and fatty acids concurrently. Coupled with multivariate data analysis,10 FT-IR renders metabolic fingerprinting an excellent tool to discriminate between groups of related biological samples, in addition to being rapid and non-destructive.
In the present study, we exposed S. aureus to silver nanoparticles modified with doxycycline (DO, a member of the tetracycline group) and employed FT-IR coupled with multivariate data analysis to access variations of the S. aureus metabolism. DO-functionalized NanoAg caused the greatest alteration in the metabolism of S. aureus in comparison to that of bacteria treated with DO and NanoAg separately, which made possible the discrimination of bacteria subjected to those different treatments. These results corroborate nicely our previous work8 in which we showed that the combination of DO with NanoAg delivered an increased antimicrobial activity towards E. coli.
2 Experimental section
2.1 Chemicals and reagents
Sodium hydroxide, glycerol, silver nitrate, polyvinylpyrrolidone (PVP; molecular weight = 10![[thin space (1/6-em)]](https://www.rsc.org/images/entities/char_2009.gif) 000), and doxycycline hyclate (>98%) were obtained from Sigma-Aldrich Chemical Co (MO, USA). Staphylococcus aureus (ATCC® 25923™) was cultivated in laboratory.
000), and doxycycline hyclate (>98%) were obtained from Sigma-Aldrich Chemical Co (MO, USA). Staphylococcus aureus (ATCC® 25923™) was cultivated in laboratory.
2.2 Production and characterization of NanoAg
NanoAg were produced according to a reported method.11 Briefly, all glassware was cleaned thoroughly with a KMnO4 + NaOH solution and piranha solution. The following aqueous stock solutions were then produced: 50 mmol L−1 AgNO3, 100 g L−1 PVP and a solution containing 1.0 mol L−1 NaOH + 1.0 mol L−1 glycerol. In a beaker, determined volumes of the PVP and AgNO3 solutions were dissolved in water to yield a 5 ml solution. In a separate beaker, a known volume of the NaOH + glycerol solution was mixed with water to generate another 5 ml solution. The glycerol–NaOH solution was poured into the AgNO3–PVP one to yield the following final concentrations: 0.10 mol L−1 glycerol and NaOH, 10.0 g L−1 PVP and 1.0 mmol L−1 AgNO3. The NanoAg colloidal solutions had then their pH adjusted to 7 by addition of diluted HCl.UV-VIS was performed with an Ocean Optics USB-650 Tide spectrophotometer. FTIR in ATR mode was carried out with a Bruker Vertex 70 spectrophotometer and Transmission Electron Microscopy (TEM) images were acquired with a FEI Tecnai G2 Spirit BioTWIN microscope operating at 120 kV.
2.3 Conjugation of DO with NanoAg
Conjugation of NanoAg with DO was achieved by simple incubation according to a previous protocol.8 Five milliliters of a 200 μg ml−1 doxycycline stock solution were added to the same volume of the NanoAg colloidal solution, generating a 10 ml DO–NanoAg solution. The final concentrations of NanoAg and DO in the conjugate were 0.2 × 10⁻⁹ mol L−1 and 0.2 × 10⁻³ mol L−1, respectively. All the above-mentioned techniques were employed to characterize the NanoAg–antibiotic complex.2.4 Exposition of S. aureus to DO, NanoAg and DO–NanoAg
Staphylococcus aureus (strain ATCC® 25923™) was cultured in Brain-Heart-Infusion (BHI) agar medium on a Petri dish at 37 °C for 24 h. A microbiological strain suspension was standardized at 0.5 McFarland which is equivalent to 1.0 × 10⁸ CFU ml−1 in 0.9% sterile saline medium. The suspension was then swabbed onto another Petri dish containing sterile Müller–Hinton agar medium and allowed to grow at 37 °C for 12 h. Afterwards, 1.5 ml of the antimicrobial agents (NanoAg, DO or the DO–NanoAg conjugate) was applied on the bacterial colony with the aid of a micropipette. The plates were incubated for further 12 h at 37 °C.2.5 ATR-FTIR analysis
Bacteria were gently scraped off the Petri dish with a sterile metal handle, placed on the sample holder of the ATR-FTIR equipment, and covered with a piece of aluminum foil. The latter enhances the FTIR signal without interference due to its featureless background signal.12 FTIR spectra were acquired in quintuplicate from each sample of the following groups (24 samples per group): control (S. aureus without any treatment), DO (S. aureus treated with doxycycline), NanoAg (S. aureus treated with silver nanoparticles), and DO–NanoAg (S. aureus treated with the conjugate), adding up to a total of 480 spectra. Measurements were conducted on a Bruker VERTEX 70 FTIR spectrometer (Bruker Optics Ltd., Coventry, UK) with a Helios ATR attachment containing a diamond crystal internal reflective element and a 45° incidence angle of the IR beam. Each spectrum was a result of 16 scans at a spectral resolution of 4 cm−1. After each acquisition the sample holder was cleaned with 70% alcohol (v/v).2.6 Chemometric procedure
Data import, pre-treatment and chemometric procedures were carried out with MATLAB R2014a software (MathWorks, USA) with the PLS-toolbox version 7.5.2 (Eigenvector Research, Inc., Wenatchee, WA). Raw spectra were pre-processed by selecting the range of 1800 cm−1 to 900 cm−1 (468 wavenumbers at 4 cm−1 spectral resolution) and mean-centering. PCA model was constructed with 96 samples (24 samples of each class: control, DO, DO + NanoAg, NanoAg), using 4 PCs, that explained 97.6% of total variance. PLS-DA models were made for each two classes of treatments (control, DO, DO + NanoAg, NanoAg). Using the algorithm Kennard–Stone (KS), separately to each class, the samples were divided into training/validation (70%) and prediction sets (30%). The model performance was evaluated by figures of merit: sensitivity, specificity and confusion matrix.3 Results and discussion
3.1 Synthesis and characterization of NanoAg
In this study, NanoAg were produced with glycerol in alkaline medium as reducing agent at room temperature. Since glycerol is produced nowadays as a byproduct of the biodiesel fabrication, its supply has surpassed the current demand making glycerol a relatively inexpensive chemical.8 Due to its biodegradability under aerobic conditions, non-toxicity, and low price, glycerol has become more attractive for generating nanoparticles than established reducing chemicals such as formamide, sodium borohydride and hydrazine. Fig. 1A suggests that NanoAg and DO interact to some extent. The UV-VIS spectrum of the mathematical combination of pure DO and NanoAg spectra (blue curve) shows a maximum at 410 nm corresponding to the characteristic Surface Plasmon Resonance (SPR) of PVP-stabilized spherical NanoAg, a peak at 365 nm due to the π-electron system located in the BCD chromophore (see Fig. 1B), and absorptions below 300 nm due to a combined contribution of the BCD system with the tricarbonylmethane keto–enol system comprised in ring A.13 The mixing of DO with NanoAg (red curve) causes all DO absorptions to shift, implying an interaction of that system with the NanoAg. In a previous study,8 we deeply investigated the interaction between DO and NanoAg via FTIR, showing that the capping agent, the PVP, was of paramount importance in augmenting the DO concentration around the nanoparticles. In addition to the chemical interaction, DO is kept in the vicinity of the particle due to the PVP-shell structure that encapsulates the DO.14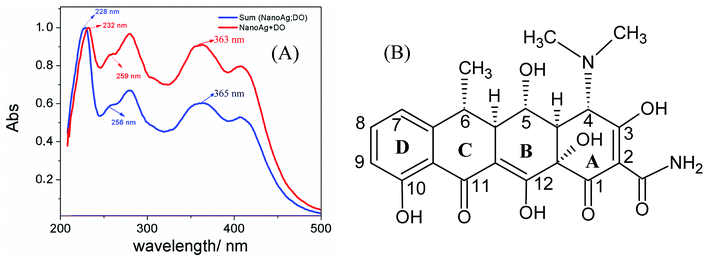 | ||
| Fig. 1 (A) UV-VIS spectra of DO mixed with AgNPs (red curve) and the mathematical combination of the DO and NanoAg pure spectra. (B) Chemical structure of doxycycline. | ||
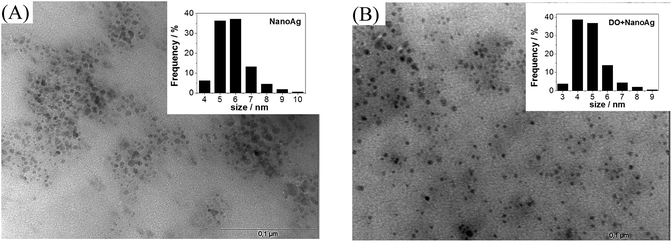
TEM images of NanoAg (Fig. 2B and C) showed that the conjugation with DO had practically no impact on both shape and size distribution of NanoAg, which is an important result since it can rule out size and shape effects on bacteriological experiments.
3.2 Exposition of S. aureus to DO, NanoAg and DO–NanoAg
The spectra were then subjected to the unsupervised Principal Components Analysis (PCA) classification model, followed by the supervised classification of Partial Least Squares Discriminant Analysis (PLS-DA) for the binary classification, as shown in Fig. 4.
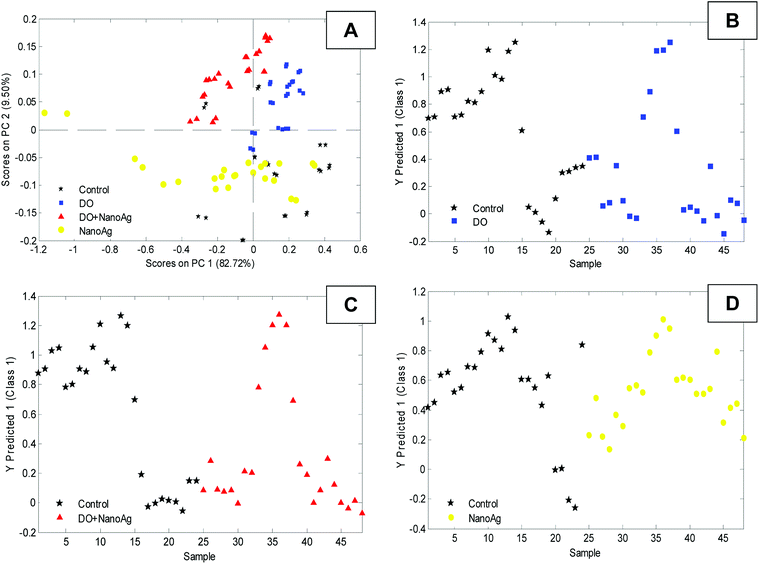 | ||
| Fig. 4 Multivariate data analysis of selected variables in the samples. (A) Principal Component Analysis (PCA) of variables by the four classes and (B–D) PLS-DA by pairs. | ||
The plot of the PCA discrimination function with the mean FTIR-ATR spectra (Fig. 4A) revealed a degree of segregation between the classes, meaning that the methodology allowed for the detection of variables that differentiate the groups which were then compared in pairs via PLS-DA: control vs. DO, control vs. NanoAg, and control vs. DO + NanoAg. This method indicated the wavenumbers whose changes were statistically significant for each group. Fig. 4B–D shows the PLS-DA plots for the three comparisons. For the determination of the best models, a confusion matrix (Table 1) was compiled with the values of true positive, true negative and type I and II errors.
| Actual (%) | |||
|---|---|---|---|
| Predicted (%) | Control | DO | |
| Control | 75.0 | 0 | |
| DO | 25.0 | 100 | |
| Control | DO + NanoAg | ||
| Control | 75.0 | 0 | |
| DO + NanoAg | 25.0 | 100 | |
| Control | NanoAg | ||
| Control | 100 | 50.0 | |
| NanoAg | 0 | 50.0 | |
It is possible to observe in Table 1 that of the three models the treatments with DO and DO + NanoAg presented the smallest errors, being classified 100% in their classes. The NanoAg model presented a 50% accuracy rate, corroborating the PCA discrimination function, showing that it is difficult to find a standard for differentiation because it presents a variance within the very high class. The values of the parameters of quality: sensitivity, specificity, RMSEC, RMSECV and RMSEP were also taken into account for the three best models. All the best models used 2 latent variables (see Table 2). These values show that there was good classification, especially for the control versus DO (sensibility: control 75% and DO 100% − specificity control 100% and DO 75%) and control versus DO + NanoAg (sensibility: control 75% and DO + NanoAg 100% − specificity control 100% and DO + NanoAg 75%) pairs that presented the highest values of sensitivity and specificity. These results confirm the potential of FITR-ATR spectroscopy to detect and identify groups with different metabolic responses of S. aureus after exposure to the three antimicrobials DO, NanoAg and DO + NanoAg.
| Accuracy (%) | Models PLS-DA (2 LVs) | ||
|---|---|---|---|
| Control vs. DO | Control vs. NanoAg | Control vs. DO + NanoAg | |
| Calibration | |||
| Sensibility (%) | 93.8 | 87.5 | 93.8 |
| Specificity (%) | 100 | 62.5 | 100 |
![[thin space (1/6-em)]](https://www.rsc.org/images/entities/char_2009.gif) |
|||
| Prediction | |||
| Sensibility (%) | 75.0 | 100 | 75.0 |
| Specificity (%) | 100 | 50.0 | 100 |
| RMSEC | 0.284 | 0.388 | 0.201 |
| RMSECV | 0.339 | 0.443 | 0.222 |
| RMSEP | 0.388 | 0.412 | 0.318 |
Table 3 was constructed with the aid of the most significant variables present in the loadings generated in each of the three models. From these variables, the wave numbers responsible for the discrimination were recovered. Literature data were used to assign the characteristic group to each wave number retrieved.
| Model | Wavelength | Abscontrol | Abstreated | Assignment | Literature |
|---|---|---|---|---|---|
| a *Different averages (p < 0.05). | |||||
| Control versus DO | ∼1647 cm−1 | 0.51 (0.02) | 0.51 (0.01) | Stretching of C![[double bond, length as m-dash]](https://www.rsc.org/images/entities/char_e001.gif) O in amide (amide I) of structural proteins. O in amide (amide I) of structural proteins. |
28–30 |
| ∼1631 cm−1 | 0.53 (0.02) | 0.52 (0.01) | Stretching of C![[double bond, length as m-dash]](https://www.rsc.org/images/entities/char_e001.gif) O in amide (amide I) of structural proteins. O in amide (amide I) of structural proteins. |
28–30 | |
| ∼1547 cm−1 | 0.31 (0.02)* | 0.30 (0.01)* | N–H bending and C–N stretching in amide (amide II) of structural proteins. | 27–30 | |
| ∼1543 cm−1 | 0.30 (0.02) | 0.30 (0.01) | N–H bending and C–N stretching in amide (amide II) of structural proteins. | 27–30 | |
| ∼1400 cm−1 | 0.19 (0.02) | 0.19 (0.01) | –COO− symmetric stretching of amino acid side chains and fatty acids | 27–29 and 31 | |
| ∼1080 cm−1 | 0.21 (0.01)* | 0.23 (0.01)* | C–O–C. C–O of various polysaccharides | 27–29 and 31 | |
| Control versus DO + NanoAg | ∼1635 cm−1 | 0.54 (0.02)* | 0.50 (0.01)* | β-pleated sheet structures (amide I) of structural proteins. | 27 and 29 |
| ∼1630 cm−1 | 0.53 (0.02)* | 0.49 (0.01)* | Stretching of C![[double bond, length as m-dash]](https://www.rsc.org/images/entities/char_e001.gif) O in amide (amide I) of structural proteins. O in amide (amide I) of structural proteins. |
28–30 | |
| ∼1543 cm−1 | 0.30 (0.02)* | 0.27 (0.01)* | N–H bending and C–N stretching in amide (amide II) of structural proteins. | 27–30 | |
| ∼1539 cm−1 | 0.29 (0.02)* | 0.25 (0.01)* | N–H bending and C–N stretching in amide (amide II) of structural proteins. | 27–30 | |
| ∼1398 cm−1 | 0.19 (0.02)* | 0.17 (0.01)* | –COO− symmetric stretching of amino acid side chains and fatty acids | 27–29 and 31 | |
| ∼1078 cm−1 | 0.21 (0.01)* | 0.22 (0.01)* | C–O–C. C–O of various polysaccharides | 27–29 and 31 | |
| Control versus NanoAg | ∼1641 cm−1 | 0.53 (0.02)* | 0.50 (0.05)* | Stretching of C![[double bond, length as m-dash]](https://www.rsc.org/images/entities/char_e001.gif) O in amide (amide I) O in amide (amide I) |
28–30 |
| ∼1635 cm−1 | 0.54 (0.02)* | 0.50 (0.05)* | β-pleated sheet structures (amide I) | 27 and 29 | |
| ∼1547 cm−1 | 0.31 (0.02)* | 0.28 (0.03)* | N–H bending and C–N stretching in amide (amide II) | 27–30 | |
| ∼1543 cm−1 | 0.30 (0.02)* | 0.28 (0.03)* | N–H bending and C–N stretching in amide (amide II) | 27–30 | |
| ∼1086 cm−1 | 0.21 (0.01)* | 0.19 (0.02)* | C–O–C. C–O of various polysaccharides | 27–29 and 31 | |
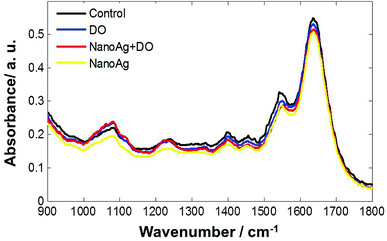
Control vs. DO. In order to investigate the control and DO samples, as observed in Table 3, six variables were selected for PLS-DA (1647 cm−1, 1631 cm−1, 1547 cm−1, 1543 cm−1, 1400 cm−1 and 1080 cm−1). It is interesting to note that 83.3% of the wave numbers responsible for the discrimination between the two classes are related to protein: amide I in 1647 and 1631 cm−1, amide II in 1547 and 1543 cm−1 and amino acid in 1400 cm−1. Note that only the wavelength 1647 cm−1 showed a significant change (p < 0.05) in absorbance upon exposure to DO. This corroborates with the literature, since this antibiotic belongs to the class of tetracyclines, whose mechanism of action is the interference in the binding of the tRNA by blocking the adhesion of aminoacyl-t-RNA, to the mRNA-ribosome complex; in other words, DO interacts with the 30S portion of the ribosome thereby impairing protein synthesis. It should therefore be noted that tetracycline are classified as bacteriostatic, i.e. their interaction occurs reversibly.16,17 To this we can attribute the absence of significant change (p < 0.05) in the absorbances of the other wave numbers related to the proteins. An interesting result was the presence of the band at 1080 cm−1, characteristic of polysaccharides. Zmantar et al.18 showed that S. aureus ATCC 25923, the same strain used in the present study, produces biofilm after stress and Cerca et al.19 stated that the proteins encoded by intercellular adhesin genes (icaADBC) synthesize polysaccharide, which contributes to the formation of this biofilm in S. aureus. In contrast to the results obtained in Table 3, S. aureus showed a significant increase in mean absorbance (p < 0.05) when the DO band was treated with 1080 cm−1, a characteristic of polysaccharides.
Control vs. NanoAg. From the investigation between the control and NanoAg samples, five variables were selected for SPA-LDA (1641 cm−1, 1635 cm−1, 1547 cm−1, 1543 cm−1 and 1086 cm−1). Of these wave numbers 80% are related to proteins as well, namely 1641 cm−1 and 1635 cm−1 for amide I, while the absorptions at 1547 and 1543 cm−1 are related to amide II. Although NanoAg has an extensive list of studies involving its effect against bacteria, the mechanism of action is not clearly known.9,20 Some authors attribute such difficulty to the fact that the antibacterial action is strongly dependent on the physical–chemical parameters such as size, shape, surface charge, concentration and colloidal state.21–26 Despite many factors, Dakal et al.9 found that the antimicrobial action of NanoAg in general is linked to at least four distinct mechanisms. According to them, the NanoAg act (A) inducing cellular toxicity through the oxidative stress caused by the generation of reactive oxygen species (ROS) and free radicals, (B) adhering to the surface of the wall and cell membrane, (C) interfering in the modulation or (D) damaging intracellular structures (mitochondria, vacuoles, ribosomes) and biomolecules (proteins, lipids and DNA) after the endocytosis of NanoAg. Based on the selected variables (most related to proteins), we can suggest that the path of action of NanoAg synthesized and administered in our work was D, since after the treatment of S. aureus with NanoAg the mean absorbances suffered a significant decrease (p < 0.05), as shown in Fig. 5. The pathway suggested is that it acts more expressively in the inhibition of protein synthesis. In agreement with the expression in Table 3, the variable related to the wave number 1086 cm−1 was selected which is characteristic of polysaccharides that predominate in biofilm expressed by S. aureus after stress.17,18 However, it was unusual to note that this treatment with free NanoAg of DO showed a significant decrease (p < 0.05) in mean absorbance suggesting that action of the nanoparticles did not allow S. aureus to effectively express its biofilm or even that it expressed, but the damage to DNA and polysaccharides was more expressive.
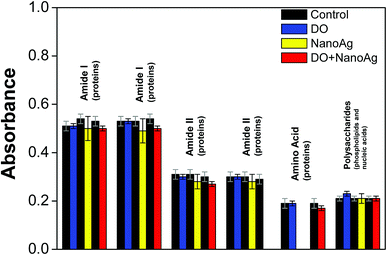 | ||
| Fig. 5 Mean average absorbances of the control, DO, NanoAg and DO + NanoAg classes presented in the six regions used in the discrimination by PLS-DA. | ||
Control vs. DO + NanoAg. Finally, the comparison between the Control and DO + NanoAg samples allowed for the selection of six variables for SPA-LDA (1635, 1630, 1543, 1539, 1398 and 1078 cm−1). Of these, 80% wave numbers are protein related, as observed in Table 3. The wavenumber at 1635 and 1630 cm−1 are assigned to amide I, 1543 and 1539 cm−1 assigned to amide II and 1398 cm−1 attributed to amino acid. At first, it is possible to observe that the treatment with the DO + NanoAg conjugate allowed for the selection of the variables observed both in the DO treatment and in the treatment with NanoAg. Interestingly, the DO + NanoAg conjugate caused a significant increase in the mean absorbance (p < 0.001) at the 1078 cm−1 wavenumber attributed to polysaccharides. Thus, the defense by biofilm expression was presented by S. aureus after treatment with the DO + NanoAg conjugate. Another important point was the significant decrease in mean absorbances (p < 0.05) attributed to protein expression exhibited after treatment with this system, which did not occur after treatment with DO. Based on what has been presented so far, we can conclude that the conjugate caused expressive metabolic responses, even though the two starting constituents, DO and NanoAg, were at half their original concentrations. The combination of DO and NanoAg boosts the inhibition of protein synthesis.
4 Conclusions
Herein we have shown that FT-IR coupled with multivariate analysis is an excellent tool to discriminate bacteria that have been treated with DO, NanoAg and DO + NanoAg. From PCA analysis it is clear that, although both DO and NanoAg affect protein synthesis, their combination promotes biological changes in S. aureus sufficient for discrimination among the classes.Conflicts of interest
There are no conflicts to declare.Acknowledgements
The authors are grateful to CNPq (grant 442087/2014-4).References
- A. J. Alanis, Resistance to Antibiotics: Are We in the Post-Antibiotic Era?, Arch. Med. Res., 2005, 36(6), 697–705 CrossRef PubMed.
- A. J. Huh and Y. J. Kwon, “Nanoantibiotics”: A new paradigm for treating infectious diseases using nanomaterials in the antibiotics resistant era, J. Controlled Release, 2011, 156(2), 128–145 CrossRef PubMed.
- I. Sondi and B. Salopek-Sondi, Silver nanoparticles as antimicrobial agent: a case study on E. coli as a model for Gram-negative bacteria, J. Colloid Interface Sci., 2004, 275(1), 177–182 CrossRef PubMed.
- S. K. Rastogi, V. J. Rutledge, C. Gibson, D. A. Newcombe, J. R. Branen and A. L. Branen, Ag colloids and Ag clusters over EDAPTMS-coated silica nanoparticles: synthesis, characterization, and antibacterial activity against Escherichia coli, Nanomedicine, 2011, 7, 305–314 CrossRef PubMed.
- V. P. Zharov, K. E. Mercer, E. N. Galitovskaya and M. S. Smeltzer, Photothermal Nanotherapeutics and Nanodiagnostics for Selective Killing of Bacteria Targeted with Gold Nanoparticles, Biophys. J., 2006, 90(2), 619–627 CrossRef PubMed.
- A. N. Brown, K. Smith, T. A. Samuels, J. Lu, S. O. Obare and M. E. Scott, Nanoparticles Functionalized with Ampicillin Destroy Multiple-Antibiotic-Resistant Isolates of Pseudomonas aeruginosa and Enterobacter aerogenes and Methicillin-Resistant Staphylococcus aureus, Appl. Environ. Microbiol., 2012, 78(8), 2768–2774 CrossRef PubMed.
- P. Li, J. Li, C. Wu, Q. Wu and J. Li, Synergistic antibacterial effects of β-lactam antibiotic combined with silver nanoparticles, Nanotechnology, 2005, 16(9), 1912 CrossRef.
- H. F. O. Silva, K. M. G. Lima, M. B. Cardoso, J. F. A. Oliveira, M. C. N. Melo, C. Sant'Anna, M. Eugenio and L. H. S. Gasparotto, Doxycycline conjugated with polyvinylpyrrolidone-encapsulated silver nanoparticles: a polymer's malevolent touch against Escherichia coli, RSC Adv., 2015, 5(82), 66886–66893 RSC.
- T. C. Dakal, A. Kumar, R. S. Majumdar and V. Yadav, Mechanistic Basis of Antimicrobial Actions of Silver Nanoparticles, Front Microbiol, 2016, 7, 1831 CrossRef PubMed.
- D. I. Ellis and R. Goodacre, Metabolic fingerprinting in disease diagnosis: biomedical applications of infrared and Raman spectroscopy, Analyst, 2006, 131(8), 875–885 RSC.
- J. F. Gomes, A. C. Garcia, E. B. Ferreira, C. Pires, V. L. Oliveira, G. Tremiliosi-Filho and L. H. S. Gasparotto, New insights into the formation mechanism of Ag, Au and AgAu nanoparticles in aqueous alkaline media: alkoxides from alcohols, aldehydes and ketones as universal reducing agents, Phys. Chem. Chem. Phys., 2015, 17(33), 21683–21693 RSC.
- L. Cui, H. J. Butler, P. L. Martin-Hirsch and F. L. Martin, Aluminium foil as a potential substrate for ATR-FTIR, transflection FTIR or Raman spectrochemical analysis of biological specimens, Anal. Methods, 2016, 8(3), 481–487 RSC.
- S. Schneider, M. O. Schmitt, G. Brehm, M. Reiher, P. Matousek and M. Towrie, Fluorescence kinetics of aqueous solutions of tetracycline and its complexes with Mg+2 and Ca+2, Photochem. Photobiol. Sci., 2003, 2(1), 1107–1117 RSC.
- M. Behera and S. Ram, Inquiring the mechanism of formation, encapsulation, and stabilization of gold nanoparticles by poly(vinyl pyrrolidone) molecules in 1-butanol, Appl. Nanosci., 2014, 4(1), 247–254 CrossRef.
- K. D. Young, The Selective Value of Bacterial Shape, Microbiol. Mol. Biol. Rev., 2006, 70(3), 660–703 CrossRef PubMed.
- E. C. Pereira-Maia, P. P. Silva, W. B. Almeida, H. F. Santos, B. L. Marcial, R. Ruggiero and W. Guerra, Tetraciclinas e Glicilciclinas: Uma Visão Geral, Quim. Nova, 2010, 33(3), 700–706 CrossRef.
- I. Chopra and M. Roberts, Tetracycline Antibiotics: Mode of Action, Applications, Molecular Biology, and Epidemiology of Bacterial Resistance, Microbiol. Mol. Biol. Rev., 2001, 65(2), 232–260 CrossRef PubMed.
- T. Zmantar, B. Kouidhi, H. Miladi, K. Mahdouani and A. Bakhrouf, A Microtiter plate assay for Staphylococcus aureus biofilm quantification at various pH levels and hydrogen peroxide supplementation, New Microbiol., 2010, 33(1), 137–145 Search PubMed.
- N. Cerca, J. L. Brooks and K. K. Jefferson, Regulation of the Intercellular Adhesin Locus Regulator (icaR) by SarA, B, and IcaR in Staphylococcus aureus, J. Bacteriol., 2008, 190(19), 6530–6533 CrossRef PubMed.
- S. Prabhu and E. K. Poulose, Silver nanoparticles: mechanism of antimicrobial action, synthesis, medical applications, and toxicity effects, Int. Nano Lett., 2012, 2(32), 2–10 Search PubMed.
- S. Pal, Y. K. Tak and J. M. Song, Does the Antibacterial Activity of Silver Nanoparticles Depend on the Shape of the Nanoparticle? A Study of the Gram-Negative Bacterium Escherichia coli, Appl. Environ. Microbiol., 2007, 73(6), 1712–1720 CrossRef PubMed.
- R. Bhattacharya and P. Mukherjee, Biological properties of “naked” metal nanoparticles, Adv. Drug Delivery Rev., 2008, 60(1), 1289–1306 CrossRef PubMed.
- M. K. Rai, S. D. Deshmukh, A. P. Ingle and A. K. Gade, Silver nanoparticles: the powerful nanoweapon against multidrug-resistant bacteria, J. Appl. Microbiol., 2012, 112(1), 841–852 CrossRef PubMed.
- M. R. Nateghi and H. Hajimirzababa, Effect of silver nanoparticles morphologies on antimicrobial properties of cotton fabrics, J. Text. Inst., 2014, 105(1), 806–813 CrossRef.
- A. Abbaszadegan, Y. Ghahramani, A. Gholami, B. Hemmateenejad, S. Dorostkar, M. Nabavizadeh and H. Sharghi, The Effect of Charge at the Surface of Silver Nanoparticles on Antimicrobial Activity against Gram-Positive and Gram-Negative Bacteria: A Preliminary Study, J. Nanomater., 2015, 2015(1), 1–8 Search PubMed.
- F. Zhang, J. A. Smolen, S. Zhang, R. Li, P. N. Shah, S. Cho, H. Wang, J. E. Raymond, C. L. Cannon and K. L. Wooley, Degradable polyphosphoester-based silver-loaded nanoparticles as therapeutics for bacterial lung infections, Nanoscale, 2015, 7, 2265–2270 RSC.
- K. Maquelin, C. Kirschner, L. P. Choo-Smith, N. V. D. Braak, H. Ph Endtz, D. Naumann and G. J. Puppels, Identification of medically relevant microorganisms by vibrational spectroscopy, J. Microbiol. Methods, 2002, 51(1), 255–271 CrossRef PubMed.
- W. Jiang, A. Saxena, B. Song, B. B. Ward, T. J. Beveridge and S. C. B. Myneni, Elucidation of Functional Groups on Gram-Positive and Gram-Negative Bacterial Surfaces Using Infrared Spectroscopy, Langmuir, 2004, 20, 11433–11442 CrossRef PubMed.
- D. Naumann, Infrared Spectroscopy in Microbiology, Encyclopedia of Analytical Chemistry, ed. R. A. Meyers, John Wiley & Sons Ltd, Chichester, 2000, pp. 102–131 Search PubMed.
- Y. Burgula, D. Khali, S. Kim, S. S. Krishnan, M. A. Cousin, J. P. Gore, B. L. Reuhs and L. J. Mauer, Review Of Mid-Infrared Fourier Transform-Infrared Spectroscopy Applications For Bacterial Detection, J. Rapid Methods Autom. Microbiol., 2007, 15(1), 146–175 CrossRef.
- B. Buszewski, E. Dziubakiewicz, P. Pomastowski, K. Hrynkiewicz, J. Ploszaj-Pyrek, E. Talik, M. Kramer and K. Albert, Assignment of functional groups in Gram-positive bacteria. Analytical Method Development and Validation: A Concise Review, J. Anal. Bioanal. Tech., 2015, 6(1), 1–8 Search PubMed.
| This journal is © The Royal Society of Chemistry 2018 |

