 Open Access Article
Synthesis and characterization of nanostructured MnO2–CoO and its relevance as an opto-electronic humidity sensing device†
Samiksha Sikarwara,
B. C. Yadav *a,
G. I. Dzhardimalieva
 b,
N. D. Golubevab and
Pankaj Srivastavaa
aNanomaterials and Sensors Research Laboratory, Department of Physics, Babasaheb Bhimrao Ambedkar University, Lucknow-226025, U.P., India. E-mail: balchandra_yadav@rediffmail.com; Tel: +919450094590
bLaboratory of Metallopolymers, Institute of Problems of Chemical Physics, Russian Academy of Sciences, Chernogolovka, Moscow Region, 142432, Russia
First published on 5th June 2018
Abstract
Metal carboxylates are widely used in science and technology and have been the subject of intense studies due to the practical importance of their products. The present paper reports the synthesis of MnO2–CoO using metal carboxylates as precursors and the effect of humidity on the transmitted power through its thin film at room temperature. The refractive index of the material was found to be 1.445930 and the peak obtained from the photoluminescence spectra lies in the visible region. TEM reported a minimum grain size of ∼5.7 nm and SAED confirmed the crystalline nature of the material, which was further confirmed by XRD. Fluorescence characteristics also confirmed the low dimensionality of the material. The film was then investigated using SEM which exhibited the porous morphology. Through UV-Vis spectroscopy, it was found that the absorption of the film takes place in the UV region and the optical band-gap was observed to be 3.849 eV from the Tauc plot. The film was employed as a transmission based opto-electronic humidity sensor. Average sensitivity was found to be ∼2.225 μW/% RH with response and recovery times of 47 s and 59 s respectively. Experiments were repeated and the reproducibility of result was found to be ∼89%.
Introduction
Unique surface properties and high catalytic activity of metal oxides make them very attractive for various sensor applications.1,2 Titanium, cerium, copper, iron, and manganese oxides have been widely used as catalysts, photocatalysts and electrocatalysts in a variety of reactions in organic synthesis.3–6 Transition metal oxides, such as Mn2O3, Co3O4, NiO, etc., are of interest for optical waveguide gas sensors.7 V2O5 nanobelts (V2O5·xH2O, V2O5·CTAB and V2O5 nanorods annealed at 400 °C) revealed the properties of an ethanol sensor with high selectivity and stability.8 The Cu–CuO nanocomposite was successfully used to modify a glassy carbon electrode to detect H2O2 and glucose.9Metal carboxylates are widely used in science and technology. They have been the subject of intense studies due to the practical importance of their products.10 In particular, the controlled thermolysis of metal carboxylates can be considered as an effective way for the synthesis of nanocomposite materials.11 Owing to the formation of ferromagnetic Fe3O4 and CoFe2O4 nanoparticles, the thermolysis products of metal acrylates and their co-crystallizates behave as solid magnets with a coercive force of 0.18 T and the residual magnetization of 15.5 mT at room temperature.12 The spinel ferrites Zn0.5Mn0.5Fe2O4,13 CoFe2O4,14 and MnFe2O4![[thin space (1/6-em)]](https://www.rsc.org/images/entities/char_2009.gif) 15 synthesized by pyrolysis of the corresponding polyacrylate salts exhibit superparamagnetic properties at room temperature.
15 synthesized by pyrolysis of the corresponding polyacrylate salts exhibit superparamagnetic properties at room temperature.
Humidity measurement is one of the most required parameters for various applications not only for improving the quality of life but also for enhancing the industrial process.16,17 Advancements in sensor manufacturing technologies lead the researchers to know the degree of efficiency with predictions based on simulation techniques and design aids to improve sensitivity and sensor quality along with time-saving.18 The humidity plays very important role and has acquired such incredible significance due to the fact that these vapours consist of highly reactive dipolar molecules which get condensed on or evaporate from the surface even with small variations in temperature of the environment. Optical humidity sensors are better than their electronic counterparts due to their small size, low weight, immune towards electromagnetic disturbances, possibility of multiplexing information and working on high pressure and flammable environments.19 Complex oxides containing cobalt and manganese show different oxidation states (Co2+, Co3+, Mn2+, Mn3+, and Mn4+)20 and hence attractive distinct properties like enhanced tunable surface, specific desirable pseudocapacitance, energy density. Also they are easy to fabricate, have low cost, efficient structural properties, abundant in nature and environment friendly21 and hence can be proved as an excellent material for humidity sensing. Also recently their multicomponent electrocatalysts have been fabricated, like Mn3O4–CoO/CNT, Co3O4/Co2MnO4 and graphene/CNT/Co3O4 which showed excellent performance towards ORR (Oxidation Reduction Reaction) catalysis.22 A few works has been done on manganese oxide and cobalt oxide based humidity sensor. Kato et al. in 1997 investigated the sol–gel processed electrolytic manganese dioxide (EMD) as humidity sensor which showed good sensitivity between 50–80% RH.23 In another work, K. Miyazaki et al. in the same year developed a potential-type humidity sensor based on M1/MnOx/M2 galvanic cell system, where MnOx is an EMD–clay mineral mixture, M1 is Pt, and M2 is Cu or Al. Clay mineral samples included kaolinite, bentonite, activated clay, zeolite, and muscovite. Silica sand was used as a reference material. The EMD–kaolinite mixture responded in a wider humidity region of 20–90% RH.24 Similarly Yang et al. in 2011 studied a micro humidity sensor which consisted of interdigitated electrodes and cobalt oxide nanosheet sensing film (prepared by precipitation–oxidation method). The capacitance of the sensor changes with the adsorption/desorption of water vapor.25 In another work, Yadav et al. in 2013 investigated the multilayered sensing films prepared by sol–gel spin coating process using cobalt oxide precursor annealed at 450 °C which showed linear behavior towards entire range of % RH with average sensitivity of 0.76 μW/% RH.26
Previously our group has worked on yttria stabilized zirconia system and its opto-electronic humidity sensing27 but sensitivity was found lesser. As MnO2–CoO is a hygroscopic material and synthesized first time in our laboratory at low dimension with high aspect ratio, therefore in order to improve the sensitivity, nanostructured MnO2–CoO has been investigated as an opto-electronic humidity sensor.
Experimental
Synthesis
| (Mn+)aqua + CH3(CH2)3CH(C2H5)COOH → M[CH3(CH2)3CH(C2H5)COO]n + nH+… | (1) |
For the synthesis of cobalt(II) ethylhexanoate, 45.5 g of cobalt(II) nitrate hydrate was dissolved in 160 ml of H2O, and then the solution of metal nitrate was mixed with 80 ml of ethylhexanoic acid at pH 5 by adding NH4OH. The resulting mixture was stirred for 1 h at room temperature, then after 12 h water phase was isolated in a separation funnel. For the synthesis of manganese ethylhexanoate, 46.5 g of manganese(II) nitrate hydrate was dissolved in 400 ml of H2O, then the solution of metal nitrate was mixed with 205 ml of ethylhexanoic acid at pH 5.6 by adding NH4OH. The mixture was stirred for 1 h at room temperature, then after 12 h water phase was isolated in a separation funnel. The contents of cobalt and manganese in the extracts were 64 and 47.2 g kg−1, respectively obtained after elemental analysis of the products on the atomic absorption spectrometer AAS-3. Then the mixture of metal hexanoate's extracts in the required ratio (1![[thin space (1/6-em)]](https://www.rsc.org/images/entities/char_2009.gif) :
:![[thin space (1/6-em)]](https://www.rsc.org/images/entities/char_2009.gif) 2 by weight) was stirred for 20 min at 105–108 °C followed by vacuum distillation at 150 °C for 10 h. The Co
2 by weight) was stirred for 20 min at 105–108 °C followed by vacuum distillation at 150 °C for 10 h. The Co![[thin space (1/6-em)]](https://www.rsc.org/images/entities/char_2009.gif) :
:![[thin space (1/6-em)]](https://www.rsc.org/images/entities/char_2009.gif) Mn
Mn![[thin space (1/6-em)]](https://www.rsc.org/images/entities/char_2009.gif) :
:![[thin space (1/6-em)]](https://www.rsc.org/images/entities/char_2009.gif) O atomic ratio in the product obtained was equal to 1.5
O atomic ratio in the product obtained was equal to 1.5![[thin space (1/6-em)]](https://www.rsc.org/images/entities/char_2009.gif) :
:![[thin space (1/6-em)]](https://www.rsc.org/images/entities/char_2009.gif) 1.5
1.5![[thin space (1/6-em)]](https://www.rsc.org/images/entities/char_2009.gif) :
:![[thin space (1/6-em)]](https://www.rsc.org/images/entities/char_2009.gif) 4 determined by quantitative chemical analysis.
4 determined by quantitative chemical analysis.
Fabrication of sensing element
Porosity and regularity of the deposited film can be restricted by monitoring the sample preparation environment like gel density/viscosity, velocity of the spinner and heating/annealing temperature. Spin coating technique was used to deposit uniform sol–gel precursor MnO2–CoO thin film with nanoscale on flat borosilicate substrates28 having dimensions 1.5 × 1.5 cm2 using a photoresist spinner (METREX RC100, India). Prior to spin coating, the flat borosilicate substrates were rinsed thoroughly with deionized water and isopropyl alcohol followed by acetone ultrasonically for 15 min each in order to remove microscopic contaminations.29 The cleaned substrates were dried in an electric oven (METREX) at 100 °C for half an hour to remove the organic precursors and moisture completely from them. A small amount of gel was dropped on the centre of the substrate and then rotated at high speed in order to extend the gel by centrifugal force on the whole substrate. The rotation was sustained for 60 s at 3000 rpm so that fluid spins off the edges of the substrate and desired thickness of the film could be achieved.30 After thin film formation, they were kept for drying on a hot plate at 60 °C for 15 min and then annealed at 650 °C for 3 h in a tubular electric furnace (METREX) in 78% nitrogen. Further, these films were used as sensing elements to investigate them as opto-electronic humidity sensing based on transmission.Description of sensing set-up
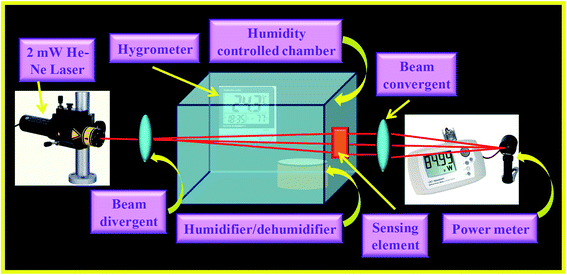
The experimental set-up used for opto-electronic humidity sensing is shown in Fig. 1. It consists of 2 mW He–Ne LASER (Research Electro Optics Inc. 30![[thin space (1/6-em)]](https://www.rsc.org/images/entities/char_2009.gif) 989) with 633 nm wavelength as input light source. A diverging lens of 10× magnification is used as beam expander for splitting the laser light beam so that it may incident and cover the whole surface of the sensing film. A glass chamber with humidity controlled system consisting of a hygrometer (HTC-1) of the range 10–90% RH along with a dish is kept inside for holding the humidifier/dehumidifier solution. The saturated solution of K2SO4/KOH (Fisher Scientific) in distilled water is used as humidifier/dehumidifier. The sensing element is fixed on one wall of the chamber such that it is perpendicular to the incident beam and also the beam covers the maximum surface area of the film. A beam condenser is used for converging the laser light beam to obtain the maximum intensity at a fixed point. An optical power meter (Newport 1916-R) is employed for detecting the modulated power of the transmitted beam by the sensing element. The detector part is kept perpendicular to the beam for obtaining the maximum output power and the whole experiment was performed on the Vibration Free Table (M-RS2000-48-8) at room temperature of 300 K.
989) with 633 nm wavelength as input light source. A diverging lens of 10× magnification is used as beam expander for splitting the laser light beam so that it may incident and cover the whole surface of the sensing film. A glass chamber with humidity controlled system consisting of a hygrometer (HTC-1) of the range 10–90% RH along with a dish is kept inside for holding the humidifier/dehumidifier solution. The saturated solution of K2SO4/KOH (Fisher Scientific) in distilled water is used as humidifier/dehumidifier. The sensing element is fixed on one wall of the chamber such that it is perpendicular to the incident beam and also the beam covers the maximum surface area of the film. A beam condenser is used for converging the laser light beam to obtain the maximum intensity at a fixed point. An optical power meter (Newport 1916-R) is employed for detecting the modulated power of the transmitted beam by the sensing element. The detector part is kept perpendicular to the beam for obtaining the maximum output power and the whole experiment was performed on the Vibration Free Table (M-RS2000-48-8) at room temperature of 300 K.
Characterization techniques
The prepared film was investigated through a digital Refractometer (Anton Par Abbemat 550) in its original state at room temperature (300 K). The instrument is fast and non-destructive with a high accuracy of 0.000001. It is widely used for calibrating the official standards. TEM analysis of the material was carried out using Transmission Electron Microscope, JEOL JEM 200 CX. MnO2–CoO precursor in diluted form was loaded over carbon coated copper grid with mesh size 200 at the scale of 50 nm. The morphological study of the film has been carried out at various scales and resolutions using Scanning Electron Microscope, JEOL JSM 840 A. The structural information of the film was studied by X-ray diffractometer X'Pert Pro recording system (PANalytical, Netherlands) using Cu Kα (λ = 1.5406 Å) radiation. The instrument was operated at 45 kV, 40 mA with scanning parameters of 0° to 70°; typical 2θ step size: 0.008°. Optical characterizations were done by obtaining Fluorescence, Photoluminescence and UV-Vis absorption spectrum. The Fluorescence and Photoluminescence spectrum of dilute precursor were obtained using Perkin-Elmer LS55 Luminescence spectrophotometer operated with a xenon discharge lamp (20 kW power) as the excitation source at room temperature in the visible range of the electromagnetic spectrum. UV-Vis absorption spectrum of the film was recorded in the wavelength regime of 190–1100 nm using UV-Vis Spectrophotometer (Evolution 201) with Hg lamp as the excitation source.Results and discussion
Refractometer analysis
For the investigation of the refractive index of the film, the film was kept on the prism of the digital refractometer (Anton Par Abbemat 550) at room temperature and the piston of the instrument was pressed. Then screen showed the refractive index of the material as 1.445930.Scanning electron microscopy (SEM)
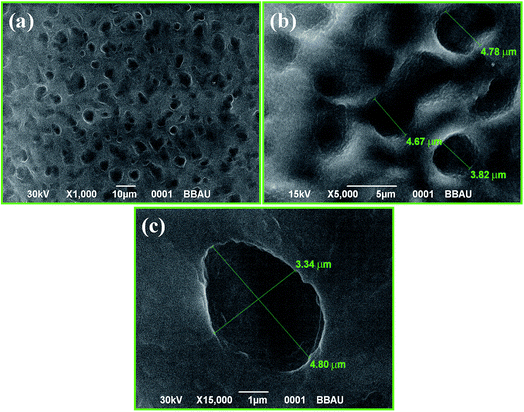
The SEM images of the film at 10 μm, 5 μm and 1 μm are shown in Fig. 2(a–c) respectively. Surface morphology of the MnO2–CoO thin films exhibits highly porous nature. The dimension of these pores is of micron order (as depicted in Fig. 2(c)); hence the film is macroporous in nature. This porosity enhances the surface area of the material and hence provides many dangling bonds suitable for adsorption/desorption of water molecule. These active centres serve as humidity adsorption sites and the sensitivity of the sensor depends on the availability of these dangling bonds.Transmission electron microscopy (TEM)
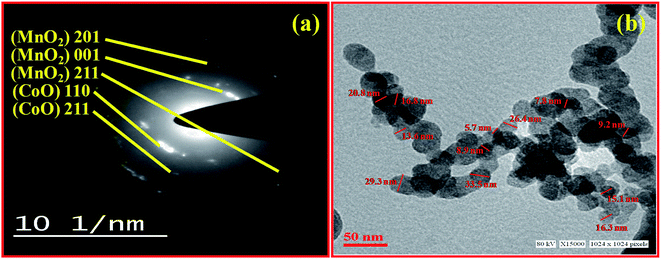
Fig. 3 shows the TEM-SAED image of nanostructured MnO2–CoO dilute precursor solution. Fig. 4(a) shows the SAED pattern of the material at 10 nm−1 scale. Here the concentric rings confirm the polycrystalline structure of nanocomposite. The indexing has been done for the observed rings of MnO2 (tetragonal) and CoO (simple cubic) separately. Fig. 3(b) corresponds to the TEM image at 50 nm scale. It can be observed from the figure that there is uniform distribution of spherical particles of nano dimension. The minimum grain diameter as obtained from the micrograph is ∼5.7 nm which is not yet reported in open literature.X-ray diffraction (XRD)
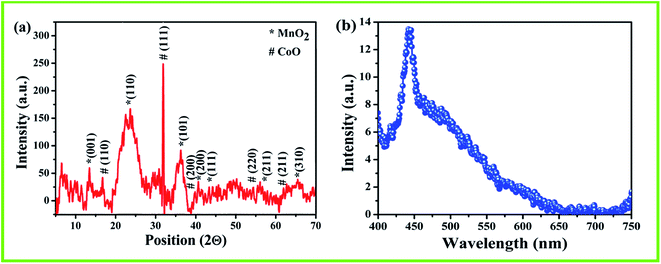
Fig. 4(a) shows the XRD pattern of the film of nanostructured composite of MnO2–CoO annealed at 650 °C. The asterisk (*) peaks denote the MnO2 crystals whereas hatch (#) peaks represent CoO crystals. The diffraction pattern shows good agreement with the diffraction data from JCPDS 240735 and 750![[thin space (1/6-em)]](https://www.rsc.org/images/entities/char_2009.gif) 419 for MnO2 crystals and CoO crystals respectively. The minimum crystallite size of the material was estimated as 4 nm using Debye–Scherrer Formula from (110) peak which is the least value of crystallite size reported in open literature. The crystallite size plays an important parameter in sensing as it increases the aspect ratio and hence provides more active centres for the adsorption/desorption of water molecules.
419 for MnO2 crystals and CoO crystals respectively. The minimum crystallite size of the material was estimated as 4 nm using Debye–Scherrer Formula from (110) peak which is the least value of crystallite size reported in open literature. The crystallite size plays an important parameter in sensing as it increases the aspect ratio and hence provides more active centres for the adsorption/desorption of water molecules.
Fluorescence spectroscopy
Fluorescence spectroscopy is a contactless, non-destructive technique to probe the electronic structure of materials. Here, the fluorescence spectrum is obtained in the wavelength regime of 400–750 nm. The spectrum is shown in Fig. 4(b) where the peak in the lower wavelength region shows the blue shifting with respect to that of the reported literature of the constituent materials31,32 and hence confirms the low dimensionality of the nanostructured composite of MnO2–CoO.Photoluminescence spectroscopy
The PL spectrum of the dilute nanostructured MnO2–CoO precursor was obtained at room temperature in the wavelength range of 350–750 nm. The spectrum is shown in Fig. 5(a). The intensity and spectral content of the emitted photoluminescence is a direct measure of numerous important material properties, as well as band gap determination, dirtiness levels, imperfection detection and recombination mechanisms. The shifting of the emission peak may be due to the non-uniform size of the particles (as confirmed from TEM) in the precursor sol.33 The emission peaks at 380 nm and 400 nm corresponds to the violet emission, which may provide a new scope in the field of luminescent display materials.UV-visible (UV-Vis) absorption analysis
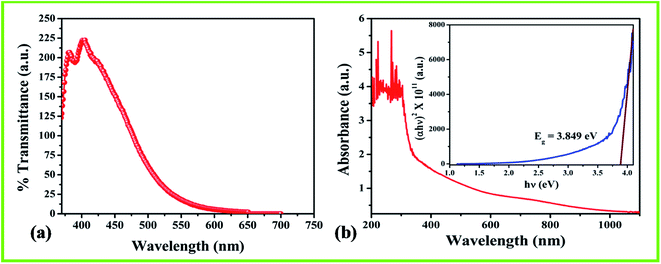
The optical absorbance spectrum of the MnO2–CoO thin film deposited on the flat borosilicate substrate was recorded in the wavelength range 190–1100 nm and is shown in Fig. 5(b). It is observed from data that film exhibits absorption in the ultraviolet range of the electromagnetic spectrum. Tauc curve (inset of Fig. 5(b)) was plotted to show the variation of the square of the optical absorption coefficient (α2) with photon energy hν from the absorption data. The optical energy band-gap Eg of the film can be estimated from the eqn (2):| Eg = hν − (αhν)1/n… | (2) |
Humidity sensing
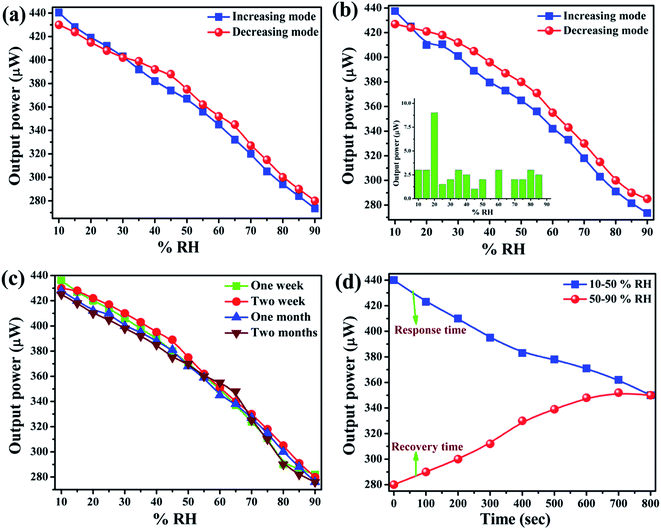
The optical humidity sensing characteristics for MnO2–CoO thin film annealed at 650 °C has been investigated and plotted in Fig. 6(a). The curve shows an almost linear decrement in transmitted power with a corresponding increase in % RH in all the lower (10–30% RH), intermediate (30–70% RH) and higher regions of % RH (70–90% RH), maintaining a constant slope in the entire range of % RH. In our case, sensitivity is the most concerned parameter, calculated by taking the slope of the sensing response curve. Also, the sensitivity is defined as the ratio of the change in output signal to that of input signal, as shown by eqn (3):| Sensitivity = ΔIt/Δ% RH μW/% RH… | (3) |
Reproducibility is another most concerned parameter for an efficient sensor. It is the distribution of output when measurements are taken under a similar environmental state of affairs as earlier.34 Here the experiment for observing the reproducibility of sensor was performed and plotted in Fig. 6(b). The inset displays the error bars of the experiment. From the error bars, it can be observed that at 20% RH, there is maximum error whereas it is minimum at 55 and 65% RH. The sensitivity observed over the entire range of % RH, while observing the reproducibility, was 1.969 μW/% RH and results were found ∼89% reproducible. This high reproducibility depicts the quite stable nature of the sensing element.
Ageing effect is also an important sensor parameter. It is the distribution of sensor outputs when performing consecutive readings under similar conditions after a long time. The consecutive measurements were taken after one week, two weeks, one month and two months showing as green, red, blue and brown coloured curves respectively in Fig. 6(c). The almost perfect overlapping among the curves indicates that nanostructured MnO2–CoO is a quite stable material having insignificant effect of ageing and the sensor is quite stable in the entire range of % RH.
Response and recovery times were also measured for the reported sensor. Response time is the time requisite to attain 10% of the final sensor output following stepwise ramping of % RH and recovery time is the time taken by the sensor signal to come back to its original value after a step concentration variation from a definite value to zero.35 Here both the response and recovery times were calculated from Fig. 6(d) and it was observed that for sensing film, the response time was 47 s and the recovery time was 59 s. All the sensor parameters have been shown in Table 1.
| Sensor parameters | Average sensitivity | Hysteresis | Reproducibility | Response time | Recovery time | Aging effect |
| Values | 2.225 μW/% RH | 15.73% | ∼89% | 47 s | 59 s | Insignificant |
Sensing mechanism
It may be noted here that the film shows encouraging sensitivity due to rapid adsorption and desorption rate. A brief literature review has been shown in Table 2. Nanostructured MnO2–CoO gel having high refractive index 1.448829, has a greater angle of transmittance. The laser light intensity after being transmitted from the film was collected on a photodetector through a lens combination. Besides the beautiful spherical shaped clusters and the flakes formation with enhanced surface morphology; wide optical energy band-gap is also an important factor responsible for high sensitivity of the sensing element. The low dimension of the material is also a very important factor responsible for good sensing property. As the grain size decreases, the aspect (surface to volume) ratio increases. By increasing aspect ratio more active sites for adsorption/desorption can be generated. It was observed that as the humidity inside the chamber increases, the transmitted power observed at the detector decreases. This decrease in output power with the corresponding increase in % RH is the responsible characteristic for its application as an opto-electronic humidity sensor.| S. no. | Material | Sensitivity | Ref |
|---|---|---|---|
| 1 | PMMA microfiber loop resonator (PMLR) coated with ZnO | 0.1746 dBm/% RH | 36 |
| 2 | Graphene oxide/PVA | 0.193 dB/% RH | 37 |
| 3 | Cu(NO3)2·(AAm)4·2H2O | 0.838 μW/% RH | 18 |
| 4 | Zinc oxide | 0.88 μW/% RH | 38 |
| 5 | Zn(NO3)2·(AAm)4·2H2O | 1.831 μW/% RH | 39 |
| 6 | Cobalt titanate | 1.84 μW/% RH | 26 |
| 7 | MgTiO2 | 1.86 μW/% RH | 34 |
| 8 | Y2O3–ZrO2 | 1.937 μW/% RH | 27 |
| 9 | Sc(CH2![[double bond, length as m-dash]](https://www.rsc.org/images/entities/char_e001.gif) CH–COO)3 CH–COO)3 |
2.1 μW/% RH | 40 |
| 10 | MnO2–CoO | 2.225 μW/% RH | Present work |
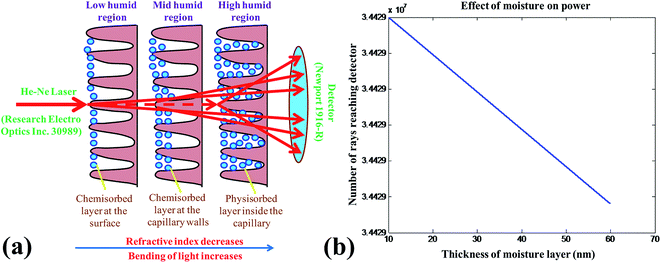
The change in the transmitted power with respect to variation of % RH can be explained on the basis of adsorption and desorption mechanism of the water molecule in the capillaries formed on the surface of nanostructured bimetallic oxide thin film. The sensing mechanism, dependent on the surface morphology is based on the chemisorption and physisorption of a water molecule. In the beginning, the nanostructured bimetallic oxide thin film was free from water molecules with only dehydrated air in its pores. When humidity was created inside the chamber using a humidifier, then at the low humid environment, adsorption of water vapour takes place rapidly on the surface of the film. The metal oxide surface being highly electrovalent has sufficient electrostatic force to break one of the O–H bonds of H2O and form a strong chemical bond between M+ (metal ion) and OH− and forms the chemisorbed layer. With the increase in % RH inside the chamber, adsorption on the surface of the film increases and the refractive index of the material decreases and tends to the bending of transmitted laser light beam. In the mid humidity range (30–70% RH), adsorption of water vapour in the form of OH− ion not only takes place on the surface but also on the walls of capillaries of the film. This leads to the increase in the thickness of moisture layer which tends to a lateral shift of the transmitted light from the sensing element. So the number of light rays reaching the detector gradually decreases and therefore less power is obtained at the output. In high humid region (70–90% RH), the condensation of water vapour takes place through the capillaries and forms a meniscus in the capillaries of the film in the form of a physisorbed layer. In this range, moisture layer acquires the maximum thickness and thus the lateral shift of transmitted light takes place to its maximum level. Hence the highest reduction in transmitted power is obtained, as most of the power could not reach the detector and is scattered in the surroundings.41–43 The whole sensing mechanism has been explained by ray diagram in Fig. 7(a). The number of rays reaching the detector has been calculated on the above mentioned theoretical concept and the results well matched with the observed values as shown in Fig. 7(b).
Conclusions
Nanostructured MnO2–CoO was successfully synthesized using metal carboxylates as precursors and thin films were fabricated via spin coating technique and annealed at 650 °C. TEM investigated the minimum grain diameter of ∼5.7 nm and SAED confirmed the polycrystalline nature. The minimum crystallite size as obtained from XRD was ∼4 nm. SEM micrographs showed the enhanced surface area of the film by the formation of pores on the surface of the film. The study of the photoluminescence showed the peak in the violet region. The Tauc plot obtained from the UV-Vis absorption spectrum estimated the optical energy band gap of 3.849 eV. The film was then employed efficaciously as opto-electronic humidity sensor and the average sensitivity was found as 2.225 μW/% RH along with the response and recovery times as 47 s and 59 s.Conflicts of interest
There are no conflicts to declare.Acknowledgements
Authors gratefully acknowledge the Department of Science and Technology (DST), Government of India (Ref no. INT/RUS/RFBR/P-148) and Russian Foundation for Basic Researches (RFBR) for financial support in the form of the Indo-Russian Project. S. Sikarwar is thankful to DST for INSPIRE AORC fellowship grant no. DST/INSPIRE Fellowship/2014/IF140317, India.References
- G. Korotcenkov, J. Mater. Sci. Eng. B, 2007, 139, 1–23 CrossRef.
- E. Kanazawa, G. Sakai, K. Shimanoe, Y. Kanmura, Y. Teraoka, N. Miura and N. Yamazoe, Sens. Actuators, B, 2001, 77, 72–77 CrossRef.
- X. W. Xie, Y. Li, Z. Q. Liu, M. Haruta and W. J. Shen, Nature, 2009, 458, 746–749 CrossRef PubMed.
- C. S. Pan, D. S. Zhang, L. Y. Shi and J. H. Fang, Eur. J. Inorg. Chem., 2008, 15, 2429–2436 CrossRef.
- S. L. Brock, N. Duan, Z. R. Tian, O. Giraldo, H. Zhou and S. L. Suib, Chem. Mater., 1998, 10, 2619–2628 CrossRef.
- Y. Li, X. Y. Yang, Y. Feng, Z. Y. Yuan and B. L. Su, Synthesis, Characterizations, Properties and Applications, Crit. Rev. Solid State Mater. Sci., 1998, 37(1), 1–74 CrossRef.
- J. Dakin and B. Culshaw, Optical Fiber Sensors: Principles and Components, Artech House, 1st edn, Boston, 1988 Search PubMed.
- J. F. Liu, X. Wang, Q. Peng and Y. D. Li, Adv. Mater., 2005, 17, 764–767 CrossRef.
- X. Zhang, G. Wang, W. Zhang, N. Hu, H. Wu and B. Fang, J. Phys. Chem. C, 2008, 112, 8856–8862 Search PubMed.
- G. I. Dzhardimalieva and A. D. Pomogailo, Macromolecular metal carboxylates as precursors of metallopolymer nanocomposites, in Chapter in Book: Nanocomposites: In Situ Synthesis of Polymer-Embedded Nanostrutures, ed. L. Nicolais and G. Carotenuto, John Wiley & Sons Inc., Hoboken, New Jersey, 2014, pp. 97–114 Search PubMed.
- D. Pomogailo and G. I. Dzhardimalieva, Nanostructured Materials Preparation via Condensation Ways, Springer, 2014, p. 460 Search PubMed.
- M. Lawecka, A. Slawska-Wanievska, K. Racka, M. Leonowicz, G. I. Dzhardimalieva, A. S. Rozenberg and A. D. Pomogailo, J. Alloys Compd., 2004, 369, 244 CrossRef.
- X. M. Liu and S. Y. Fu, J. Magn. Magn. Mater., 2007, 308(1), 61–64 CrossRef.
- X. M. Liu, S. Y. Fu, H. M. Xiaoa and C. J. Huang, Phys. B, 2005, 370, 14 CrossRef.
- H. M. Xiao, X. M. Liu and S. Y. Fu, Compos. Sci. Technol., 2006, 66, 2003–2008 CrossRef.
- S. Sikarwar and B. C. Yadav, Sens. Actuators, A, 2015, 233, 54–70 CrossRef.
- Y. Zhou, H. Wang, M. Sheng, Q. Zhang, Z. Zhao, Y. Lin, H. Liu and G. R. Patzke, Sens. Actuators, B, 2013, 188, 1312–1318 CrossRef.
- P. Chaudhary, S. Sikarwar, B. C. Yadav, G. I. Dzhardimalieva, N. D. Golubeva and I. E. Uflyand, Sens. Actuators, A, 2017, 263, 415–422 CrossRef.
- J. Ascorbe, J. M. Corres, I. R. Matias and F. J. Arregui, Sens. Actuators, B, 2016, 233, 7–16 CrossRef.
- B. V. Golovkin and G. V. Bazuev, Russ. J. Gen. Chem., 2010, 80(2), 213–218 CrossRef.
- C. Li, J. Balamurugan, T. D. Thanh, N. H. Kim and J. H. Lee, J. Mater. Chem. A, 2017, 5, 397–408 Search PubMed.
- W. Huang, H. Zhong, D. Li, P. Tang and Y. Feng, Electrochim. Acta, 2015, 173, 575–580 CrossRef.
- T. Kato, Y. Tanaka, T. Hirata, S. Kumamoto and K. Miyazaki, J. Mater. Sci. Lett., 1997, 16, 1771–1773 CrossRef.
- K. Miyazaki, M. Hieda and T. Kato, Ind. Eng. Chem. Res., 1997, 36, 88–91 CrossRef.
- M. Z. Yang, C. L. Dai, P. J. Shih and Y. C. Chen, Microelectron. Eng., 2011, 88, 1742–1744 CrossRef.
- B. C. Yadav, R. C. Yadav, S. Singh, P. K. Dwivedi, H. Ryu and S. Kang, Opt. Laser Technol., 2013, 490, 68–74 CrossRef.
- S. Sikarwar, B. C. Yadav, S. Singh, G. I. Dzhardimalieva, S. I. Pomogailo, N. D. Golubeva and A. D. Pomogailo, Sens. Actuators, B, 2016, 232, 283–291 CrossRef.
- L. E. Scriven, Mater. Res. Soc. Symp. Proc., 1988, 121, 717–729 CrossRef.
- T. K. Pathak, J. K. Rajput, V. Kumar, L. P. Purohit, H. C. Swart and R. E. Kroon, J. Colloid Interface Sci., 2017, 487, 378–387 CrossRef PubMed.
- D. A. H. Hanaor, G. Triani and C. C. Sorrell, Surf. Coat. Technol., 2011, 205(12), 3658–3664 CrossRef.
- S. Prasad and A. Patra, Green Process. Synth., 2017, 6(6), 549–554 Search PubMed.
- B. K. Pandey, A. K. Shahi and R. Gopal, Appl. Surf. Sci., 2015, 347, 461–470 CrossRef.
- D. P. Singh, S. Pandey, S. K. Gupta, R. Manohar, A. Daoudi, A. H. Sahraoui, C. Phadnis and S. Mahamuni, J. Lumin., 2016, 173, 250–256 CrossRef.
- B. C. Yadav, R. C. Yadav and P. K. Dwivedi, Sens. Actuators, B, 2010, 148, 413–419 CrossRef.
- S. Kozhukharov, Z. Nenova, T. Nenov, N. Nedev and M. Machkova, Sens. Actuators, B, 2015, 210, 676–684 CrossRef.
- N. Irawati, T. N. R. Abdullah, H. A. Rahman, H. Ahmad and S. W. Harun, Sens. Actuators, A, 2017, 260, 112–116 CrossRef.
- Y. Wang and C. Shen, Opt. Commun., 2016, 372, 229–234 CrossRef.
- B. C. Yadav, R. C. Yadav and G. C. Dubey, Opt. Appl., 2009, 39(3), 617–627 Search PubMed.
- B. C. Yadav, S. Sikarwar, R. Yadav, P. Chaudhary, G. I. Dzhardimalieva and N. D. Golubeva, J. Mater. Sci.: Mater. Electron., 2018, 1–8 Search PubMed.
- S. Sikarwar, A. Kumar, B. C. Yadav, G. I. Dzhardimalieva and N. D. Golubeva, IEEE Sens. J., 2018 Search PubMed.
- F. Xu, L. Zhang, X. Yin and L. Tong, Polymer single-Nanowire Optical Sensors, Nano Lett., 2008, 8, 2757–2761 CrossRef PubMed.
- B. C. Yadav, K. S. Chauhan, S. Singh, R. K. Sonker, S. Sikarwar and R. Kumar, J. Mater. Sci.: Mater. Electron., 2017, 28, 5270–5280 CrossRef.
- Z. Nenova, S. Kozhukharov, T. Nenov, N. Nedev and M. Machkova, Sens. Actuators, B, 2016, 224, 143–152 CrossRef.
Footnote |
| † Electronic supplementary information (ESI) available. See DOI: 10.1039/c8ra01975d |
| This journal is © The Royal Society of Chemistry 2018 |

