 Open Access Article
Performance and mechanism of free nitrous acid on the solubilization of waste activated sludge
Jinsong Wangab,
Zhaoji Zhang *a,
Xin Yea,
Fuyi Huanga and
Shaohua Chen*a
aKey Laboratory of Urban Pollutant Conversion, Institute of Urban Environment, Chinese Academy of Sciences, Xiamen 361021, China. E-mail: zjzhang@iue.ac.cn; shchen@iue.ac.cn; Fax: +86 0592 6190977; Tel: +86 0592 6190529
bUniversity of Chinese Academy of Sciences, Beijing 100049, China
First published on 27th April 2018
Abstract
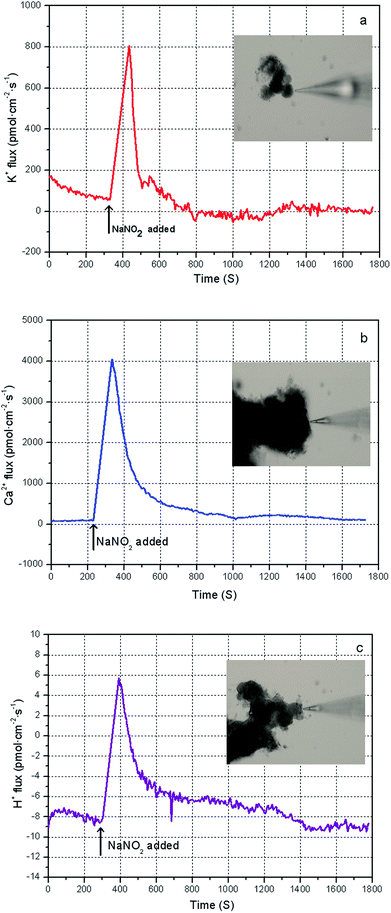
Free nitrous acid (FNA) is a promising chemical reagent for excess sludge reduction. The distinctive properties of FNA treatment on waste activated sludge (WAS) disposal have previously been demonstrated, however, the cellular response, permeabilization, and disruption caused by low-concentration FNA and the direct cell solubilization of WAS using concentrated FNA should be better understood. In this study, the parameters that influence the sludge solubilization efficiency were optimized over a wide range of FNA concentrations. The sludge solubilization efficiency was found to be superior when the sludge was exposed to FNA (when the dosage of NaNO2 was 0.12 g g−1 TSS and the pH was 3.0, FNA = 20.94 mg L−1) for 10 h at 25 °C, and the TSS removal and COD dissolution efficiencies were found to be prominent at 38% and 7%, respectively. In the FNA treatment of WAS, some FNA-tolerable cells increased the K+, Ca2+, and H+ effluxes under low concentrations of FNA, and finally achieved ion homeostasis based on the results using a scanning ion-selective electrode measurement technique. This could cause the cells in WAS to maintain cytoactivity and integrity under a low-concentration FNA treatment. Furthermore, flow cytometry was used to assess the permeabilization and disruption of sludge cells toward a concentration gradient of FNA. Flow cytometry results indicated that cells in sludge flocs were disrupted within 30 minutes when the FNA concentration was above 8 mg L−1.
1. Introduction
Biological sewage treatment processes are conventionally used as a major technique in global wastewater treatment plants (WWTPs).1,2 The increasing production of waste activated sludge (WAS), which contained various microorganisms, extracellular polymeric substance and non-biodegradable particles, is regarded as an inherent burden to the environment.3 However, WAS is currently being considered as a type of resource, as it contains nitrogen, carbon and phosphorus.4 Thus, over the past few decades, researchers and engineers have undertaken considerable work to control and dispose of WAS and recover resources form WAS efficiently using WWTPs.5,6 Anaerobic digestion is one of the most common options for stabilizing sludge, reclaiming biogas, and reducing pathogens in large-scale WWTPs.7 However, due to some drawbacks of anaerobic digestion (i.e., long residence time for the hydrolysis stage and high operational costs), novel approaches, experimental and practical, have been developed to improve sludge disintegration and methanogenic efficiency.8 Among these pre-treatment techniques, chemically assisted thermal hydrolysis,9 ozonation, solar photocatalysis,10 and potassium ferrate oxidation11 are currently receiving significant attention. Moreover, a novel chemical approach for reducing sludge production in WWTPs using free nitrous acid (FNA) has been established due to its strong biocidal and permeabilization effects on activated sludge cells.12 In the WWTP bioprocess, FNA, as a by-product, can be produced in situ through the nitritation of anaerobic digestion liquor.13,14 In addition, FNA, which is the protonated form of nitrite, has been long thought to be responsible for the microbial metabolism inhibition of many functional bacteria (e.g., nitrifiers, denitrifiers, and polyphosphate-accumulating organisms (PAOs)).15 Thus, recently, the FNA treatment of sludge has been considered an effective and economic way to reduce the sludge production16 and N2O emission17 of WWTPs, enhance the secondary sludge biodegradability18 and nutrient removal,19,20 and advance methane21 and short-chain fatty acid production.22,23The unique properties of FNA treatment on WAS disposal have been demonstrated; however, the inhibition mechanism and cellular response toward low-concentration FNA remain inconclusive. Sijbesma et al.24 have found that FNA can act as a protonophore to inhibit the ATP synthesis of Pseudomonas fluorescens. Park25 discovered that FNA could react directly with sulfhydryl-containing enzymes and affect the tricarboxylic acid (TCA) cycle. Other researchers have confirmed that the effect of FNA stress on bacteria can be ascribed to the release of nitrogen intermediates (e.g., NO).26 The reported FNA inhibition mechanisms can vary significantly, because the inhibition effects are highly dependent on the type of organisms present.15 Anammox processes, which are widely used for the biological degradation of concentrated ammonia and nitrite streams, are inhibited by nitrites, rather than FNA.27
In addition to the inhibition effects of low-concentration FNA on cells in sludge, knowledge on the permeabilization and disruption of cells using a high concentration of FNA is limited and distinguishing the integrity of WAS samples during FNA treatment is a challenge. More importantly, few studies have focused on the direct disintegration of WAS using concentrated FNA. In their pioneering works on nitro-hydrolysis for sludge reduction, Perkins et al.28 successfully utilized nitric acid for the rapid hydrolysis of excess sludge at a high temperature (>160 °C) and pressure (100 psig). Their results indicated that the sludge reduction rate reached 75% with a nitric acid concentration of 11.2 wt% and excess sludge concentration of 4 wt%.28 Further analysis revealed that the initial hydrolysis of sludge can be completed within five minutes.28 The majority of the FNA concentrations used during sludge pretreatment in previous reports were maintained at a relatively low level (i.e., below 5 mg L−1) with mild reaction conditions, leading to the direct solubility of WAS at approximately 10–20%,29,30 suggesting that some FNA-tolerable bacteria could maintain cellular integrity at these FNA concentrations and treatment conditions. Whether the sludge disintegration by FNA treatment could be improved by more appropriate conditions, especially by treatment with high concentrations of FNA (i.e., above 10 mg L−1), remains to be tested.
Therefore, the goals of this study were to (1) optimize the factors that control sludge disintegration, using FNA with a wide range of concentration gradients; (2) investigate the cellular response of some FNA-tolerable cells (e.g., anammox bacteria), which result in the low disintegration effect of WAS in FNA treatment, by surveying the transmembrane ion flow rates using the scanning ion-selective electrode technique (SIET); and (3) assess the permeabilization and disruption of the sludge cells in high concentrations of FNA using flow cytometry (FCM).
2. Materials and methods
2.1 Waste sewage sludge samples
Waste sewage sludge was collected from a secondary sedimentation tank in a municipal wastewater treatment plant (WWTP) (Jimei WWTP, Xiamen City, China). The supernatant of the sludge samples was removed after precipitation. Then, the concentrated samples were kept refrigerated at 4 °C. The pH, total chemical oxygen demand (TCOD), soluble chemical oxygen demand (SCOD), total solids (TSS), volatile solids (VSS), and heavy metals in the samples are listed in Table 1.| Parameters | Concentration (mg L−1, except for pH, which is dimensionless) | Heavy metals | Concentration (mg kg−1) |
|---|---|---|---|
| a N.D. refers to not detected.b The basic parameters in the supernatant of the sludge samples. | |||
| pH | 7.19 ± 0.02 | Cd | N.D.a |
| TCOD | 6647.75 ± 25.76 | Pb | N.D.a |
| SCOD | 22.57 ± 2.98 | Zn | 1340.00 |
| TSS | (11.69 ± 0.64) × 103 | Cu | 170.00 |
| VSS | (4.32 ± 0.13) × 103 | Ni | 26.60 |
| NO2−–Nb | 1.01 ± 0.01 | Hg | 0.42 |
| NO3−–Nb | 2.03 ± 0.28 | Cr | 82.20 |
| NH4+–N | 12.58 ± 1.29 | As | 1.10 |
| TNb | 43.08 ± 2.93 | ||
2.2 Disintegration of sludge with FNA
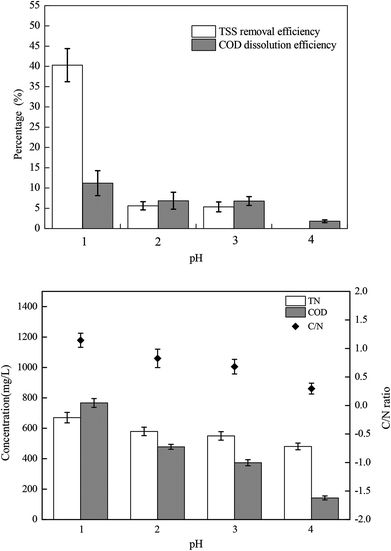
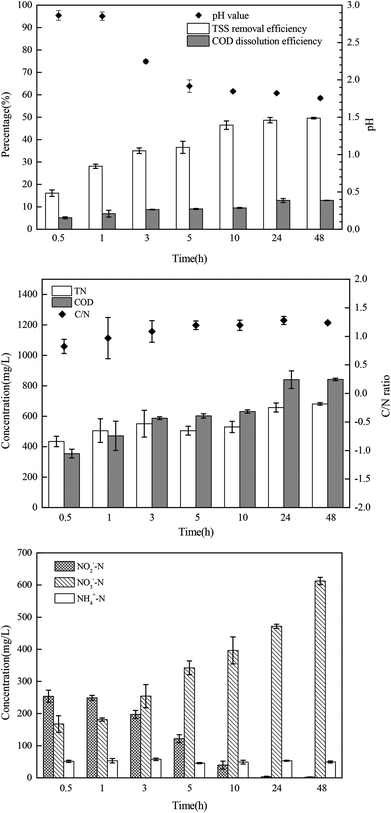
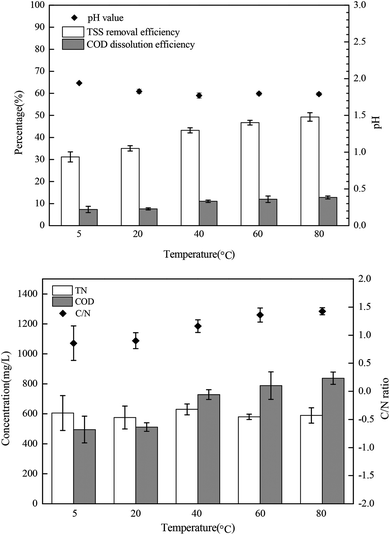
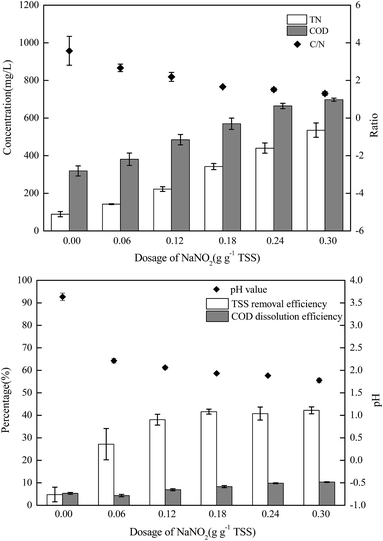
The sludge samples (300 mL) in 1 L glass bottles were washed three times with tap water and were bubbled with argon to form anaerobic conditions. Then, the pH and NO2−–N concentrations of the samples were adjusted using hydrochloric acid and NaNO2. After stirring at 300 rpm for a certain time, the mixed samples were stored in centrifuge tubes at 4 °C for follow-up tests.The most important operating parameters, such as the TSS removal efficiency and COD dissolution efficiency under different pH levels (i.e., 1.0, 2.0, 3.0, and 4.0) and NaNO2 dosages (i.e., 0, 0.3, 0.9, and 1.5 g g−1 TSS), were first investigated and compared. Subsequently, the influences of different stirring times (i.e., 0.5, 1, 3, 5, 10, 24, and 48 h) and temperatures (i.e., 5 °C, 20 °C, 40 °C, 60 °C, and 80 °C) were determined using the pH levels and dosages of NaNO2 identified in the previous step. Thereafter, the sludge reducing efficiencies were calculated under different dosages (i.e., 0, 0.06, 0.12, 0.18, 0.24, and 0.30 g g−1 TSS) and dosing patterns (i.e., single, double, and quadruple stepwise dosing) of NaNO2.
2.3 Analysis of cellular stress response towards low concentration FNA shock
The bacteria in the mixed sludge show different cellular responses to chemical stress, including FNA shock. Polyphosphate accumulating organisms (PAOs) are inhibited by FNA in concentrations of as low as 10 μg L−1,31 whereas some FNA-tolerant bacteria survive and show high resistance to hydrolysis,24 resulting in low sludge disintegration rates during FNA treatment. In this study, Percoll-purified anammox granules, which can utilize a high concentration of nitrite, were selected for analyzing the transmembrane ionic currents under low-concentration FNA shock. The net flux of the K+, Ca2+, and H+ ions of the purified anammox cells under FNA shock was measured using the SIET system (BIO-001A; Younger USA Sci. & Tech. Corp.) at Xuyue (Beijing) Sci. & Tech. Co. Ltd. (http://www.xuyue.net).32,33 Anammox granules were collected from an anammox reactor that has been operating over a long time in our laboratory and purified by Percoll centrifugation according to the method of Strous et al.34 The concentration gradients of the selected ions were measured by moving a calibrated microelectrode between two positions (30 μm) close to the surface of the anammox granules (approximately 5 μm). The purified anammox granules were fixed on poly-L-lysine-coated slides for 5 min and equilibrated in a 3 mL measurement solution (0.1 mM of CaCl2, 0.1 mM of KCl, and 0.3 mM of MES at a pH 6.0) for 30 min. For the K+, Ca2+, and H+ flux measurements, the ionic flux was recorded for 5 min, and an adequate amount of sodium nitrite was added into the measurement solution to form predesigned FNA concentrations. Subsequently, the ionic flux was continuously recorded using the ion-selective microelectrode for 20 min. The obtained ionic flux rate was calculated from Fick's law of diffusion:where J is the ion flux, dc/dx represents the ionic concentration gradients, and D is the ion diffusion constant in a particular medium.
2.4 Analysis of the permeabilization and disruption of sludge cells using a high concentration of FNA by FCM
Fresh sludge samples were treated with different concentrations of FNA, and the integrity of the cells was analyzed using FCM. To differentiate between the intact and permeabilized bacteria, the cells were stained with SYBR-Green I (1![[thin space (1/6-em)]](https://www.rsc.org/images/entities/char_2009.gif) :
:![[thin space (1/6-em)]](https://www.rsc.org/images/entities/char_2009.gif) 30 dilution of a commercial stock; Invitrogen, USA; λex = 495 nm, λem = 525 nm) diluted in dimethyl sulfoxide (DMSO, Merck, Germany) and propidium iodide (PI, stock solution concentration 1 mg mL−1; Invitrogen, USA; λex = 536 nm, λem = 617 nm). The sludge samples were filtered using a 200-mesh sieve to keep the total suspended cell concentration within 106 to 107 cells per L. Afterwards, 1 mL of a bacterial suspension with approximately 106 to 107 cells per mL was incubated for 15 min at room temperature with 10 μL of both fluorochromes and away from light. SYBR-Green I dyed all of the cells, whereas PI only dyed the membrane-permeable and dead cells.35 In the permeabilized cells, the simultaneous staining with SYBR-1 and PI activated the energy transfer between the fluorochromes. Consequently, intact and permeabilized bacteria emitted green and red fluorescence, respectively.
30 dilution of a commercial stock; Invitrogen, USA; λex = 495 nm, λem = 525 nm) diluted in dimethyl sulfoxide (DMSO, Merck, Germany) and propidium iodide (PI, stock solution concentration 1 mg mL−1; Invitrogen, USA; λex = 536 nm, λem = 617 nm). The sludge samples were filtered using a 200-mesh sieve to keep the total suspended cell concentration within 106 to 107 cells per L. Afterwards, 1 mL of a bacterial suspension with approximately 106 to 107 cells per mL was incubated for 15 min at room temperature with 10 μL of both fluorochromes and away from light. SYBR-Green I dyed all of the cells, whereas PI only dyed the membrane-permeable and dead cells.35 In the permeabilized cells, the simultaneous staining with SYBR-1 and PI activated the energy transfer between the fluorochromes. Consequently, intact and permeabilized bacteria emitted green and red fluorescence, respectively.
The cellular states of the sludge samples were analyzed using a FCM instrument (Quanta SC, Beckman Coulter, California). The signals collected were green and red fluorescence, with a logarithmic gain and forward angle light scattering (FALS), which were related to the cell size.36 To eliminate non-bacterial particles and debris, the data acquisition gates were set to green and red fluorescence distributions. At least 10![[thin space (1/6-em)]](https://www.rsc.org/images/entities/char_2009.gif) 000 cells were analyzed for each sample over a few minutes to provide good statistical data. The accuracy of the staining method and the FCM analysis has been previously evaluated using epifluorescence microscopy.42 Finally, the intact, permeabilized, and disrupted cells were identified according to double staining using FCM analysis.37
000 cells were analyzed for each sample over a few minutes to provide good statistical data. The accuracy of the staining method and the FCM analysis has been previously evaluated using epifluorescence microscopy.42 Finally, the intact, permeabilized, and disrupted cells were identified according to double staining using FCM analysis.37
2.5 Physicochemical analysis methods
The FNA concentration, COD dissolution efficiency, and TSS removal efficiency were calculated using the following equations:38,39
 | (1) |
 | (2) |
 | (3) |
The mixture was first centrifuged at 5000 rpm for 5 min and filtered using 0.45 μm membranes. The concentrations of NH4+–N, NO2−–N, NO3−–N, and PO43−–P in the supernatant were measured with a flow injection analyzer (8500 Series 2, QuickChem, USA). The concentrations of TSS and VSS were measured using the standard method.40 The COD was analyzed using the colorimetric method (Lian-hua, China).40 The practical concentration of COD is defined as the measured concentration minus the concentration of COD, that is, NO2−–N. Heavy metals were detected using inductively coupled plasma optical emission spectrometry (ICP-OES) (Optima 7000DV, Labconco, USA).
3. Results and discussion
3.1 Performance of FNA on the disintegration of WAS
In this section, the main influencing factors of the effect of FNA on the disintegration of WAS are analyzed, including the pH, stirring time, temperature, NaNO2 dosage, and NaNO2 dosing method. According to eqn (2) and (3), the TSS removal efficiency and the COD dissolution efficiency were calculated and represent the efficiency of WAS disintegration.3.2 Mechanisms of FNA on the solubilization of WAS
On the basis of the performance of FNA on WAS reduction, the mechanisms of this process are discussed in this section. On the one hand, the typical transmembrane change of the bacteria from the effect of low-concentration FNA was analyzed using SIET. On the other hand, under the high-concentration FNA exposure, the process of cell disintegration was expounded by the FCM results.In theory, the K+-, Ca2+-, and H+-dependent regulatory pathways and signaling of cells are considered important cell responses to environmental stress or toxicity.32,44 H+ transport is carried out by H+ATPase molecules using the energy from the adenosine triphosphate (ATP) hydrolysis in anaerobic bacteria, and viable cells can extrude H+ as a physiological defense against stress.45 Released Ca2+ ions are considered to reduce K+ efflux and regulate the K+ homeostasis of plant or fungi cells under transient environmental stress.44 A previous study revealed that FNA could act as an uncoupler to disturb the energy generation of cells or mislead the enzyme assemblage.15 That is, FNA could enhance the transmembrane proton permeability and thus inhibit ATP synthesis.15 Sijbesma et al.24 indicated that FNA could diffuse into the cell membrane of the denitrifier P. fluorescens derived by enhanced proton permeability. Then, the denitrifier stops releasing protons from the membrane due to the expenditure of the ATP synthesis. Therefore, we deduced that FNA induces the permeabilization of bacteria and eventually leads to cell membrane lysis. This information will benefit our understanding of the FNA inhibition and disintegration of sludge.
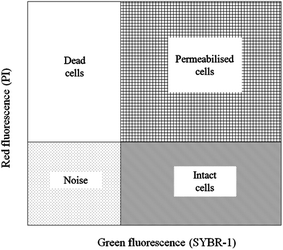 | ||
| Fig. 6 Example of an FCM cytogram of activated sludge with the indication of the four regions to distinguish intact cells and permeabilized cells. | ||
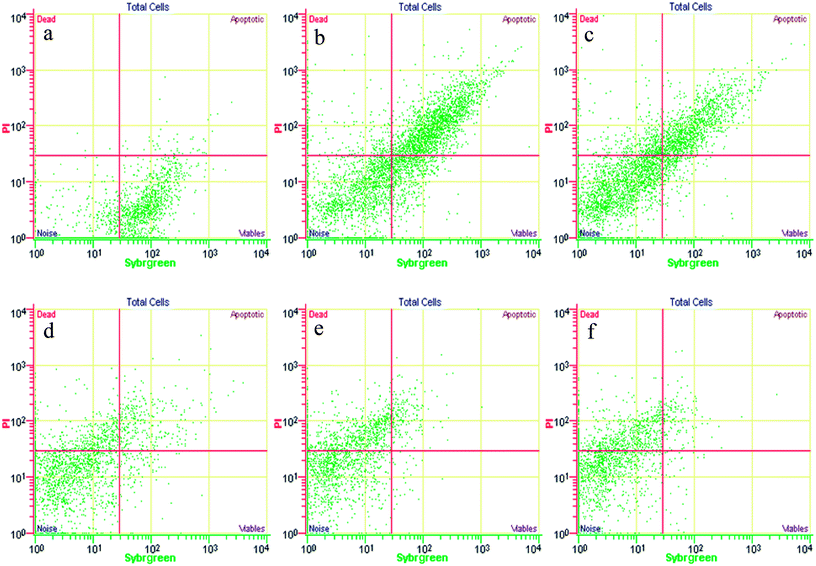
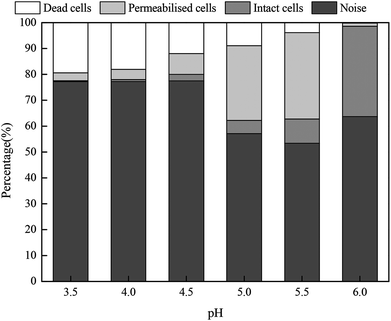
The activated sludge was found to have some small aggregates, which were formed by the gathering of intact and permeabilized cells and appeared fluorescent, emitting red and green signals. Despite the optimization of the disaggregation, some small moderate aggregates remained. The significant FCM cytograms obtained for the most relevant operating conditions when adding different FNA concentrations are summarized. Fig. 7 shows an immediate comparison of the FNA effects on the total cells, distinguished as intact and permeabilized cells. In raw WWTP sludge, the vast number of cells were intact at pH = 6. With a decrease in the pH values, the proportion of intact cells decreased gradually, whereas the proportion of permeabilized cells and cell fragments increased obviously. At pH values of 4.5, 4.0, and 3.5, the concentrations of FNA were found to be 0.27, 8.86, and 82.71 mg L−1, respectively. Meanwhile, several dissolved cell fragments and other particles were detected. Peer studies have shown that microbial dissimilation is restrained when the FNA concentration is within 1.3–2.1 mg L−1.38 Thus, the cells in the sludge would be hydrolyzed owing to the high FNA concentration at low pH.
The mechanisms of the minimal amount of FNA inhibiting the cellular metabolism and the large amount of FNA decomposing the cells remains unclear. Owing to the FNA effect, the nitrite oxidizing bacteria (NOB) in the sludge in the experimental group (FNA = 1.35 mg of HNO2–N L−1) was reduced by 80% of that of the control group.49 Jabari et al.50 studied the microbial activity of the phosphorus removal of microorganisms under different FNA concentrations and found that FNA concentration is one of the most important factors of phosphorus removal efficiency. Therefore, FNA has a universal inhibitory effect on biological metabolic processes.51–54 Further mechanism studies have shown that these inhibitory effects restrain ATP metabolic processes, such as the active transport process of the cell membrane, the process of oxygen intake, and oxidative phosphorylation.52,55–57 However, reports on the mechanism of membrane decomposition under high FNA concentrations are few. Like FNA sludge reduction, sludge reduction based on a high temperature and the use of high pressure nitric acid has been industrialized.28 However, FNA sludge reduction has obvious advantages in terms of energy consumption compared with this method.
Fig. 8 shows the proportions of dead, permeabilized and intact cells in fresh sludge at different pH values. When the pH value was 6.0, the living cells accounted for 34.92%, whereas the proportions of dead and permeabilized cells were only 0.21% and 1.21%, respectively. The proportion of intact cells gradually declined with the pH values, whereas the proportion of dead and permeabilized cells increased. When the pH value was 3.5, the percentages of intact, permeabilized and dead cells were 0.37%, 3.03% and 19.39%, respectively. Moreover, the non-cellular structure impurities and particles in the municipal sludge were counted by FCM. Thus, the noise not only included cell debris, but also other impurity particles.
4. Conclusions
In this study, a series of batch tests were conducted to evaluate direct sludge disintegration using concentrated FNA. The cell response of transmembrane ion flow rates toward low-concentration FNA shock was surveyed using a SIET system. The permeabilization and disruption of bacteria in sludge flocs under a high concentration of FNA were analyzed by FCM. The main conclusions can be summarized as follows:(1) Sludge disintegration efficiency was superior when the sludge was exposed to FNA for 10 h at 25 °C. When the dosage of NaNO2 was 0.12 g g−1 TSS and the pH was 3.0 (FNA = 20.94 mg L−1), the TSS removal and COD dissolution efficiencies were prominent at 38% and 7%, respectively.
(2) In low FNA concentrations, some FNA-tolerable cells increased the K+, Ca2+, and H+ effluxes and finally achieved ion homeostasis. This phenomenon may cause the cells to maintain cytoactivity and integrity under low-concentration FNA shock.
(3) In high FNA concentrations, the cells in the sludge flocs are disrupted within 30 min when the FNA exceeds 8 mg L−1 (pH = 4.0).
Conflicts of interest
There are no conflicts to declare.Acknowledgements
This work is supported by the National Science and Technology Major Project of China under Grant No. 2016ZX05060-022, the National Natural Science Foundation of China under Grant No. 51208491, and the Frontier Research Projects of IUE-CAS under Grant No. IUEQN201304. We wish to thank the anonymous reviewers for their valuable suggestions on revising the work.References
- Z. W. He, C. X. Yang, L. Wang, Z. C. Guo, A. J. Wang and W. Z. Liu, Chem. Eng. J., 2016, 290, 125–135 CrossRef CAS.
- H. Liu, Y. Wang, Y. Bo, Y. Zhu, F. Bo and L. He, Bioresour. Technol., 2016, 218, 92–100 CrossRef CAS PubMed.
- Y. Wei, R. T. Van Houten, A. R. Borger, D. H. Eikelboom and Y. Fan, Water Res., 2003, 37, 4453–4467 CrossRef CAS PubMed.
- D. Wang, Y. Wang, Y. Liu, H. H. Ngo, Y. Lian, J. Zhao, F. Chen, Q. Yang, G. Zeng and X. Li, Bioresour. Technol., 2017, 234–456 CrossRef PubMed.
- C. P. Chu, B. V. Chang, G. S. Liao, D. S. Jean and D. J. Lee, Water Res., 2001, 35, 1038–1046 CrossRef CAS PubMed.
- J. Abelleira, S. I. Pérezelvira, J. R. Portela, J. Sánchezoneto and E. Nebot, Environ. Sci. Technol., 2012, 46, 6158 CrossRef CAS PubMed.
- M. D. Gracia, P. Grau, E. Huete, J. Gómez, J. L. García-Heras and E. Ayesa, Water Res., 2009, 43, 4626–4642 CrossRef PubMed.
- W. Wang, H. Hou, S. Hu and X. Gao, Bioresour. Technol., 2010, 101, 1715 CrossRef CAS PubMed.
- V. K. Tyagi and S. L. Lo, Bioresour. Technol., 2012, 119, 105–113 CrossRef CAS PubMed.
- C. Liu, Z. Lei, Y. Yang, H. Wang and Z. Zhang, Bioresour. Technol., 2013, 137, 57 CrossRef CAS PubMed.
- X. Zhang, H. Lei, K. Chen, Z. Liu, H. Wu and H. Liang, Chem. Eng. J., 2012, 210, 467–474 CrossRef CAS.
- G. Jiang, O. Gutierrez and Z. Yuan, Water Res., 2011, 45, 3735–3743 CrossRef CAS PubMed.
- L. Yingyu, L. Ye, Q. L. Wang, S. H. Hu, P. Maite and Z. G. Yuan, Chem. Eng. J., 2015, 259, 62–69 CrossRef.
- W. Qilin, J. Guangming, Y. Liu, P. Maite and Y. Zhiguo, Water Res., 2014, 62, 202–210 CrossRef PubMed.
- Y. Zhou, A. Oehmen, M. Lim, V. Vadivelu and W. J. Ng, Water Res., 2011, 45, 4672–4682 CrossRef CAS PubMed.
- Q. Wang, L. Ye, G. Jiang and Z. Yuan, Water Res., 2013, 47, 3663–3672 CrossRef CAS PubMed.
- D. Wang, Q. Wang, A. E. Laloo and Z. Yuan, Environ. Sci. Technol., 2016, 50, 7425 CrossRef CAS PubMed.
- M. Pijuan, Q. Wang, L. Ye and Z. Yuan, Bioresour. Technol., 2012, 116, 92–98 CrossRef CAS PubMed.
- D. Wang, Q. Fu, Q. Xu, Y. Liu, H. H. Ngo, Q. Yang, G. Zeng, X. Li and B. J. Ni, Bioresour. Technol., 2017, 244, 920 CrossRef CAS PubMed.
- D. Wang, Q. Wang, L. Andrew, Y. Xu, P. L. Bond and Z. Yuan, Sci. Rep., 2016, 6, 25547 CrossRef CAS PubMed.
- Q. Wang, L. Ye, G. Jiang, P. D. Jensen, D. J. Batstone and Z. Yuan, Environ. Sci. Technol., 2013, 47, 11897 CrossRef CAS PubMed.
- J. Zhao, D. Wang, X. Li, Q. Yang, H. Chen, Y. Zhong and G. Zeng, Water Res., 2015, 78, 111 CrossRef CAS PubMed.
- X. Li, J. Zhao, D. Wang, Q. Yang, Q. Xu, Y. Deng, W. Yang and G. Zeng, Chemosphere, 2016, 144, 160–167 CrossRef CAS PubMed.
- W. F. Sijbesma, J. S. Almeida, M. A. Reis and H. Santos, Biotechnol. Bioeng., 1996, 52, 176–182 CrossRef CAS PubMed.
- J. W. Park, Arch. Pharmacal Res., 1993, 16, 1–5 CrossRef CAS.
- S. Carlsson, N. P. Wiklund, L. Engstrand, E. Weitzberg and J. O. Lundberg, Nitric Oxide, 2001, 5, 580–586 CrossRef CAS PubMed.
- T. Lotti, V. D. S. Wr, R. Kleerebezem, C. Lubello and M. C. van Loosdrecht, Water Res., 2012, 46, 2559–2569 CrossRef CAS PubMed.
- L. W. Perkins, K. T. Klasson, R. M. Counce and P. R. Bienkowski, Ind. Eng. Chem. Res., 2003, 42, 3544–3548 CrossRef CAS.
- Q. Wang, W. Wei, Y. Gong, Q. Yu, Q. Li, J. Sun and Z. Yuan, Sci. Total Environ., 2017, 587–588, 510 CAS.
- M. Bin, P. Yongzhen, W. Yan, L. Baikun, B. Peng and W. Yayi, Bioresour. Technol., 2015, 179, 20–25 CrossRef PubMed.
- Y. Zhou, L. Ganda, M. Lim, Z. Yuan and W. J. Ng, Bioresour. Technol., 2012, 116, 340–347 CrossRef CAS PubMed.
- G. M. Zeng, A. W. Chen, G. Q. Chen, X. J. Hu, S. Guan, C. Shang, L.-H. Lu and Z. J. Zou, Environ. Sci. Technol., 2012, 46, 7818–7825 CrossRef CAS PubMed.
- A. Lin, G. C. Wang and W. Q. Zhou, Physiol. Plant., 2013, 148, 582–589 CrossRef CAS PubMed.
- M. Strous, J. A. Fuerst, E. H. M. Kramer, S. Logemann, G. Muyzer, K. T. V. D. Passchoonen, R. Webb, J. G. Kuenen and M. S. M. Jetten, Nature, 1999, 400, 446–449 CrossRef CAS PubMed.
- G. Ziglio, G. Andreottola, S. Barbesti, G. Boschetti, L. Bruni, P. Foladori and R. Villa, Water Res., 2002, 36, 460–468 CrossRef CAS PubMed.
- P. Foladori, A. Quaranta and G. Ziglio, Water Res., 2008, 42, 3757–3766 CrossRef CAS PubMed.
- P. Foladori, S. Tamburini and L. Bruni, Water Res., 2010, 44, 4888–4899 CrossRef CAS PubMed.
- T. Yamamoto, K. Takaki, T. Koyama and K. Furukawa, Bioresour. Technol., 2008, 99, 6419 CrossRef CAS PubMed.
- C. J. Cheng, P. K. A. Hong and C. F. Lin, Chemosphere, 2012, 87, 637 CrossRef CAS PubMed.
- SEPA, Editorial Committee of “monitoring and analytical methods of water and wastewater”, China Environmental Science Press, Beijing, 4th edn, 2002 Search PubMed.
- L. Changqing, Z. Youcai, Z. Jiangshan, C. Wenhua and N. Dongjie, Acta Sci. Circumstantiae, 2008, 28, 2006–2011 Search PubMed.
- M. P. J. Weemaes and W. H. Verstraete, J. Chem. Technol. Biotechnol., 2010, 73, 83–92 CrossRef.
- E. Neyens and J. Baeyens, J. Hazard. Mater., 2003, 98, 51 CrossRef CAS PubMed.
- J. Li, S. Bao, Y. Zhang, X. Ma, M. Mishraknyrim, J. Sun, G. Sa, X. Shen, A. Polle and S. Chen, Plant Physiol., 2012, 159, 1771 CrossRef CAS PubMed.
- L. Shabala, B. Budde, T. Ross, H. Siegumfeldt, M. Jakobsen and T. Mcmeekin, Appl. Environ. Microbiol., 2002, 68, 1794–1802 CrossRef CAS PubMed.
- G. Ziglio, G. Andreottola, S. Barbesti, G. Boschetti, L. Bruni, P. Foladori and R. Villa, Water Res., 2002, 36, 460–468 CrossRef CAS PubMed.
- P. Foladori, B. Laura, A. Gianni and Z. Giuliano, Water Res., 2007, 41, 235–243 CrossRef CAS PubMed.
- G. Nebe-Von-Caron, P. J. Stephens, C. J. Hewitt, J. R. Powell and R. A. Badley, J. Microbiol. Methods, 2000, 42, 97–114 CrossRef CAS PubMed.
- Q. Wang, L. Ye, G. Jiang, S. Hu and Z. Yuan, Water Res., 2014, 55, 245–255 CrossRef CAS PubMed.
- P. Jabari, G. Munz, Q. Yuan and J. A. Oleszkiewicz, Chem. Eng. J., 2016, 287, 38–46 CrossRef CAS.
- C. Glass, J. A. Silverstein and J. Oh, Water Environ. Res., 1997, 69, 1086–1093 CrossRef CAS.
- V. M. Vadivelu, J. Keller and Z. Yuan, Biotechnol. Bioeng., 2006, 95, 830–839 CrossRef CAS PubMed.
- Y. Zhou, M. Pijuan and Z. Yuan, Biotechnol. Bioeng., 2007, 98, 903 CrossRef CAS PubMed.
- L. Zhang, J. C. Yang and K. Furukawa, J. Biosci. Bioeng., 2010, 110, 441–448 CrossRef CAS PubMed.
- Y. Zhou, L. Ganda, M. Lim, Z. Yuan, S. Kjelleberg and W. J. Ng, Appl. Microbiol. Biotechnol., 2010, 88, 359–369 CrossRef CAS PubMed.
- L. Ye, M. Pijuan and Z. Yuan, Water Res., 2010, 44, 2901–2909 CrossRef CAS PubMed.
- M. Pijuan, L. Ye and Z. Yuan, Water Res., 2010, 44, 6063 CrossRef CAS PubMed.
| This journal is © The Royal Society of Chemistry 2018 |


