
 Open Access Article
 This Open Access Article is licensed under a Creative Commons Attribution-Non Commercial 3.0 Unported Licence
Biodistribution and targeting potential assessment of mucoadhesive chitosan nanoparticles designed for ulcerative colitis via scintigraphy†
Pooja Mongia Raja,
Rakesh Raj a,
Ankur Kaulb,
Anil K. Mishrab and
Alpana Rama
a,
Ankur Kaulb,
Anil K. Mishrab and
Alpana Rama
aInstitute of Pharmaceutical Sciences, Guru Ghasidas Vishwavidyalaya, Bilaspur, C.G. 495009, India. E-mail: rajscientist.2014@rediffmail.com; Tel: +917752-260027
bDivision of Cyclotron and Radiopharmaceutical Sciences, Institute of Nuclear Medicine and Allied Sciences (INMAS), New Delhi 110054, India
First published on 6th June 2018
Abstract
In the present investigation we have prepared and characterized curcumin (CN)-containing chitosan nanoparticles (CS-NPs) coated with Eudragit FS 30D for colon-specific drug delivery for treatment of ulcerative colitis. Methods: CS-NPs were prepared by ionic gelation using tripolyphosphate. To specify pH sensitive delivery, CS–CN-NPs were coated with Eudragit FS 30D by using a solvent evaporation method. Different process parameters were evaluated, and the optimized formulation was characterized by particle size, size distribution, zeta potential and encapsulation efficiency before lyophilization. The lyophilized product was further subjected to Fourier-transform infrared spectroscopy, and particle morphology and in vitro drug release in different media were studied. Results: the kinetics of in vitro drug release from the CS–CN-NPs revealed sustained release behaviour of the developed carriers. In vivo biodistribution study by gamma-scintigraphy showed good accumulation of the developed nanocarriers in the colonic region. Conclusion: sustained and pH stimulated delivery of CN to the colon was successfully attained via coating of CS-NPs with Eudragit FS 30D to circumvent poor absorption and availability of CN.
Introduction
Ulcerative colitis (UC) and Crohn's disease (CD) are described as inflammatory bowel disease (IBD). IBD is a set of pathological conditions that lead to chronic inflammation and impairment of the gastrointestinal tract (GIT).1,2 They are idiopathic and both are evident as persistent inflammation of the GIT, but they differ in the nature and site of inflammation. In the case of UC, colon and rectum are affected, limited to mucosa and continuous inflamed areas (which are a characteristic feature), whereas any of the parts of the GIT prone to be affected in CD are transmural and are characterized by segmental inflamed areas.3,4 Abnormal interaction of gastrointestinal microflora with the mucosal immune system is commonly observed in UC patients.5 The treatments employed for the management of UC include aminosalicylates, corticosteroids and their derivatives, immunomodulators, and several other therapies, including integrin antibody therapy, recombinant growth factors, macrolide combination antibody therapy, monoclonal antibody, and mitogen-activated protein kinase inhibitors. The key goal of UC treatment is to reduce inflammation with anti-inflammatory drugs.Application of anti-inflammatory or immunosuppressive agents is very frequently associated with various common toxic effects related to dose (vomiting, headache, malaise, haemolysis and nausea) or idiosyncratic (fever, rash, lymphadenopathy, agranulocytosis and pneumonitis) and antibiotics intolerances.6,7 No complete remission can be accomplished by means of the above-mentioned treatments and repeated flares of inflammation are experienced by most patients, who also develop resistance to therapy. Patients with the chronic active disease experience destruction and loss of the epithelial surface of the mucosa as a result of repeated or continuous inflammation. This causes enhanced proliferation of epithelial cells which when uncontrolled results in colitis-associated colorectal cancers.8,9
Recently, various studies have focused on the treatment of inflammatory disease with a natural moiety to avoid the risk of adverse effects. A number of such reports show that curcumin (CN) can attenuate inflammation in a mouse colitis model and clinically minimize the rate of UC relapse.10,11 CN, a hydrophobic phenol derivative obtained from Curcuma longa Linn, possesses numerous therapeutic activities, such as anti-cancer, antioxidant, antimicrobial along with anti-inflammatory activity, and is gaining higher interest for UC therapy. It promotes mucosal healing by significantly downregulating the inflammatory cytokines and scavenges free radicals.12,13 Venkataraganna and others have reported that CN has pronounced inhibitory effect on inducible nitric oxide synthase (iNOS) and nuclear factor kappa B (NF-κB).11,14,15 The U.S. Food and Drug Administration (FDA) has approved curcumin as a GRAS (Generally Recognized As Safe) drug since various clinical trials revealed that even at a high dose (12 g day−1) for 3 months curcumin is harmless for humans.16,17 However, the major drawback of curcumin is low bioavailability via the oral route due to its very low aqueous solubility,18 and short half-life because of high metabolic rate.19,20 To overcome these limitations, various novel sustained delivery systems have been reported for specifying curcumin availability directly to colitis tissues, such as tablets, liposomes, microspheres, nanostructured lipid carriers, self-emulsifying drug delivery system (SEDDS) and pellets.10,21–23 However, these suffer from well-known limitations, including unintentional release throughout the GIT, long term stability and lower penetration through the mucus layer. Such obstacles can be overcome by nanoparticles (NPs). For example, solid lipid nanoparticles24 and chitosan-montmorillonite clay NPs were reported as sustained delivery carriers for curcumin, but showed drug release throughout the GIT.25,26 As already reported, NPs are taken up through macrophages in the active inflamed area of UC, and adherence of small particles on the thicker mucus layer (high mucus production in active UC) in the inflamed region is also high. The smaller size of NPs makes them capable of accumulating in the inflamed area.27
NPs made from biodegradable materials like chitosan (CS), pectin, alginate, gelatin, gums etc. have gained much attention. Among these, chitosan is a very good example of a biodegradable polymer widely employed for development of NPs.28,29 It is mucoadhesive, which prolongs the contact time of drugs with biological membranes and modifies the permeability of the mucosal surface; owing to this specific characteristic, it has been gaining more interest in the last decade.30,31 Chitosan is a cationic polysaccharide and can interact with negatively charged mucosal surface.32 Though having many advantages, the use of chitosan in delivery to the colon is limited owing to its degradation at acidic pH and interaction with the mucosal surface of the entire GIT. Hence most studies have reported on administration of CN encapsulated in CS-NPs via the parenteral route to provide sustained delivery of drug for breast cancer, hepatocarcinoma and tumour cells at pH 5 or above.33–36 Some reports on CS–CN-NPs revealed enhanced bioavailability of anticancer and antimalarial drugs in comparison with pure CN but did not show the effect of acidic pH on release of NPs.37–39 In this study, the coating of chitosan nanoparticles with pH sensitive Eudragit polymer was exhaustively studied to overcome the effect of highly acidic environment.19,40,41
Eudragit FS 30D is a pH sensitive polymer that prevents the release of drug in the stomach and proximal small intestine.42 It is an anionic copolymer of methyl acrylate, methylmethacrylate and methacrylic acid. Eudragit FS 30D dissolves similarly to Eudragit S100 at pH 7, but in a more sustained and controlled mode.43 Since the pH at the ileum and the ileo-caecal valve is reported to be 7–8, it is expected that Eudragit FS 30D will dissolve in that region.44
The present investigation focused on developing and characterizing chitosan based mucoadhesive NPs loaded with CN by an ionic gelation method and coated with pH triggered polymer. The further optimized formulation was subjected to studies of in vitro drug release kinetics, biodistribution and targeting potential by scintigraphy.
Result and discussion
UC drastically affects the quality of a patient's life and treatment carries a cost burden. Along with this, patients are also at a greater risk of colon cancer and liver disease. There is no standard treatment protocol available for managing all patients with UC. The approach to treat UC must be adapted to an individual; treatment is based on aminosalicylates, corticosteroids, immunomodulators, antibiotics and monoclonal antibodies, and every therapy has adverse effects. Curcumin is a herbal compound that can reduce UC and alleviate the inflammatory response. Several studies have demonstrated the role of curcumin as a novel therapy for children and adults with UC; the mode of action of curcumin in the treatment of UC is unknown, but abundant evidence has established its effects on the NF-κB pathway and p38 MAPK in the intestinal mucosa.45 We have developed CN-NPs using low molecular weight CS with a high degree of deacetylation (>95%) because it is soluble in low acid media. Besides this, more amino groups are available, which could facilitate the electrostatic interaction of CS with tripolyphosphate (TPP). Smaller particle size and narrow size distribution of highly deacetylated CS has already been reported in the previous literature.46Eudragit FS 30D coated CS-NPs encapsulating the herbal drug CN (FS-CS–CN-NPs) were prepared by an ionic gelation method as shown schematically in Fig. 1. The ionic gelation method makes particles in the nano-size range with low polydispersity index and appropriate zeta potential. An adequate charge density is needed for anions to cross-link CS and form particles. When the concentration of CS was varied from 0.05 to 0.3% (w/v) and the volume ratio of CS![[thin space (1/6-em)]](https://www.rsc.org/images/entities/char_2009.gif) :TPP was 2:1, 2.5:1, 3:1, 4:1 and 5:1, the size of the NPs was found to be 161–439 nm, with polydispersity index less than 1 and zeta potential from 22 to 30 mV, as shown in Table 1. Positive charge is suitable for uptake of NPs in the inflamed colonic mucosa. Zeta potential also affects the intracellular localization and mucoadhesive property of NPs. The greater localization of CS–CN-NPs to the inflamed colon has the advantages of higher drug concentration and lower drug degradation.
:TPP was 2:1, 2.5:1, 3:1, 4:1 and 5:1, the size of the NPs was found to be 161–439 nm, with polydispersity index less than 1 and zeta potential from 22 to 30 mV, as shown in Table 1. Positive charge is suitable for uptake of NPs in the inflamed colonic mucosa. Zeta potential also affects the intracellular localization and mucoadhesive property of NPs. The greater localization of CS–CN-NPs to the inflamed colon has the advantages of higher drug concentration and lower drug degradation.
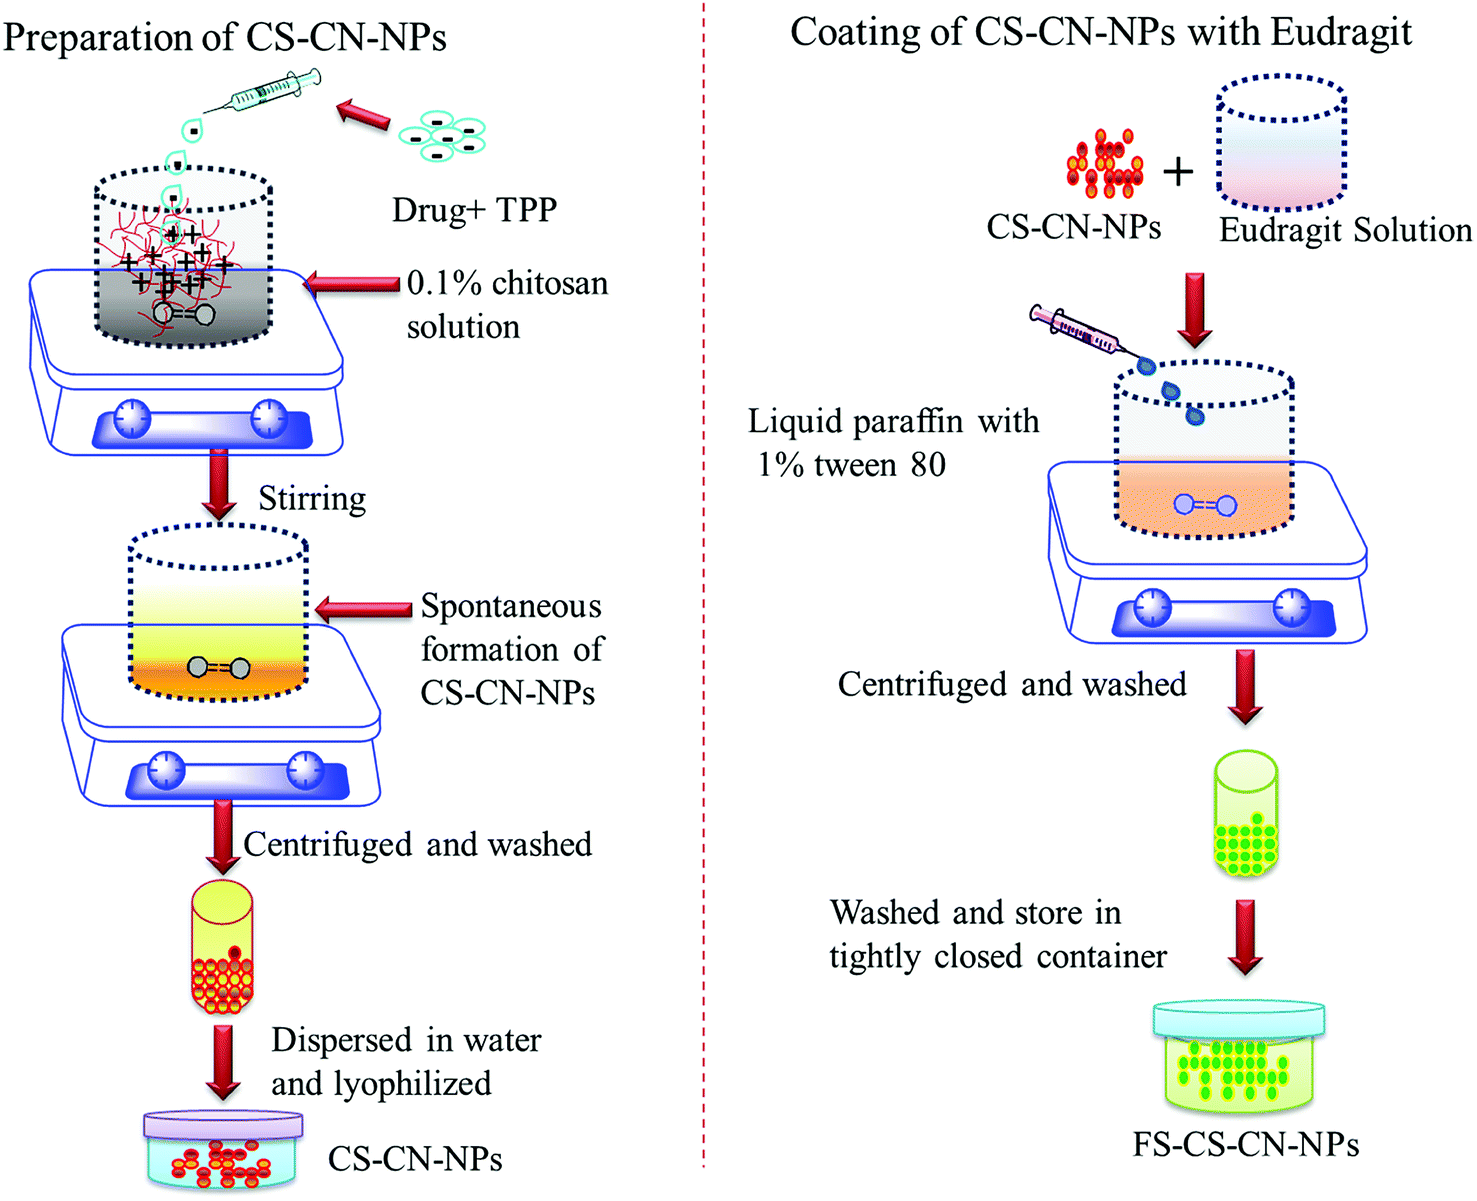 | ||
| Fig. 1 Schematic representation of preparation of chitosan nanoparticles and coating with Eudragit FS 30D. | ||
| Sample no. | Formulation | Particle size (nm) | Polydispersity index | Zeta potential (mV) | % EE |
|---|---|---|---|---|---|
| 1 | CS-NPs | 161 ± 6.2 | 0.21 ± 0.02 | 22 ± 2.5 | — |
| 2 | CS–CN-NPs | 181 ± 5.8 | 0.34 ± 0.03 | 23 ± 1.8 | 89.5 ± 2.4 |
| 3 | FS-CS–CN-NPs | 368 ± 3.9 | 0.42 ± 0.02 | −28 ± 3.3 | 87.6 ± 1.9 |
The size of NPs was found to increase with an increase in CS concentration, which also affects the entrapment efficiency (EE). For the different formulations used during the process of optimization, EE varied from 70.53% to 89.51%. The EE was found to decrease upon increasing CS:TPP ratio from 4:1 to 5:1, possibly due to inefficient cross-linking taking place at higher CS contents. A formulation consisting of drug:polymer in 1:10 ratio and CS–TPP in 3:1 ratio exhibited the highest EE. We hypothesized that CN in the coated CS–CN-NPs was preserved as it passed through the upper GIT region, and then localized in the inflamed area after solubilization of the FS 30D coating. The Eudragit FS 30D coating was applied on CS-NPs by oil-in-oil emulsification solvent evaporation technique using a coat:core ratio of 3:1. The coating of optimized CS-NPs by Eudragit FS 30D showed increases in size up to 368 ± 3.9 nm.
In accordance with the ICH guidelines the developed HPLC method was validated for precision, accuracy, linearity, limit of detection (LOD) and limit of quantification (LOQ), as shown in Table 2. The correlation coefficient (r2) of CN was found to be 0.999, with linearity in the range of 5–50 μg ml−1. The limit of detection (LOD) for CN was 3.370 μg ml−1 at a wavelength of 425 nm. Suitability of the method was tested by determining percentage relative standard deviations (% RSD) of peak area and retention time, which were found to be less than 2%. By using the signal to noise ratio 10, the limit of quantitation (LOQ) of CN was detected. The percentage recovery of the CN from the developed method was well within 100.19 ± 1.93%, and %RSD of the assay of intra-day and inter-day precision was less than 2%, as depicted in Table 3.
| Parameter | Value |
|---|---|
| Accuracy | 100.199 ± 1.930 |
| Slope | 12.73 |
| Intercept | 13.705 |
| Linearity range | 5–50 μg ml−1 |
| Correlation coefficient | 0.999 |
| SE of intercept | 4.596 |
| SD of intercept | 13.00 |
| LOD | 3.370 |
| LOQ | 10.212 |
| Concentration (μg ml−1) | Concentration found, mean ± SD (μg ml−1) | Day | % RSD |
|---|---|---|---|
| Intra-day variation (n = 5 at each level) | |||
| 5 | 4.91 ± 0.06 | 1 | 1.22 |
| 25 | 26.23 ± 0.41 | 1 | 1.56 |
| 50 | 51.10 ± 0.38 | 1 | 0.74 |
| 5 | 5.02 ± 0.06 | 2 | 1.19 |
| 25 | 26.17 ± 0.51 | 2 | 1.94 |
| 50 | 50.86 ± 0.43 | 2 | 0.84 |
| 5 | 4.88 ± 0.08 | 3 | 1.63 |
| 25 | 25.06 ± 0.38 | 3 | 1.51 |
| 50 | 50.31 ± 0.52 | 3 | 1.03 |
|
|||
| Inter-day variation (n = 15 each day, n = 3 at each level) | |||
| 5 | 4.86 ± 0.07 | — | 1.44 |
| 25 | 25.23 ± 0.48 | — | 1.90 |
| 50 | 50.05 ± 0.35 | — | 0.69 |
The water uptake and swelling rate of polymer play an important role in drug release profile; this may affect the rate of drug absorption at the site of delivery and cellular uptake. In this study, in vitro swelling behaviour of the prepared carriers revealed the percentage swelling in phosphate buffer pH 1.2, 6.8 and 7.4 was 474 ± 24%, 196 ± 17% and 152 ± 17% respectively in 24 h. The pH dependent swelling behaviour of CS-NPs is due to its higher solubility in acidic media and the creation of pores. This phenomenon leads to diffusion of the drug from the polymer surface and is responsible for the initial burst release from CS–CN-NPs. The swelling of CS-NPs increased with time, but maximum swelling occurred after 4 h; after that slight swelling was observed (Fig. 2).
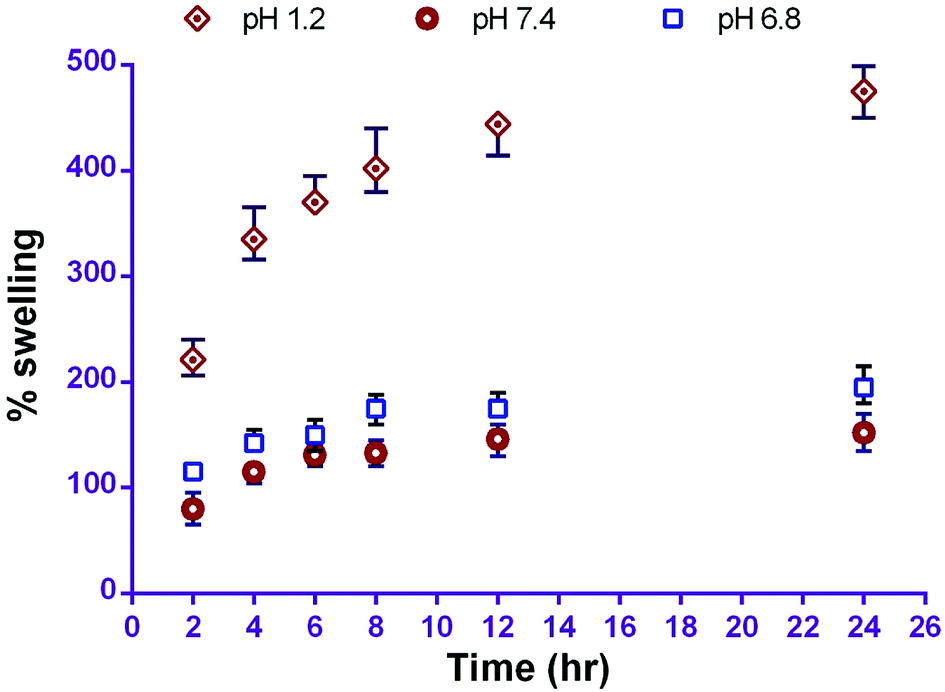 | ||
| Fig. 2 Percentage swelling of CS-NPs at different pH (mean ± SD, n = 3). | ||
Fourier-transform infrared spectrometry (FTIR)
FTIR spectra confirmed the formation of chitosan nanoparticles by efficient cross-linking with sodium tripolyphosphate. Spectra of chitosan powder, curcumin, Eudragit FS 30D, CS-NPs, CS–CN-NPs and FS-CS–CN-NPs are shown in Fig. 3.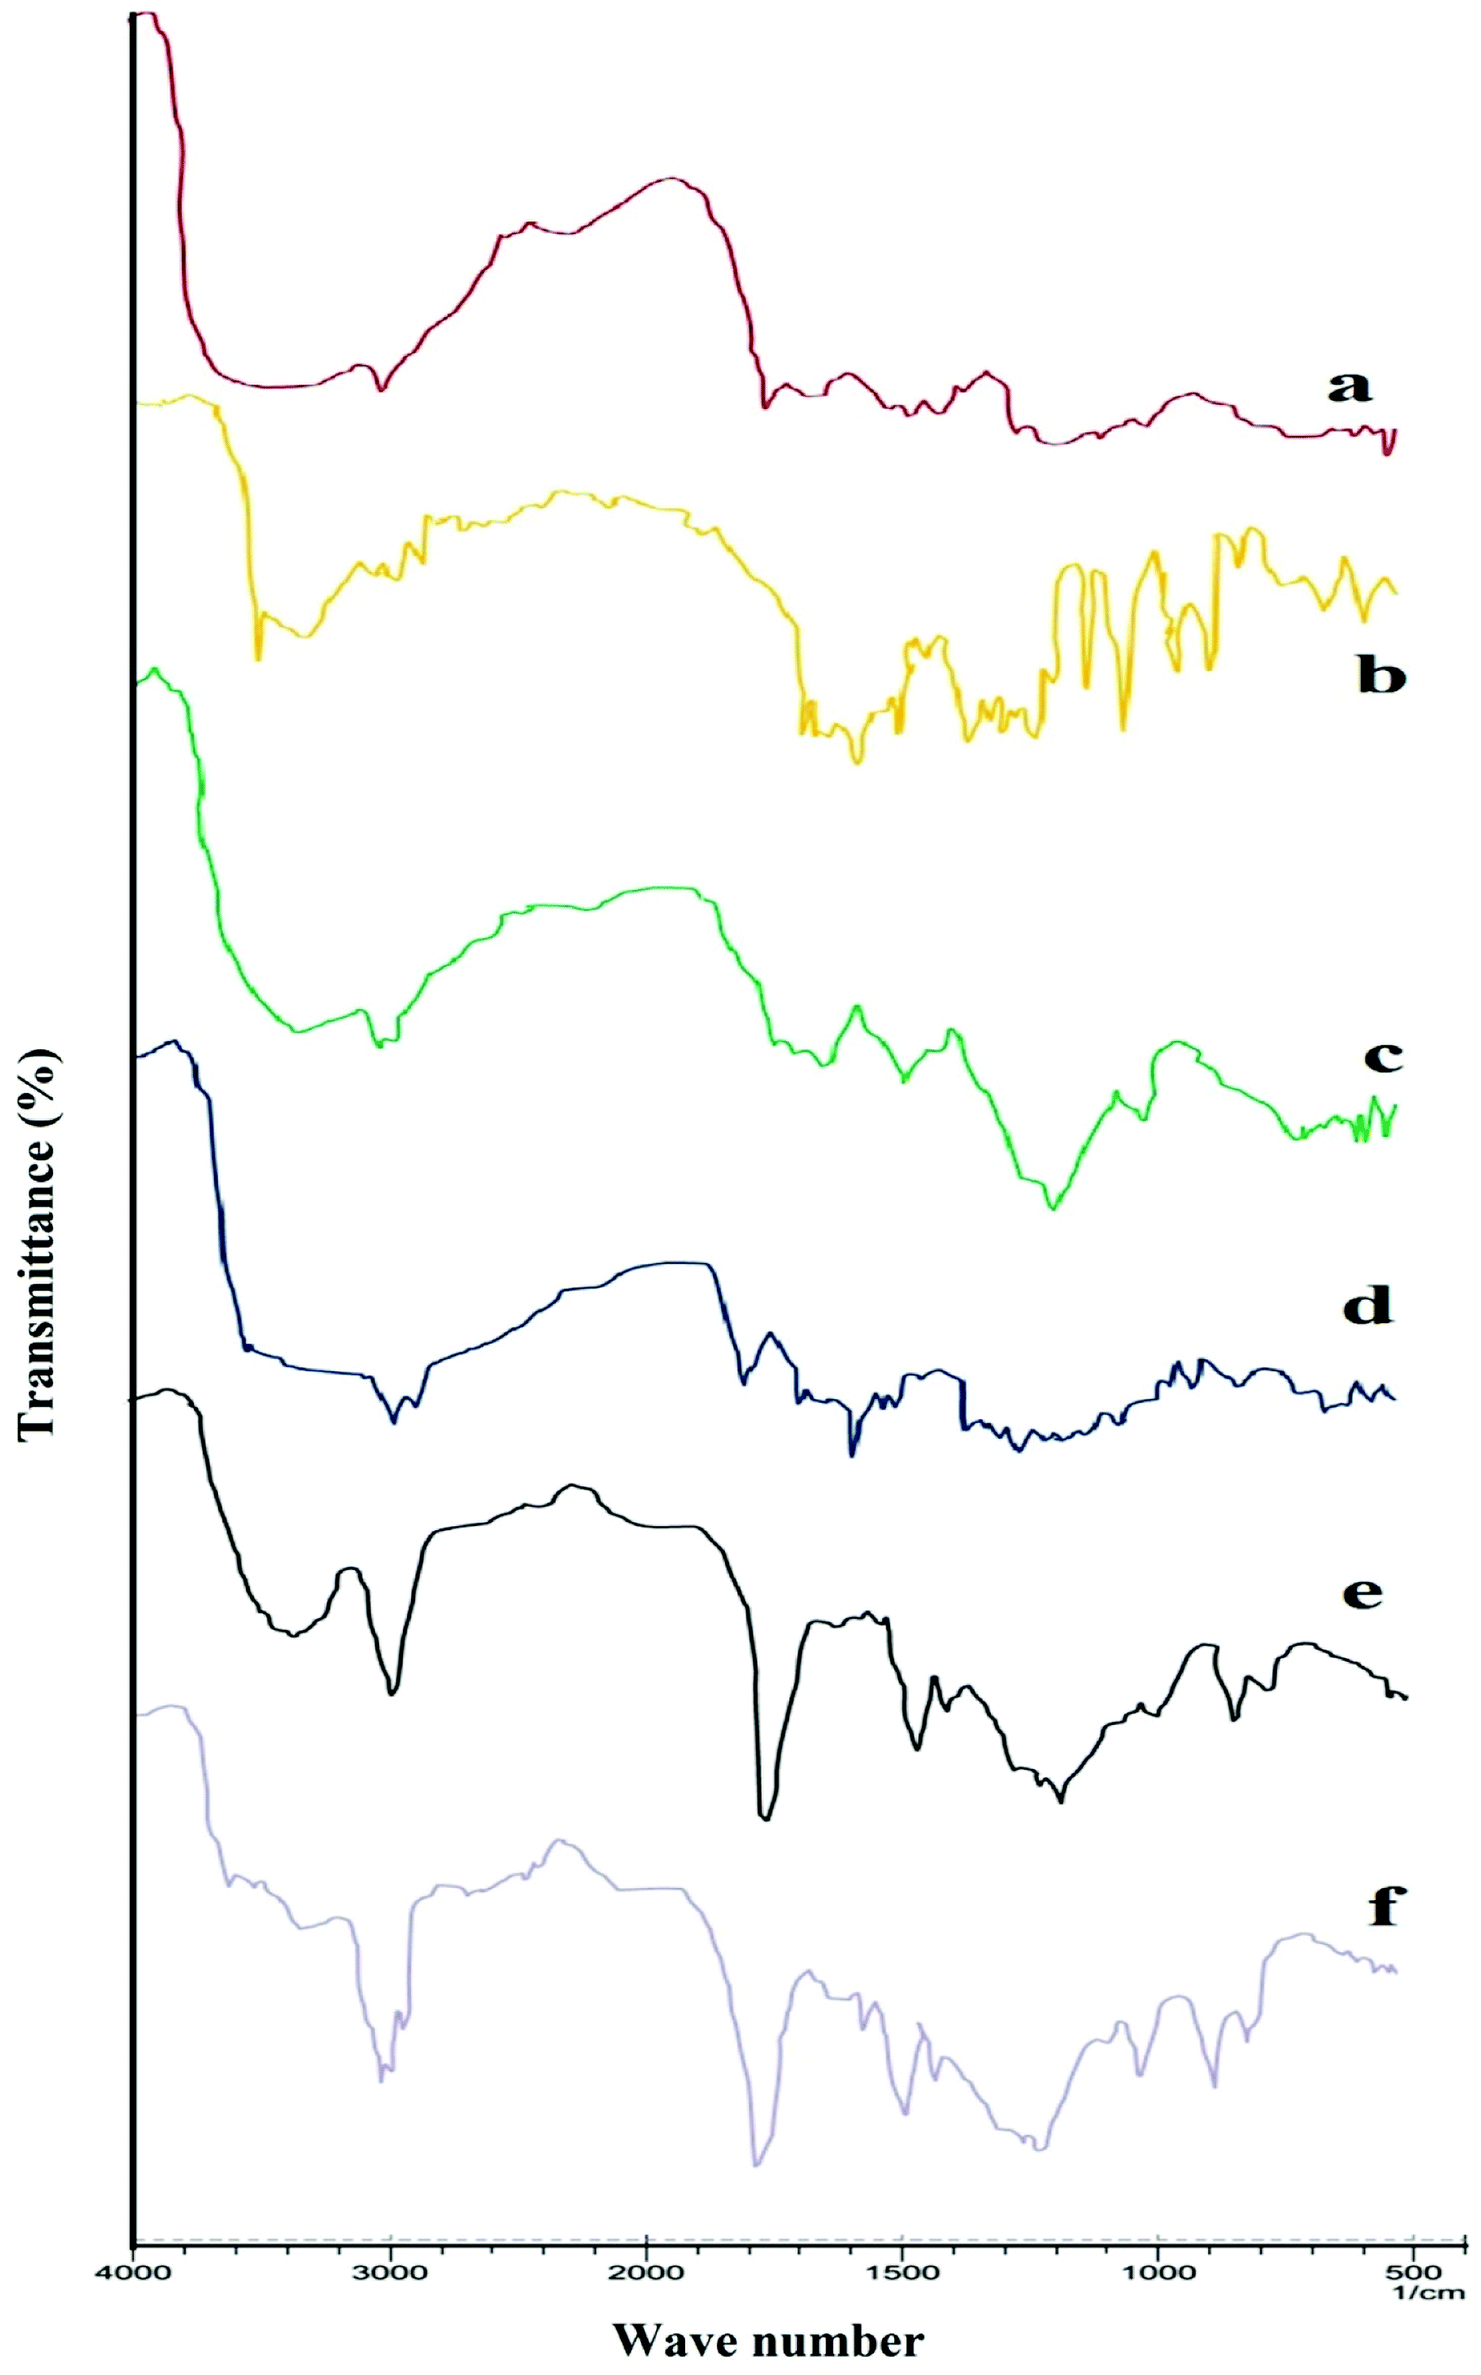 | ||
| Fig. 3 FTIR spectra of (a) chitosan powder, (b) curcumin powder, (c) chitosan nanoparticles, (d) curcumin loaded chitosan nanoparticles, (e) Eudragit FS 30D and (f) Eudragit FS 30D coated chitosan nanoparticles. | ||
Usually, chitosan powder shows distinctive peaks at 3535–3003 (–OH and –NH2 stretching), 2877 (–CH stretching), 1658 (amide I), 1259 (C–O–C stretching) and 1728 cm−1 (carbonyl group) (Fig. 3a). The spectrum of CN (Fig. 3b) shows characteristic absorption bands at 3510 to 3089 (phenolic OH), at 1627 (the C![[double bond, length as m-dash]](https://www.rsc.org/images/entities/char_e001.gif) O stretching peak of conjugate ketone), at 1512 and 1429 (aromatic and aliphatic CC stretching respectively) and the C–O–C stretching peak of ether at 1031. In CH-NPs (Fig. 3), the peak due to amide I (–NH2 bending) shifted from 1658 to 1672 cm−1 and 1546 cm−1 (amide II), implying complex formation via electrostatic interaction between NH3+ groups of chitosan and phosphoric groups of TPP within the nanoparticles. Two ionic interactions exist in the reaction process: an intense electrostatic interaction between the positively charged amino group of chitosan and the negative anion of TPP. The spectrum of FS 30D in Fig. 3d shows a characteristic band due to CO (vibrations of esterified carboxyl groups) at 1735 cm−1, which overlaps the CO band (vibrations of the carboxylic acid groups); further ester vibrations are detected at 1165, 1195, 1230, 1253 cm−1. The wide absorption range of associated –OH groups between 3541 to 3072 is superimposed by –CH vibrations at 2951 cm−1 and further –CH vibrations can be discerned at 1382 and 1438 cm−1. This ionic interactions attest notably to the formation of CS–CN-NPs by cross-linking.
O stretching peak of conjugate ketone), at 1512 and 1429 (aromatic and aliphatic CC stretching respectively) and the C–O–C stretching peak of ether at 1031. In CH-NPs (Fig. 3), the peak due to amide I (–NH2 bending) shifted from 1658 to 1672 cm−1 and 1546 cm−1 (amide II), implying complex formation via electrostatic interaction between NH3+ groups of chitosan and phosphoric groups of TPP within the nanoparticles. Two ionic interactions exist in the reaction process: an intense electrostatic interaction between the positively charged amino group of chitosan and the negative anion of TPP. The spectrum of FS 30D in Fig. 3d shows a characteristic band due to CO (vibrations of esterified carboxyl groups) at 1735 cm−1, which overlaps the CO band (vibrations of the carboxylic acid groups); further ester vibrations are detected at 1165, 1195, 1230, 1253 cm−1. The wide absorption range of associated –OH groups between 3541 to 3072 is superimposed by –CH vibrations at 2951 cm−1 and further –CH vibrations can be discerned at 1382 and 1438 cm−1. This ionic interactions attest notably to the formation of CS–CN-NPs by cross-linking.
Morphology of NPs through SEM and TEM
TEM imaging of CS–CN-NPs and FS-CS–CN-NPs shows a uniform spherical structure with slight variation (Fig. 4A and B). The SEM micrograph (Fig. 5A and B) of CS–CN-NPs shows slightly rough surface, while spherical shape with smooth surface was observed after Eudragit coating of CS–CN-NPs.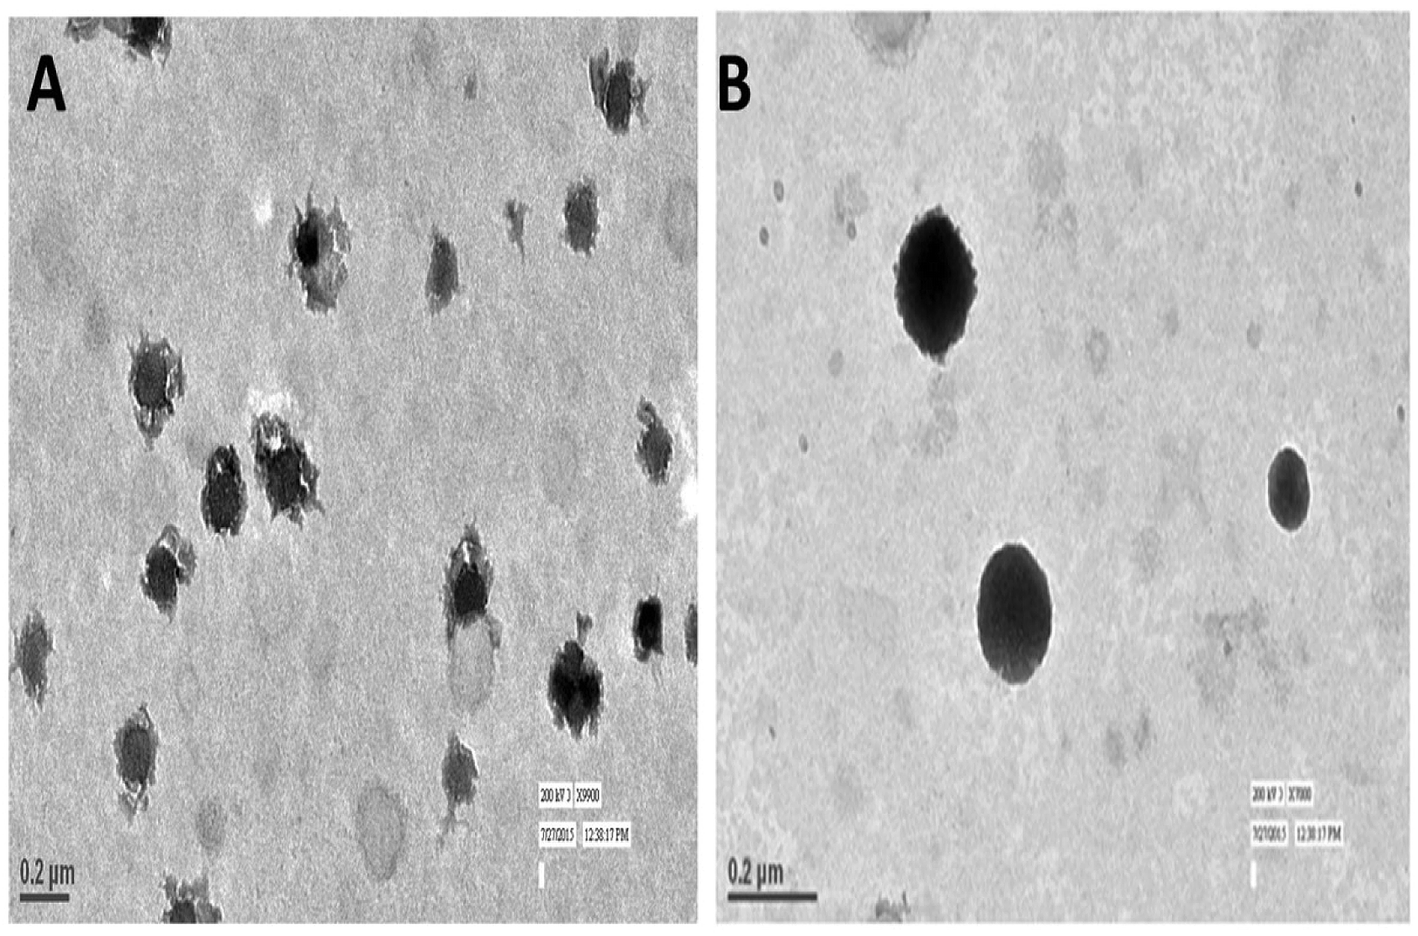 | ||
| Fig. 4 TEM images of (A) CS–CN-NPs and (B) FS-CS–CN-NPs. | ||
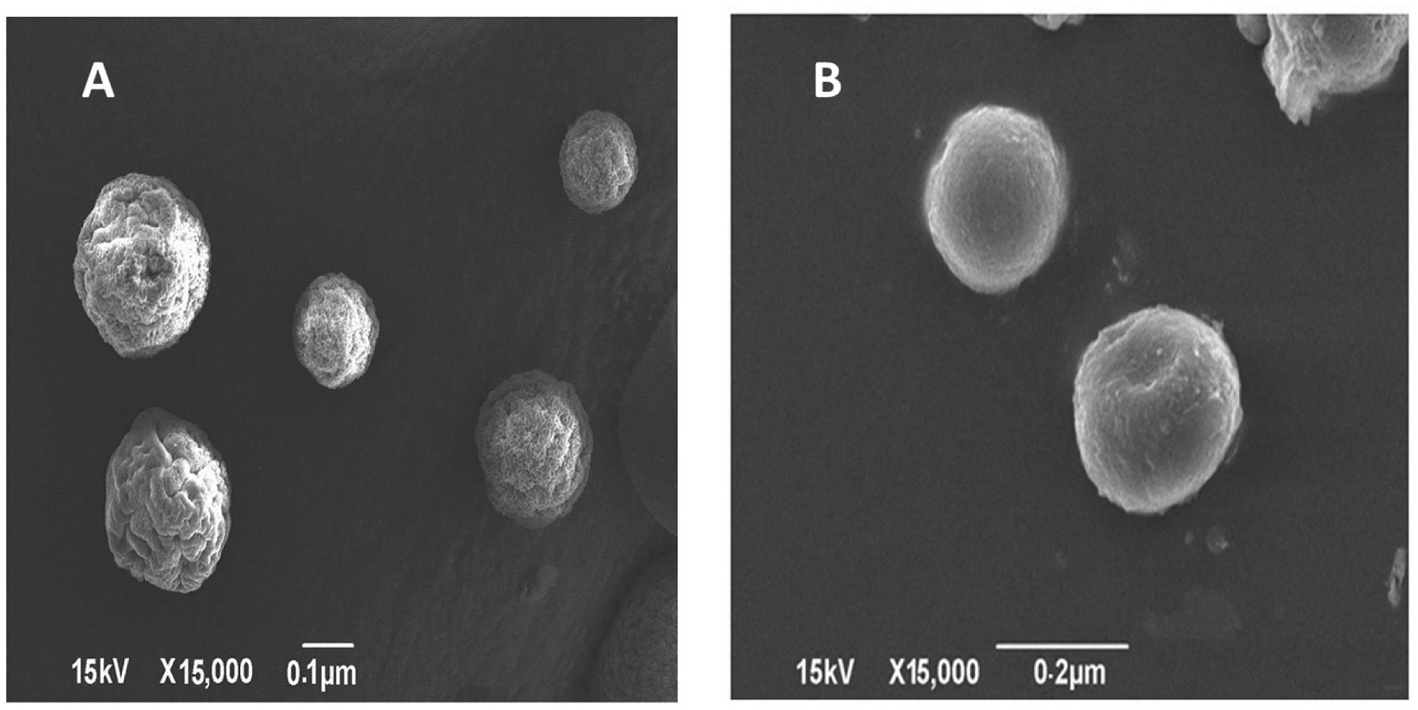 | ||
| Fig. 5 SEM images of (A) CS–CN-NPs and (B) FS-CS–CN-NPs. | ||
In vitro release study
The drug release behaviour from CS–CN-NPs and FS-CS–CN-NPs was observed (Fig. 6) using a dialysis bag method. The release of curcumin from CS–CN-NPs and FS-CS–CN-NPs in different dissolution media was analysed through HPLC as described previously. An initial burst release of CN from uncoated NPs and then comparatively controlled release were observed. The initial burst release of drug from CS–CN-NPs may occur due to the immense swelling of CS, which is responsible for pore formation in the polymer surface and diffusion of the adsorbed drug from the carriers. In simulated gastric fluid (SGF) (at pH 1.2) the CN release from CS–CN-NPs started immediately on contact with the acidic condition and up to 54.3 ± 3% was released in 6 h (at pH 6.8). No release of CN from the Eudragit coated formulation (FS-CS–CN-NPs) at pH 1.2, pH 4.5 and pH 6.8 was observed. This significant difference (p < 0.5) could be due to the coating of the formulation with pH dependent polymer that retards solublization of chitosan. This indicated that, owing to lack of drug release within the upper GIT, the developed carriers were more suitable than dextran sulphate chitosan nanoparticles and surface modified gelatin nanoparticles.47,48 The reason behind this could be the presence of the carboxyl group of Eudragit FS30D which ionizes in neutral and alkaline media. At alkaline pH, the integrity of the coating is disturbed, and CN release was observed in our experiments.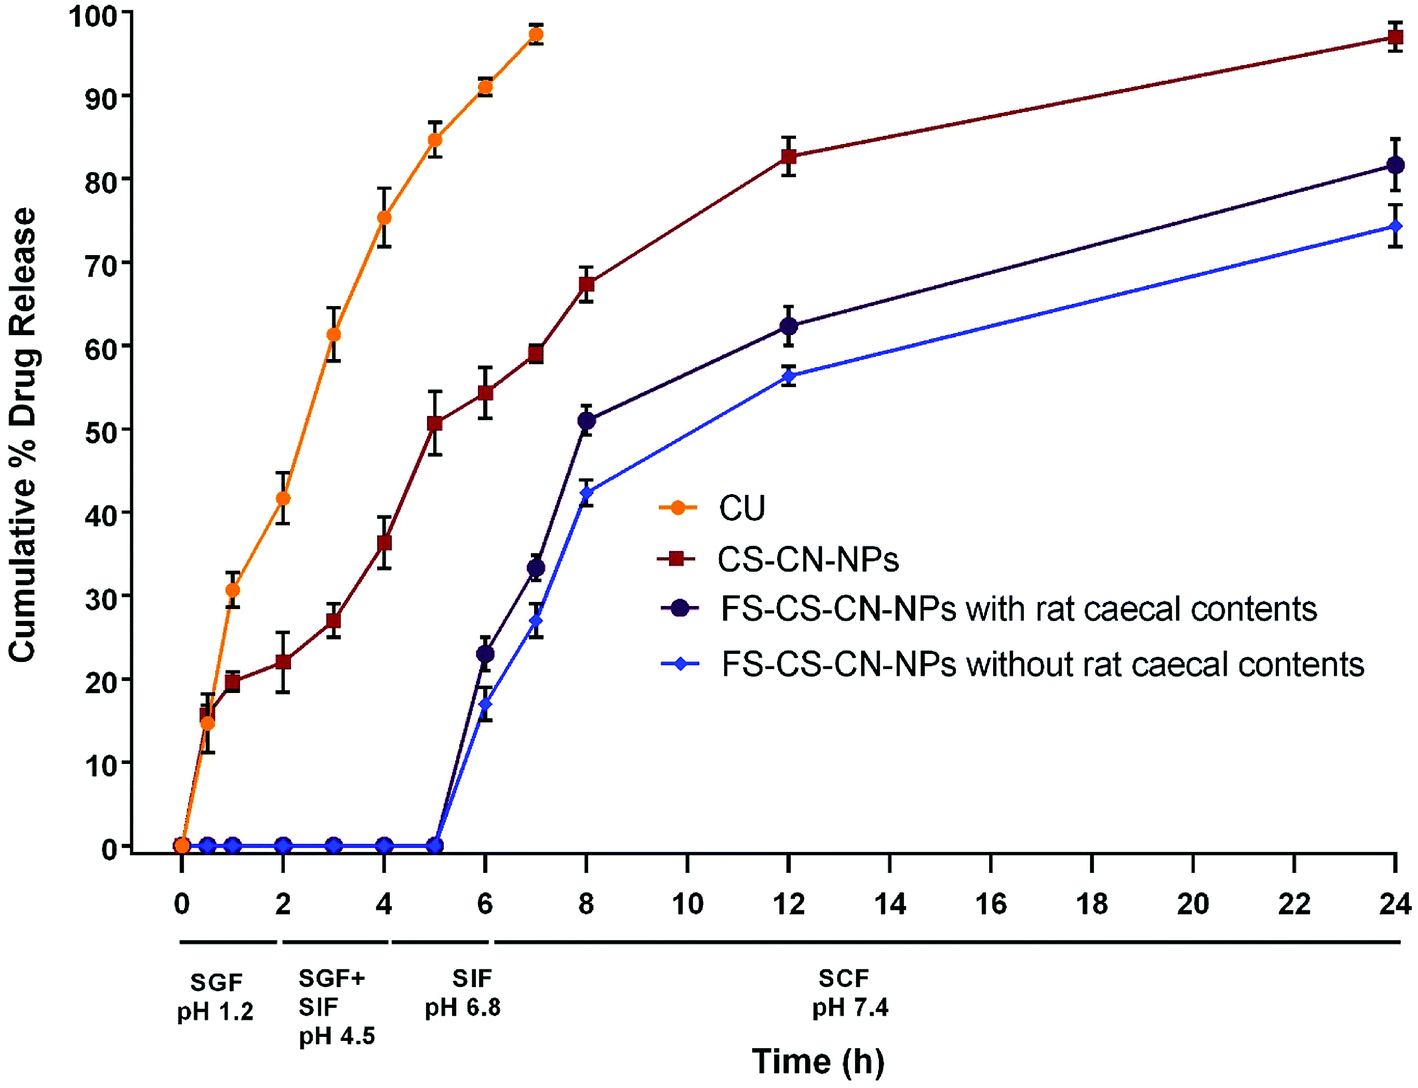 | ||
| Fig. 6 Cumulative percentage release profile of curcumin (mean ± SD, n = 3). | ||
Further experiments revealed that up to 97 ± 1.7% of CN was released from CS–CN-NPs in simulated colonic fluid (SCF) pH 7.4 within 24 h, but the release of CN from FS-CS-CN-NPs started from 6 h (23 ± 2%) and proceeded continuously in a controlled manner. The cumulative release of drug during 6–8 h from coated nanoparticles was 25.3 ± 1.8% in SCF and 28 ± 2.1% in SCF with rat caecal contents, while uncoated nanoparticles released only 13 ± 2.5% drug in the presence of SCF at pH 7.4. Such behaviour indicated that more CN would be available in the colon from FS-CS–CN-NPs than from CS–CN-NPs.
Various studies reported CN release from modified chitosan NPs at pH 7.4 for up to 3–4 days in phosphate buffered saline without any gastric content. Such a system may be very attractive for parenteral delivery,49,50 but our goal is not only to avoid drug release in the upper GIT but also to achieve directed release of the therapeutic moiety in the colon by enzymatic degradation. Therefore, the in vitro release of FS-CS–CN-NPs was also determined in pH 7.4 SCF containing 5% w/v rat caecal contents. With rat caecal contents, approximately 84.7 ± 3% of the drug was released from FS-CS–CN-NPs in the colon after protecting against release in the upper GIT, and 71.3 ± 2% was released in the absence of rat caecal contents. Such sustained release behaviour in the colon could be more beneficial for maintaining therapeutic effects than blended NPs of chitosan.51 The rate of drug release from Eudragit coated CS–CN-NPs was higher in SCF containing rat caecal contents than without rat caecal content in the medium; this could be due to the presence of the enzyme beta-D-glucosaminidase, which acts on the β-(1 → 4) linkage of chitosan.52
Release kinetics
The release data of CN from the developed formulations were fitted into various mathematical models as shown in Table 4. The CN release profile from NPs (CS–CN-NPs and FS-CS–CN-NPs) indicated that the Higuchi model is best suited for the release kinetics of the drug from both coated and uncoated formulations. The release exponent values for the sustained release of CN from CS–CN-NPs and FS-CS–CN-NPs are 0.519 and 1.098 respectively, which lie within the limits of the power law. The release exponent is a clear indication that anomalous diffusion (non-Fickian model) could be the principal release mechanism for CN from CS–CN-NPs, which is due to the combined effect of diffusion (due to swelling) and erosion for drug release, and super case II diffusion kinetics indicating swelling and relaxation of the polymer.53| Formulation code | Correlation coefficient r2 value | ||||
|---|---|---|---|---|---|
| Zero order | First order | Higuchi model | Korsmeyer–Peppas model | Release exponent | |
| CS–CN-NPs | 0.821 | 0.991 | 0.992 | 0.976 | 0.519 |
| FS-CS–CN-NPs | 0.822 | 0.958 | 0.987 | 0.685 | 1.098 |
Mucoadhesive study
Bioadhesive CS–CN-NPs were fabricated and evaluated for mucoadhesive potential to confirm their higher local concentration by increasing retention time of curcumin at the inflamed region. As already reported, CS could interact with mucus glycoproteins by forming physical masses followed by hydrogen bonding with sugar residues on the oligosaccharides chains, and subsequently formation of a strengthened mucus gel complex, which permits the mucoadhesive materials to adhere for a prolonged period.54 The mucoadhesive properties of CS are also due to the electrostatic attraction of a negatively charged sialic acid group of mucin on intestinal epithelia and positive charge of the amino group present in CS. These characteristics of CS offer an extended contact time of the mucus layer surface with the polysaccharide based system to increase the localization and absorption in the targeted region to improve and increase the bioavailability of the drug molecules.In this study, the mucoadhesive properties of CS-NPs and CS–CN-NPs were evaluated by measuring the amount of porcine stomach mucin (PSM) bound on NPs. In Fig. 7 the PSM (% weight) bound to CS-NPs shows that the NPs without CN had the slightly higher mucoadhesion. There is no significant difference between the two (p-value > 0.05) indicated by paired t-test. In the case of CS–CN-NPs, the amount of CS available for interacting with PSM decreases, leading to the lower mucoadhesive strength of NPs. Another factor which may contribute to the reduction of mucoadhesive strength of drug loaded NPs is an increase in NP size, which would decrease absorption of PSM on the surface of NPs (as the increase in size reduces the specific surface area of the NPs), leading to a decrease of the mucoadhesive strength of NPs. These results also correlate with previously reported findings.55,56 The mucoadhesion strength of NPs progressively increased with time up to 90 min, after which equilibrium for PSM interaction was reached.
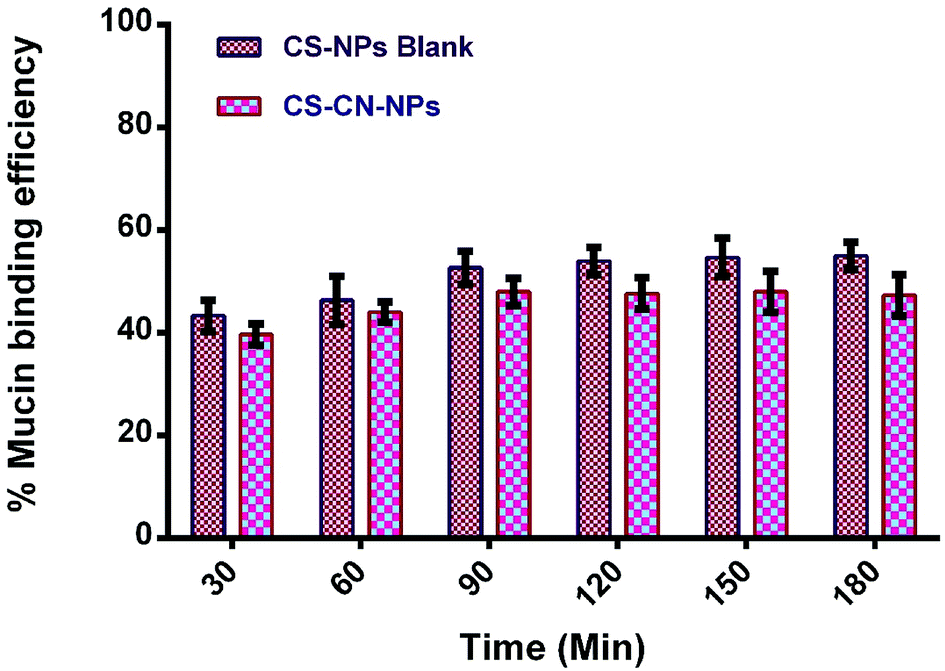 | ||
| Fig. 7 Mucoadhesive study of (a) CS-NPs and (b) CS–CN-NPs (mean ± SD, n = 3). | ||
In vivo study
All animal procedures were performed in accordance with the guidelines of the Committee for the Purpose of Control and Supervision of Experiments on Animals (CPCSEA), Government of India and approved by the Institutional Animal Ethical Committee of Guru Ghasidas University Bilaspur (994/GO/Ere/S/06/CPCSEA).Gamma-scintigraphic evaluation
The radiolabelling efficacy was determined by instant thin-layer chromatography (ITLC) using acetone as the mobile phase. The amount of stannous chloride (reducing agent) plays a very significant role in determining the extent of labelling. The stability of radiolabelled NPs was evaluated in normal saline and plasma. Fig. 8 shows the radiolabelled formulation was stable over 24 h and suitable for biodistribution and scintigraphy imaging. The delivery of NPs to different gastrointestinal organs was confirmed by the gamma-scintigraphy. Fig. 9 indicates that the FS-CS-NPs were localized in the intestinal region after 3 h, which indicates the passage of NPs through the stomach to the intestine. After 8 h, ‘hot-spots’ were detected in the large intestinal area. This study revealed good colon-specific targeting by the developed Eudragit coated nanoparticle formulation.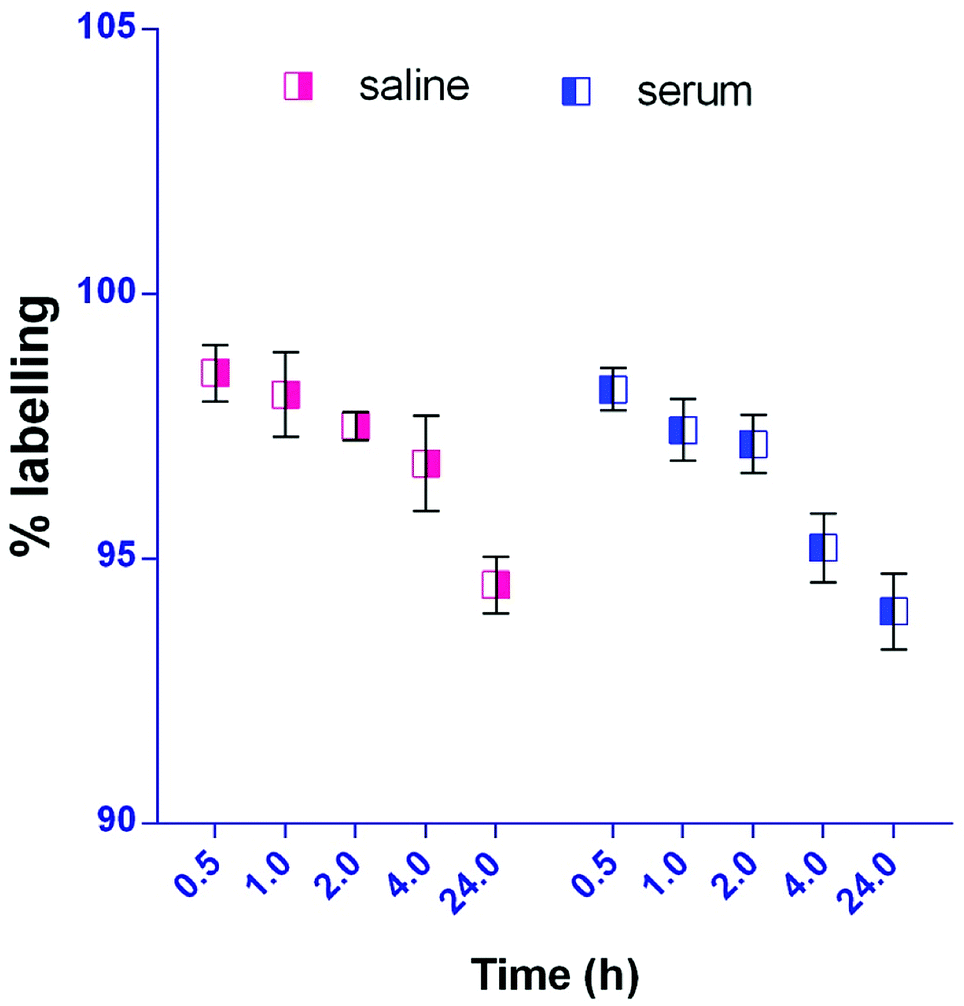 | ||
| Fig. 8 In-vitro stability study of radiolabelled NPs in saline and serum (mean ± SD, n = 3). | ||
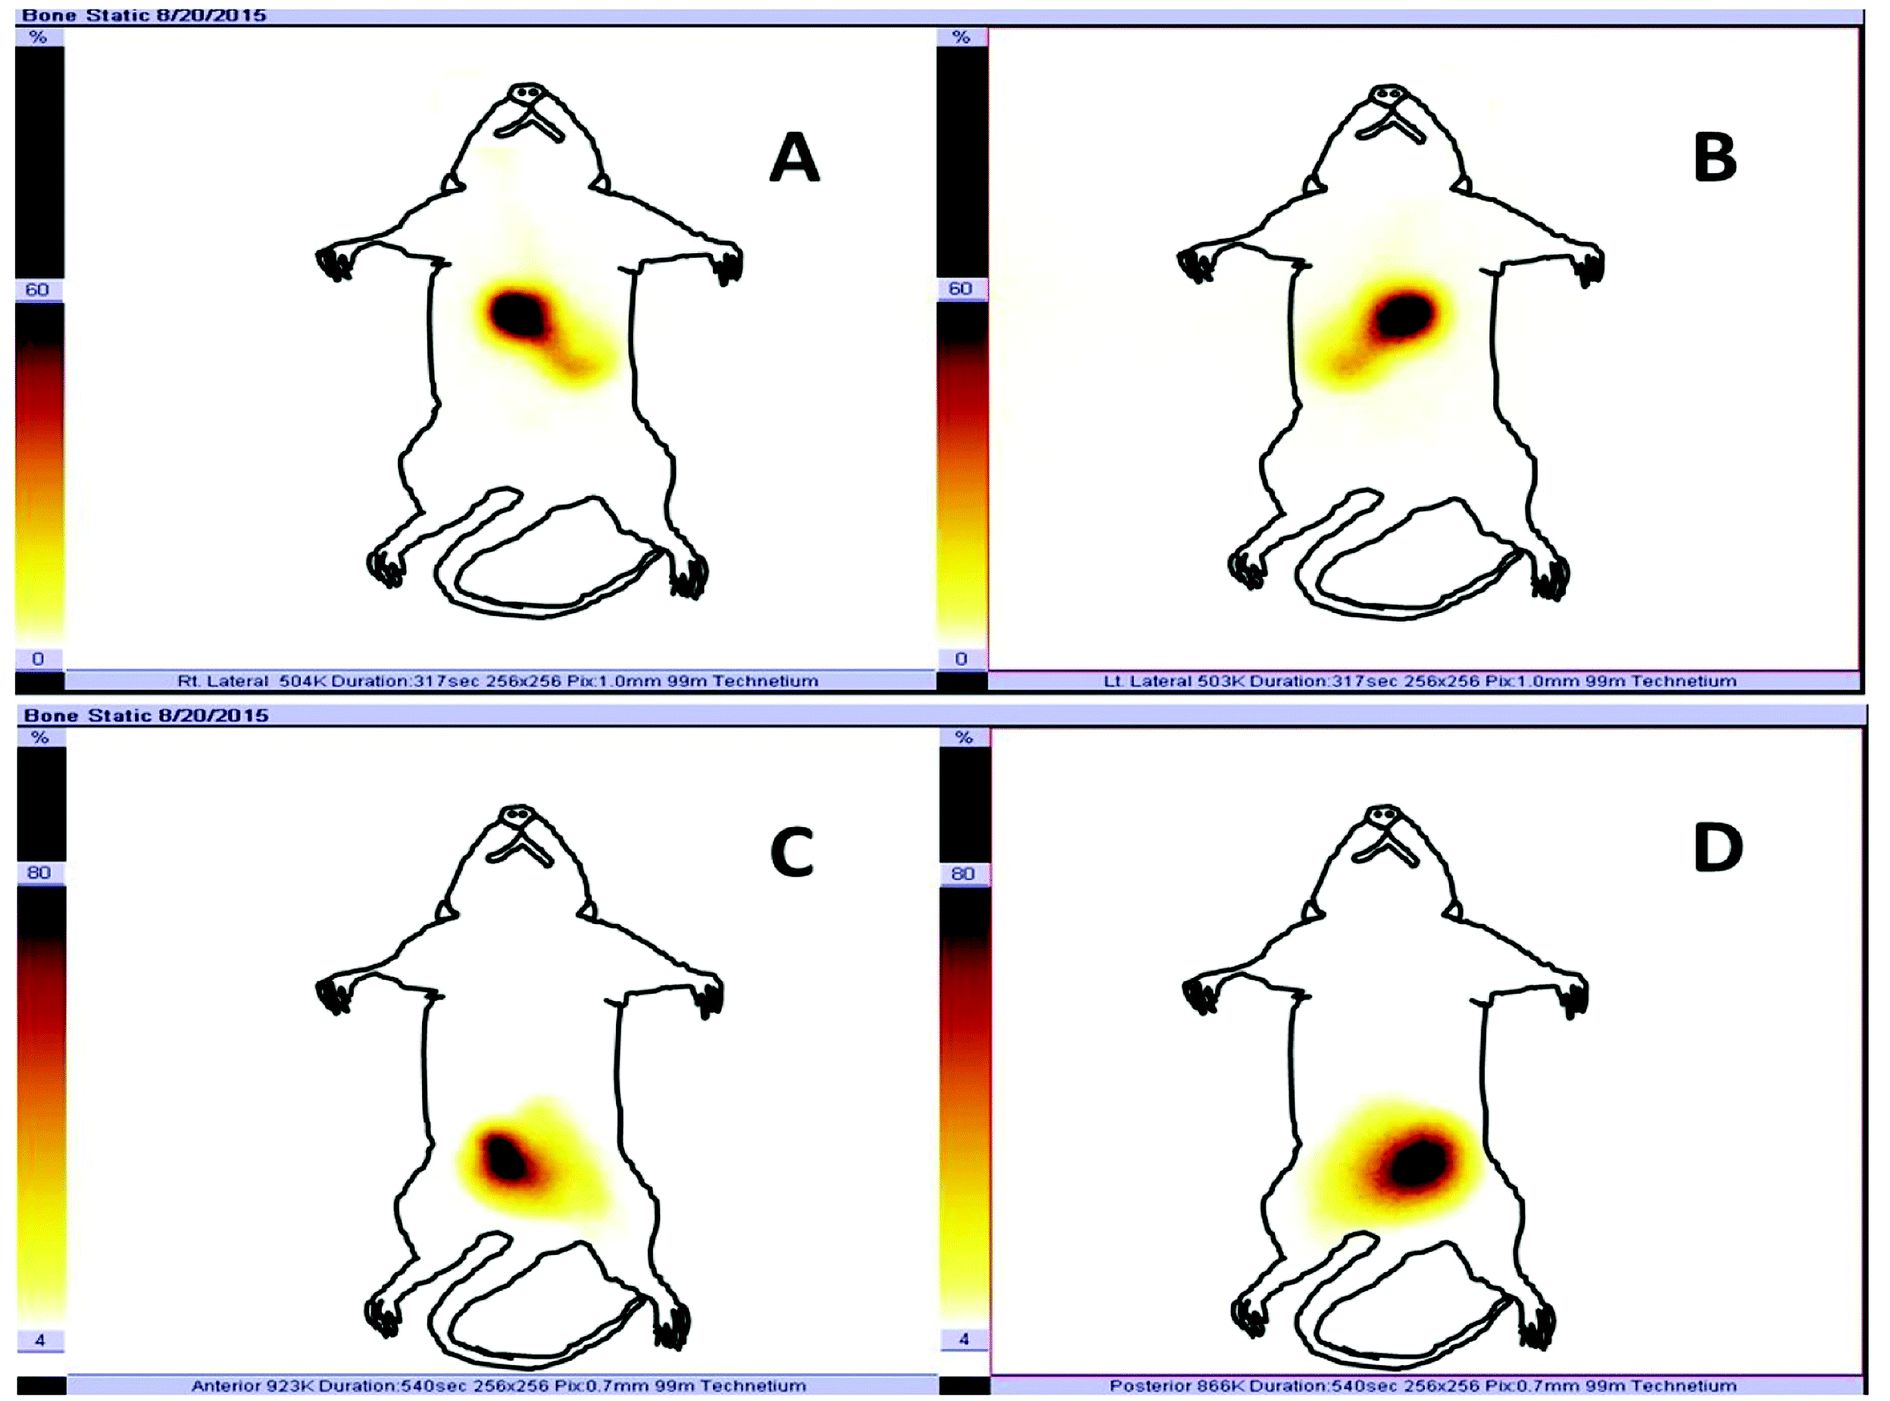 | ||
| Fig. 9 In vivo gamma-scintigraphic images acquired after oral administration of radiolabelled formulation: (A) and (B) depict the anterior and posterior images, respectively, 3 h after administration of radiolabelled carrier, while (C) and (D) show anterior and posterior images at 8 h. For clearness, a sketch of the rat is drawn over the images. | ||
The organ distribution of labelled NPs was evaluated in different organs and tissues (heart, liver, lungs, kidney, spleen, stomach, intestine and colon), and fluids (blood and urine) and is depicted in Fig. 10. The scintigraphic scan represents the localization of the radioactivity in the organs after 24 h. The maximum concentration was found in the colon, followed by small-intestine, and only traces were found in the stomach; showing that the highest retention time of NPs was in the colon for local effect.
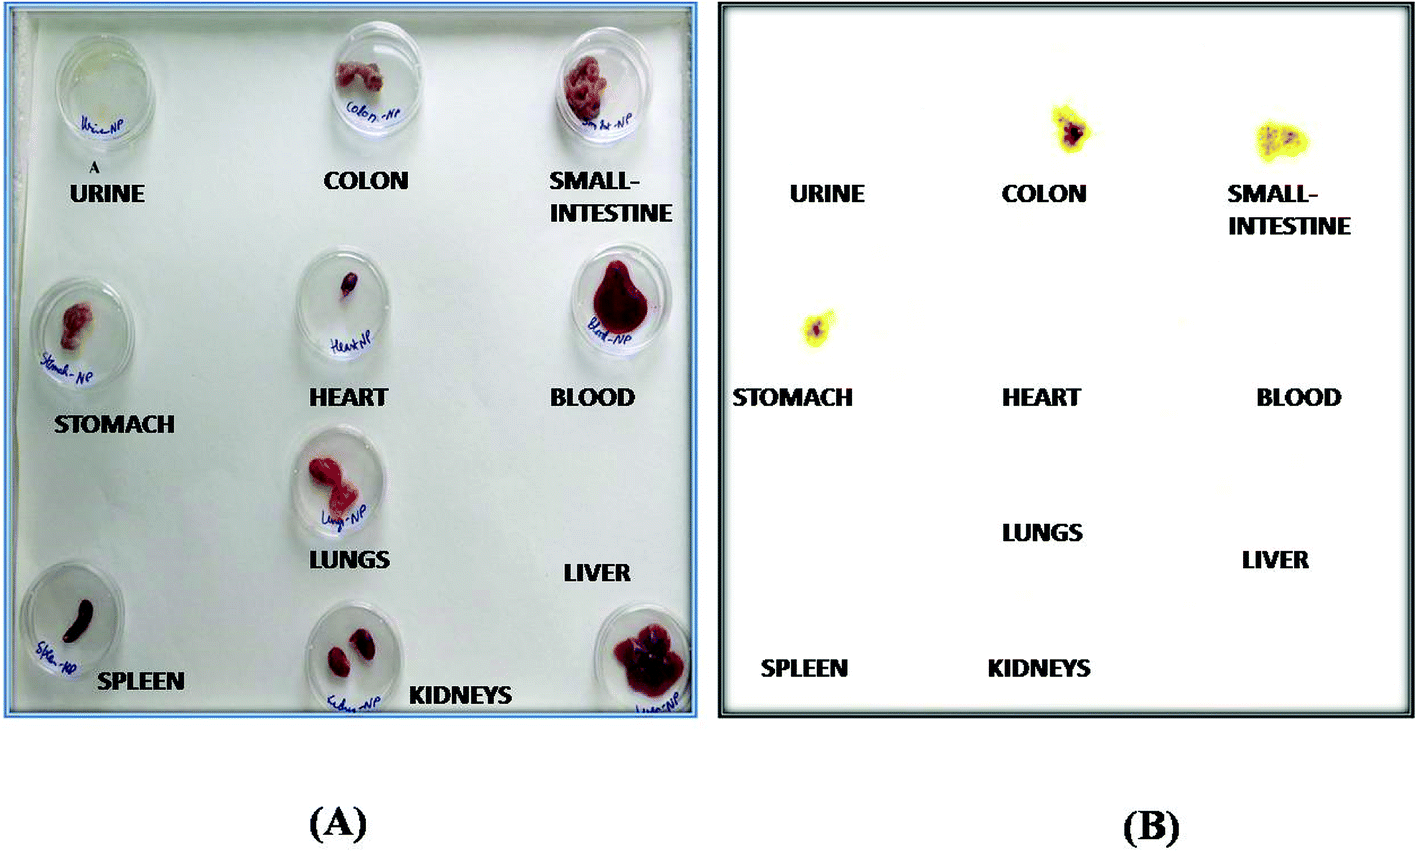 | ||
| Fig. 10 Biodistribution study: (A) normal representation, and (B) gamma-scintigraphic image of different isolated organs 24 h post administration of the radiolabelled formulation in rats. | ||
Materials and methods
Materials
Chitosan (low molecular weight, deacetylation ≥95%, viscosity 20–300 cP) and sodium tripolyphosphate (TPP) were purchased from Sigma-Aldrich. Curcumin was received as a gift from Krishna Manufacturing (India). Syringe filter, dialysis bag (cut-off molecular weight 12000 Da), HPLC grade acetonitrile and methanol were purchased from Himedia (Mumbai, India). Eudragit FS 30D was a generous gift of Evonik India Pvt. Ltd, Mumbai. Polyvinyl alcohol (PVA) was purchased from Fisher Scientific India. Milli-Q water used throughout the study was prepared using a Milli-Q 185 purification system (Bedford, Massachusetts). All other reagents and chemicals used were of analytical grade.
Purification of chitosan
Solid chitosan powder (1 g) was mixed with 10 ml 1 M sodium hydroxide (NaOH) solution. This was heated with continuous stirring for 2 h at 70 °C. The resulting mixture was filtered, and the solid recovered was washed thoroughly with water and dried at 40 °C for 24 h. The dried flakes were dissolved in 0.1 M acetic acid solution with gentle stirring and insoluble residue removed by filtration. To precipitate chitosan from solution, the pH value of the filtrate was adjusted to pH 8.0 using NaOH. The precipitated chitosan was washed extensively with purified water and dried under vacuum at 25 ± 5 °C for 24 h.57Preparation of chitosan nanoparticles (CS-NPs)
CS-NPs were prepared according to the ionotropic gelation method described by Calvo et al. (1997) with slight modifications.58 Briefly, CS was dissolved in 1% aqueous acetic acid solution (1 mg ml−1) by magnetic stirring until a transparent solution was obtained. Sodium hydroxide was used to adjust the pH of the solution up to 4.4 to 4.5 and the solution was filtered to remove insoluble particles. TPP was dissolved in double distilled water at a concentration of 1 mg ml−1. Curcumin solution (3 ml, 10 mg ml−1 in ethanol) was added to the TPP solution. Finally, the drug-containing TPP solution was added dropwise to the chitosan solution using a syringe, at the rate of 1 ml min−1 under constant stirring at room temperature for 2 h, and the mixture was sonicated. The dispersion formed was centrifuged at 14000 rpm at 4 °C for 45 min. The supernatant was taken for drug content study, and the sediment was dialysed with distilled water to remove free drug; the dialysed formulation was lyophilized and used for further characterization.
Eudragit FS 30D coating on CS-NPs
The prepared NPs were coated with Eudragit FS 30D by means of an oil-in-oil emulsification solvent evaporation technique using a core:coat ratio 1:2. One millilitre of the dispersion of Eudragit FS 30D was dissolved in a mixture of dichloromethane:ethanol:isopropyl alcohol (6:5:4). CS–CN-NPs were dispersed in Eudragit FS 30D solution with continuous stirring for 15 min. The obtained dispersion was transferred dropwise into 50 ml light liquid paraffin containing 1% w/v Span 80 with continuous magnetic stirring at 2000 rpm at room temperature for 3 h, after which the organic phase was removed under vacuum. The FS-CS–CN-NPs were collected by centrifugation at 14000 rpm for 30 min, and the sediment was washed extensively with petroleum ether and n-hexane to remove liquid paraffin, then lyophilized. FS-CS-NPs without CN were also prepared by the same method.59
Particle size, PDI and zeta potential determination
The average particle size and polydispersity index of CS-NPs were determined in triplicate by photon correlation spectroscopy using a Malvern Zetasizer NanoZS (Malvern 3000HS, France). The zeta potential value of CS-NPs was obtained after adjusting the conductivity to 50 μS cm−1 with 0.9% sodium chloride at 25 °C. Mean values were calculated from analysis of three batches.60Morphological evaluation of nanoparticles
Fourier-transform infrared spectroscopy (FTIR)
Various types of bonds present in the samples were detected through FTIR (IR Affinity 1 Schimadzu). FTIR spectra of chitosan, curcumin and CS-NPs (blank and loaded with curcumin) were obtained by mixing 1 mg powder samples with 200 mg of purified and desiccated KBr to obtain pellets and scanned from 400 to 4000 cm−1 at a resolution of 4 cm−1. The background measurement was performed on a pellet holder with a pellet of KBr without a sample.Percentage entrapment efficiency (%EE)
To determine encapsulation efficiency of the nanoparticles, an indirect method was adopted. CS-NPs and un-entrapped CN were separated by centrifugation at 18000 rpm using a cooled centrifuge (REMI, India) at 4 °C for 10 min. The sediment of NPs was further washed with distilled water by centrifugation at the same rpm for 5 min. The amounts of un-entrapped CN in the first and second supernatants were estimated by means of HPLC (YL 9100, Yunglin, South Korea) with detection at 425 nm. The %EE was calculated as follows.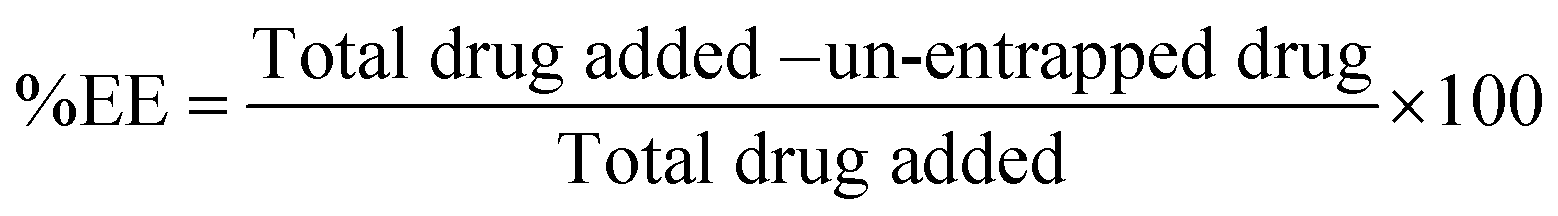
HPLC analysis of curcumin
An HPLC method was developed and validated for estimating CN. HPLC separation was achieved on a C-18, Cosmosil-packed column (5 μm particle size, 4.6 mm (ID) × 250 mm, Nacalai). Column effluents were monitored at 425 nm. The mobile phase was a mixture of methanol:acetonitrile:phosphate buffer (42.5:42.5:15. v/v/v). The pH of the mobile phase was adjusted to 5 with orthophosphoric acid. The solution was filtered and degassed via a bath sonicator. Chromatography was performed at 25 °C, at a flow rate of 1.0 ml min−1. The calibration curve of CN was linear in the range of 5–50 μg ml−1. The retention time of CN was found to be 4.5 min.
In vitro swelling
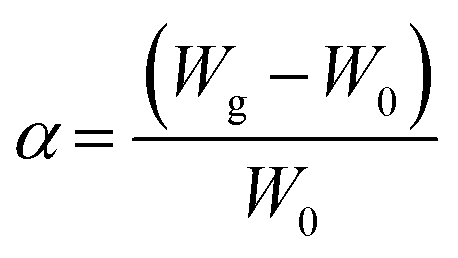
The swelling study was carried out according to the method reported previously62 with some modifications, by placing 100 mg of CS, CS-NPs, CS–CN-NPs and FS-CS–CN-NPs in pre-weighed centrifuge tubes containing phosphate buffer (pH 1.2, 6.8 and 7.4). Then NPs were allowed to swell for a period of 0, 2, 4, 6, 8, 12 and 24 h at room temperature. Samples were centrifuged at 10000 rpm for 45 min at 27 °C. The changes in wet weight were measured after removal of the supernatant, when the weight of the tubes was measured again. The degree of swelling (α) was determined using the following equation:where W0 is the initial weight of CS-NPs and FS-CS-NPs, and Wg is the weight of CS-NPs and FS-CS-NPs at equilibrium swelling in the medium.
Mucoadhesive ex vivo test
The in vitro interaction of the developed NPs with mucin was assessed according to a previously reported method, with slight modification.63 One millilitre NPs suspension was mixed with the same volume of porcine stomach mucin (PSM) type III (Himedia) suspension (0.04%) in PBS (0.05 M, pH 7.4). After incubation at 37 ± 1 °C for 30, 60, 90, 120 and 180 min, the samples were centrifuged at 18000 rpm for 30 min, and the concentration of PSM in the supernatant was examined by UV spectrometry (UV-1800 spectrophotometer, Shimadzu) at 251 nm. The PSM binding efficiency of NPs was estimated from the following equation:where C0 is the initial concentration of PSM used for incubation and Cs is the concentration of free PSM in the supernatant.
In vitro drug release
An in vitro drug release study of CN, CS–CN-NPs and FS-CS–CN-NPs was performed in simulated gastrointestinal fluids, i.e. (a) in simulated gastric fluid (SGF) at pH 1.2 (0–2 h), (b) in SGF plus simulated intestinal fluid (SIF) at pH 4.5 (2–4 h), (c) in SIF at pH 6.8 (4–6 h) and (d) in simulated colonic fluid (SCF), with or without rat caecal contents, at pH 7.4 (6–24 h). SCF was prepared by a method reported earlier, with slight modifications.64Pre-treated dialysis bags containing CS–CN-NPs and FS-CS–CN-NPs were immersed separately in the above-mentioned dissolution media (100 ml) in sequence for 24 h at 100 rpm with magnetic stirring at 37 ± 0.5 °C. Tween 80 (1% v/v) was added to the dissolution media to facilitate the solubilization of CN released from formulations. Samples (2 ml) were withdrawn at a predetermined time interval (0.5, 1, 2, 3, 4, 5, 6, 8, 12, and 24 h), and replaced with the same volume of respective dissolution medium after each sampling to maintain the sink condition. The samples were centrifuged at 10000 rpm for 15 min, the supernatant was filtered through 0.22 μm membrane filter, and the filtrate was subjected to HPLC analysis after appropriate dilution.
Determination of release kinetics
The use of in vitro drug dissolution to predict in vivo bio-performance can be considered as the rational development of controlled release formulations, since qualitative and quantitative changes in a formulation may alter drug release and in vivo performance. So, we determined release kinetic models which described the overall release of drug from the developed formulation. We used model-dependent methods (zero order, first order, Higuchi, Korsmeyer–Peppas models) to predict drug release mechanism from CS–CN-NPs and FS-CS–CN-NPs, and the best model was selected by means of correlation coefficient.66In vivo study
Statistical analysis
The results are expressed as mean values ± standard deviation (SD). The statistical analysis was done by using Student's t-test and one-way analysis of variance (ANOVA). A probability level of P < 0.05 was considered to be statistically significant.Conclusions
Chitosan nanoparticles prepared by an ionic gelation method were nano-sized and uniformly dispersed. FTIR spectra of the formulations confirmed the cross-linking of CS with TPP. pH stimulated delivery of CN to colon was successfully attained via coating of CS-NPs with Eudragit FS 30D. In vitro drug release studies confirmed controlled release in the colon, which also correlated with gamma-scintigraphy. The morphological analysis showed CS-NPs have a slightly rough surface and FS-CS-NPs having a smooth surface. The release mechanism of the drug has super case II diffusion kinetics, indicating swelling and relaxation of the polymer. The prepared formulation of CN employing pH stimulated delivery provides a potential approach to treat ulcerative colitis, and the system can also be used for targeting other drugs to the colon.Conflicts of interest
There are no conflicts to declare.Acknowledgements
One of the authors, Pooja Mongia, very gratefully acknowledges UGC, New Delhi for providing financial assistance to RGNF-SRF. The authors are also grateful to the electron microscopic division of AIIMS, New Delhi and USIC of Babasaheb Bhimrao Ambedkar University Lucknow for use of their TEM and SEM facilities respectively.References
- T. Bautzova, M. Rabiskova and A. Lamprecht, Drug Dev. Ind. Pharm., 2011, 37, 1100–1109 CrossRef PubMed.
- A. B. Pithadia and S. Jain, Pharmacol. Rep., 2011, 63, 629–642 CrossRef PubMed.
- B. A. G. Hendrickson, R. Gokhale and J. H. Cho, Clin. Microbiol. Rev., 2002, 15, 79–94 CrossRef PubMed.
- K. Conrad, D. Roggenbuck and M. W. Laass, Autoimmun. Rev., 2014, 13, 463–466 CrossRef PubMed.
- A. Kaser, S. Zeissig and R. S. Blumberg, Annu. Rev. Immunol., 2010, 28, 573–621 CrossRef PubMed.
- D. L. Suskind, G. Wahbeh, T. Burpee, M. Cohen, D. Christie and W. Weber, J. Pediatr. Gastroenterol. Nutr., 2013, 56, 277–279 CrossRef PubMed.
- O. H. Nielsen, Scand. J. Gastroenterol., 1982, 17, 389–393 CrossRef PubMed.
- S. I. Grivennikov, Semin. Immunopathol., 2013, 35, 229–244 CrossRef PubMed.
- L. Hartnett and L. J. Egan, Carcinogenesis, 2012, 33, 723–731 CrossRef PubMed.
- A. Beloqui, R. Coco, P. B. Memvanga, B. Ucakar, A. des Rieux and V. Préat, Int. J. Pharm., 2014, 473, 203–212 CrossRef PubMed.
- C. Lahiff and A. C. Moss, Inflamm. Bowel Dis., 2011, 17, E66 CrossRef PubMed.
- M. S. Baliga, N. Joseph, M. V. Venkataranganna, A. Saxena, V. Ponemone and R. Fayad, Food Funct., 2012, 3, 1109–1117 Search PubMed.
- W. B. Song, Y. Y. Wang, F. S. Meng, Q. H. Zhang, J. Y. Zeng, L. P. Xiao, X. P. Yu, D. D. Peng, L. Su, B. Xiao and Z. S. Zhang, PLoS One, 2010, 5, e12969 Search PubMed.
- A. Goel, A. B. Kunnumakkara and B. B. Aggarwal, Biochem. Pharmacol., 2008, 75, 787–809 CrossRef PubMed.
- M. V. Venkataranganna, M. Rafiq, S. Gopumadhavan, G. Peer, U. V. Babu and S. K. Mitra, World J. Gastroenterol., 2007, 13, 1103–1107 CrossRef PubMed.
- S. C. Gupta, S. Patchva and B. B. Aggarwal, AAPS J., 2013, 15, 195–218 CrossRef PubMed.
- N. Adapala and M. M. Chan, Lab. Invest., 2008, 88, 1329–1339 CrossRef PubMed.
- P. Arya and K. Pathak, Int. J. Pharm., 2014, 460, 1–12 CrossRef PubMed.
- G. R. Irving, A. Karmokar, D. P. Berry, K. Brown and W. P. Steward, Best Pract. Res., Clin. Gastroenterol., 2011, 25, 519–534 CrossRef PubMed.
- P. Dulbecco and V. Savarino, World J. Gastroenterol., 2013, 19, 9256–9270 CrossRef PubMed.
- B. Xiao, X. Si, M. Zhang and D. Merlin, Colloids Surf., B, 2015, 135, 379–385 CrossRef PubMed.
- S. Setthacheewakul, S. Mahattanadul, N. Phadoongsombut, W. Pichayakorn and R. Wiwattanapatapee, Eur. J. Pharm. Biopharm., 2010, 76, 475–485 CrossRef PubMed.
- Z. Song, R. Feng, M. Sun, C. Guo, Y. Gao, L. Li and G. Zhai, J. Colloid Interface Sci., 2011, 354, 116–123 CrossRef PubMed.
- P. Jourghanian, S. Ghaffari, M. Ardjmand, S. Haghighat and M. Mohammadnejad, Adv. Pharm. Bull., 2016, 6, 17–21 CrossRef PubMed.
- H. Ji, J. Tang, M. Li, J. Ren, N. Zheng and L. Wu, Drug Delivery, 2016, 23, 459–470 CrossRef PubMed.
- N. Madusanka, K. M. de Silva and G. Amaratunga, Carbohydr. Polym., 2015, 134, 695–699 CrossRef PubMed.
- A. Lamprecht, N. Ubrich, H. Yamamoto, U. Schafer, H. Takeuchi, P. Maincent, Y. Kawashima and C. M. Lehr, J. Pharmacol. Exp. Ther., 2001, 299, 775–781 Search PubMed.
- P. K. Mongia, R. Khatik, R. Raj, N. Jain and A. K. Pathak, J. Biomater. Tissue Eng., 2014, 4, 738–743 CrossRef.
- V. R. Sinha, A. K. Singla, S. Wadhawan, R. Kaushik, R. Kumria, K. Bansal and S. Dhawan, Int. J. Pharm., 2004, 274, 1–33 CrossRef PubMed.
- J. W. Lee, J. H. Park and J. R. Robinson, Int. J. Pharm., 2010, 89, 850–866 Search PubMed.
- S. A. Pathan, Z. Iqbal, J. K. Sahani, S. Talegaonkar, R. K. Khar and F. J. Ahmad, Recent Pat. Drug Delivery Formulation, 2008, 2, 177–188 CrossRef.
- G. P. Andrews, T. P. Laverty and D. S. Jones, Eur. J. Pharm. Biopharm., 2009, 71, 505–518 CrossRef PubMed.
- D. El-Nashar, N. Saleh, A. Soliman and F. Helaly, Study the release kinetics of curcumin released from PVA/curcumin composites and its evaluation towards hepatocarcinoma, J. Appl. Pharm. Sci., 2016, 6, 067–072 CrossRef.
- P. Verderio, P. Bonetti, M. Colombo, L. Pandolfi and D. Prosperi, Biomacromolecules, 2013, 14, 672–682 CrossRef PubMed.
- M. M. Yallapu, M. Jaggi and S. C. Chauhan, Drug discovery today, 2012, 17, 71–80 CrossRef PubMed.
- C. Gao, F. Tang, G. Gong, J. Zhang, M. P. M. Hoi, S. M. Y. Lee and R. Wang, Nanoscale, 2017, 9, 12533–12542 RSC.
- L. H. Chuah, N. Billa, C. J. Roberts, J. C. Burley and S. Manickam, Pharm. Dev. Technol., 2013, 18, 591–599 CrossRef PubMed.
- F. Akhtar, M. M. Rizvi and S. K. Kar, Biotechnol. Adv., 2012, 30, 310–320 CrossRef PubMed.
- L. H. Chuah, C. J. Roberts, N. Billa, S. Abdullah and R. Rosli, Colloids Surf., B, 2014, 116, 228–236 CrossRef PubMed.
- K. P. Seremeta, D. A. Chiappetta and A. Sosnik, Colloids Surf., B, 2013, 102, 441–449 CrossRef PubMed.
- A. Makhlof, Y. Tozuka and H. Takeuchi, Eur. J. Pharm. Biopharm., 2009, 72, 1–8 CrossRef PubMed.
- T. F. Vandamme, A. Lenourry, C. Charrueau and J. C. Chaumeil, Carbohydr. Polym., 2002, 48, 219–231 CrossRef.
- L. Zimova, D. Vetchy, J. Muselik and J. Stembirek, Drug Delivery, 2012, 19, 81–89 CrossRef PubMed.
- V. K. Gupta, T. E. Beckert and J. C. Price, Int. J. Pharm., 2001, 213, 83–91 CrossRef PubMed.
- R. A. Taylor and M. C. Leonard, Altern Med Rev, 2011, 16, 152–156 Search PubMed.
- M. Prabaharan and J. F. Mano, Drug Delivery, 2004, 12, 41–57 CrossRef.
- A. Anitha, V. G. Deepagan, V. V. Divya Rani, D. Menon, S. V. Nair and R. Jayakumar, Carbohydr. Polym., 2011, 84, 1158–1164 CrossRef.
- J. S. Choi, Int. J. Biol. Macromol., 2016, 92, 850–859 CrossRef PubMed.
- R. K. Das, N. Kasoju and U. Bora, Nanomedicine: Nanotechnology, Biology and Medicine, 2010, 6, 153–160 CrossRef PubMed.
- A. Anitha, N. Deepa, K. P. Chennazhi, V. K. Lakshmanan and R. Jayakumar, Biochim. Biophys. Acta, 2014, 1840, 2730–2743 CrossRef PubMed.
- P. Udompornmongkol and B. H. Chiang, J. Biomater. Appl., 2015, 30, 537–546 CrossRef PubMed.
- S. M. Lim, D. K. Song, S. H. Oh, D. S. Lee-Yoon, E. H. Bae and J. H. Lee, J. Biomater. Sci., Polym. Ed., 2008, 19, 453–466 CrossRef PubMed.
- M. Sampath, R. Lakra, P. Korrapati and B. Sengottuvelan, Colloids Surf., B, 2014, 117, 128–134 CrossRef PubMed.
- S. A. Mortazavi, Int. J. Pharm., 1995, 124, 173–182 CrossRef.
- I. Aguilar-Rosas, S. Alcala-Alcala, V. Llera-Rojas and A. Ganem-Rondero, Drug Dev. Ind. Pharm., 2015, 41, 1632–1639 CrossRef PubMed.
- S. Papadimitriou, D. Bikiaris, K. Avgoustakis, E. Karavas and M. Georgarakis, Carbohydr. Polym., 2008, 73, 44–54 CrossRef.
- Q. Gan and T. Wang, Colloids Surf., B, 2007, 59, 24–34 CrossRef PubMed.
- P. Calvo, C. Remuñán-López, J. L. Vila-Jato and M. J. Alonso, J. Appl. Polym. Sci., 1997, 63, 125–132 CrossRef.
- T. Oosegi, H. Onishi and Y. Machida, Eur. J. Pharm. Biopharm., 2008, 68, 260–266 CrossRef PubMed.
- W. Fan, W. Yan, Z. Xu and H. Ni, Colloids Surf., B, 2012, 90, 21–27 CrossRef PubMed.
- R. Raj, P. M. Raj and A. Ram, RSC Adv., 2016, 6, 53578–53586 RSC.
- A. R. Dudhani and S. L. Kosaraju, Carbohydr. Polym., 2010, 81, 243–251 CrossRef.
- Y. Yin, D. Chen, M. Qiao, Z. Lu and H. Hu, J. Controlled Release, 2006, 116, 337–345 CrossRef PubMed.
- N. Bashardoust, J. L. Jenita and P. Zakeri-Milani, Adv. Pharm. Bull., 2011, 1, 87–92 Search PubMed.
- Y. S. Krishnaiah, A. Seetha Devi, L. Nageswara Rao, P. R. Bhaskar Reddy, R. S. Karthikeyan and V. Satyanarayana, J. Pharm. Pharm. Sci., 2001, 4, 235–243 Search PubMed.
- R. Alpana, M. R. Pooja, K. Nitish and R. Rakesh, Pharm. Nanotechnol., 2016, 4, 316–328 CrossRef.
- A. Kaul, P. P. Hazari, H. Rawat, B. Singh, T. C. Kalawat, S. Sharma, A. K. Babbar and A. K. Mishra, Int. J. Infect. Dis., 2013, 17, e263–270 CrossRef PubMed.
- S. Katiyar, J. Pandit, R. S. Mondal, A. K. Mishra, K. Chuttani, M. Aqil, A. Ali and Y. Sultana, Carbohydr. Polym., 2014, 102, 117–124 CrossRef PubMed.
- V. Jain, N. K. Swarnakar, P. R. Mishra, A. Verma, A. Kaul, A. K. Mishra and N. K. Jain, Biomaterials, 2012, 33, 7206–7220 CrossRef PubMed.
Footnote |
| † Electronic supplementary information (ESI) available. See DOI: 10.1039/c8ra01898g |
| This journal is © The Royal Society of Chemistry 2018 |