
 Open Access Article
 This Open Access Article is licensed under a
 Creative Commons Attribution 3.0 Unported Licence
Epitaxial growth of ultrathin layers on the surface of sub-10 nm nanoparticles: the case of β-NaGdF4:Yb/Er@NaDyF4 nanoparticles
Yang Su†
a,
Li-Na Hao†b,
Kun Liub,
Jun Zhangc,
Liang Dong*d,
Yunjun Xue,
Yang Lu *a and
Hai-Sheng Qian*b
*a and
Hai-Sheng Qian*b
aDepartment of Chemistry, Hefei University of Technology, Hefei 230009, P. R. China. E-mail: yanglu@hfut.edu.cn
bDepartment of Medical Materials and Rehabilitation Engineering, School of Medical Engineering, Hefei University of Technology, Hefei 230009, P. R. China. E-mail: shqian@hfut.edu.cn; Tel: +86 551 62901285
cAnalytical and Testing Center, Hefei University of Technology, Hefei 230009, P. R. China
dHefei National Laboratory for Physical Sciences at the Microscale, University of Science and Technology of China, Hefei 230026, P. R. China. E-mail: dldisc@ustc.edu.cn
eDepartment of Radiology, Anhui Provincial Hospital, Hefei 230001, P. R. China
First published on 6th April 2018
Abstract
Upconversion core–shell nanoparticles have attracted a large amount of attention due to their multifunctionality and specific applications. In this work, based on a NaGdF4 sub-10 nm ultrasmall nanocore, a series of core–shell upconversion nanoparticles with uniform size doped with Yb3+, Er3+ and NaDyF4 shells with different thicknesses were synthesized by a facile sequential growth process. NaDyF4 coated upconversion luminescent nanoparticles showed an obvious fluorescence quenching under excitation at 980 nm as a result of energy resonance transfer between Yb3+, Er3+ and Dy3+. NaGdF4:Yb,Er@NaDyF4 core–shell nanoparticles with ultrathin layer shells exhibited a better T1-weighted MR contrast.
Introduction
In recent years, core–shell nanoparticles with controllable sizes and shapes have attracted a great deal of interest because of their diverse applicability.1–4 Lanthanide-doped upconversion nanoparticles (UCNPs) have been studied widely due to their broad applications in energy and biological areas, such as biomedical imaging, solar energy conversion and photocatalysis.5–13 There are known methods for synthesizing core–shell nanoparticles with well-controlled sizes, shapes and nanostructures, which lead to enhanced performance.14–17 Most of these upconversion nanocrystals have been fabricated by a seed-mediated growth process, which is more complex and time-wasting. Moreover, various organic solvents were necessary. Recent reports indicate that the core–shell nanoparticles synthesized by the seed-mediated heat-up method were less likely to form a uniform shell, and the nanosized cores were only partially covered by a shell.18,19 Recently, with a high-boiling-point oleic complex serving as a shell precursor, a successive one-pot layer-by-layer (SLBL) technique has been developed to fabricate high-quality monodispersed core–shell NaGdF4:Yb,Er@NaYF4 upconversion nanoparticles.20 However, the synthesis of uniform ultrathin layers on the surface of sub-10 nm nanoparticles is still a challenge.The fluorescence intensity of the core–shell structured upconversion nanoparticles was much stronger than the single core, because the shell can make up for the surface defect of the core.21–23 As an example, NaYF4:Yb,Tm@NaYF4:Yb,Er nanocrystals exhibited a remarkable enhancement in fluorescence intensity.24 With the introduction of an inert shell, ultrasmall LaF3:Yb3+/Ln3+ (Ln = Er, Tm, and Ho)@LaF3 core–shell nanoparticles exhibited a maximum 9 times enhancement of upconversion intensity compared with single nanocores.16 In general, lanthanide-doped upconversion nanoparticles NaGdF4:Yb,Er can emit visible light based on energy transfer under the excitation of a laser.25 As the main sensitizer, Yb3+ was excited by 980 nm photons and jumped from the ground state to the excited state (2F5/2), then jumped back to the ground state. The transition energy was then transferred to Er3+, which was excited from the ground level to an excited one. Subsequently, green emission at 522 nm and 547 nm ensues due to electrons in the excited state relaxing nonradiatively to lower-energy states (2H11/2 → 4I15/2 and 4S3/2 → 4I15/2).26 The core–shell structure of NaGdF4:Yb,Er@NaGdF4 nanoparticles showed a significant fluorescence enhancement.27 Nevertheless, NaDyF4 coated NaGdF4:Yb,Er nanoparticles presented an opposite result because Dy3+ is known as a quencher of the upconversion luminescence of Er3+.28 But there has been very little exploration into the Dy3+ quenching mechanism.
Magnetic resonance (MR) imaging is a useful invasive diagnostic technique used in clinical medicine. In order to enhance the contrast of the pathological region and diagnostic sensitivity, contrast agents (CAs) are frequently employed in MR diagnosis, and there are two kinds of MR contrast agents: positive (T1) CAs and negative (T2) CAs.29–34 The longitudinal relaxation time of the surrounding water protons could be effectively shortened by T1-weighted CAs (mostly paramagnetic Gd3+ chelates, such as Gd-DTPA), resulting in a brighter signal. The transverse relaxation time could be decreased by T2-weighted CAs (mostly superparamagnetic iron oxide (SPIO) nanoparticles), leading to a darker signal. In the clinic, most commercial contrast agents are gadolinium based contrast agents (GBCAs), because the brightened signals produced by GBCAs in the T1-weighted images of lesions are easily identified by clinicians. Due to the poor physiological stability of linear GBCAs,35,36 and their relative side-effects such as nephrogenic systemic fibrosis (NSF) in kidney patients,37,38 more efforts have been recently suggested for the development of GBCAs with a higher relaxivity and better thermodynamic stability. Very recently, ultrasmall sized NaGdF4 nanocrystals have exhibited great promise to serve as stable T1w MR contrast agents with a high T1w relaxivity and negligible leakage of free gadolinium ions.39–42 When the ultrasmall sized NaGdF4 nanocrystals serve as a core to fabricate core–shell structured nanocomposites, it’s reasonable that the T1w MR contrast performance should be affected due to the change in surface properties and less interaction with the surrounding protons. However, this remains unexplored.
Herein, a facile sequential growth process has been used to synthesize NaGdF4:Yb,Er@NaDyF4 core–shell nanoparticles with different shell thicknesses. NaGdF4:Yb,Er@NaDyF4-1 with ultrathin shells exhibited a higher longitudinal relaxivity (r1) than NaGdF4:Yb,Er@NaDyF4-2, which is a promising T1 magnetic resonance imaging agent. In addition, the cause of the decrease in upconversion fluorescence intensity of the NaDyF4 coated NaGdF4:Yb,Er was illustrated, which provides guidance for subsequent research into upconversion luminescent materials with core–shell structures.
Experimental section
Reagents and materials
DyCl3·6H2O(99.99), GdCl3·6H2O (99.99%), YbCl3·6H2O (99.99%) and ErCl3·6H2O (99.99%), sodium hydroxide (NaOH), ammonium fluoride (NH4F), oleic acid (OA, 90%) and 1-octadecene (ODE, 90%) were purchased from Aladdin Chemical Reagent Corporation (Shanghai, China). Organic reagents including methanol, cyclohexane and ethanol were purchased from Sinopharm Chemical Reagent Corporation (Shanghai, China). HepG2 cells were purchased from the Shanghai Institute of Cell Bank.Synthesis of Gd/Yb/Er-oleic and Dy-oleic complexes
195 mmol GdCl3, 0.05 mmol YbCl3, 0.005 mmol ErCl3 and 3 mL of OA were added into a 50 mL three-neck flask then heated to 100 °C and kept at this temperature for 20 minutes to remove the water during crystallization. The mixture was continuously stirred and heated for 20 minutes to form a clear solution (Gd/Yb/Er-OA complex). The Dy-oleic complex was prepared by a similar process using DyCl3 (0.125 mmol) and OA (3 mL). The Gd/Yb/Er-oleic and Dy-oleic complex solutions were stable, and were used as precursors of further reactions.Synthesis of NaGdF4:Yb,Er@NaDyF4 core–shell nanoparticles with various shell thicknesses
In a typical experiment, NaGdF4:Yb,Er@NaDyF4 core–shell nanoparticles were synthesized on the basis of a reported method with some changes.43 6 mL OA and 15 mL ODE were added into a three-neck reaction flask, and a clear methanol solution (10 mL) containing 1.5 mmol of NaOH and 2 mmol of NH4F were added into the flask with vigorous stirring. Then the solution was slowly heated to 100 °C to remove methanol and water. After the water and oxygen was removed under vacuum with continuous stirring, the solution was heated to 280 °C slowly under an argon atmosphere. Then the Gd/Yb/Er-OA complex (0.25 mmol) precursor solution was injected into the reaction system quickly at 280 °C and maintained at this temperature for 60 min. The reaction solution was allowed to cool to room temperature then 0.125 mmol of the Dy-OA complex was injected rapidly into the reaction mixture at room temperature and the solution was heated to 280 °C for another 60 min to obtain the NaGdF4:Yb,Er@NaDyF4-1 with ultrathin shells. Finally, the solution was cooled down to room temperature naturally and the resulting nanoparticles were precipitated by the addition of ethanol, collected by centrifugation and then redispersed in cyclohexane.NaGdF4:Yb,Er@NaDyF4-2 nanoparticles with different shell thicknesses were synthesized using the same process as for the abovementioned nanoparticles, except for one thing: after the first Dy-OA (0.125 mmol) compound was injected and incubated for 60 minutes, the reaction system was reduced to room temperature and 0.125 mmol of the Dy-OA complex was injected again, and kept at 280 °C for an additional 1 h.
Surface modification
The hydrophobic NaGdF4:Yb,Er@NaDyF4 nanoparticles covered with oleic acid were transferred to the aqueous phase using a ligand-exchange method.23 NaGdF4:Yb,Er@NaDyF4 cyclohexane solution (10 mg mL−1 10 mL) was dropwise added to 10 mL of PEG-PAA in 1,4-dioxane (10 mg mL−1) and stirred for 12 hours at room temperature. Then the mixed solution was naturally cooled down to room temperature after removing the cyclohexane at 80 °C. The resulting solution was collected by centrifugation and washed with water three times. The final hydrophilic nanoparticles were dispersed in water for further use.MR measurement
Various concentrations of the PEG–PAA modified NaGdF4:Yb,Er@NaDyF4 and NaGdF4:Yb,Er@NaDyF4@NaDyF4 nanoparticles dispersed in deionized water were prepared, and their T1 weighted MR images were acquired on a Siemens 3.0 Tesla MR scanner using the inversion recovery (IR) sequence. The imaging parameters were as follows: repetition time (TR) = 4000 ms, echo time (TE) = 10.88 ms, and a series of inversion times (TI) between 50 and 3500 ms were employed. The field of view (FOV) = 220 × 220 mm2. Then the T1 values of each sample at different concentrations were calculated on a workstation to obtain the relaxivity.Characterization
Transmission electron microscopy (TEM) analysis was carried out on a JEM-2100F (JEOL, Japan) transmission electron microscope. The phase of the as-prepared product was characterized by X-ray powder diffraction (XRD) analysis, which was performed on a Philips X’Pert PRO SUPER X-ray diffractometer equipped with graphite monochromated Cu Kα radiation, and the operation voltage and current were maintained at 40 kV and 40 mA, respectively. The upconversion fluorescence spectra were measured on an F-2700 fluorescence spectrometer (Hitachi High-Technology Corporation), where an external CW laser at 980 nm replaced the xenon lamp as the excitation source. Inductively coupled plasma atomic emission spectroscopy (ICP-AES) was employed to determine the concentration of Gd3+ in the solutions. FT-IR spectra were measured on a Bruker Vector-22 FT-IR spectrometer. The relaxivity measurements were carried out on a clinical MRI instrument (Siemens Trio Tim 3.0 T, Germany).Results and discussion
Fabrication and epitaxial growth of β-NaGdF4:Yb/Er@NaDyF4 nanoparticles with an ultrathin layer
The synthesis of NaGdF4:Yb/Er@NaDyF4 core–shell nanoparticles with different shell thicknesses was achieved by a sequential growth process (Fig. 1). NaGdF4:Yb,Er nanoparticles were first synthesized at 280 °C in the presence of sodium hydroxide, ammonium fluoride and Gd/Yb/Er-OA complexes. | ||
| Fig. 1 A schematic illustration of the epitaxial growth of NaGdF4:Yb/Er@NaDyF4 nanoparticles with different shell thicknesses. | ||
When the reaction system containing NaGdF4:Yb,Er nanoparticles was reduced to room temperature, the Dy-OA (0.125 mmol) complex was injected, the solution was then heated to 280 °C and kept for one hour to obtain NaGdF4:Yb/Er@NaDyF4-1. Afterwards, another 0.125 mmol Dy-OA complex was injected quickly to the reaction system to synthesize the NaGdF4:Yb,Er@NaDyF4-2. Finally, NaGdF4:Yb,Er@NaDyF4 core–shell nanoparticles with different shell thicknesses could be obtained.
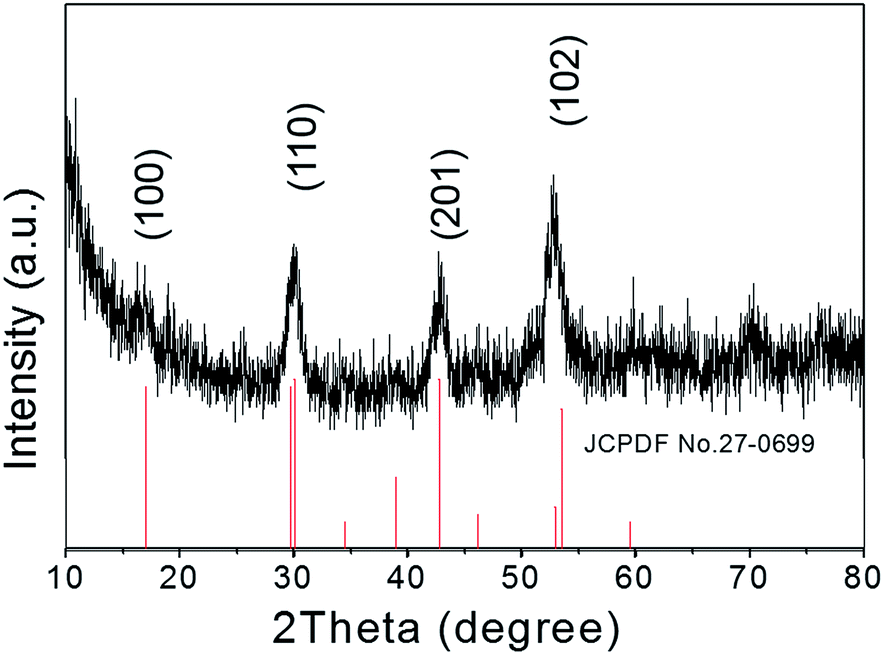
The crystallographic structures of the as-prepared NaGdF4:Yb,Er@NaDyF4 nanoparticles were studied by X-ray powder diffraction (XRD) (Fig. 2). All of the identified diffraction peaks for the core–shell nanoparticles in the XRD pattern were in accordance with the data for the reference hexagonal phase of NaGdF4 (JCPDS card no. 27-0699). No impurity crystalline phase was found in the diffraction pattern. The broadening of the diffraction peaks ascribed to OA-coated nanoparticles distinctly indicated the property of nanocrystallinity. Therefore, the XRD pattern revealed that the composition of OA-coated nanoparticles is very pure.
 | ||
| Fig. 2 X-ray diffraction patterns of NaGdF4:Yb,Er@NaDyF4 nanoparticles. | ||
Transmission electron microscopy (TEM) was used to study the structures and morphology of the as-synthesized nanoparticles (Fig. 3a–c). The NaGdF4:Yb,Er nanoparticles with a uniform size of about 9.5 nm (Fig. 3a and d) are monodispersed well. After the NaGdF4:Yb,Er cores were coated by NaDyF4 shells, the diameters of the nanoparticles were distributed mainly at about 11.5 nm. The thickness of the NaDyF4 shell was about 1 nm (Fig. 3b and e). After further growth of NaDyF4 shells on the surface of NaGdF4:Yb,Er@NaDyF4-1, the monodisperse nanoparticles exhibited an average size of 13.5 nm, indicating that NaDyF4 nanocrystals with about 2 nm shell thickness were grown on the surface of NaGdF4:Yb,Er nanocores (Fig. 3c and f).
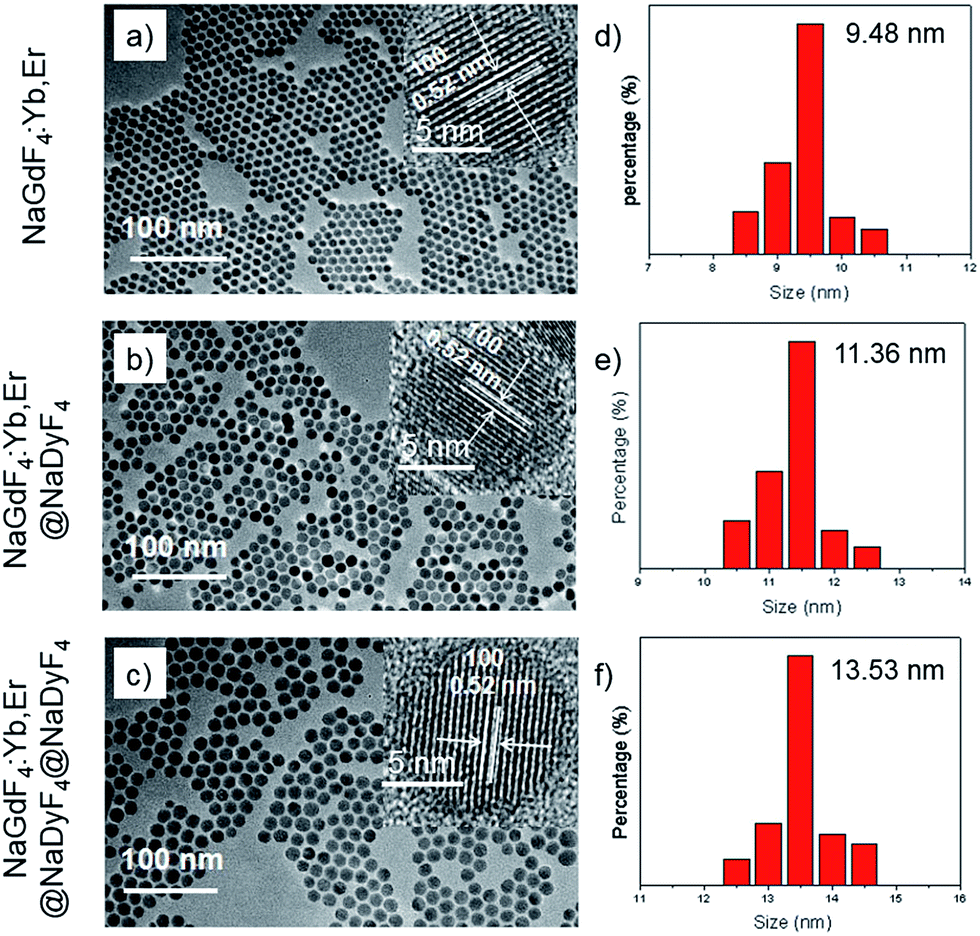 | ||
| Fig. 3 TEM images and the size distribution of (a and d) NaGdF4:Yb,Er, (b and e) NaGdF4:Yb,Er@NaDyF4-1 and (c and f) NaGdF4:Yb,Er@NaDyF4-2. The insets of (a–c) are HR-TEM images of the above three nanoparticles and the scale bars correspond to 5 nm. | ||
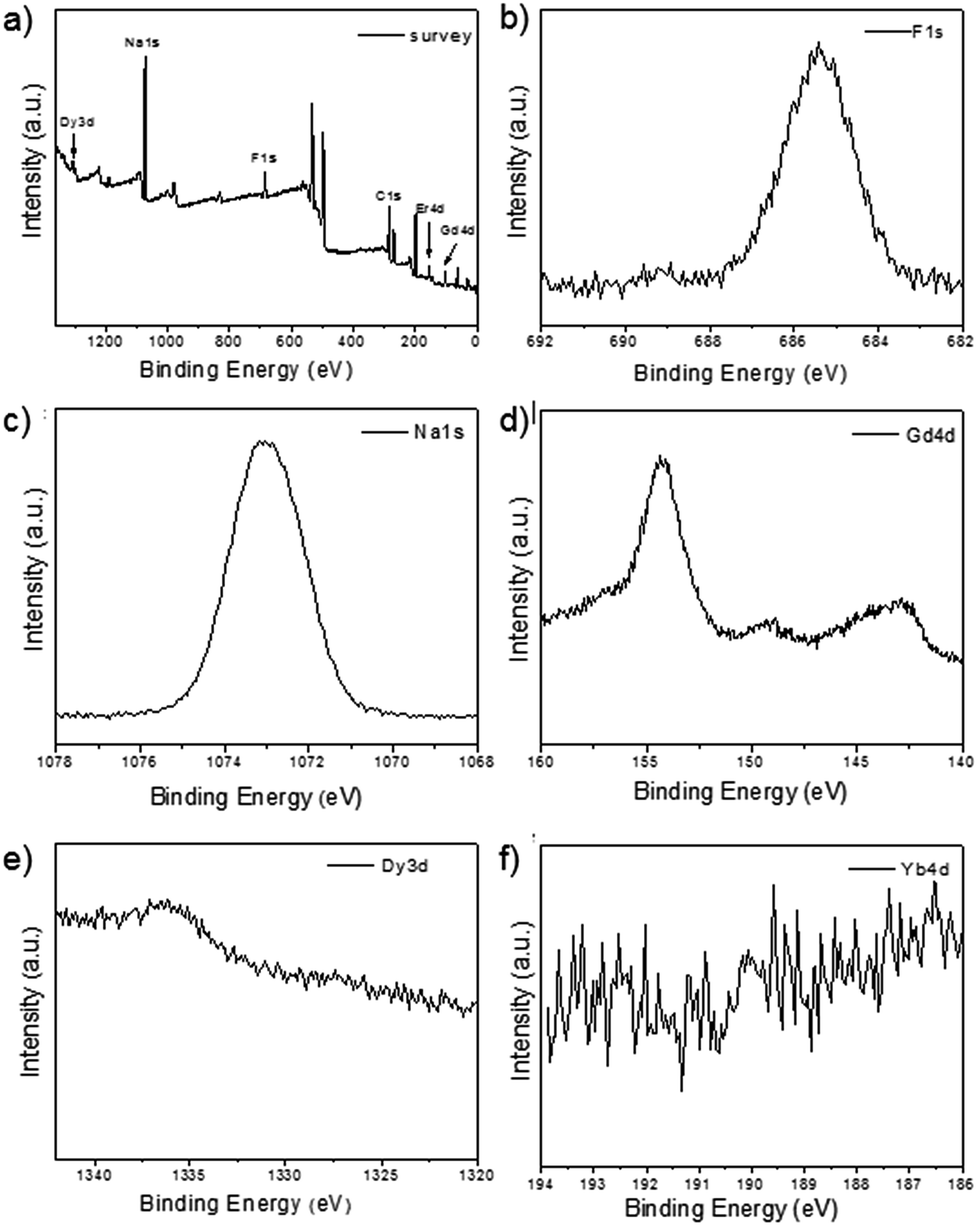
As shown in the insets of Fig. 3a–c, the high-resolution transmission electron microscopy (HR-TEM) images taken of the enlarged single nanoparticles of the above three samples proved that the nanoparticles had high crystallinity with a lattice spacing of 0.52 nm, which was consistent with the (100) plane of the NaGdF4 nanoparticles. Fig. 4a shows a scanning transmission electron microscopy image of the as-prepared NaGdF4:Yb,Er@NaDyF4 nanocrystals. The elemental mapping images for Na, F, Gd, Dy and Yb are shown in Fig. 4b–f, indicating the co-existence of these elements in the as-prepared nanoparticles of NaGdF4:Yb,Er@NaDyF4. As shown in Fig. 5, energy dispersive X-ray analysis proved the co-existence of Na, F, Gd, Dy and Yb in the as-synthesized nanoparticles, and the calculated chemical composition has been shown in Table 1. The survey scan X-ray photoelectron spectroscopy (XPS) spectrum, as shown in Fig. 6, of the core–shell nanoparticles showed photoelectron lines at binding energies of about 100 eV, 710 eV, 1080 eV, and 1300 eV, attributed to Gd 4d, F 1s, Na 1s, and Dy 3d, respectively. This is in good agreement with the results of the elemental mapping and EDX. All of these results indicated that the core–shell nanoparticles of NaGdF4:Yb,Er @NaDyF4 have been synthesized successfully.
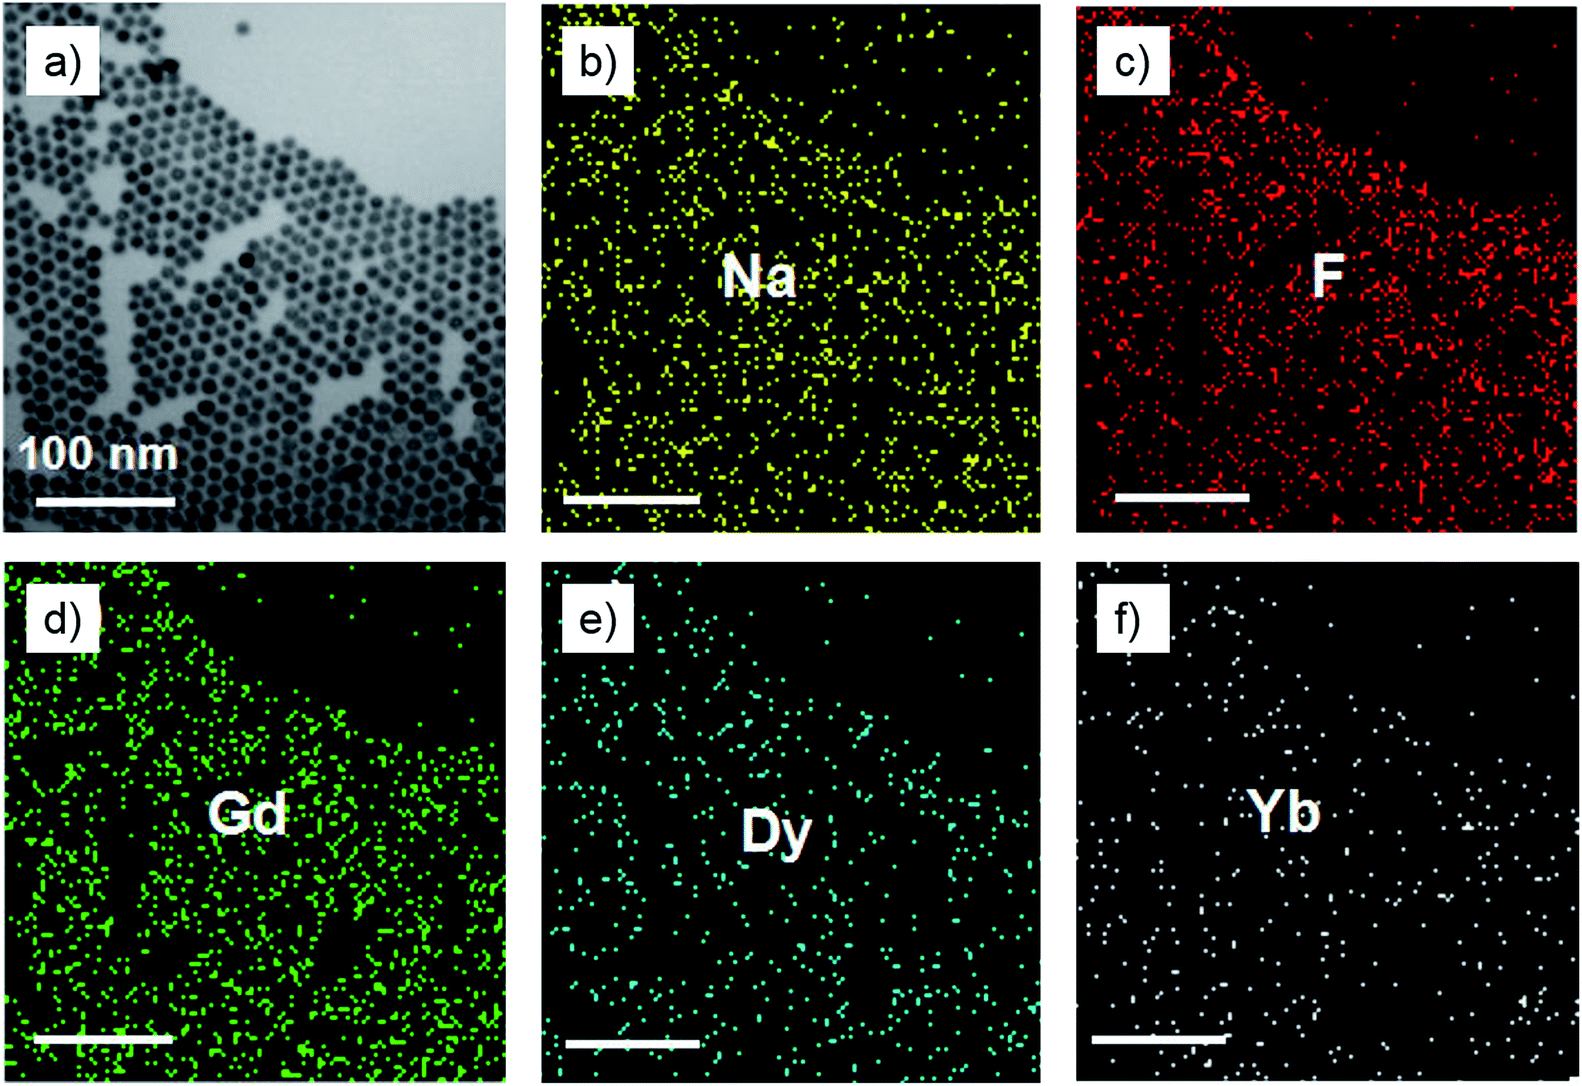 | ||
| Fig. 4 (a) A scanning transmission electron microscopy (STEM) image of the as-prepared core–shell nanoparticles of NaGdF4:Yb,Er@NaDyF4. (b–f) Elemental mapping images of Na, F, Gd, Dy and Yb for the STEM image, respectively. | ||
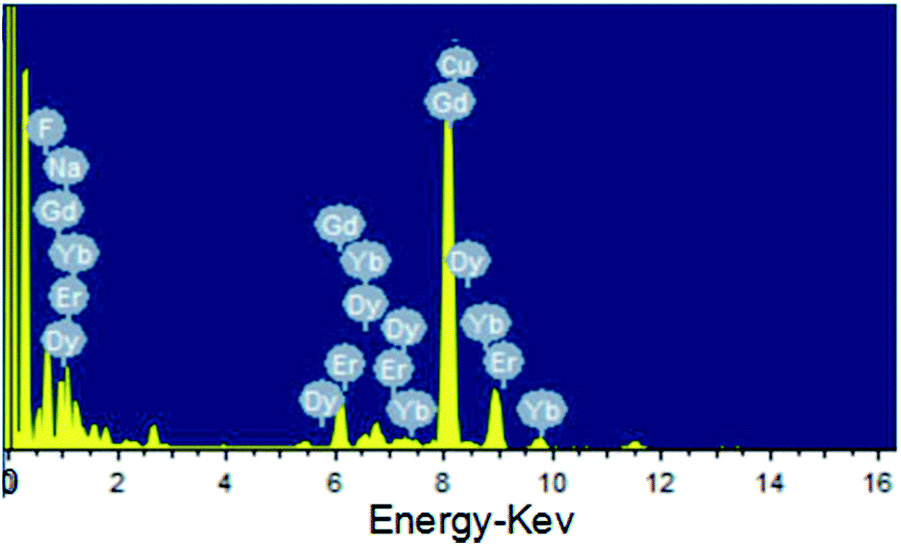 | ||
| Fig. 5 The energy dispersive X-ray analysis (EDX) of the as-prepared NaGdF4:Yb,Er@NaDyF4 nanoparticles. | ||
| Element | Weight% | Atomic% |
|---|---|---|
| F | 23.62 | 60.45 |
| Na | 9.06 | 19.17 |
| Gd | 42.15 | 13.03 |
| Dy | 15.22 | 4.55 |
| Er | 0.00 | 0.00 |
| Yb | 9.94 | 2.79 |
| Totals | 100 | |
 | ||
| Fig. 6 The X-ray photoelectron spectroscopy (XPS) analysis of NaYF4:Yb,Er@NaGdF4. (a) The survey spectrum; (b) F 1s; (c) Na 1s; (d) Gd 4d; (e) Dy 3d; (f) Yb 4d. | ||
UC fluorescence of β-NaGdF4:Yb/Er@NaDyF4 nanoparticles with an ultrathin layer
Fig. 7a shows the UC emission spectra of the different nanoparticles excited at 980 nm. The UC fluorescence peaks are located at 520, 540 and 656 nm, and were assigned to the transitions from 2H11/2, 4S3/2, and 4F9/2 to 4I15/2 of Er, respectively.44 The presence of Dy3+ in the shell has shown an obvious influence on the UC luminescence intensity, with the luminescence intensity of NaGdF4:Yb,Er-1 and NaGdF4:Yb,Er@NaDyF4-2 being much lower than that of NaGdF4:Yb,Er. In contrast, the luminescence intensity of NaGdF4:Yb,Er@NaGdF4 was investigated as well, and was much stronger than that of NaGdF4:Yb,Er@NaDyF4. The result indicated that the presence of Dy3+ in the shell induced a noticeable quenching of Er3+ luminescence.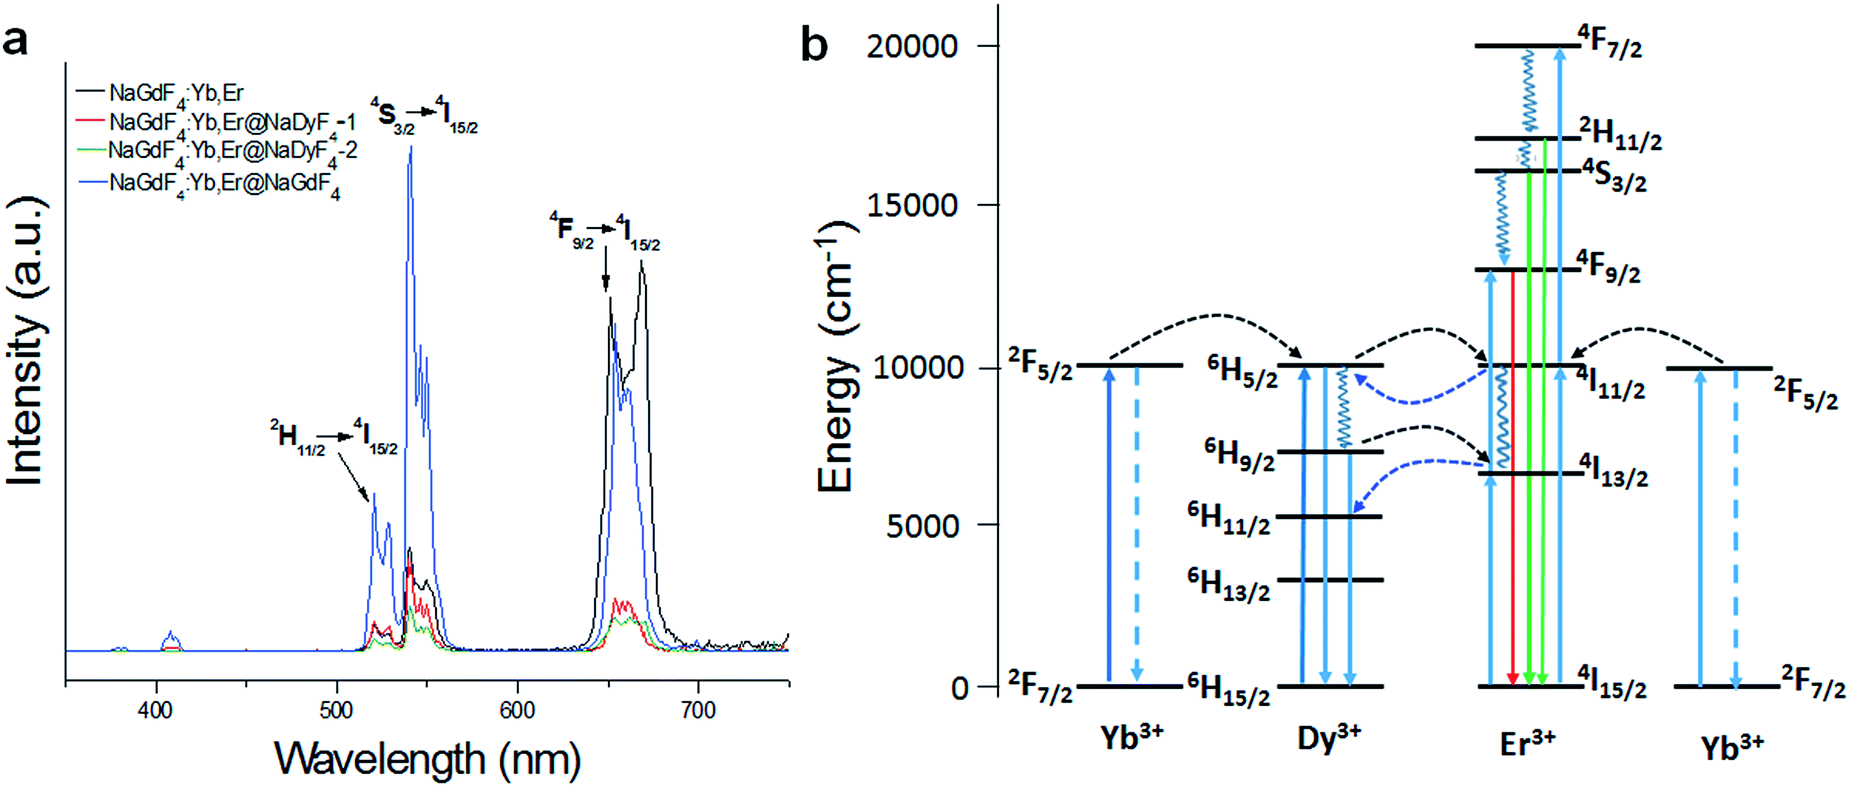 | ||
| Fig. 7 (a) The upconversion emission spectra of synthesized NaGdF4:Yb,Er, NaGdF4:Yb,Er@NaDyF4-1 and NaGdF4:Yb,Er@NaDyF4-2 nanoparticles under the excitation of 980 nm. (b) The proposed energy transfer mechanism in NaDyF4 coated nanoparticles. | ||
One explanation for the Dy3+ quenching of Er3+ luminescence is the depopulation of 4I11/2 (Er3+) and 2F5/2 (Yb3+) by Dy3+.45 The energy transfer between Dy3+, Yb3+, and Er3+ can readily occur as the result of the 6H5/2 → 6H15/2 transition of Dy3+, which is resonant with the 2F5/2 → 2F7/2 transition of Yb3+ ions and the 4I11/2 → 4I15/2 transition of Er3+ ions (Fig. 7b). Dy3+ can be excited by 980 nm photons from the 6H15/2 ground state to the 6H5/2 excited state or receive the energy from excited Yb3+ and Er3+ ions. The life time of 6H5/2 is short, and the back-energy transfer to Yb3+ is so little that it can be neglected.46,47 The excited Dy3+ can relax radiatively to the ground state, and divert some energy to Er3+ to cause Er3+ excitation from the ground state (4I15/2) to the excited state and then to the upper excitation level. Subsequently, a red emission around 660 nm takes place caused by a radiative transition from the 4F9/2 to 4I15/2 level. Resonance energy transfer has been demonstrated to study the Dy3+ quenching of Er3+ luminescence. Yb3+, as a sensitizer, is excited at 980nm from the ground state 2F7/2 to the only excitation level 2F5/2 then transmits energy to the activator Er3+. Yb3+ has a much larger absorption cross-section than Dy3+, so Yb3+ can offer more energy to Er3+ at this level. Since NaGdF4:Yb,Er@NaDyF4@NaDyF4 has a thicker NaDyF4 layer on the surface of NaGdF4:Yb,Er, the fluorescence intensity is quite weaker.
The MR contrast performance of β-NaGdF4:Yb/Er@NaDyF4 nanoparticles with an ultrathin layer
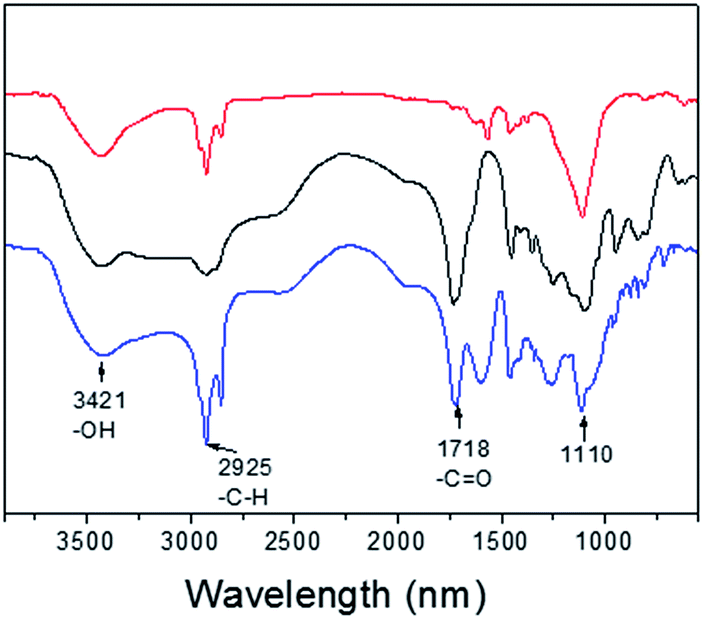
To investigate the MRI performance of the nanoparticles with different shell thicknesses, we conducted relaxivity measurements on a 3.0 T MRI clinical scanner. We measured the gadolinium concentration of PEG-PAA modified NaGdF4:Yb,Er@NaDyF4 and NaGdF4:Yb,Er@NaDyF4@NaDyF4 by inductively coupled plasma-atomic emission spectrometry (ICP-AES). FT-IR has been performed to prove that hydrophobic upconversion core–shell nanoparticles were successfully modified by PEG-PAA in a ligand exchange way. As shown in Fig. 8, two stronger peaks at 1555 and 1456 cm−1 could be observed, corresponding to the asymmetric and symmetric stretching vibration of the COO− group, respectively. After being modified with PEG-PAA, there are two new bands at 1718 and 1110 cm−1, which could be attributed to the stretching vibration of C![[double bond, length as m-dash]](https://www.rsc.org/images/entities/char_e001.gif) O and C–O of PEG-PAA chains, respectively.
O and C–O of PEG-PAA chains, respectively.
 | ||
| Fig. 8 The responsive Fourier transform infrared spectra (FTIR) of UCNPs-OA (red line), PEG-PAA (black line) and PEG-PAA coated UCNPs (blue line). | ||
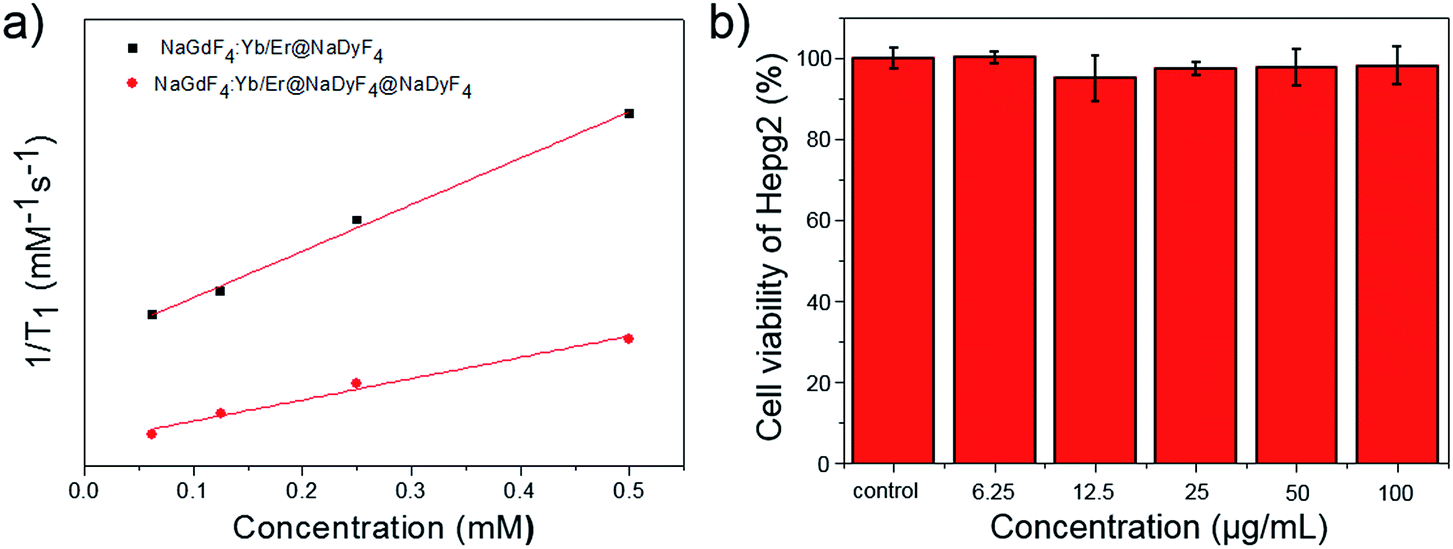
As is well known, paramagnetic Gd3+ ion based materials including Gd3+ ions and chelating ligands are T1 (positive) contrast agents. The longitudinal relaxation times (T1) of different concentrations of PEG-PAA modified nanoparticles in solution were examined by a 3.0 T clinical MR scanner using a standard inversion recovery sequence. As shown in Fig. 9a, the T1 value was significantly reduced with increasing Gd3+ concentration, indicating an obvious enhancement of T1 weighted MR contrast. The r1 of NaGdF4:Yb,Er@NaDyF4 nanoparticles with a thin layer is 1.36 mM−1 s−1, which is 2-fold higher than that of NaGdF4:Yb,Er@NaDyF4@NaDyF4 with a thicker shell (0.62 mM−1 s−1), indicating that NaGdF4:Yb,Er@NaDyF4 is a better T1 contrast agent than NaGdF4:Yb,Er@NaDyF4@NaDyF4. In addition, the cytotoxicity of the NaGdF4:Yb,Er@NaDyF4 nanoparticle was evaluated by a standard MTT method. As shown in Fig. 9b, the viability of HepG2 cells did not exhibit any reduction after exposure to NaGdF4:Yb,Er@NaDyF4 nanoparticles for 24 hours, which confirmed their promising cyto-compatibility.
 | ||
| Fig. 9 (a) A comparison of the longitudinal relaxivity of PEG-PAA modified NaGdF4:Yb,Er@NaDyF4 and NaGdF4:Yb,Er@NaDyF4@NaDyF4. (b) The cyto-compatibility result of PEG-PAA modified NaGdF4:Yb,Er@NaDyF4 on HepG2 cells. | ||
Conclusions
In conclusion, NaGdF4:Yb,Er coated with different thickness layers of NaDyF4 core–shell nanoparticles have been synthesized successfully by a facile sequential growth process with the low temperature injection of a Dy-OA complex, which had a uniform size and shape. The excitation of the synthesized nanoparticles at 980 nm showed an obvious luminescence quenching arising out of energy migration-mediated upconversion. Furthermore, ultrathin NaDyF4 shell coating remained the T1-weighted MR imaging performance of NaGdF4:Yb,Er.Conflicts of interest
There are no conflicts to declare.Acknowledgements
We acknowledge the funding support from the National Natural Science Foundation of China (Grant 21471043, 51572067, 21501039 and 51702309), the Major/Innovative Program of Development Foundation of Hefei Center for Physical Science and Technology (No. 2016FXZY005), and the Natural Science Foundation of Anhui Province of China (1708085ME114). Y. Su and L. Hao contributed equally.References
- H. C. Hu, J. J. Liu, J. Q. Yu, X. C. Wang, H. W. Zheng, Y. Xu, M. Chen, J. Han, Z. Liu and Q. Zhang, Nanoscale, 2017, 9, 4826–4834 RSC
.
- X. Zhang, Y. Zhao, X. Jia, Y. Zhao, L. Shang, Q. Wang, G. I. N. Waterhouse, L. Z. Wu, C. H. Tung and T. Zhang, Adv. Energy Mater., 2018, 1702780 CrossRef
- A. M. El-Toni, M. A. Habila, J. P. Labis, Z. A. ALOthman, M. Alhoshan, A. A. Elzatahry and F. Zhang, Nanoscale, 2016, 8, 2510–2531 RSC
- R. G. Chaudhuri and S. Paria, Chem. Rev., 2012, 112, 2373–2433 CrossRef PubMed
- G. Y. Chen, H. L. Qiu, P. N. Prasad and X. Y. Chen, Chem. Rev., 2014, 114, 5161–5214 CrossRef CAS PubMed
- H. Dong, S. R. Du, X. Y. Zheng, G. M. Lyu, L. D. Sun, L. D. Li, P. Z. Zhang, C. Zhang and C. H. Yan, Chem. Rev., 2015, 115, 10725–10815 CrossRef CAS PubMed
- N. M. Idris, M. K. G. Jayakumar, A. Bansal and Y. Zhang, Chem. Soc. Rev., 2015, 44, 1449–1478 RSC
- J. J. Li, F. F. Cheng, H. P. Huang, L. L. Li and J. J. Zhu, Chem. Soc. Rev., 2015, 44, 7855–7880 RSC
- X. M. Li, F. Zhang and D. Y. Zhao, Nano Today, 2013, 8, 643–676 CrossRef CAS
- J. Zhou, Z. Liu and F. Y. Li, Chem. Soc. Rev., 2012, 41, 1323–1349 RSC
- G. Y. Chen, I. Roy, C. H. Yang and P. N. Prasad, Chem. Rev., 2016, 116, 2826–2885 CrossRef CAS PubMed
- X. Y. Huang, S. Y. Han, W. Huang and X. G. Liu, Chem. Soc. Rev., 2013, 42, 173–201 RSC
- M. H. Li, Z. J. Zheng, Y. Q. Zheng, C. Cui, C. X. Li and Z. Q. Li, ACS Appl. Mater. Interfaces, 2017, 9, 2899–2905 CAS
- M. J. Tou, Y. Y. Mei, S. Bai, Z. G. Luo, Y. Zhang and Z. Q. Li, Nanoscale, 2016, 8, 553–562 RSC
- C. Cui, M. J. Tou, M. H. Li, Z. G. Luo, L. B. Xiao, S. Bai and Z. Q. Li, Inorg. Chem., 2017, 56, 2328–2336 CrossRef CAS PubMed
- X. Y. Huang, J. Mater. Sci., 2016, 51, 3490–3499 CrossRef CAS
- X. Y. Huang, Opt. Lett., 2015, 40, 3599–3602 CrossRef CAS PubMed
- C. H. Dong, A. Korinek, B. Blasiak, B. Tomanek and F. C. J. M. van Veggel, Chem. Mater., 2012, 24, 1297–1305 CrossRef CAS
- K. A. Abel, J.-C. Boye, C. M. Andrei and F. C. J. M. van Veggel, Chem. Lett., 2011, 2, 185–189 CAS
- X. M. Li, D. K. Shen, J. P. Yang, C. Yao, R. C. Che, F. Zhang and D. Y. Zhao, Chem. Mater., 2013, 25, 106–112 CrossRef CAS
- H. S. Qian and Y. Zhang, Langmuir, 2008, 24, 12123–12125 CrossRef CAS PubMed
- B. Xu, X. Zhang, W. Huang, Y. Yang, Y. Ma, Z. Gu, T. Zhai and Y. Zhao, J. Mater. Chem. B, 2016, 4, 2776–2784 RSC
- H. Q. Wen, H. Y. Peng, K. Liu, M. H. Bian, Y. J. Xu, L. Dong, X. Yan, W. P. Xu, W. Tao, J. L. Shen, Y. Lu and H. S. Qian, ACS Appl. Mater. Interfaces, 2017, 9, 9226–9232 CAS
- E. Boros, E. M. Gale and P. Caravan, Dalton Trans., 2015, 44, 4804–4818 RSC
- F. Auzel, Chem. Rev., 2004, 104, 139–174 CrossRef CAS PubMed
- K. Z. Zheng, Z. Y. Liu, C. J. Lv and W. P. Qin, J. Mater. Chem. C, 2013, 1, 5502–5507 RSC
- G. T. Tian, W. Y. Yin, J. J. Jin, X. Zhang, G. M. Xing, S. J. Li, Z. J. Gu and Y. L. Zhao, J. Mater. Chem. B, 2014, 2, 1379–1385 RSC
- S. Biju, M. Harris and L. V. Elst, RSC Adv., 2016, 6, 61443–61448 RSC
- F. Fan, Y. Yu, F. Zhong, M. Gao, T. Sun, J. Liu, H. Zhang, H. Qian, W. Tao and X. Yang, Theranostics, 2017, 7, 1290–1302 CrossRef CAS PubMed
- B. R. Smith and S. S. Gambhir, Chem. Rev., 2017, 117, 901–986 CrossRef CAS PubMed
- K. Luo, G. Liu, W. C. She, Q. Y. Wang, G. Wang, B. He, H. Ai, Q. Gong, B. Song and Z. Gu, Biomaterials, 2011, 32, 7951–7960 CrossRef CAS PubMed
- R. R. Qiao, H. Y. Qiao, Y. Zhang, Y. B. Wang, C. W. Chi, J. Tian, L. Zhang, F. Cao and M. Gao, ACS Nano, 2017, 11, 1816–1825 CrossRef CAS PubMed
- Z. J. Zhou, C. Q. Wu, H. Y. Liu, X. L. Zhu, Z. H. Zhao, L. R. Wang, Y. Xu, H. Ai and J. Gao, ACS Nano, 2015, 9, 3012–3022 CrossRef CAS PubMed
- D. Ling, N. Lee and T. Hyeon, Acc. Chem. Res., 2015, 48, 1276–1285 CrossRef CAS PubMed
- S. Laurent, E. L. Vander, F. Copoix and R. N. Muller, Invest. Radiol., 2001, 36, 115–122 CrossRef CAS PubMed
- S. Laurent, E. L. Vander, C. Henoumont and R. N. Muller, Contrast Media Mol. Imaging, 2010, 5, 305–308 CrossRef CAS PubMed
- The ESUR Contrast Media Safety Committee (CMSC) Contrast Medium Guidelines, Version 9.0, The European Society of Urogenital Radiology, 2015 Search PubMed.
- ACR Manual on Contrast Media, Version 10.1, American College of Radiology (ACR) Committee, 2015 Search PubMed.
- H. Y. Xing, S. J. Zhang, W. B. Bu, X. P. Zheng, L. J. Wang, Q. F. Xiao, D. Ni, J. Zhang, L. Zhou, W. Peng, K. Zhao, Y. Hua and J. Shi, Adv. Mater., 2014, 26, 3867–3872 CrossRef CAS PubMed
- N. J. J. Johnson, W. Oakden, G. J. Stanisz, R. S. Prosser and F. C. J. M. van Veggel, Chem. Mater., 2011, 23, 3714–3722 CrossRef CAS
- J. Wang, H. Zhang, D. L. Ni, W. P. Fan, J. X. Qu, Y. Y. Liu, Y. Jin, Z. Cui, T. Xu, Y. Wu, W. Bu and Z. Yao, Small, 2016, 12, 3591–3600 CrossRef CAS PubMed
- D. L. Ni, Z. W. Shen, J. W. Zhang, C. Zhang, R. H. Wu, J. A. Liu, M. Yi, J. Wang, Z. Yao, W. Bu and J. Shi, ACS Nano, 2016, 10, 3783–3790 CrossRef CAS PubMed
- B. B. Ding, K. Liu, F. Zhang, Y. Wang, S. Cheng, Y. Lu and H. S. Qian, CrystEngComm, 2015, 17, 5900–5905 RSC
- Z. Q. Li, Y. Zhang and S. Jiang, Adv. Mater., 2008, 20, 4765–4769 CrossRef CAS
- Y. Zhang, G. K. Das, V. Vijayaragavan and Q. C. Xu, Nanoscale, 2014, 6, 12609–12617 RSC
- Y. Seki and Y. Furukawa, Jpn. J. Appl. Phys., 1971, 10, 891–897 CrossRef CAS
- V. Mahalingam, R. Naccache, F. Vetrone and J. A. Capobianco, Chem. Commun., 2011, 47, 3481–3483 RSC
Footnote |
| † These authors contributed equally to this work. |
| This journal is © The Royal Society of Chemistry 2018 |